Downloaded 18 times


![12
Introduction
With the advent of the Dynamic Management Objects (DMOs) in SQL Server 2005,
Microsoft vastly expanded the range and depth of metadata that could be exposed
regarding the connections, sessions, transactions, statements, and processes that are, or
have been, executing against a database instance. These DMOs provide insight into the
resultant workload generated on the server, how it is distributed, where the pressure
points are, and so on, and are a significant and valuable addition to the DBA's
troubleshooting armory.
In order to see a full list of the individual DMOs, from within SSMS, we can run a query
against the sys.objects system catalog view.
SELECT [name] ,
CASE [type]
WHEN 'V' THEN 'DMV'
WHEN 'IF' THEN 'DMF'
END AS [DMO Type]
FROM [sys].[sysobjects]
WHERE [name] LIKE 'dm_%'
ORDER BY [name] ;
In SQL Server 2005, this returns 89 DMOs and, in SQL Server 2008, 136. Alternatively,
we can view the all of the system catalog views, system compatibility views, INFORMA-TION
_ SCHEMA views, and DMOs through the SSMS object explorer. Navigate to Data-bases
| System Databases | master | Views | System Views to see the Dynamic Management
Views (DMVs), or …| master | Programmability | Functions | System Functions | Table-valued
Functions to see the Dynamic Management Functions (DMFs). In each case, the
relevant objects will be prefixed with sys.dm _ .
In short, if you look hard enough, you will find an almost overwhelming amount of
data regarding user activity on your SQL Server instances, and the CPU, I/O, and memory
use and abuse that results. The focus of this book is squarely on core engine activity, and](https://image.slidesharecdn.com/ebookperformancetuningdavidsonford-141014034404-conversion-gate02/75/c-12-2048.jpg)
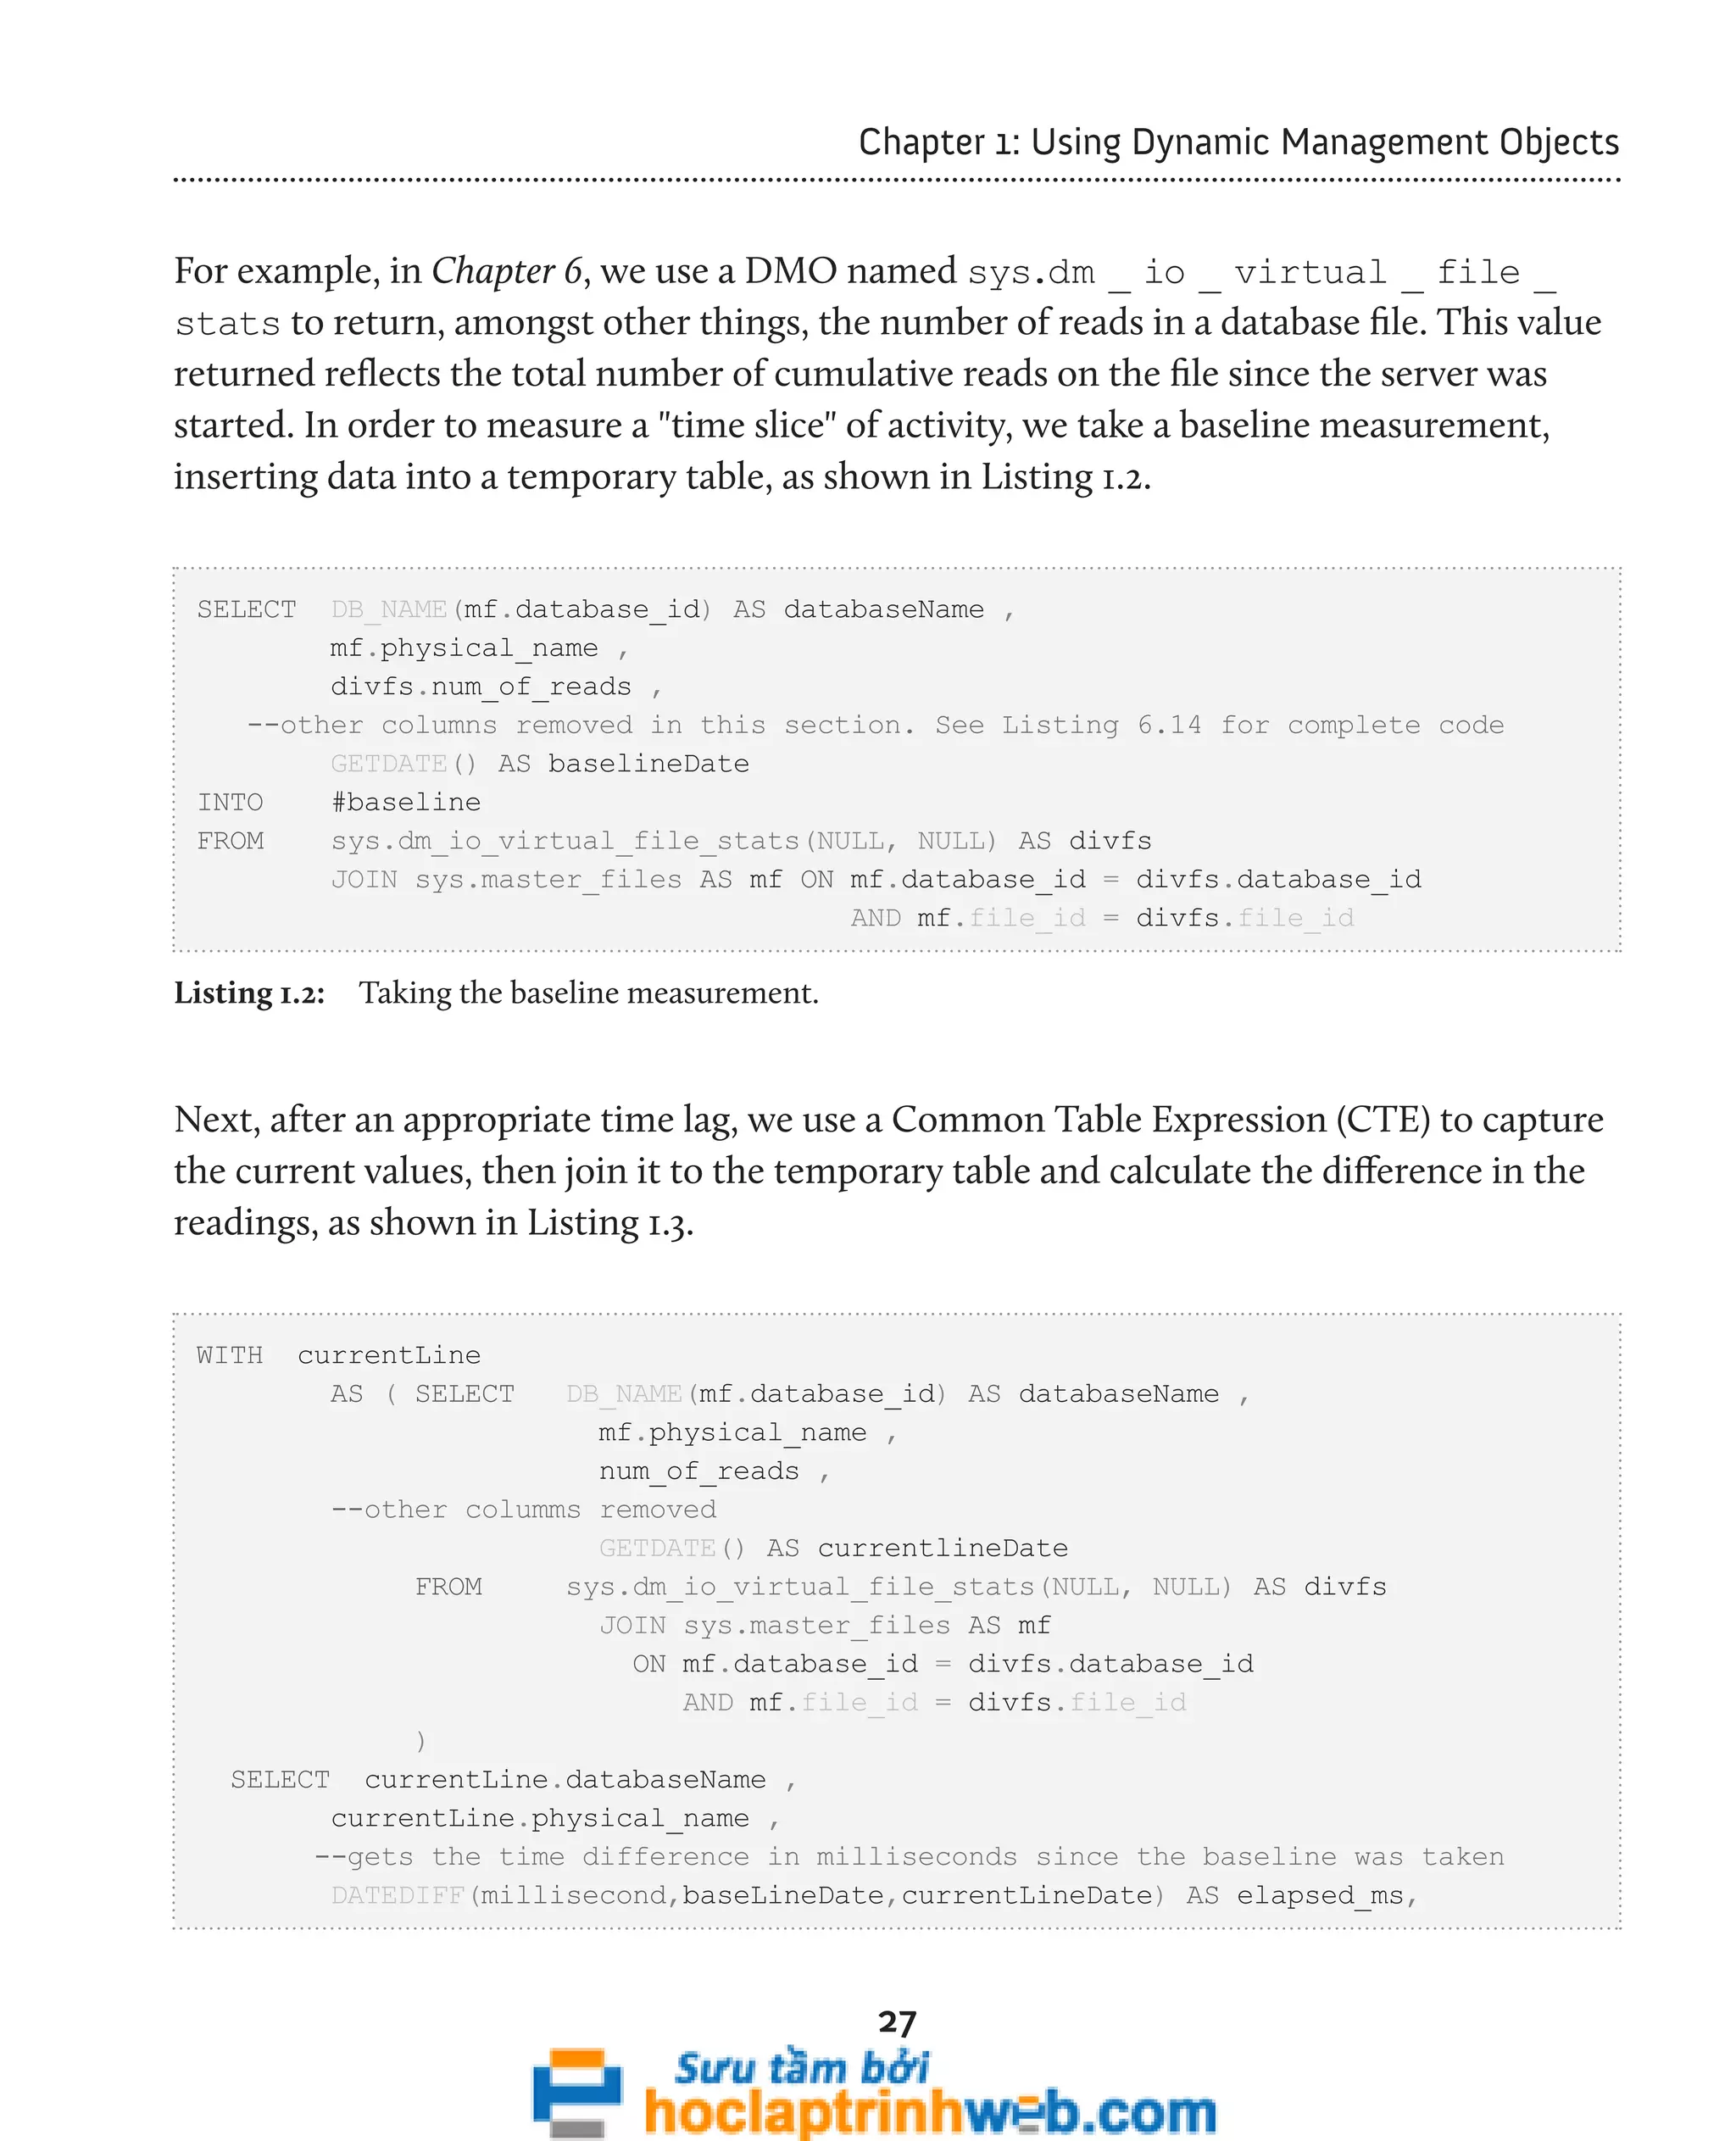
![Chapter 1: Using Dynamic Management Objects
Performance Tuning with DMOs
In simplistic terms, performance problems are caused by excessive demands on some
shared resource of the SQL Server system, leading to bottlenecks and poor response
times. The biggest problem for most DBAs is in pinpointing the exact cause of the
problem. There are many "shared resources" in SQL Server, from CPU to memory (such
as buffer cache or plan cache), to the disk subsystem, to process schedulers and so on.
Furthermore, a single piece of performance data, considered in isolation, can often lead
the unwary DBA to misdiagnose a performance problem.
Too often, slow query performance is diagnosed as a need for more CPU, or faster disks,
without knowledge of the exact cause of the slow performance. If, on your SQL Server
instance, 90% of the total response time consists of I/O waits and only 10% of the time is
spent on the CPU, then adding CPU capacity or upgrading to faster CPUs won't have the
desired impact.
The really big win with the DMOs is that they allow us to narrow the focus of tuning
and troubleshooting quickly, and adopt a more systematic approach to performance
troubleshooting. Wait statistics are a prime example. Each time a worker needs to wait
for a resource, it is recorded in SQL Server. This information is cached and incremented
until the next SQL Server service restart. We can query and aggregate these metrics via
sys.dm _ os _ wait _ stats, as shown in Listing 1.1.
22
SELECT wait_type ,
SUM(wait_time_ms / 1000) AS [wait_time_s]
FROM sys.dm_os_wait_stats DOWS
WHERE wait_type NOT IN ( 'SLEEP_TASK', 'BROKER_TASK_STOP',
'SQLTRACE_BUFFER_FLUSH', 'CLR_AUTO_EVENT',
'CLR_MANUAL_EVENT', 'LAZYWRITER_SLEEP' )
GROUP BY wait_type
ORDER BY SUM(wait_time_ms) DESC
Listing 1.1: Performance troubleshooting based on wait times.](https://image.slidesharecdn.com/ebookperformancetuningdavidsonford-141014034404-conversion-gate02/75/c-22-2048.jpg)
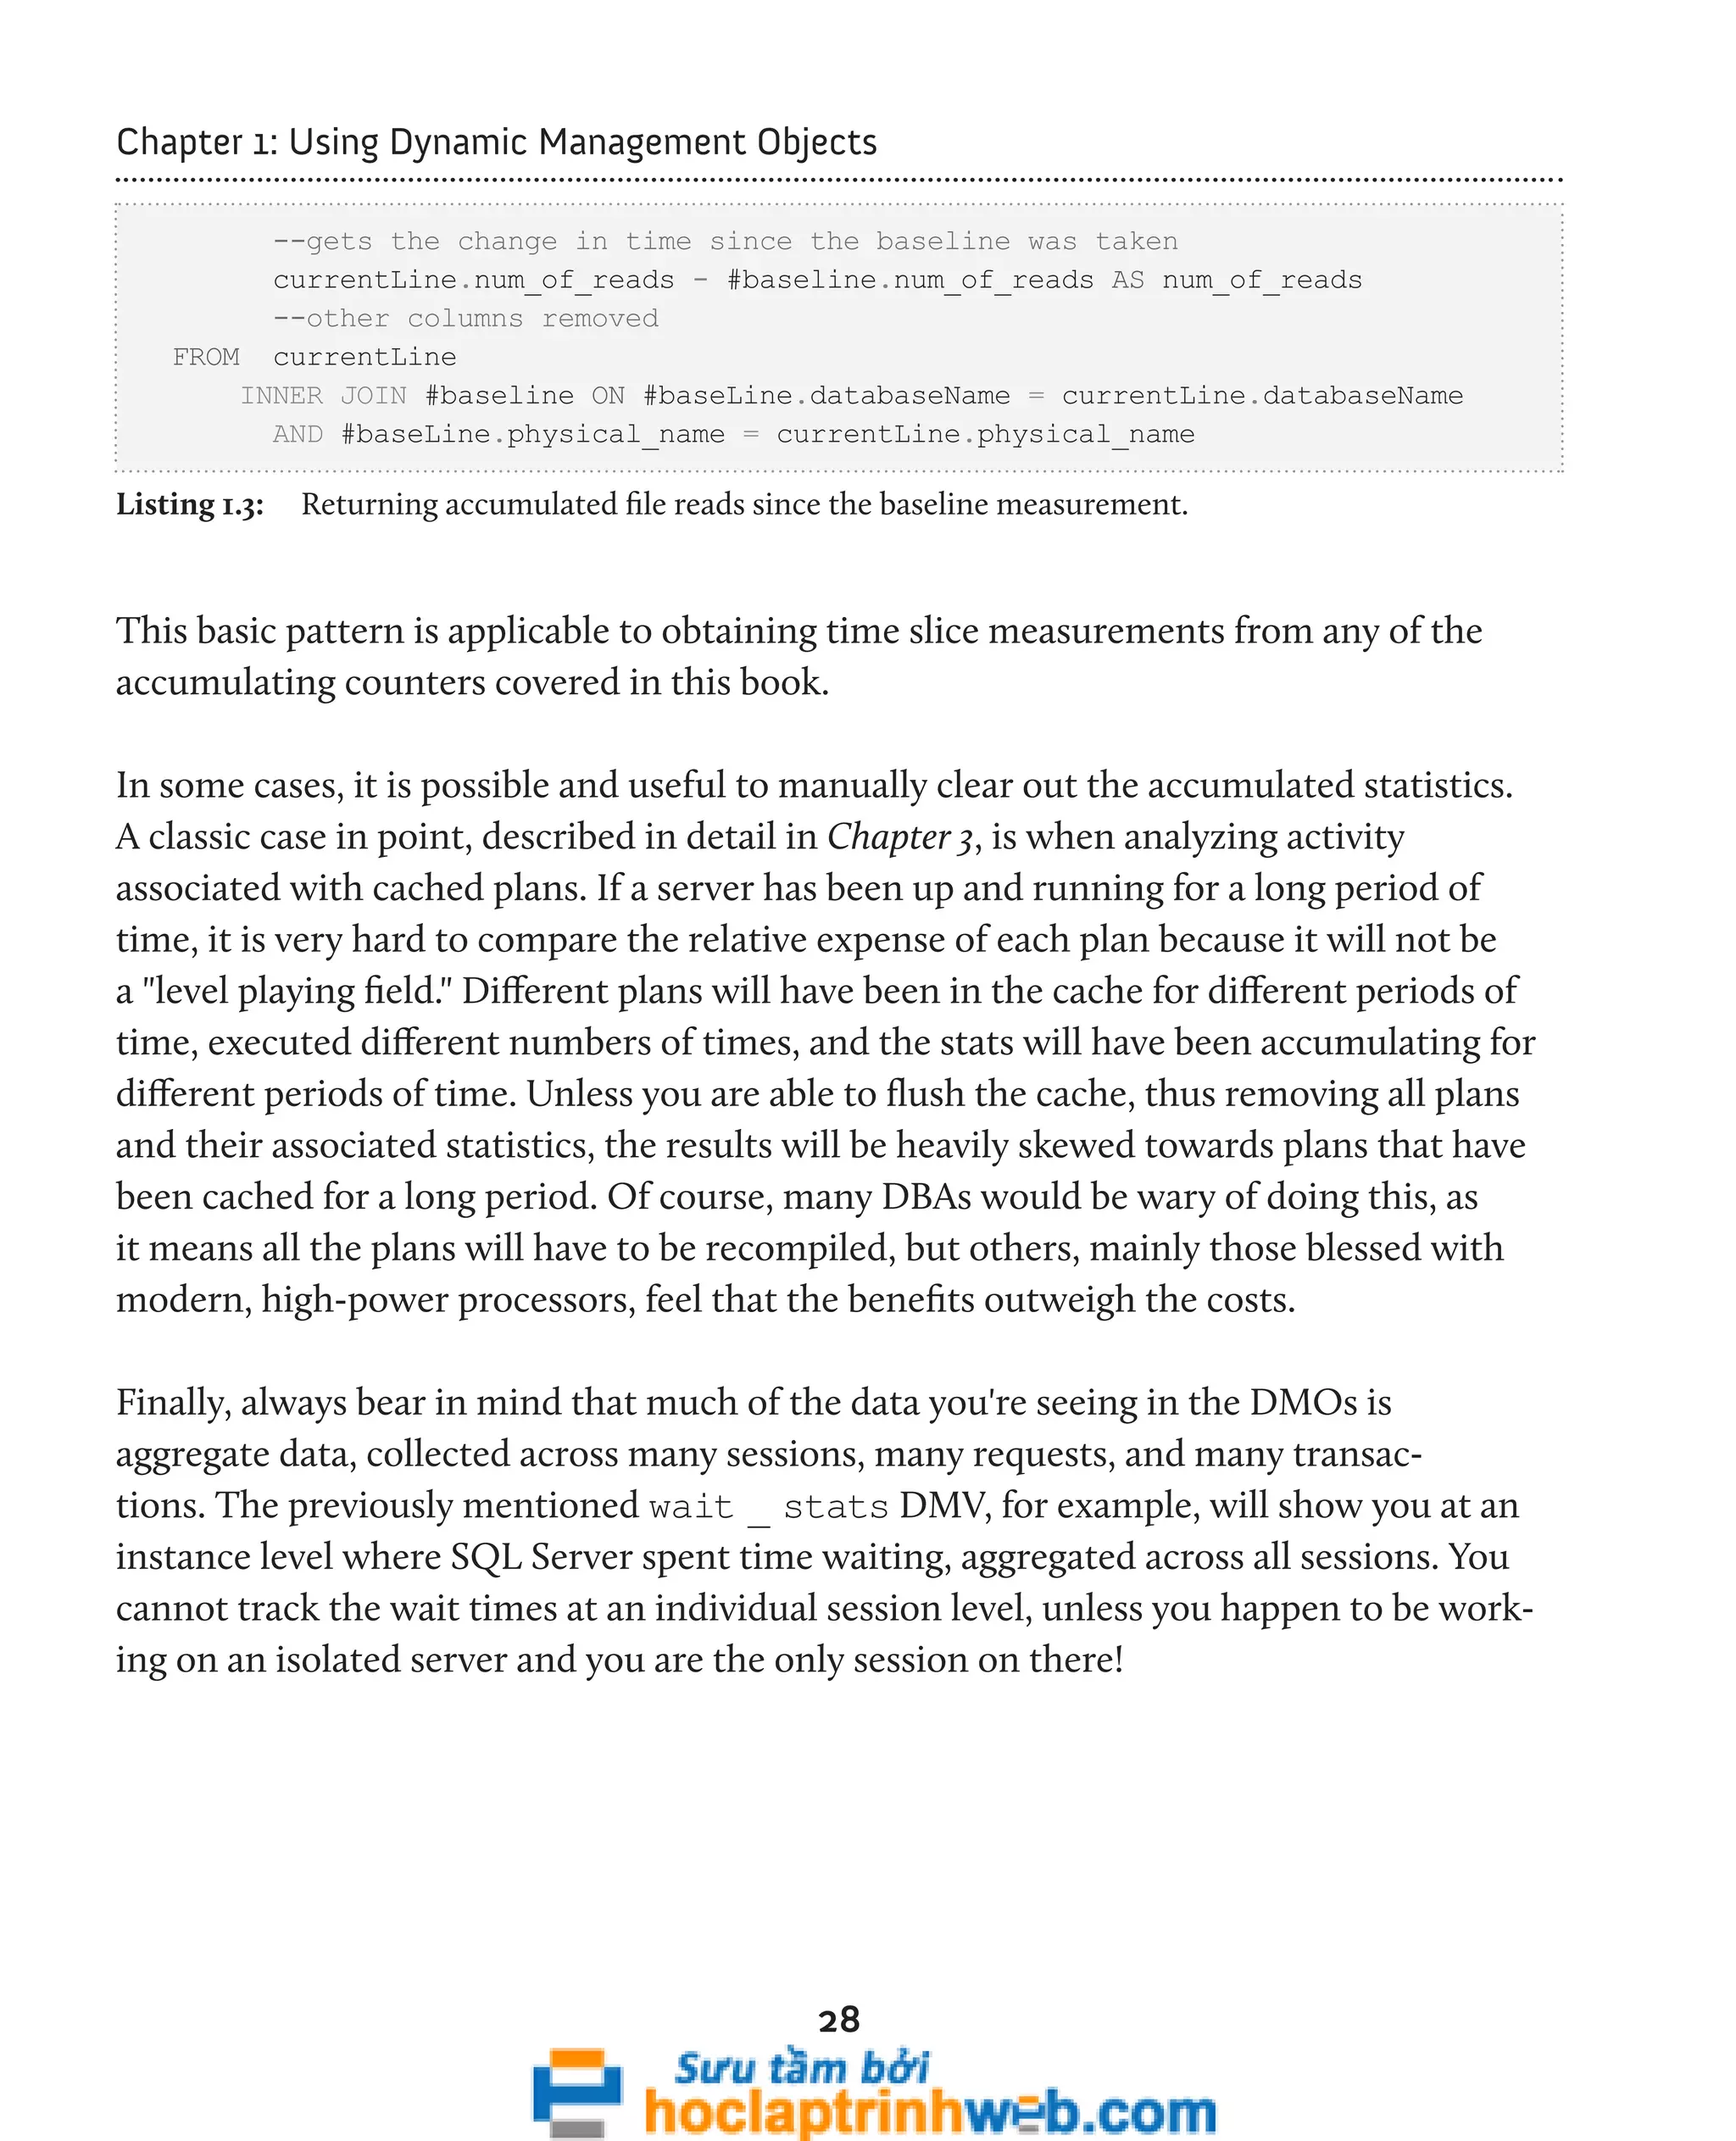
![Chapter 1: Using Dynamic Management Objects
Point-in-time versus cumulative data
We can query data held on the DMOs just as we would any other table, view, or function.
However, always remember that the data returned is "dynamic" in nature. It is collected
from a range of different structures in the database engine and represents, in the main, a
point-in-time "snapshot" of the activity that was occurring on the server at the time the
DMO query was executed.
Sometimes, this is exactly what is required; we have a performance issue right now, and
want to find out what sessions and queries are running, right now, on the server that
could be causing it. Bear in mind, though, that this point-in-time data can, and likely
will, change each time you query it, as the state of the server changes. You should expect
to occasionally see anomalous or non-representative results, and you may need to run a
script many times to get a true picture of activity on your instance.
Also, it is quite difficult to query the data in these point-in-time DMOs in the hope
that the problem will simply "jump out at you." If, for example, you have a performance
problem and you want to check for any "unusual" locking patterns, then it's unlikely
that a "select [columns] from [locking DMV]" will tell you much, unless you're already
very familiar with what "normal" locking looks like on your system, and you can therefore
easily spot anomalies.
In other cases, the DMOs are cumulative. In other words, the data in a given column is
cumulative and incremented whenever a certain event occurs. For example, every time
a session waits a period of time for a resource to become available, this is recorded in a
column of the sys.dm _ os _ wait _ stats DMV. When querying such a DMV, you
will be seeing, for instance, the total amount of time spent waiting for various resources,
across all sessions, since SQL Server was started or restarted. While this will give you a
broad overview of where time has been spent waiting, over a long period, it will make it
hard to see the smaller details. If you want to measure the impact of a certain change to
the database (a new index for example), you'll need to take a baseline measurement, make
the change, and then measure the difference.
26](https://image.slidesharecdn.com/ebookperformancetuningdavidsonford-141014034404-conversion-gate02/75/c-26-2048.jpg)
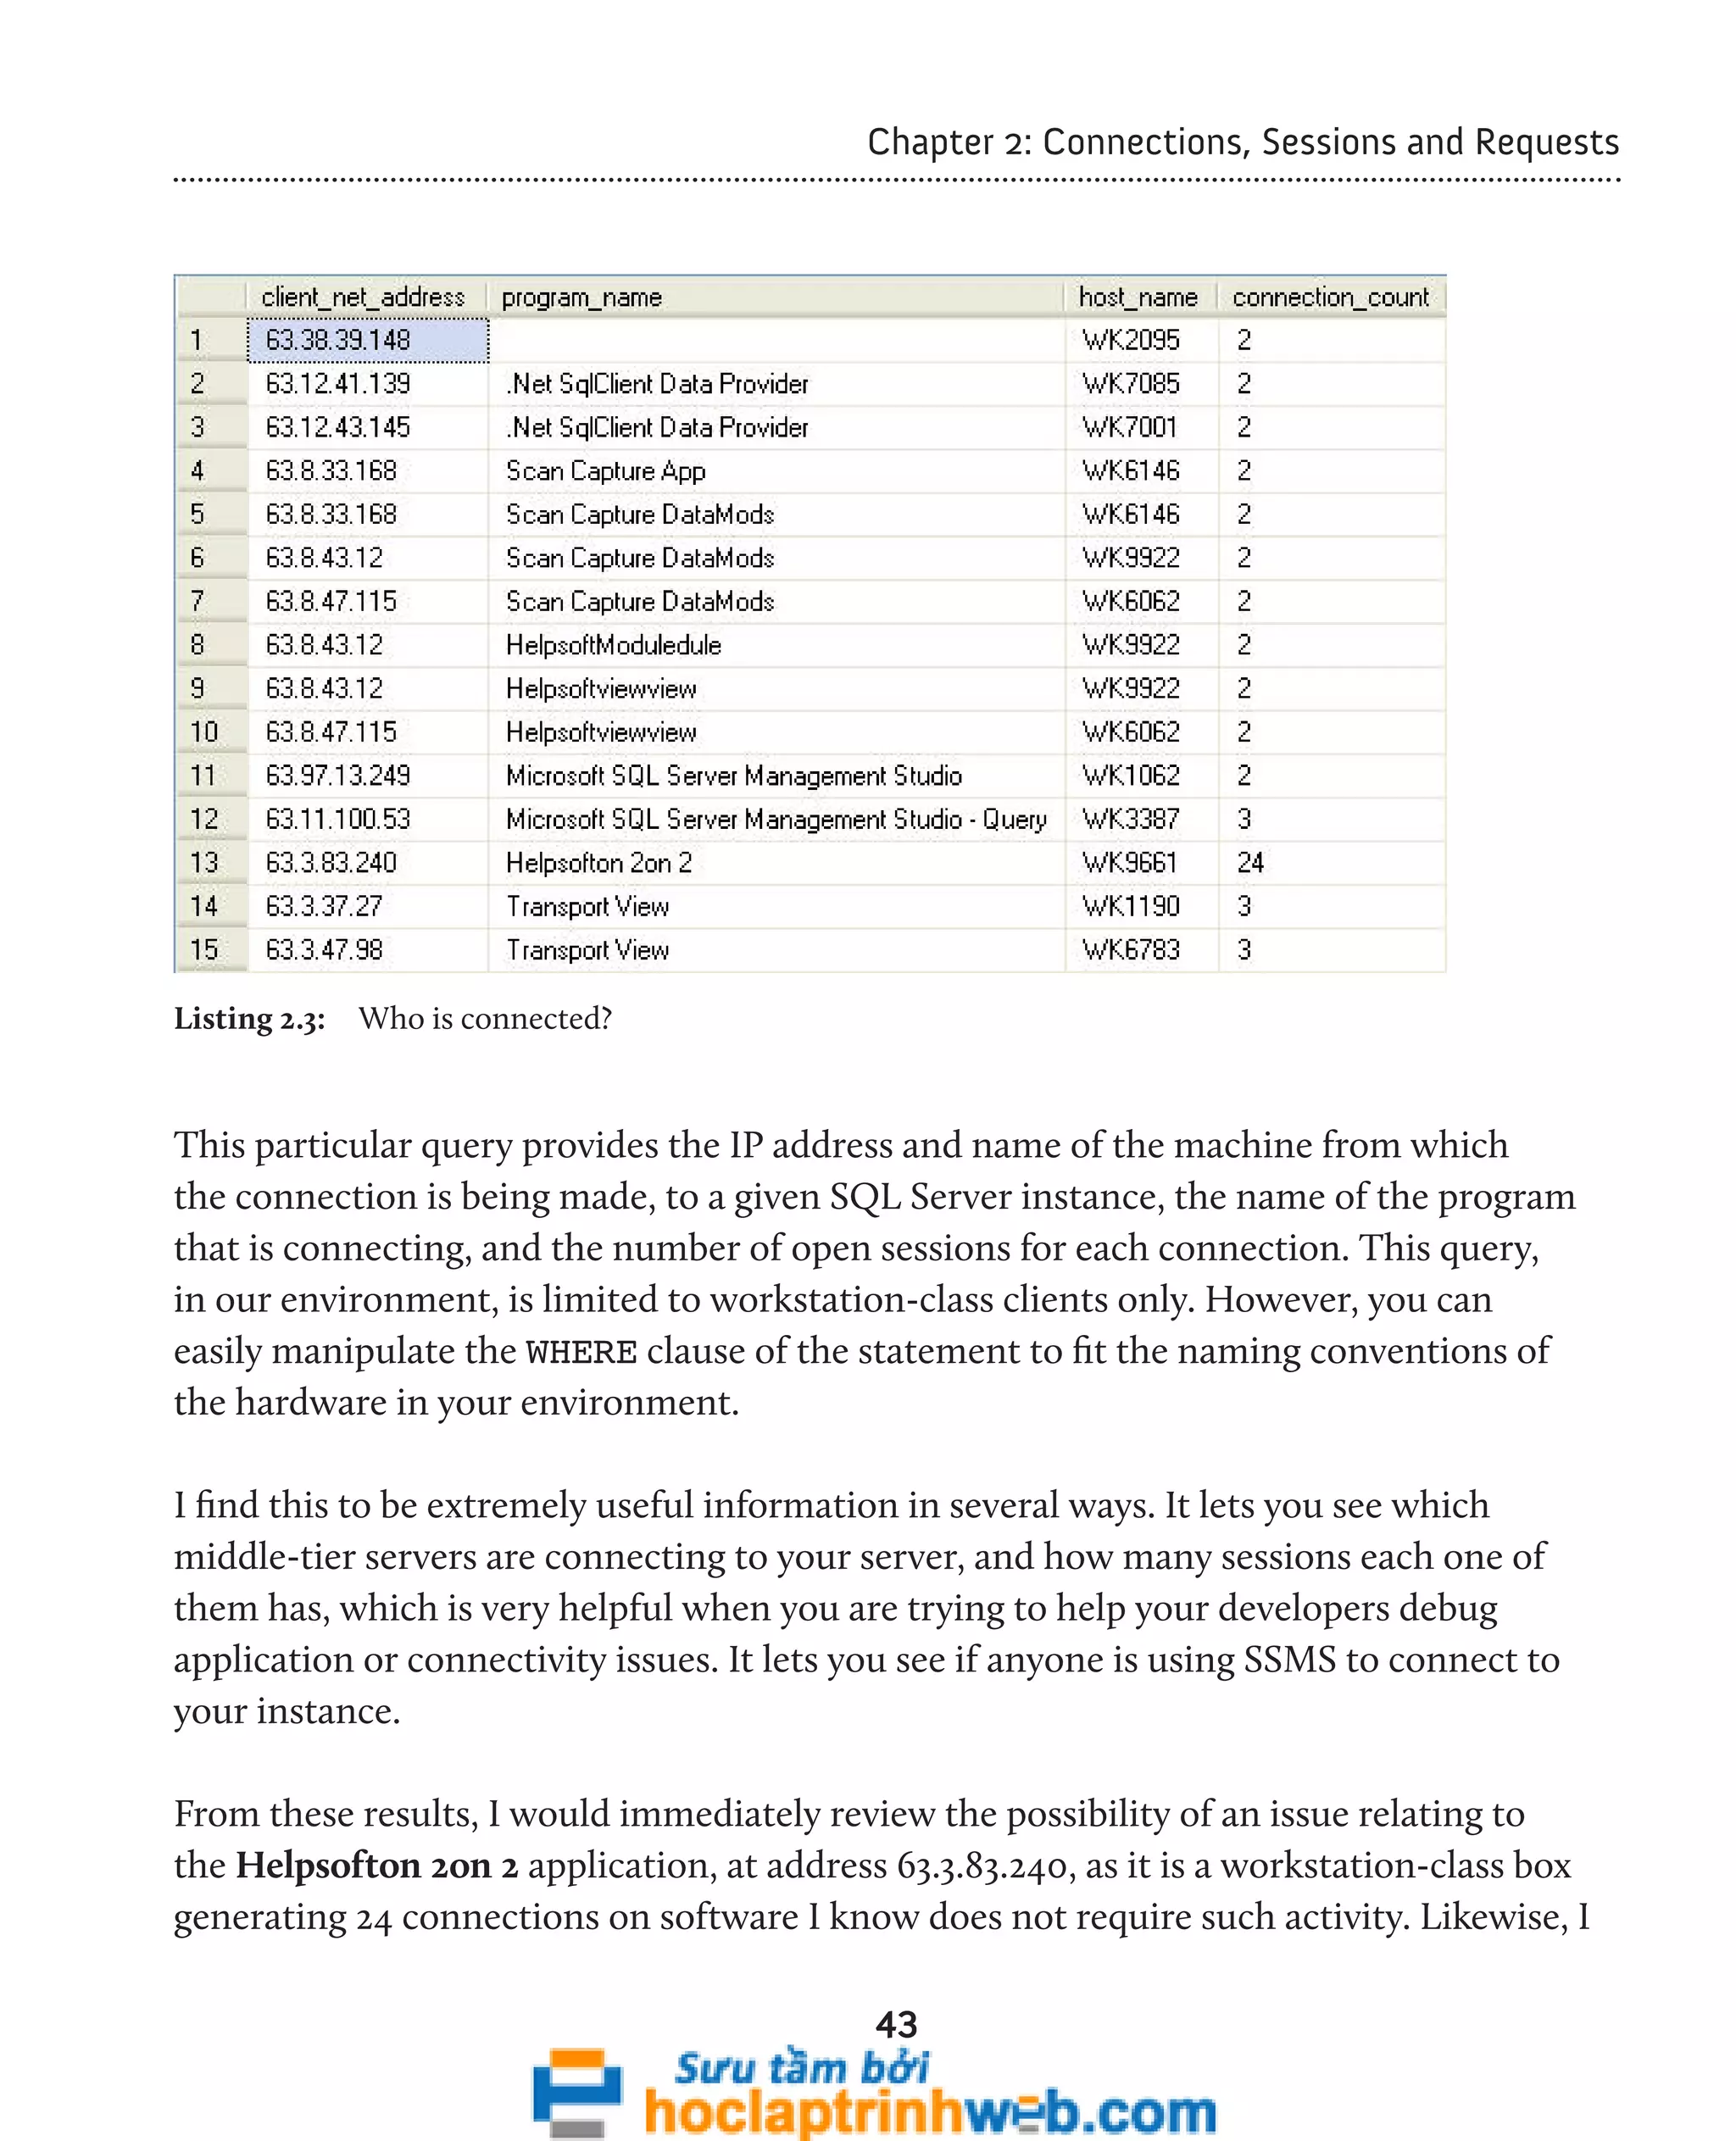
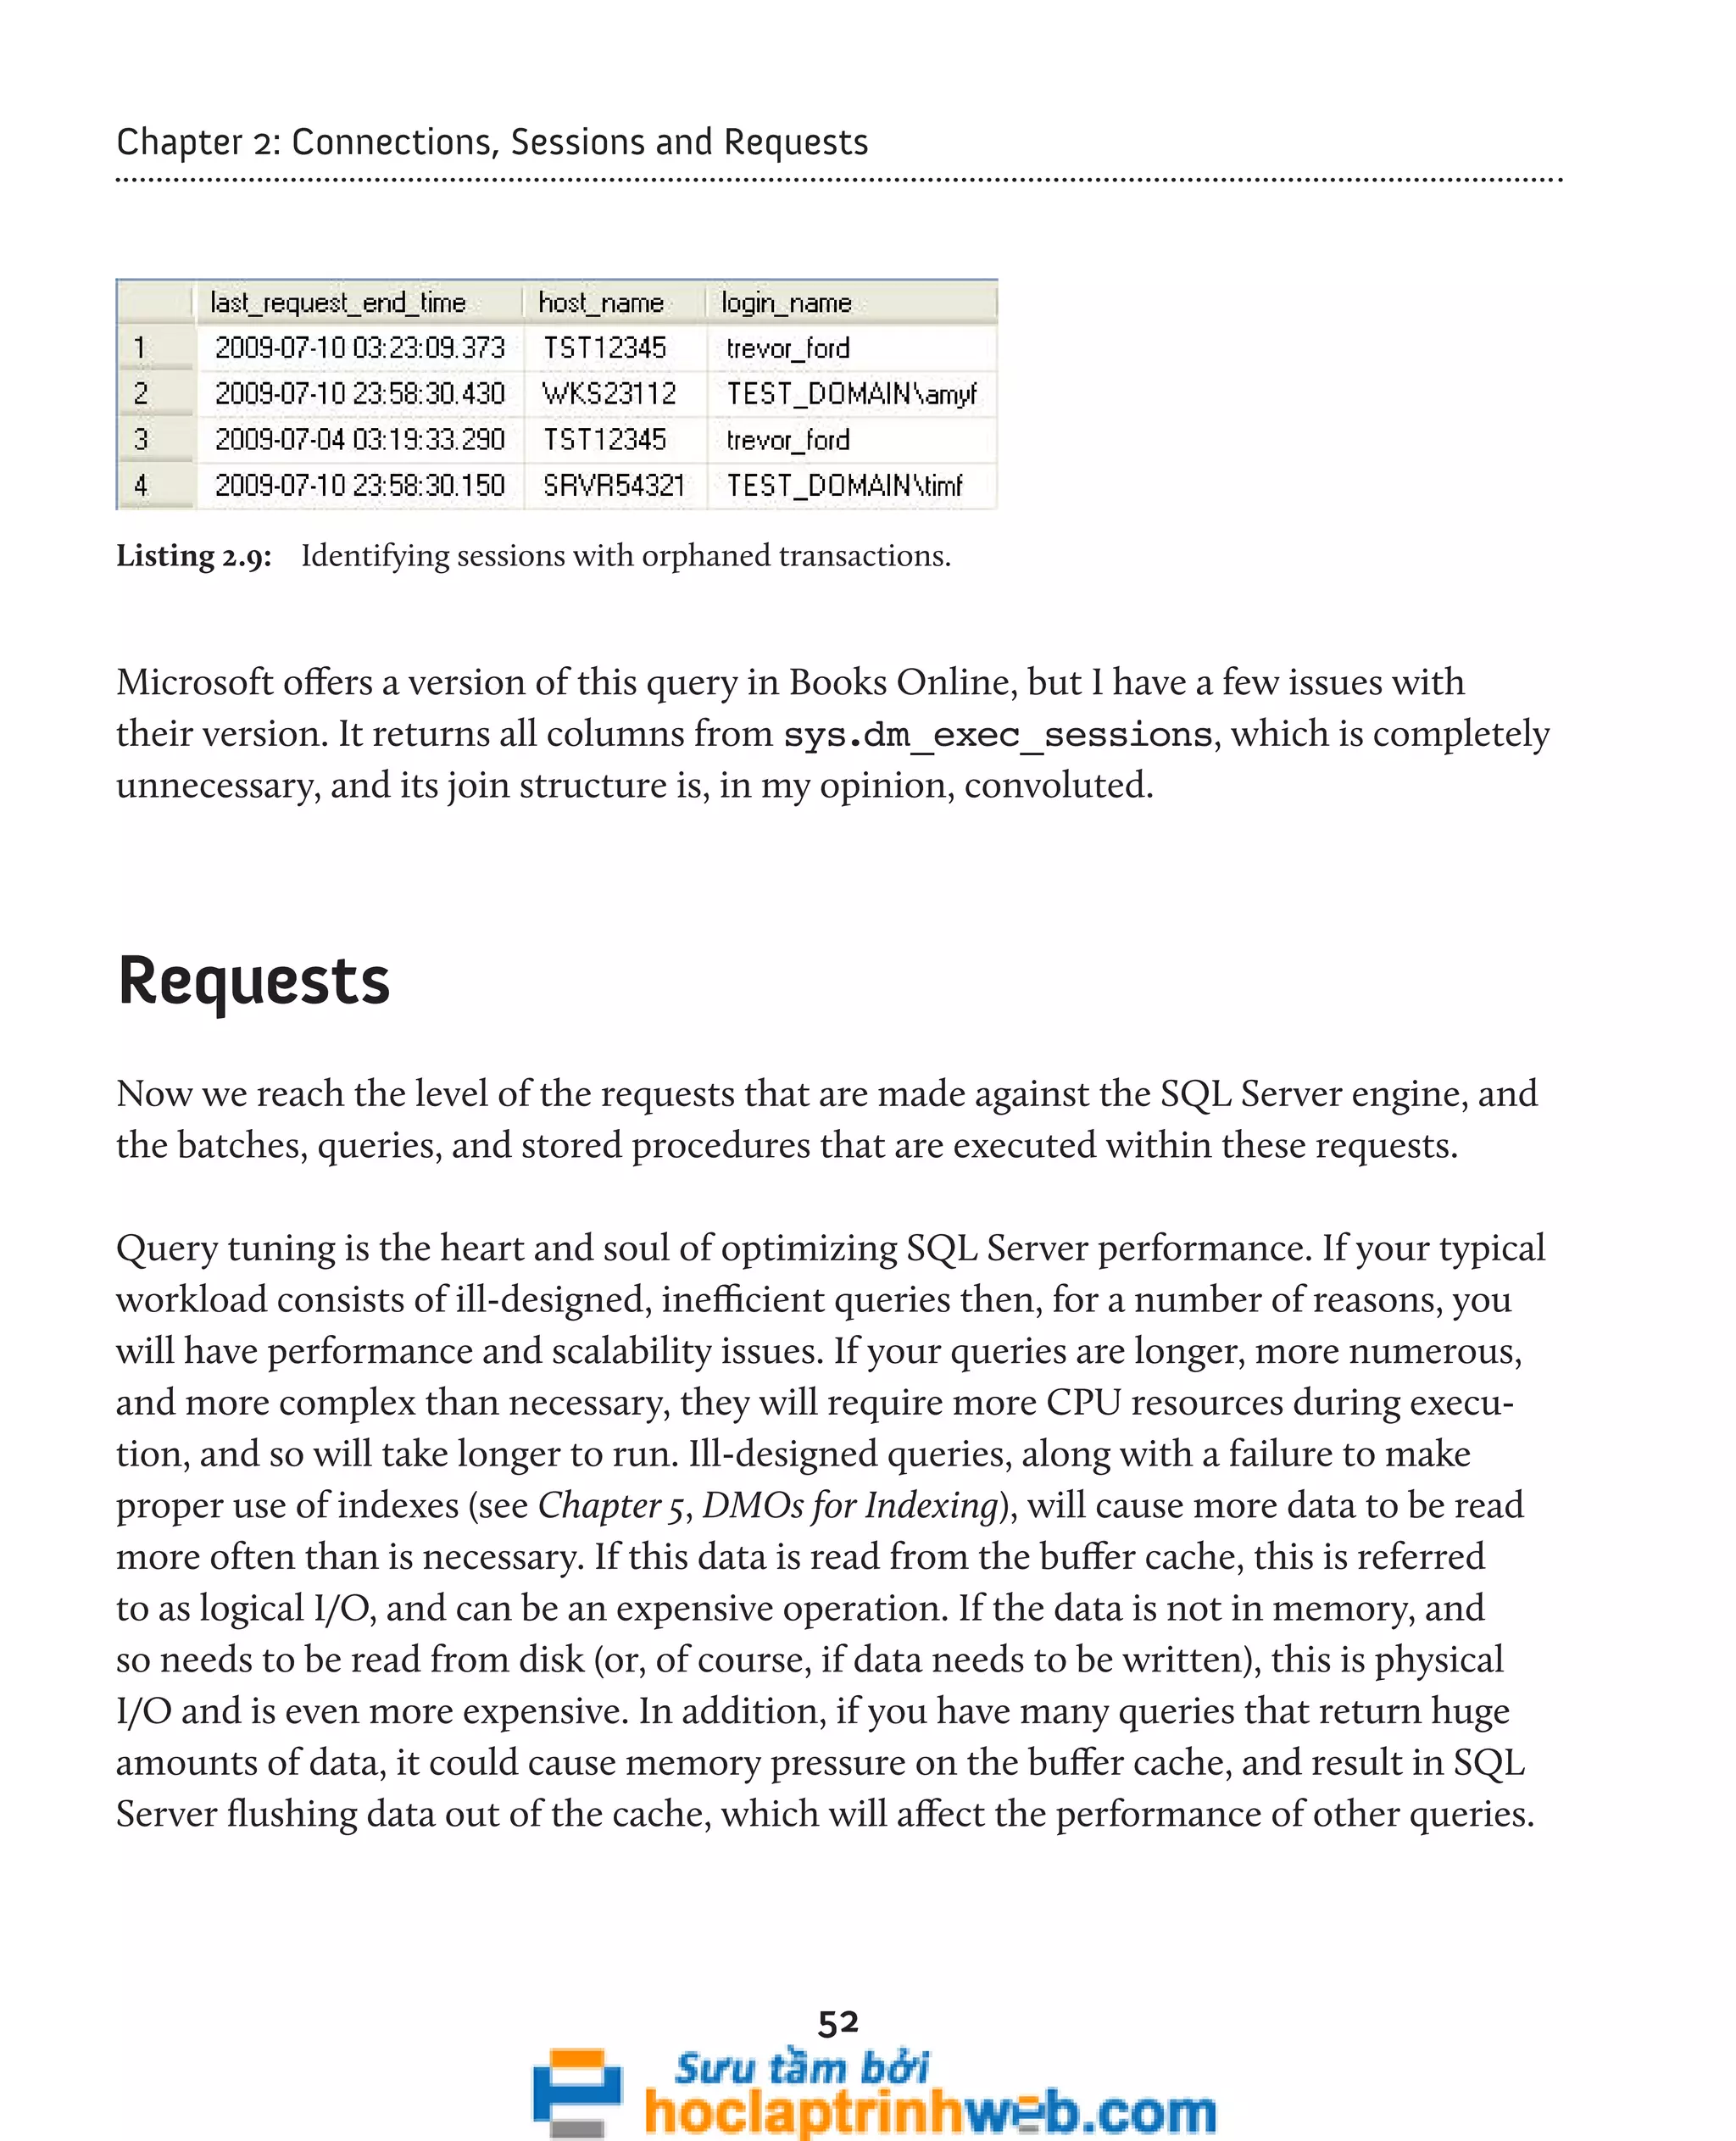
![Chapter 2: Connections, Sessions and Requests
49
DECLARE @days_old SMALLINT
SELECT @days_old = 5
SELECT des.session_id ,
des.login_time ,
des.last_request_start_time ,
des.last_request_end_time ,
des.[status] ,
des.[program_name] ,
des.cpu_time ,
des.total_elapsed_time ,
des.memory_usage ,
des.total_scheduled_time ,
des.total_elapsed_time ,
des.reads ,
des.writes ,
des.logical_reads ,
des.row_count ,
des.is_user_process
FROM sys.dm_exec_sessions des
INNER JOIN sys.dm_tran_session_transactions dtst
ON des.session_id = dtst.session_id
WHERE des.is_user_process = 1
AND DATEDIFF(dd, des.last_request_end_time, GETDATE()) > @days_old
AND des.status != 'Running'
ORDER BY des.last_request_end_time](https://image.slidesharecdn.com/ebookperformancetuningdavidsonford-141014034404-conversion-gate02/75/c-49-2048.jpg)

![Chapter 2: Connections, Sessions and Requests
63
SELECT der.statement_start_offset ,
der.statement_end_offset ,
SUBSTRING(dest.text, der.statement_start_offset / 2,
( CASE WHEN der.statement_end_offset = -1
THEN DATALENGTH(dest.text)
ELSE der.statement_end_offset
END - der.statement_start_offset ) / 2)
AS statement_executing ,
dest.text AS [full statement code]
FROM sys.dm_exec_requests der
INNER JOIN sys.dm_exec_sessions des
ON des.session_id = der.session_id
CROSS APPLY sys.dm_exec_sql_text(der.sql_handle) dest
WHERE des.is_user_process = 1
AND der.session_id <> @@spid
ORDER BY der.session_id ;
Listing 2.14: Parsing the SQL text using statement_start_offset and statement_end_offset.
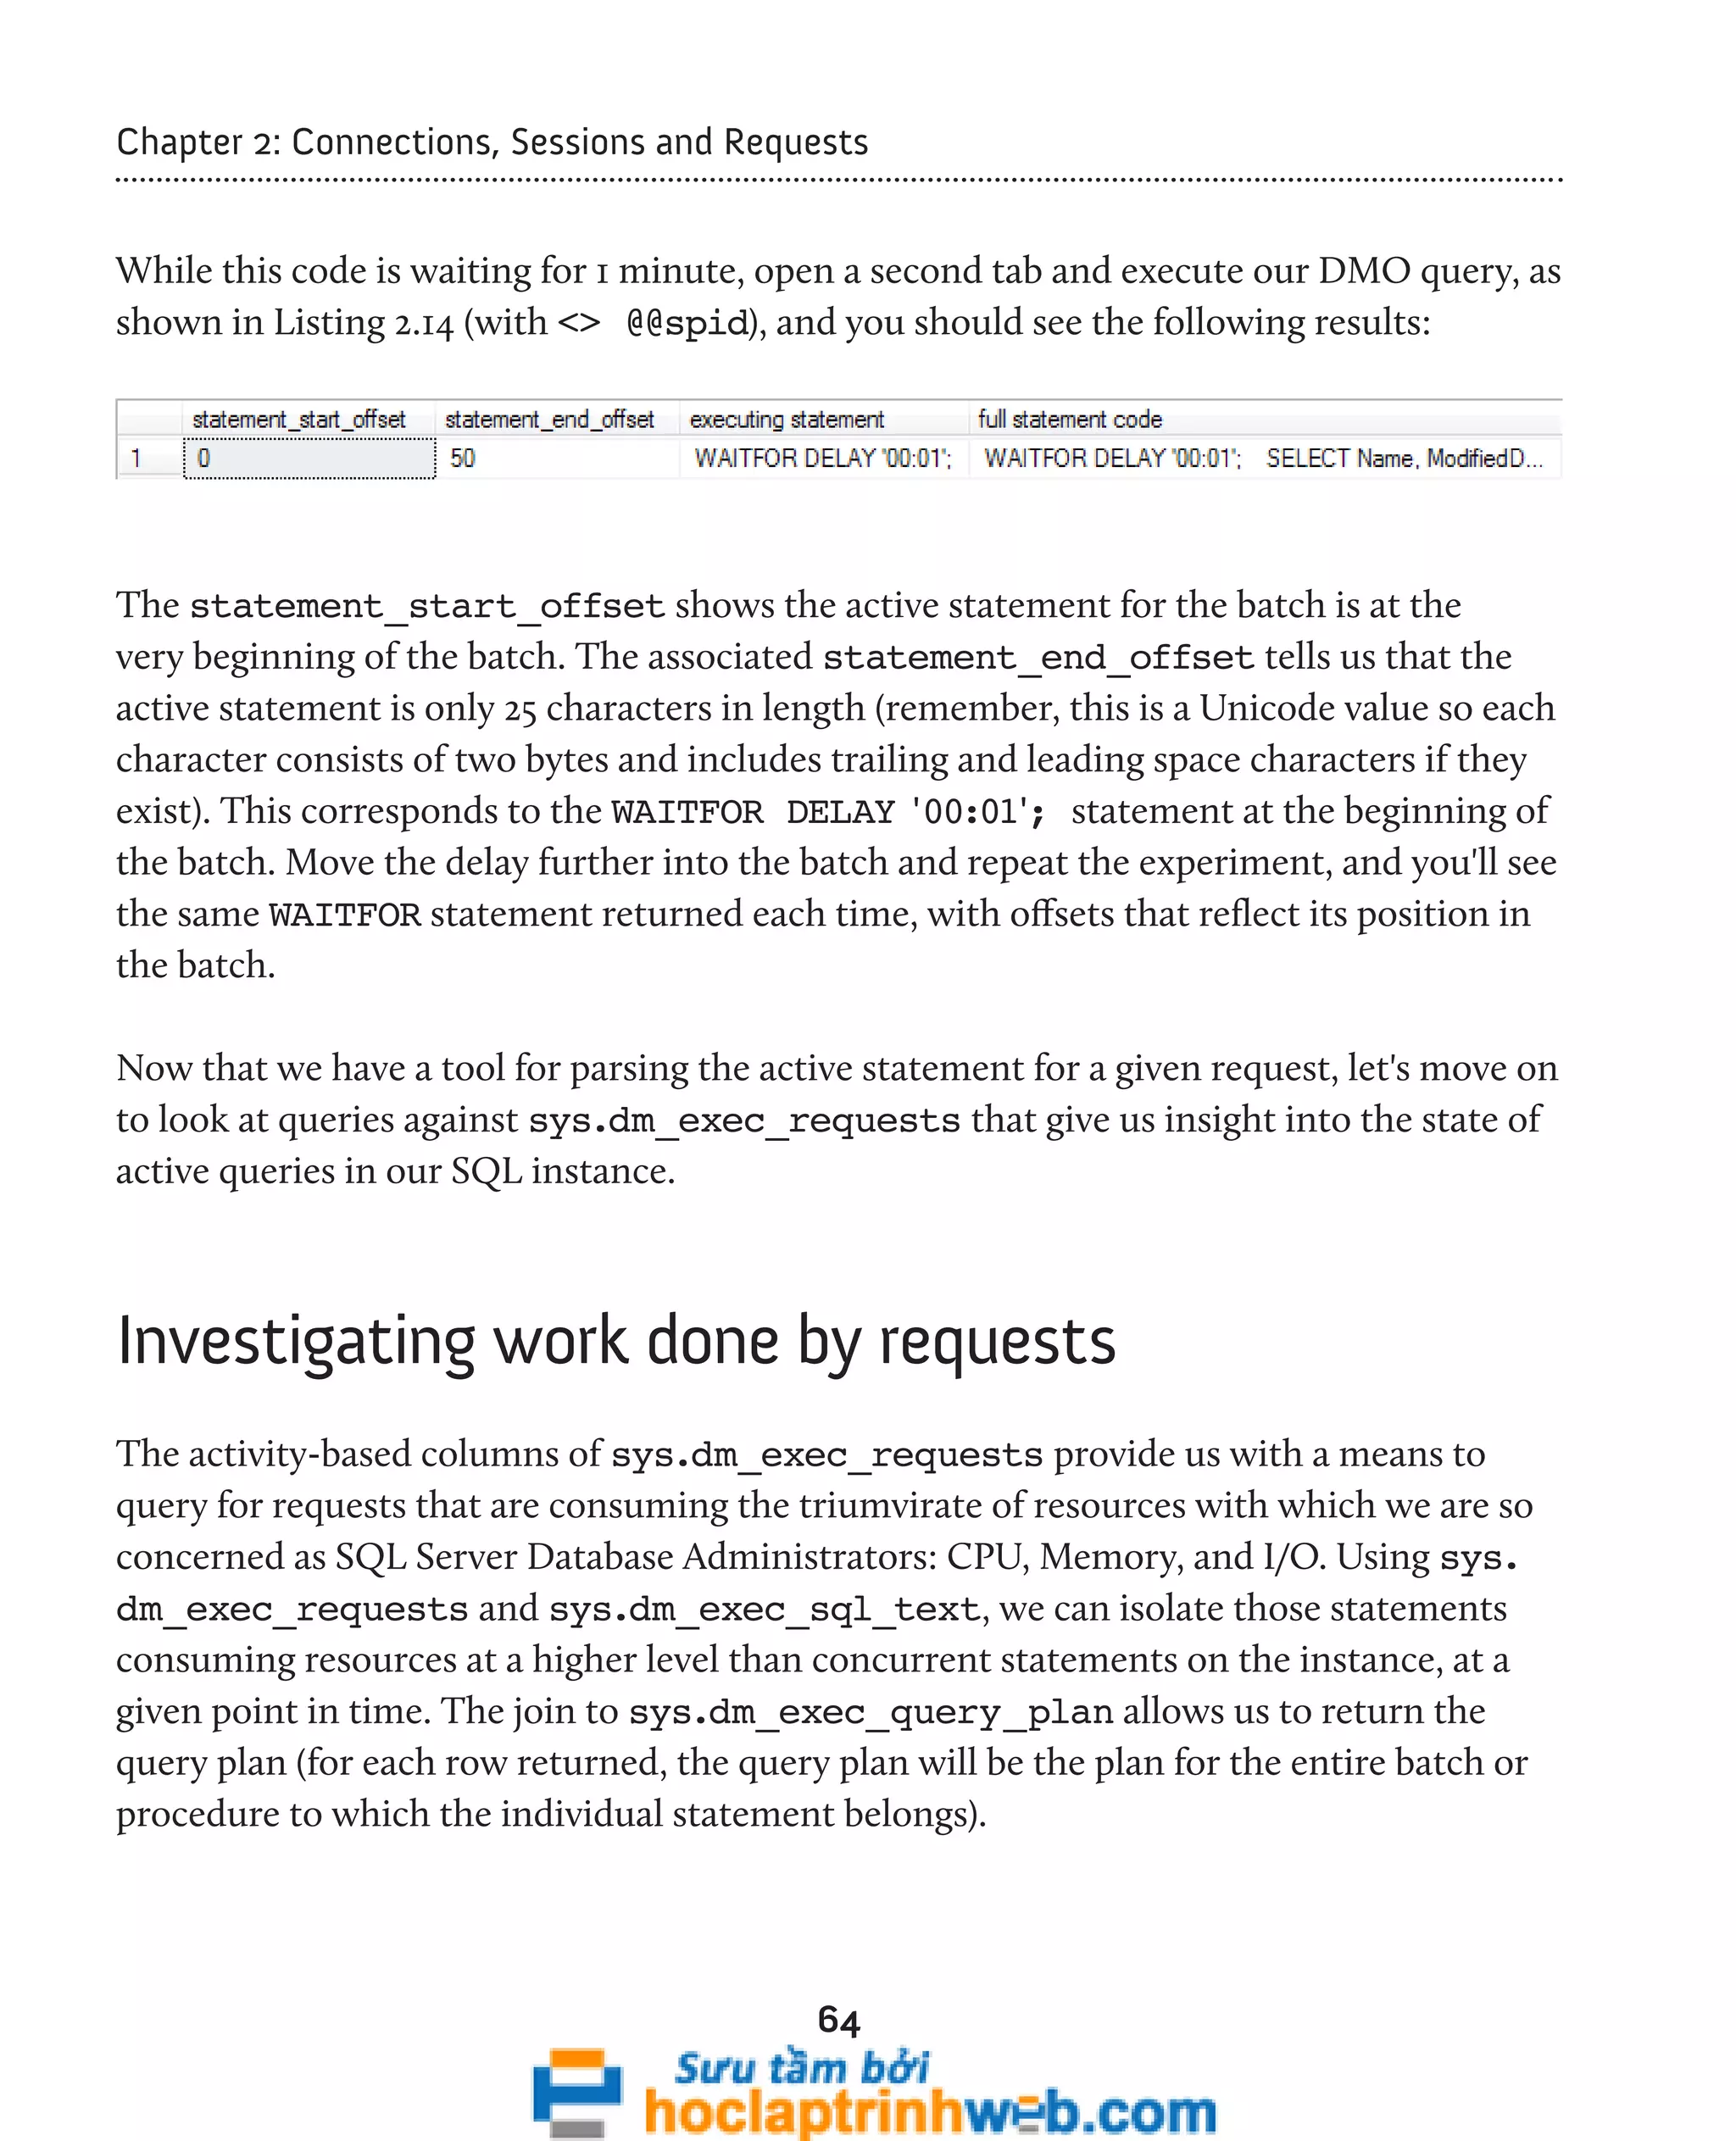
If you change the "<>" to "=" in the WHERE clause and run Listing 2.14, you'll simply get
back the text of that query, with 0 for the start offset and -1 for the end offset. If you want
to really see these offsets in action, open a tab in SSMS and run the query in Listing 2.15.
WAITFOR DELAY '00:01' ;
BEGIN TRANSACTION
-- WAITFOR DELAY '00:01' ;
INSERT INTO AdventureWorks.Production.ProductCategory
( Name, ModifiedDate )
VALUES ( 'Reflectors', GETDATE() )
ROLLBACK TRANSACTION
SELECT Name ,
ModifiedDate
FROM AdventureWorks.Production.ProductCategory
WHERE Name = 'Reflectors' ;
-- WAITFOR DELAY '00:01' ;
Listing 2.15: Investigating offsets.](https://image.slidesharecdn.com/ebookperformancetuningdavidsonford-141014034404-conversion-gate02/75/c-63-2048.jpg)
![Chapter 2: Connections, Sessions and Requests
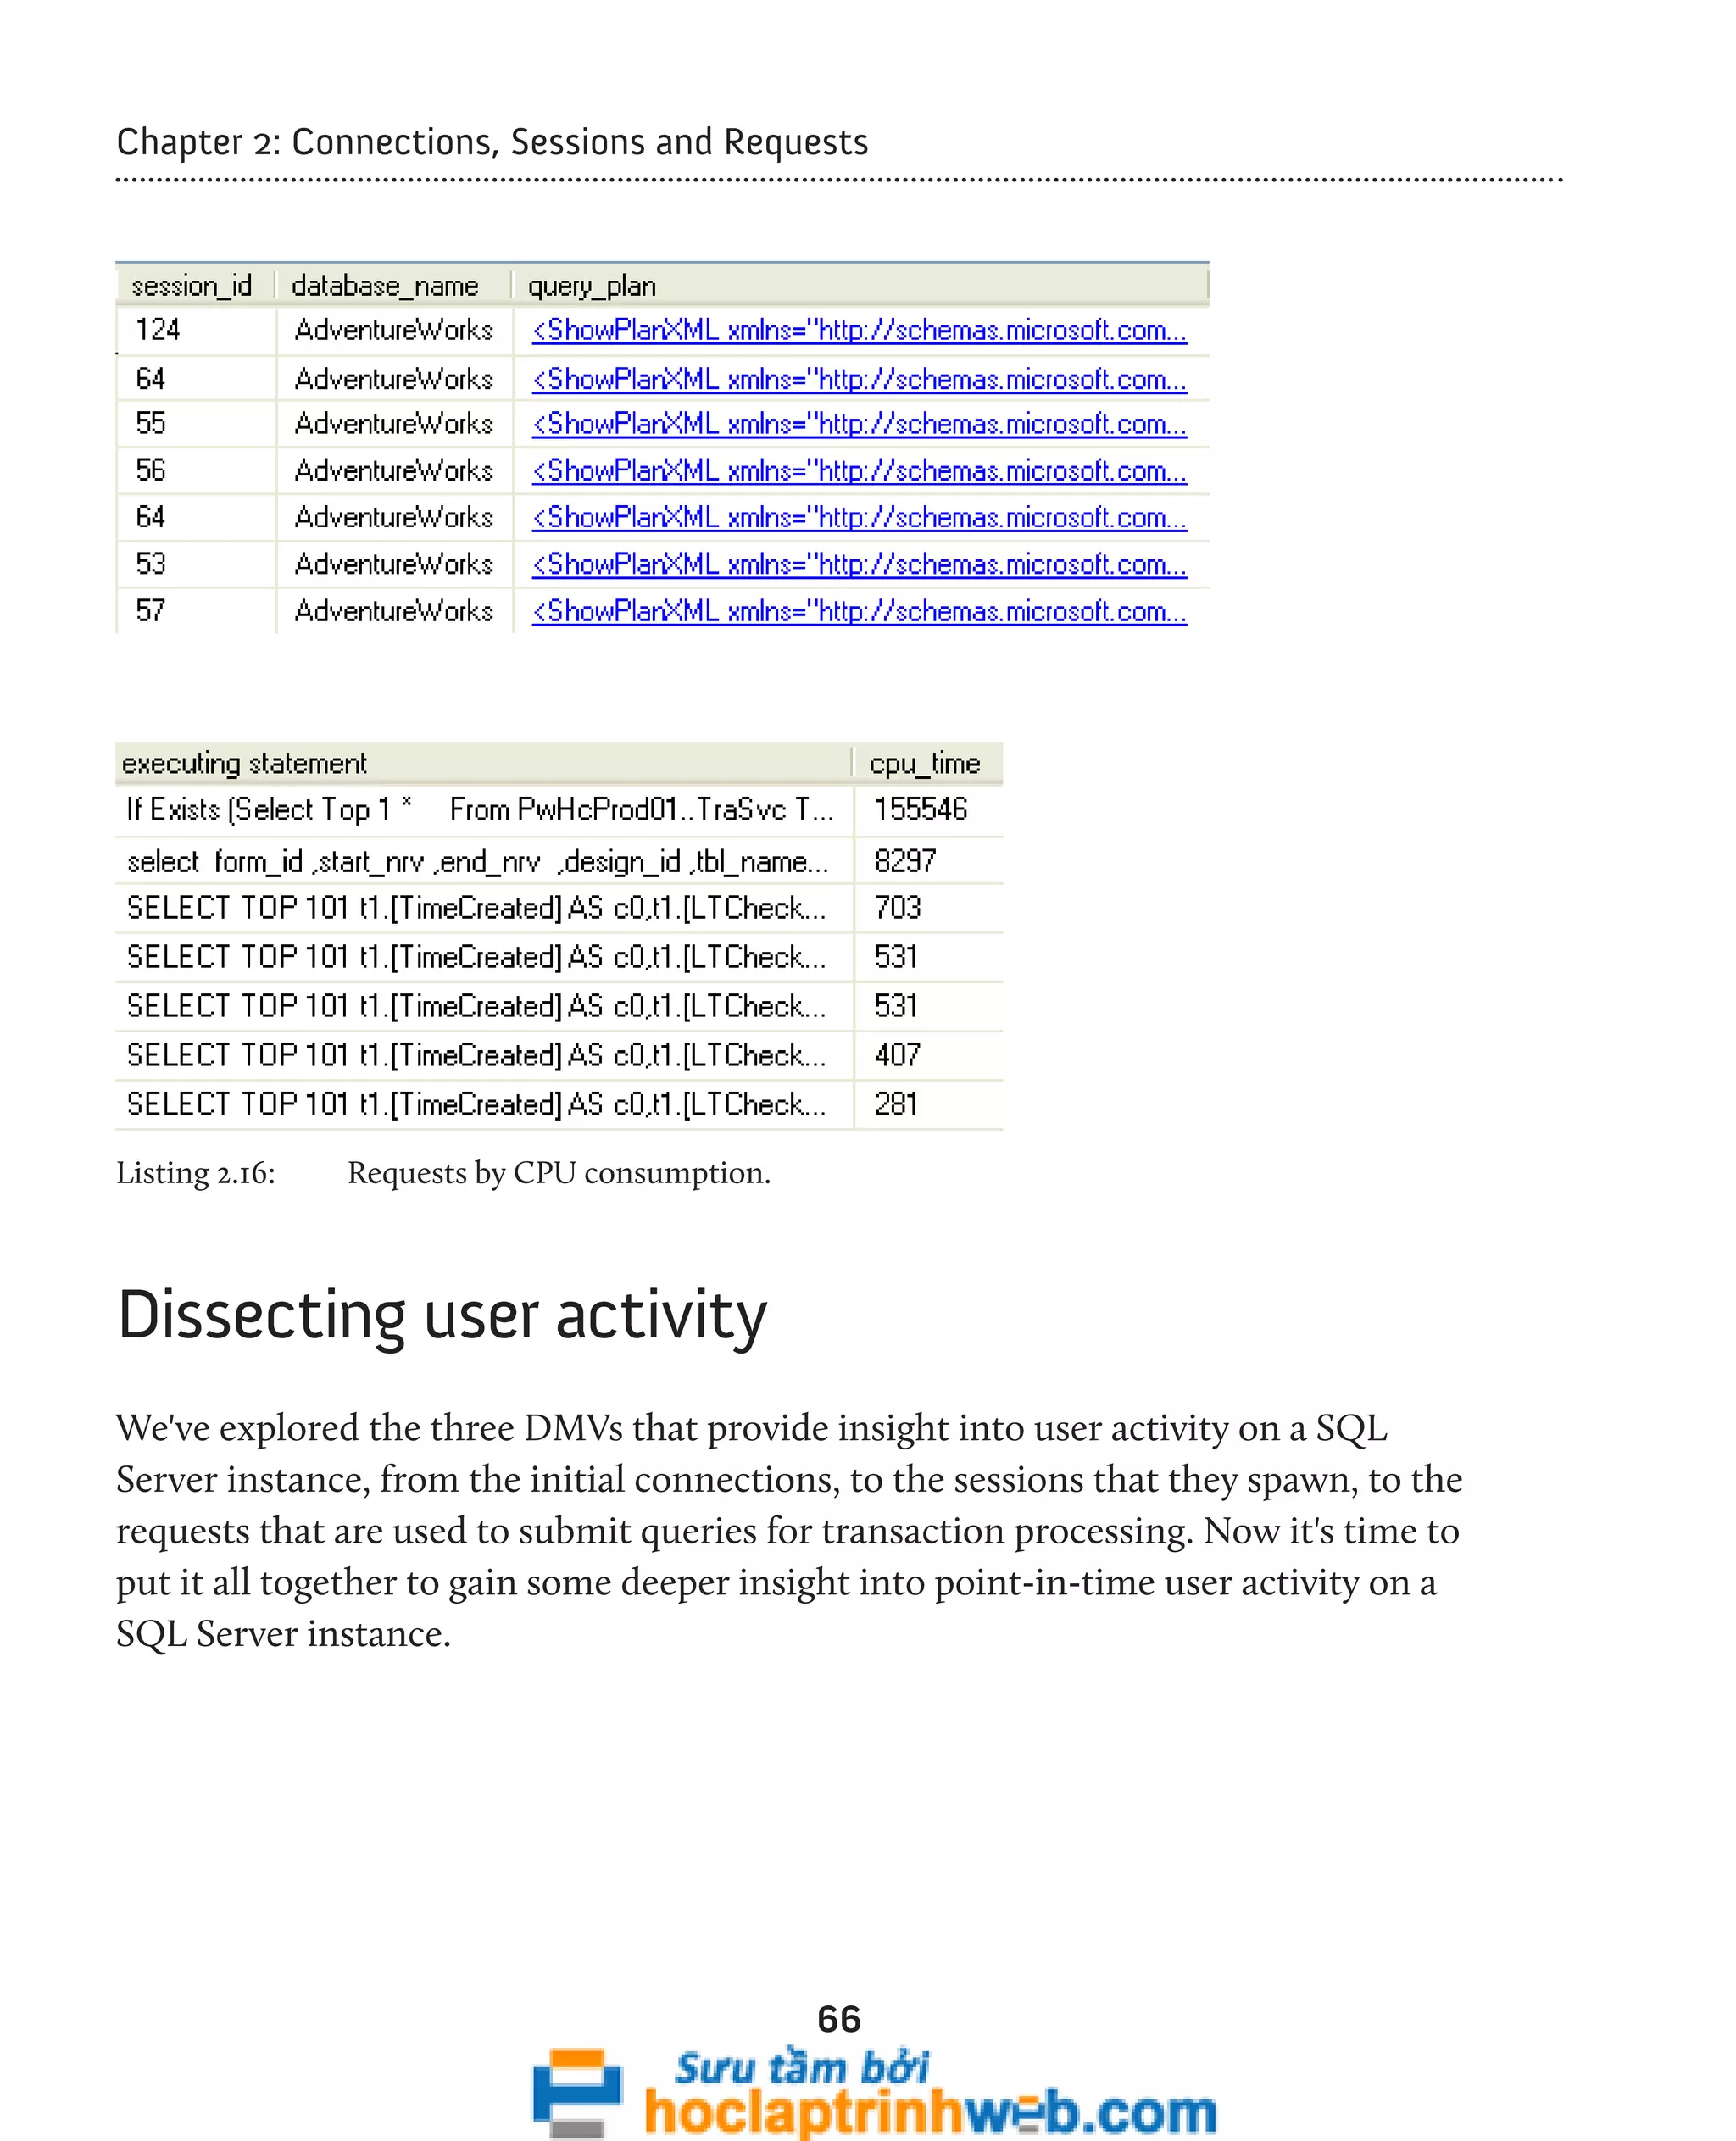
By adapting the script in Listing 2.16, we can examine the activity of each currently active
request in each active session in terms of CPU usage, number of pages allocated to the
request in memory, amount of time spent waiting, current execution time, or number of
physical reads.
Note that physical and logical reads are exposed separately in sys.dm_exec_requests.
Physical reads, in other words those reads that require SQL Server to go to disk rather
than cache to satisfy a read, are always more expensive and are therefore of a higher
interest than those logical reads being satisfied from memory. Physical reads rely on the
speed of your disk subsystem, which is often the slowest resource in the RDBMS stack.
65
SELECT der.session_id ,
DB_NAME(der.database_id) AS database_name ,
deqp.query_plan ,
SUBSTRING(dest.text, der.statement_start_offset / 2,
( CASE WHEN der.statement_end_offset = -1
THEN DATALENGTH(dest.text)
ELSE der.statement_end_offset
END - der.statement_start_offset ) / 2)
AS [statement executing] ,
der.cpu_time
--der.granted_query_memory
--der.wait_time
--der.total_elapsed_time
--der.reads
FROM sys.dm_exec_requests der
INNER JOIN sys.dm_exec_sessions des
ON des.session_id = der.session_id
CROSS APPLY sys.dm_exec_sql_text(der.sql_handle) dest
CROSS APPLY sys.dm_exec_query_plan(der.plan_handle) deqp
WHERE des.is_user_process = 1
AND der.session_id <> @@spid
ORDER BY der.cpu_time DESC ;
-- ORDER BY der.granted_query_memory DESC ;
-- ORDER BY der.wait_time DESC;
-- ORDER BY der.total_elapsed_time DESC;
-- ORDER BY der.reads DESC;](https://image.slidesharecdn.com/ebookperformancetuningdavidsonford-141014034404-conversion-gate02/75/c-65-2048.jpg)
![Chapter 2: Connections, Sessions and Requests
Who is running what, right now?
Listing 2.17 makes use of sys.dm_exec_requests and sys.dm_exec_sql_text,
alongside our connections and sessions DMVs to provide a very useful "first look" at
which sessions are running what on a given instance.
67
-- Who is running what at this instant
SELECT dest.text AS [Command text] ,
des.login_time ,
des.[host_name] ,
des.[program_name] ,
der.session_id ,
dec.client_net_address ,
der.status ,
der.command ,
DB_NAME(der.database_id) AS DatabaseName
FROM sys.dm_exec_requests der
INNER JOIN sys.dm_exec_connections dec
ON der.session_id = dec.session_id
INNER JOIN sys.dm_exec_sessions des
ON des.session_id = der.session_id
CROSS APPLY sys.dm_exec_sql_text(sql_handle) AS dest
WHERE des.is_user_process = 1
Listing 2.17: Who is running what?
A better version of sp_who2
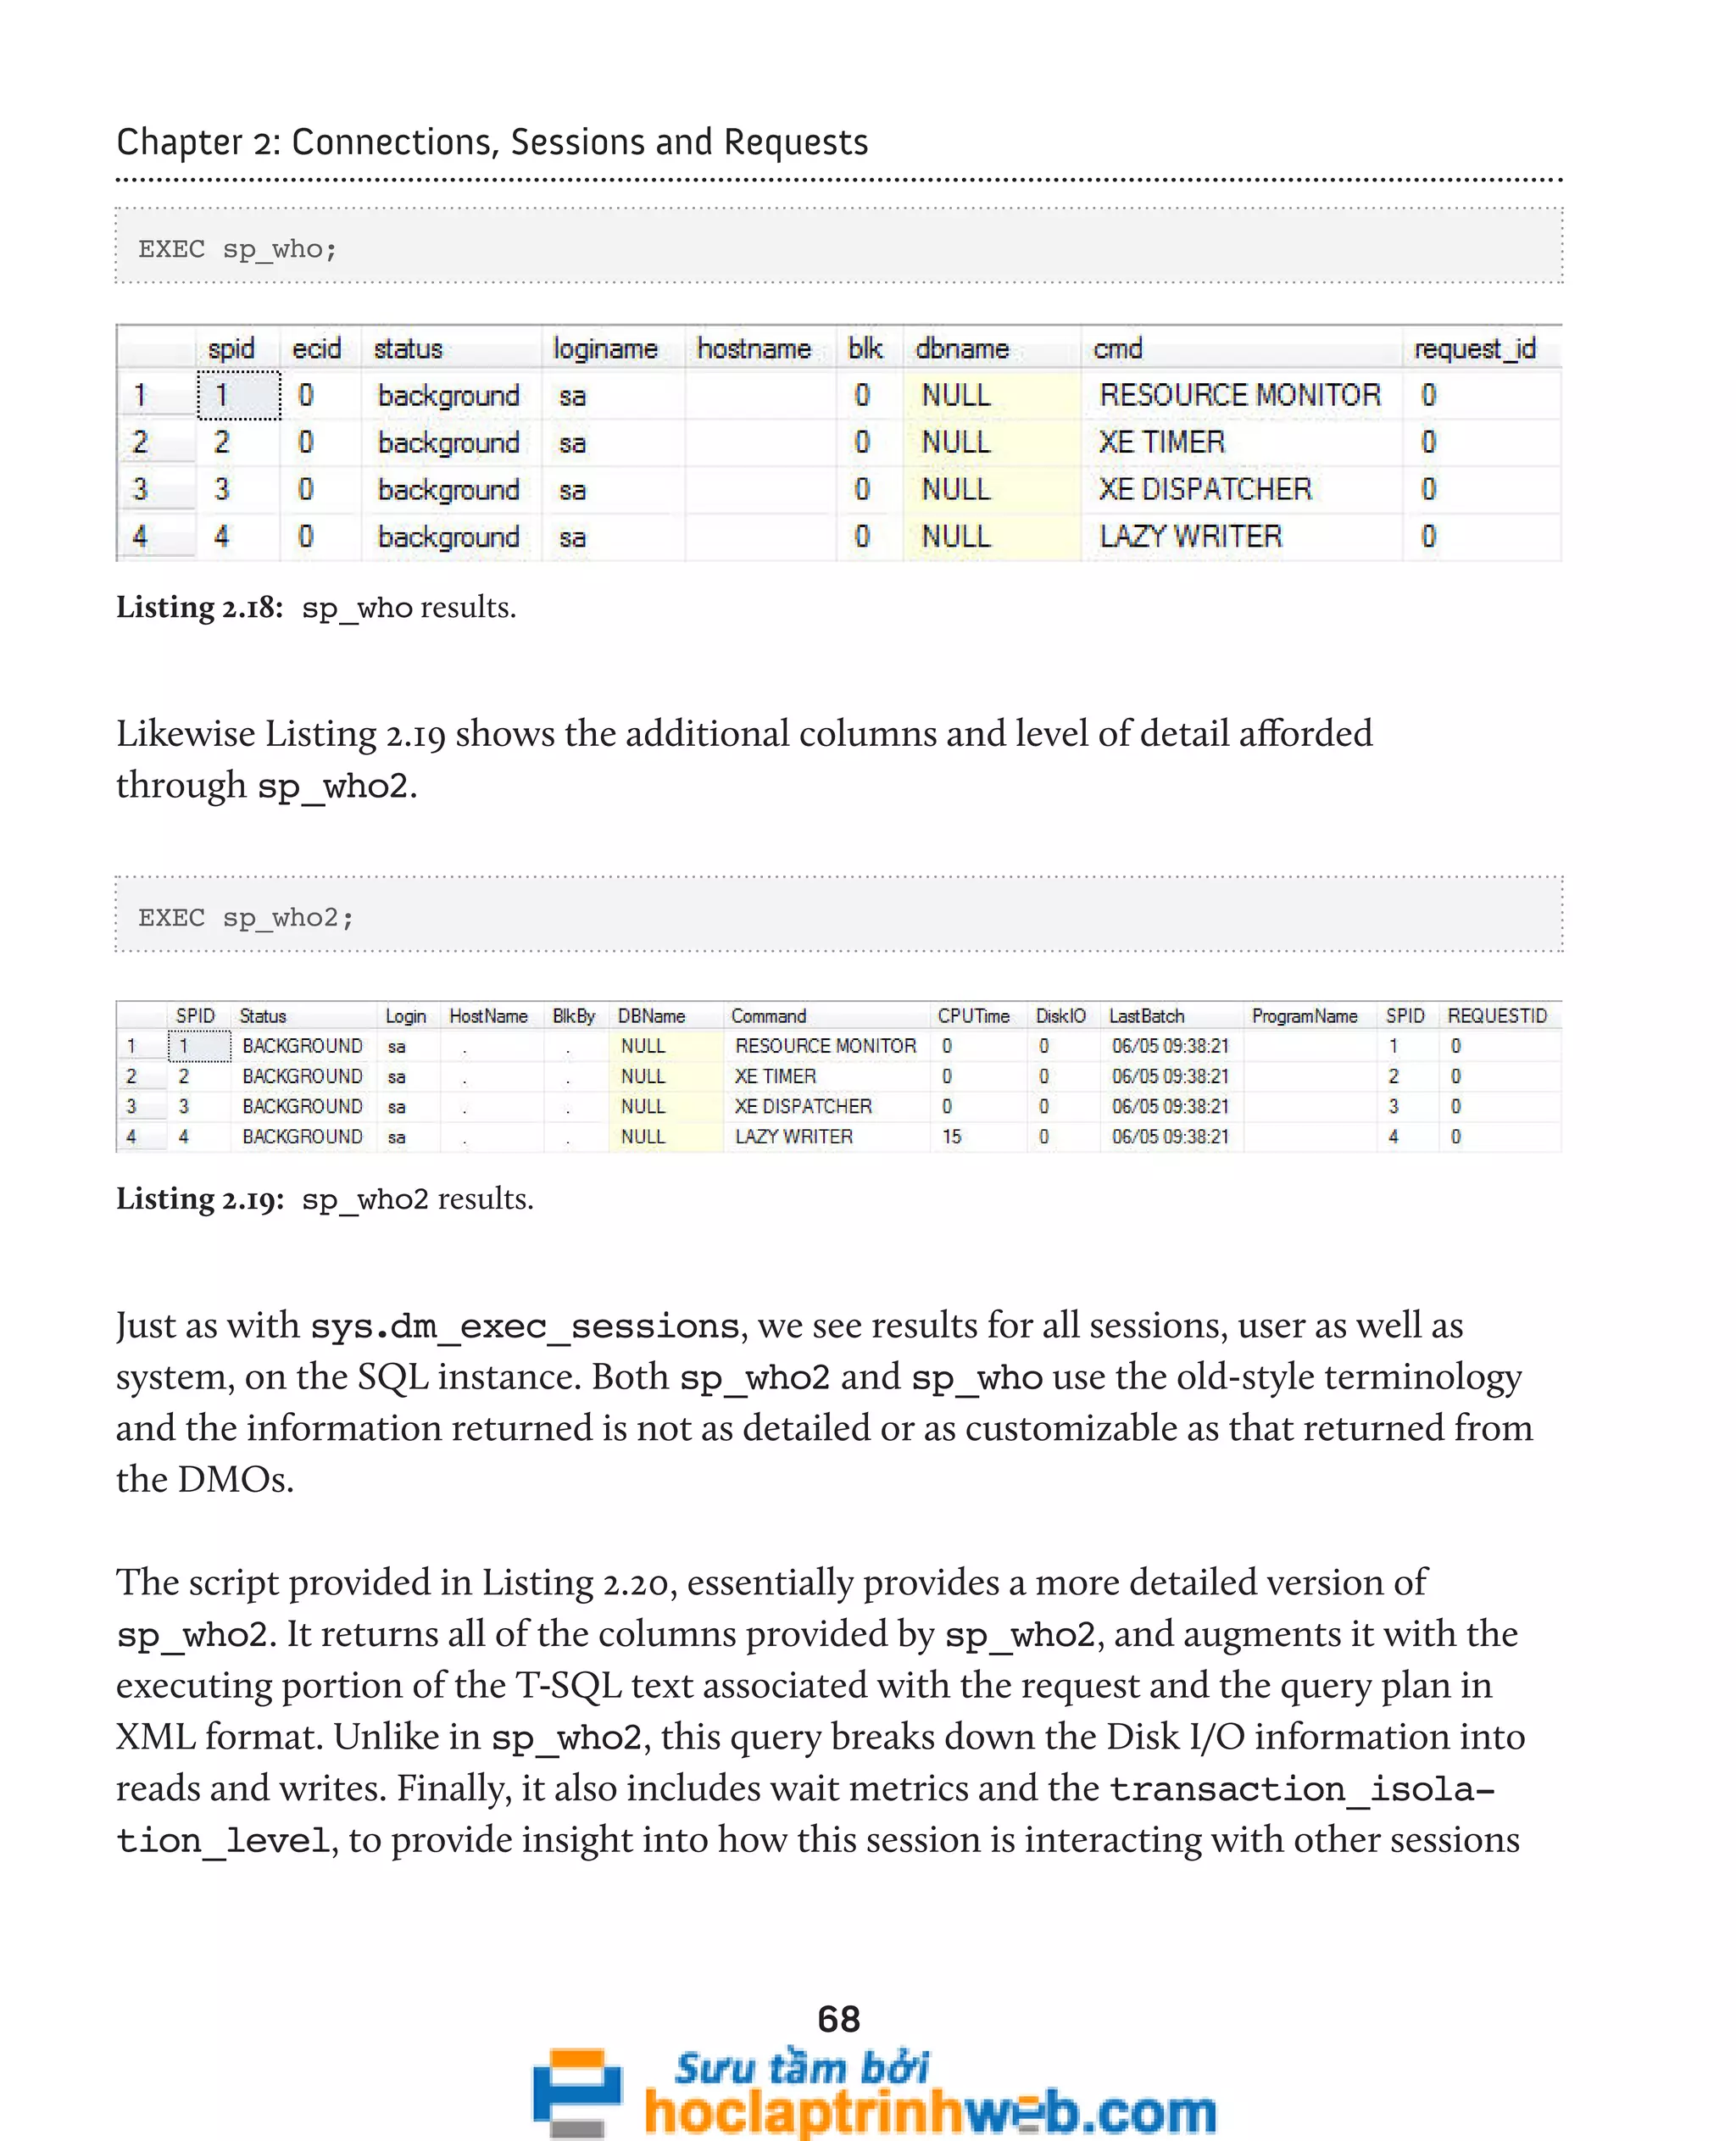
Many of us DBAs are familiar with the sp_who and sp_who2 system stored procedures
for interrogating SQL Server activity. Listing 2.18 provides the syntax, and sample results,
from an execution of sp_who.](https://image.slidesharecdn.com/ebookperformancetuningdavidsonford-141014034404-conversion-gate02/75/c-67-2048.jpg)
![Chapter 2: Connections, Sessions and Requests
currently running on the instance. As a whole, this information offers a very useful
snapshot of activity, resource impact, and processing health on the SQL instance.
69
SELECT des.session_id ,
des.status ,
des.login_name ,
des.[HOST_NAME] ,
der.blocking_session_id ,
DB_NAME(der.database_id) AS database_name ,
der.command ,
des.cpu_time ,
des.reads ,
des.writes ,
dec.last_write ,
des.[program_name] ,
der.wait_type ,
der.wait_time ,
der.last_wait_type ,
der.wait_resource ,
CASE des.transaction_isolation_level
WHEN 0 THEN 'Unspecified'
WHEN 1 THEN 'ReadUncommitted'
WHEN 2 THEN 'ReadCommitted'
WHEN 3 THEN 'Repeatable'
WHEN 4 THEN 'Serializable'
WHEN 5 THEN 'Snapshot'
END AS transaction_isolation_level ,
OBJECT_NAME(dest.objectid, der.database_id) AS OBJECT_NAME ,
SUBSTRING(dest.text, der.statement_start_offset / 2,
( CASE WHEN der.statement_end_offset = -1
THEN DATALENGTH(dest.text)
ELSE der.statement_end_offset
END - der.statement_start_offset ) / 2)
AS [executing statement] ,
deqp.query_plan
FROM sys.dm_exec_sessions des
LEFT JOIN sys.dm_exec_requests der
ON des.session_id = der.session_id
LEFT JOIN sys.dm_exec_connections dec
ON des.session_id = dec.session_id
CROSS APPLY sys.dm_exec_sql_text(der.sql_handle) dest
CROSS APPLY sys.dm_exec_query_plan(der.plan_handle) deqp](https://image.slidesharecdn.com/ebookperformancetuningdavidsonford-141014034404-conversion-gate02/75/c-69-2048.jpg)


![96
Chapter 3: Query Plan Metadata
In SQL Server 2008, we can use the sys.dm_exec_procedure_stats DMV to look
exclusively at cached plans for stored procedures. We'll examine this DMV a little later.
Examining ad hoc single-use plans
The script in Listing 3.11 uses the sys.dm_exec_cached_plans DMV and sys.dm_
exec_sql_text DMF to retrieve the text for each single-use plan that is bloating the
plan cache.
-- Find single-use, ad hoc queries that are bloating the plan cache
SELECT TOP ( 100 )
[text] ,
cp.size_in_bytes
FROM sys.dm_exec_cached_plans AS cp
CROSS APPLY sys.dm_exec_sql_text(plan_handle)
WHERE cp.cacheobjtype = 'Compiled Plan'
AND cp.objtype = 'Adhoc'
AND cp.usecounts = 1
ORDER BY cp.size_in_bytes DESC ;
Listing 3.11: Examining single-use plans in the cache.
This query will identify ad hoc queries with a use count of 1, ordered by the size of the
plan. It provides the text and size of single-use ad hoc queries that waste space in the plan
cache. This usually happens when T-SQL commands are built by concatenating a variable
at the end of a "boilerplate" T-SQL statement. Listing 3.12 shows a simplified example.
-- Query 1
SELECT FirstName ,
LastName
FROM dbo.Employee
WHERE EmpID = 5
-- Query 2](https://image.slidesharecdn.com/ebookperformancetuningdavidsonford-141014034404-conversion-gate02/75/c-96-2048.jpg)

![104
Chapter 3: Query Plan Metadata
Before we look at the scripts, it is important to remember when using this DMV that
there is usually, but not necessarily, a one-to-one relationship between a sql_handle
and a plan_handle. One sql_handle can sometimes be associated with more than
one plan_handle. This can be caused by statement-level recompilation (see
http://technet.microsoft.com/en-us/library/ee343986(SQL.100).aspx for more
details), or by the exact same SQL text being executed with different attribute values,
as discussed earlier.
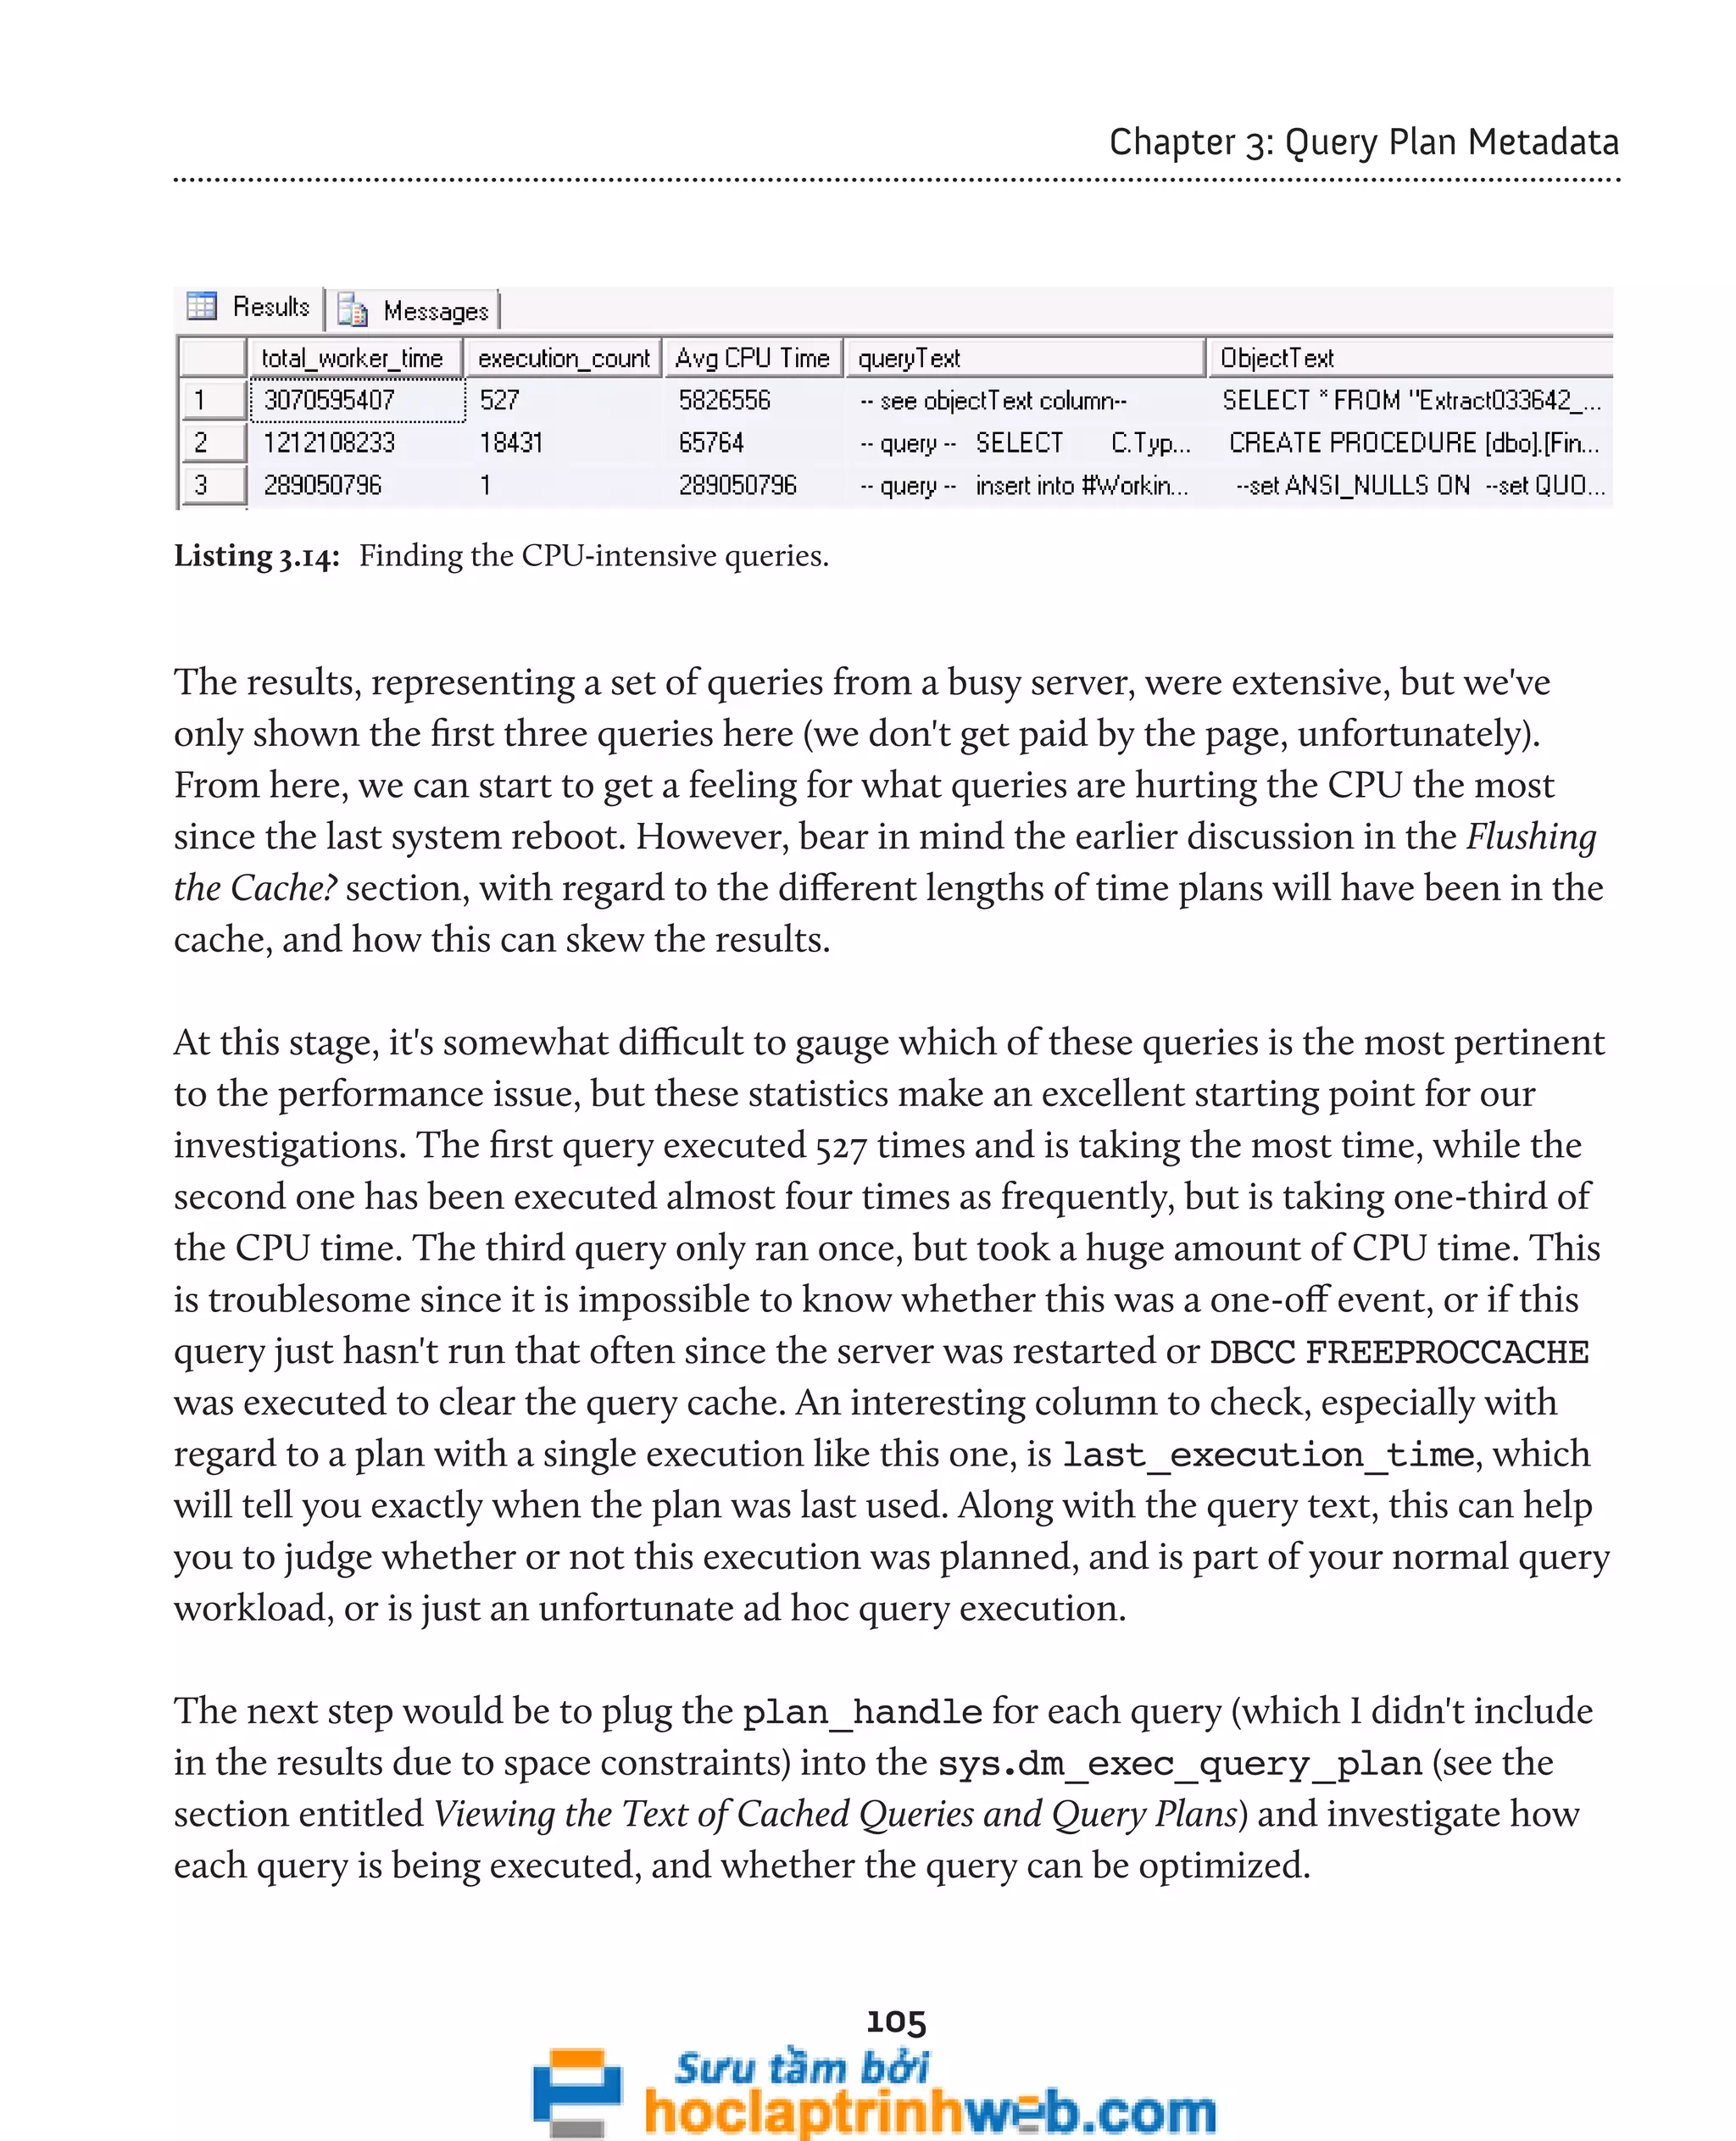
Let's say that you've identified that your sytem is CPU bound. Using the total_
worker_time column, you can find out which queries your server is spending the most
time executing. However, it isn't enough just to know that the server is spending a lot
of time executing a particular query. In fact, without context, this piece of information
is more or less meaningless. It might be that the query is run a million times, and no
other query is executed more than a thousand times. So, to add the required context, we
include the execution_count, along with a calculation of the average CPU time, as
shown in Listing 3.14.
SELECT TOP 3
total_worker_time ,
execution_count ,
total_worker_time / execution_count AS [Avg CPU Time] ,
CASE WHEN deqs.statement_start_offset = 0
AND deqs.statement_end_offset = -1
THEN '-- see objectText column--'
ELSE '-- query --' + CHAR(13) + CHAR(10)
+ SUBSTRING(execText.text, deqs.statement_start_offset / 2,
( ( CASE WHEN deqs.statement_end_offset = -1
THEN DATALENGTH(execText.text)
ELSE deqs.statement_end_offset
END ) - deqs.statement_start_offset ) / 2)
END AS queryText
FROM sys.dm_exec_query_stats deqs
CROSS APPLY sys.dm_exec_sql_text(deqs.plan_handle) AS execText
ORDER BY deqs.total_worker_time DESC ;](https://image.slidesharecdn.com/ebookperformancetuningdavidsonford-141014034404-conversion-gate02/75/c-104-2048.jpg)

![108
Chapter 3: Query Plan Metadata
Investigating Expensive Cached
Stored Procedures
New to SQL Server 2008 is the sys.dm_exec_procedure_stats DMV that focuses
only on stored procedures and will not require you to aggregate on sql_handle to get
an overall view of your object's performance characteristics. Books Online describes it as:
Returns aggregate performance statistics for cached stored procedures. The view contains one row per stored
procedure, and the lifetime of the row is as long as the stored procedure remains cached. When a stored
procedure is removed from the cache, the corresponding row is eliminated from this view. At that time, a
Performance Statistics SQL trace event is raised similar to sys.dm_exec_query_stats.
It is similar in nature to sys.dm_exec_query_stats, but with a few differences in the
columns available. It only links to the plan of the procedure or object, not the individual
statements in the procedure. This DMV allows you to discover a lot of very interesting
and important performance information about your cached stored procedures.
-- Top Cached SPs By Total Logical Reads (SQL 2008 only).
-- Logical reads relate to memory pressure
SELECT TOP ( 25 )
p.name AS [SP Name] ,
deps.total_logical_reads AS [TotalLogicalReads] ,
deps.total_logical_reads / deps.execution_count AS [AvgLogicalReads] ,
deps.execution_count ,
ISNULL(deps.execution_count / DATEDIFF(Second, deps.cached_time,
GETDATE()), 0) AS [Calls/Second] ,
deps.total_elapsed_time ,
deps.total_elapsed_time / deps.execution_count AS [avg_elapsed_time] ,
deps.cached_time
FROM sys.procedures AS p
INNER JOIN sys.dm_exec_procedure_stats
AS deps ON p.[object_id] = deps.[object_id]
WHERE deps.database_id = DB_ID()
ORDER BY deps.total_logical_reads DESC ;
Listing 3.16: Investigating logical reads performed by cached stored procedures.](https://image.slidesharecdn.com/ebookperformancetuningdavidsonford-141014034404-conversion-gate02/75/c-108-2048.jpg)
![126
Chapter 4: Transactions
• (SIU) – Shared with Intent Update – similar to an SIX lock, an SIU lock occurs
when a transaction process is currently locking a resource with a shared (S) lock, but
requires a subsequent update (U) lock
• (UIX) – Update with Intent Exclusive – as you would expect from the name,
this occurs when a resource is currently locked with an update (U) lock, but a
subsequent exclusive (X) lock is required as a part of the same transaction.
• Schema – schema locks are issued when an operation affecting the schema of the
database is running:
• (Sch-S) Schema Stability locks are issued when compiling a query on a database
• (Sch-M) Schema Modification locks are granted when the underlying database
schema is being modified by Data Definition Language queries (DDL).
Investigating locking
A single request to query or modify some data may cause multiple locks to be granted
against several resources in the database. For example, consider the UPDATE statement
below against the Production.ProductCategory table in the AdventureWorks
database, shown in Listing 4.2.
BEGIN TRANSACTION
UPDATE [Production].[ProductCategory]
SET [Name] = 'Parts'
WHERE [Name] = 'Components';
--ROLLBACK TRANSACTION
Listing 4.2: An uncommitted update of the Production table in AdventureWorks.
A query against the sys.dm_tran_locks DMV, shown in Listing 4.3, will
reveal the locks acquired in the AdventureWorks database, as a result of our
uncommitted UPDATE.](https://image.slidesharecdn.com/ebookperformancetuningdavidsonford-141014034404-conversion-gate02/75/c-126-2048.jpg)
![127
Chapter 4: Transactions
SELECT [resource_type] ,
DB_NAME([resource_database_id]) AS [Database Name] ,
CASE WHEN DTL.resource_type IN ( 'DATABASE', 'FILE', 'METADATA' )
THEN DTL.resource_type
WHEN DTL.resource_type = 'OBJECT'
THEN OBJECT_NAME(DTL.resource_associated_entity_id,
DTL.[resource_database_id])
WHEN DTL.resource_type IN ( 'KEY', 'PAGE', 'RID' )
THEN ( SELECT OBJECT_NAME([object_id])
FROM sys.partitions
WHERE sys.partitions.hobt_id =
DTL.resource_associated_entity_id
)
ELSE 'Unidentified'
END AS requested_object_name ,
[request_mode] ,
[resource_description]
FROM sys.dm_tran_locks DTL
WHERE DTL.[resource_type] <> 'DATABASE' ;
Listing 4.3: Locking due to single UPDATE statement against a user table in SQL Server.
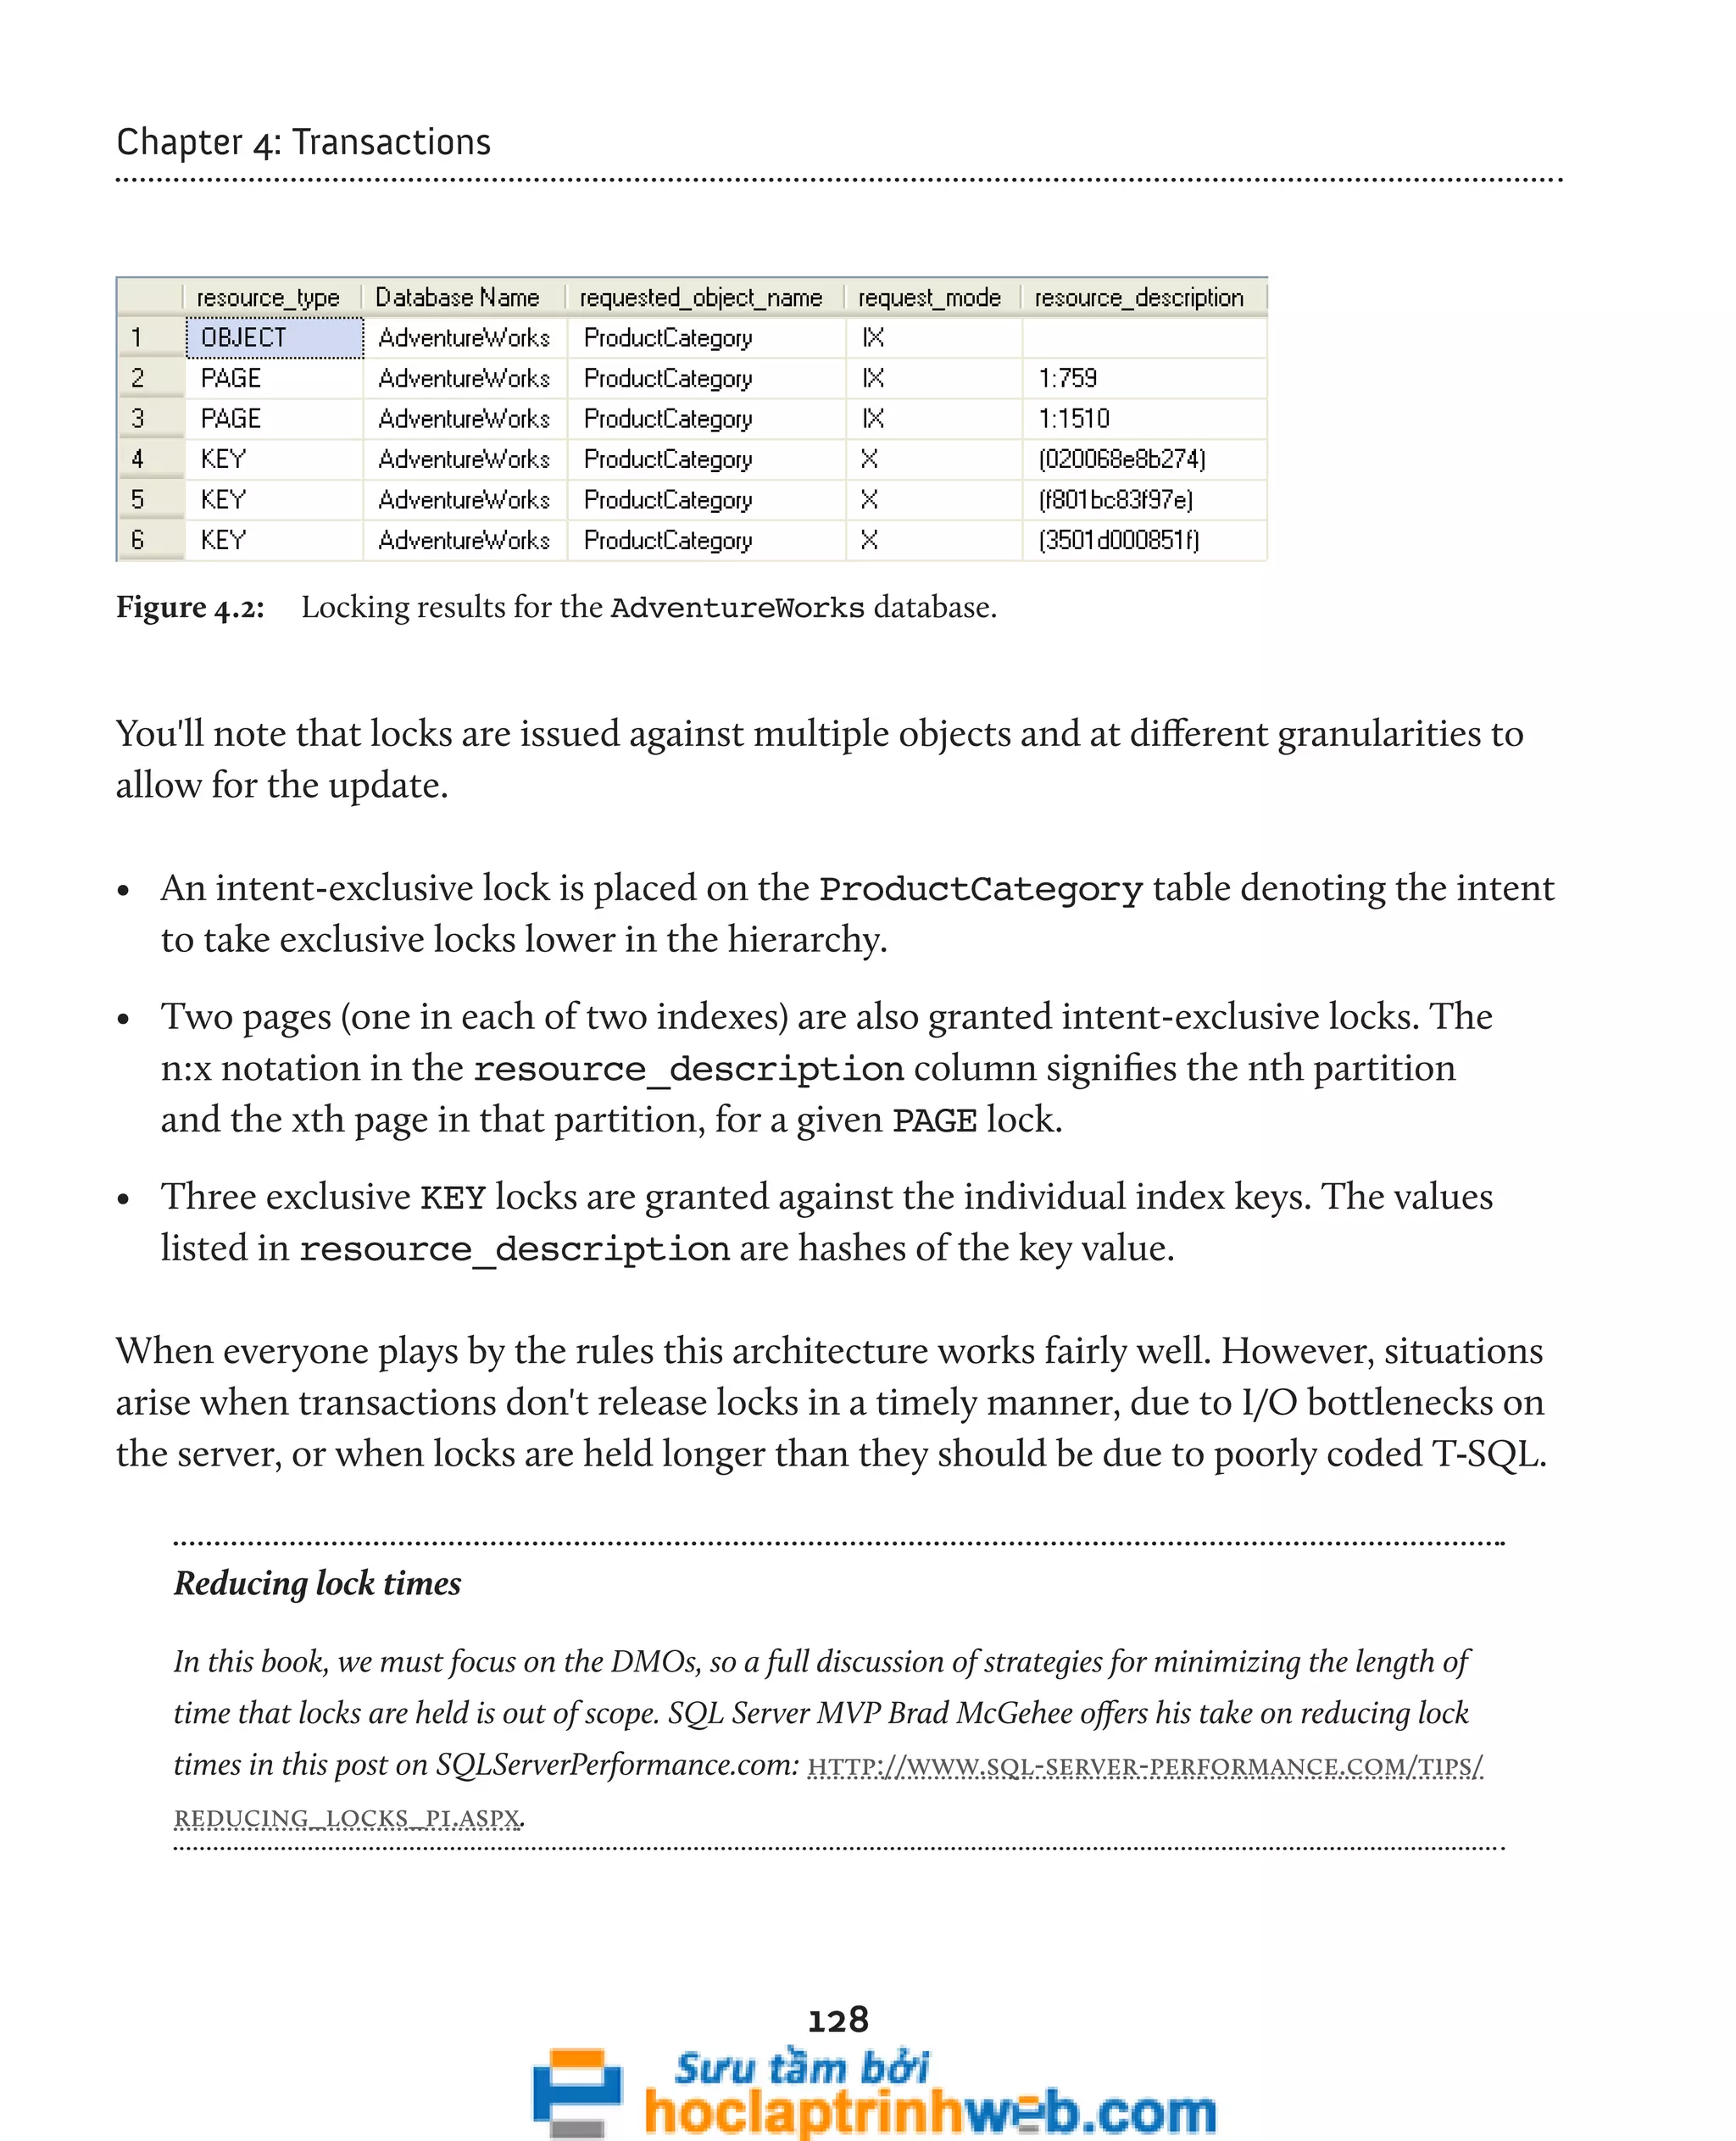
The query is actually very straightforward, but made to look a little more intimidating
by the CASE statement, where we return a value for the object name (or parent object
name, when dealing with PAGE and KEY locks, in this case) for the locked resource. The
way in which we need to do this depends on the type of lock being held. In the case of
DATABASE, FILE, or METADATA locks, the query simply returns the value for the lock
type. For OBJECT locks, the parent object is directly associated with the object_id.
For PAGE, RID, or KEY locks, we need to look up the object_id associated to the
object_id in the sys.partitions catalog view, by joining the hobt_id in that
view to the resource_associated_entity_id in sys.dm_tran_locks. Each
session on SQL Server also creates a DATABASE shared lock, which I've filtered out in the
WHERE clause.
The output of the query is shown in Figure 4.2.](https://image.slidesharecdn.com/ebookperformancetuningdavidsonford-141014034404-conversion-gate02/75/c-127-2048.jpg)
![129
Chapter 4: Transactions
If, from a second tab in SSMS, we now run a second query, shown in Listing 4.4 (having
neither committed nor rolled back the query in Listing 4.2), we'll introduce some blocking
in the AdventureWorks database.
SELECT *
FROM [Production].[ProductCategory] ;
Listing 4.4: A simple query against the ProductCategory table, which will be blocked.
We'll present a more detailed script for detecting blocking in the next section, but the one
in Listing 4.5 demonstrates the basic pattern for joining to the execution-related DMOs
to find out which sessions are involved in blocking, which login "owns" these sessions,
and what SQL statements they are executing.
SELECT DTL.[request_session_id] AS [session_id] ,
DB_NAME(DTL.[resource_database_id]) AS [Database] ,
DTL.resource_type ,
CASE WHEN DTL.resource_type IN ( 'DATABASE', 'FILE', 'METADATA' )
THEN DTL.resource_type
WHEN DTL.resource_type = 'OBJECT'
THEN OBJECT_NAME(DTL.resource_associated_entity_id,
DTL.[resource_database_id])
WHEN DTL.resource_type IN ( 'KEY', 'PAGE', 'RID' )
THEN ( SELECT OBJECT_NAME([object_id])
FROM sys.partitions
WHERE sys.partitions.hobt_id =
DTL.resource_associated_entity_id
)
ELSE 'Unidentified'
END AS [Parent Object] ,
DTL.request_mode AS [Lock Type] ,
DTL.request_status AS [Request Status] ,
DER.[blocking_session_id] ,
DES.[login_name] ,
CASE DTL.request_lifetime
WHEN 0 THEN DEST_R.TEXT
ELSE DEST_C.TEXT](https://image.slidesharecdn.com/ebookperformancetuningdavidsonford-141014034404-conversion-gate02/75/c-129-2048.jpg)
![130
Chapter 4: Transactions
END AS [Statement]
FROM sys.dm_tran_locks DTL
LEFT JOIN sys.[dm_exec_requests] DER
ON DTL.[request_session_id] = DER.[session_id]
INNER JOIN sys.dm_exec_sessions DES
ON DTL.request_session_id = DES.[session_id]
INNER JOIN sys.dm_exec_connections DEC
ON DTL.[request_session_id] = DEC.[most_recent_session_id]
OUTER APPLY sys.dm_exec_sql_text(DEC.[most_recent_sql_handle])
AS DEST_C
OUTER APPLY sys.dm_exec_sql_text(DER.sql_handle) AS DEST_R
WHERE DTL.[resource_database_id] = DB_ID()
AND DTL.[resource_type] NOT IN ( 'DATABASE', 'METADATA' )
ORDER BY DTL.[request_session_id] ;
Listing 4.5: Which sessions are causing blocking and what statement are they running?
The result set returned is shown in Figure 4.3.
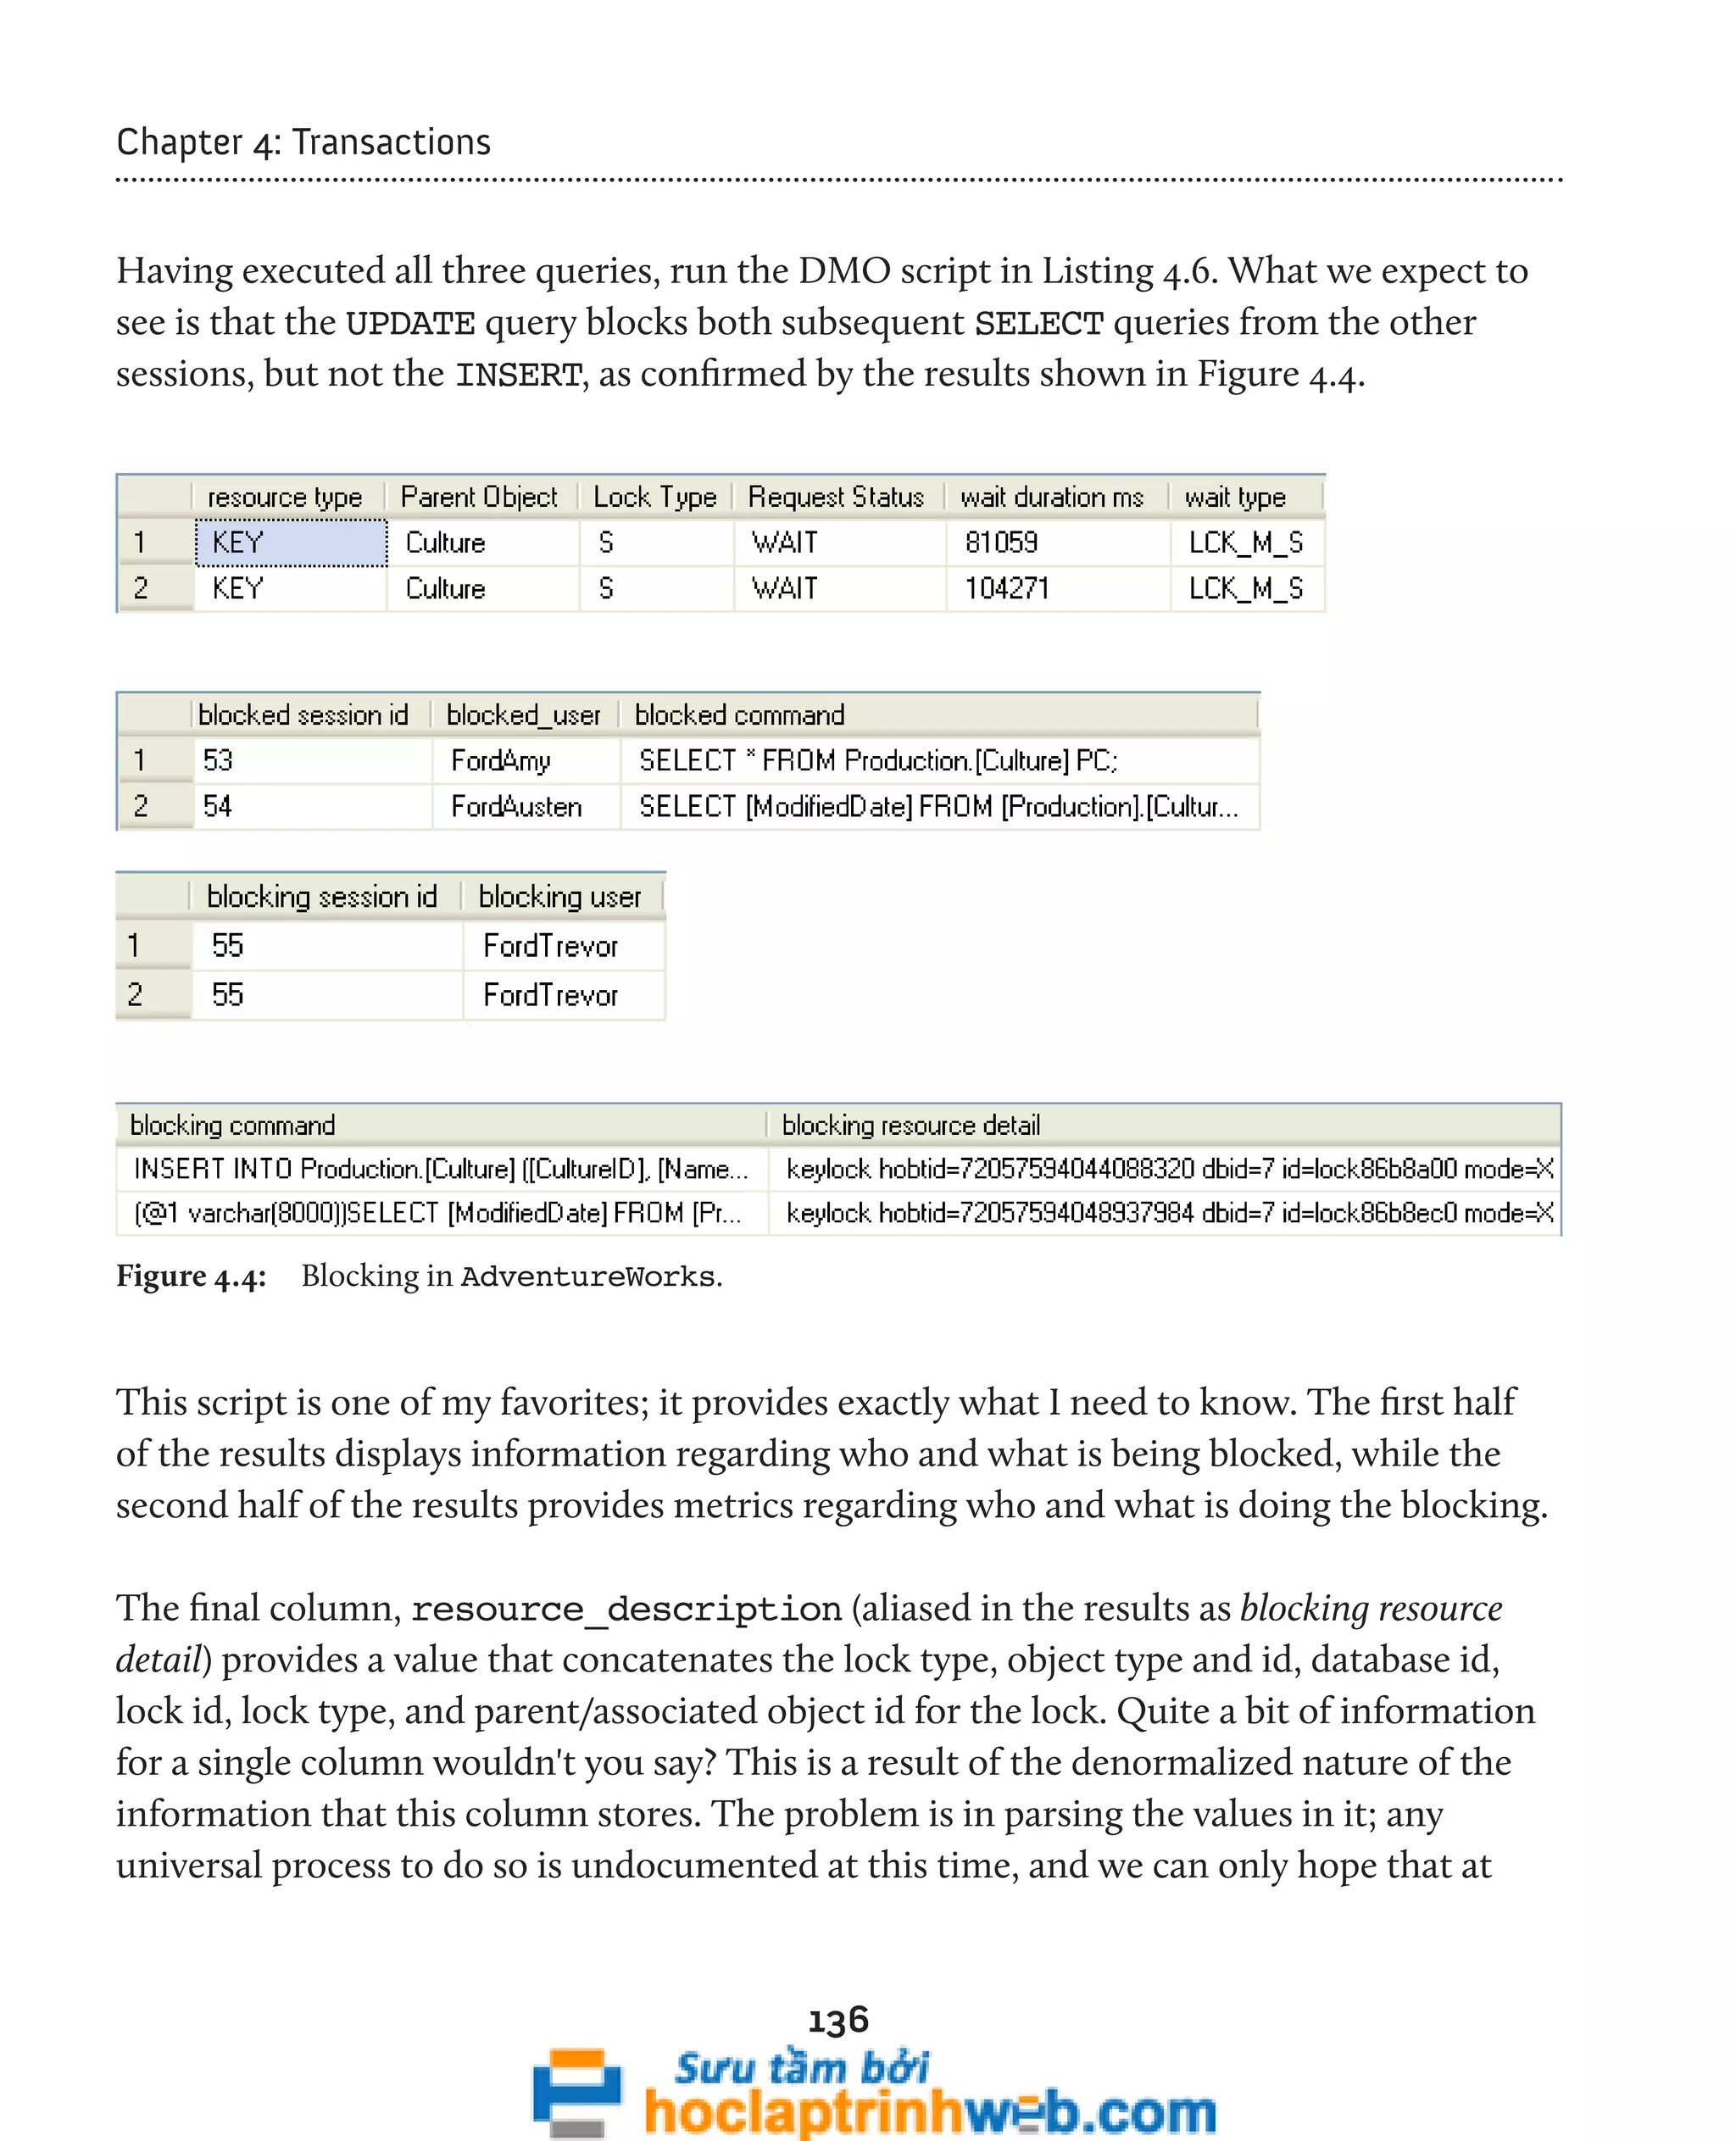
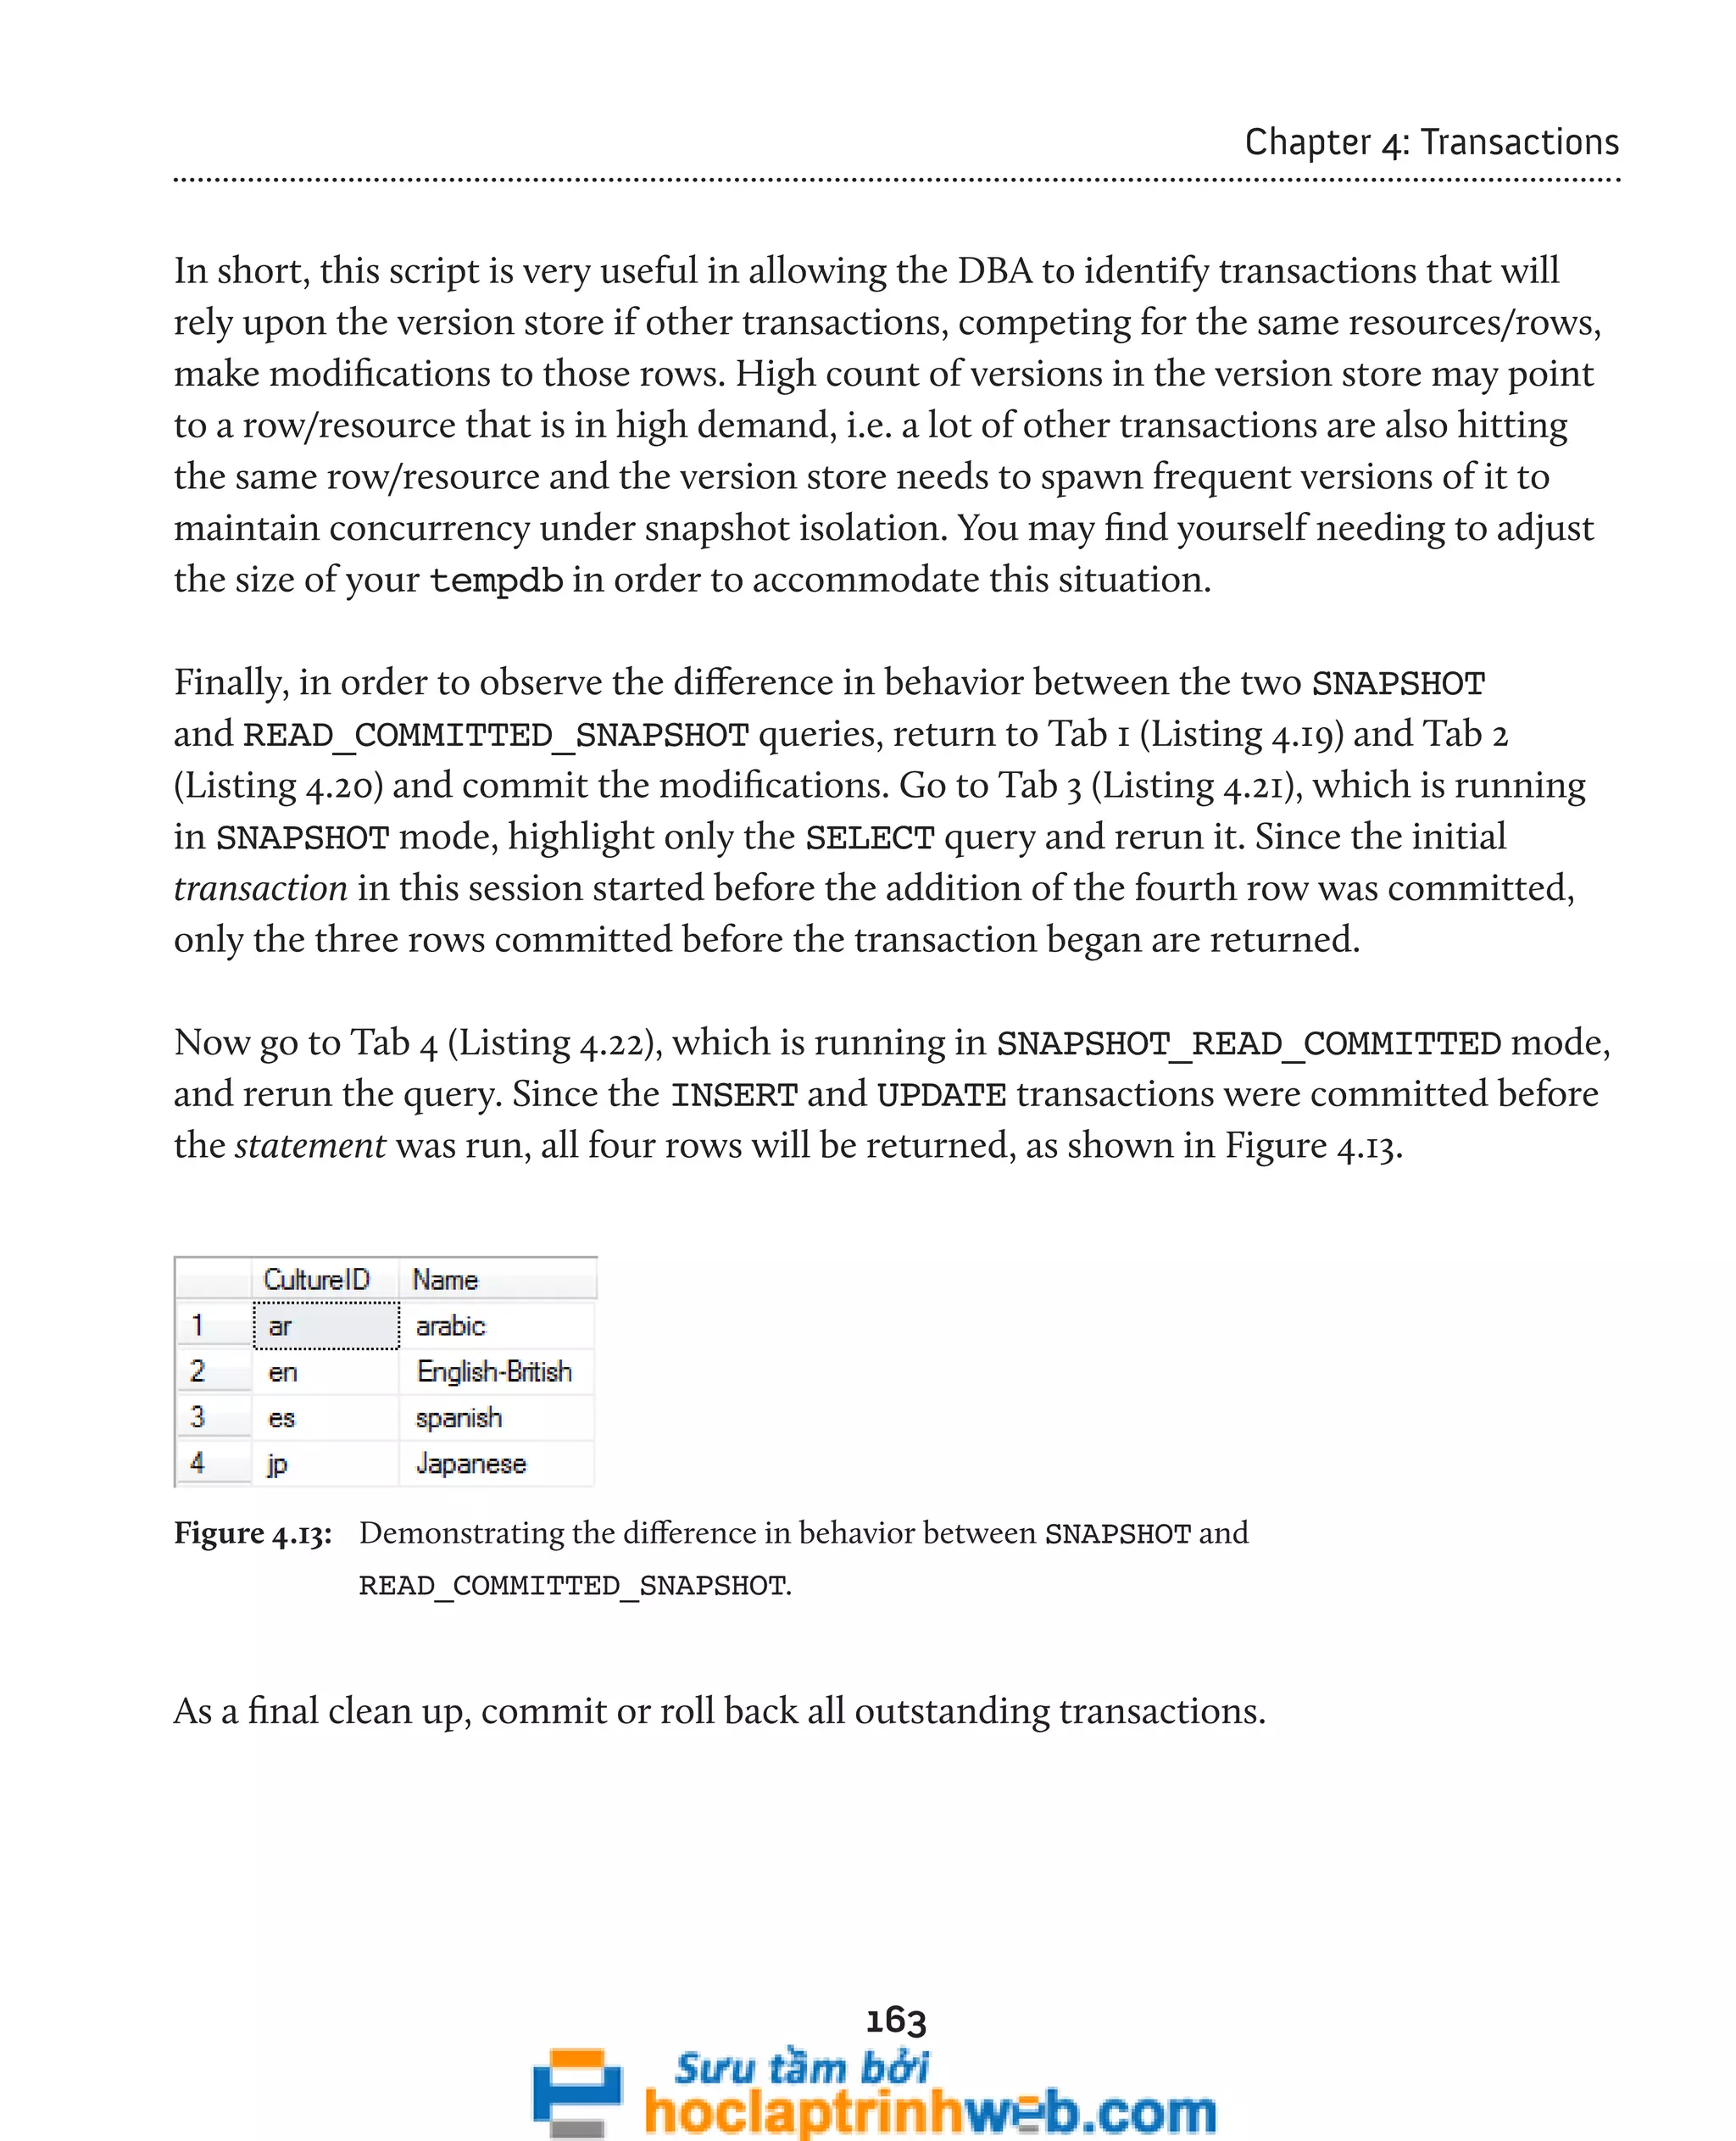
Figure 4.3: Locking and blocking results in AdventureWorks, based upon two sample transactions.](https://image.slidesharecdn.com/ebookperformancetuningdavidsonford-141014034404-conversion-gate02/75/c-130-2048.jpg)

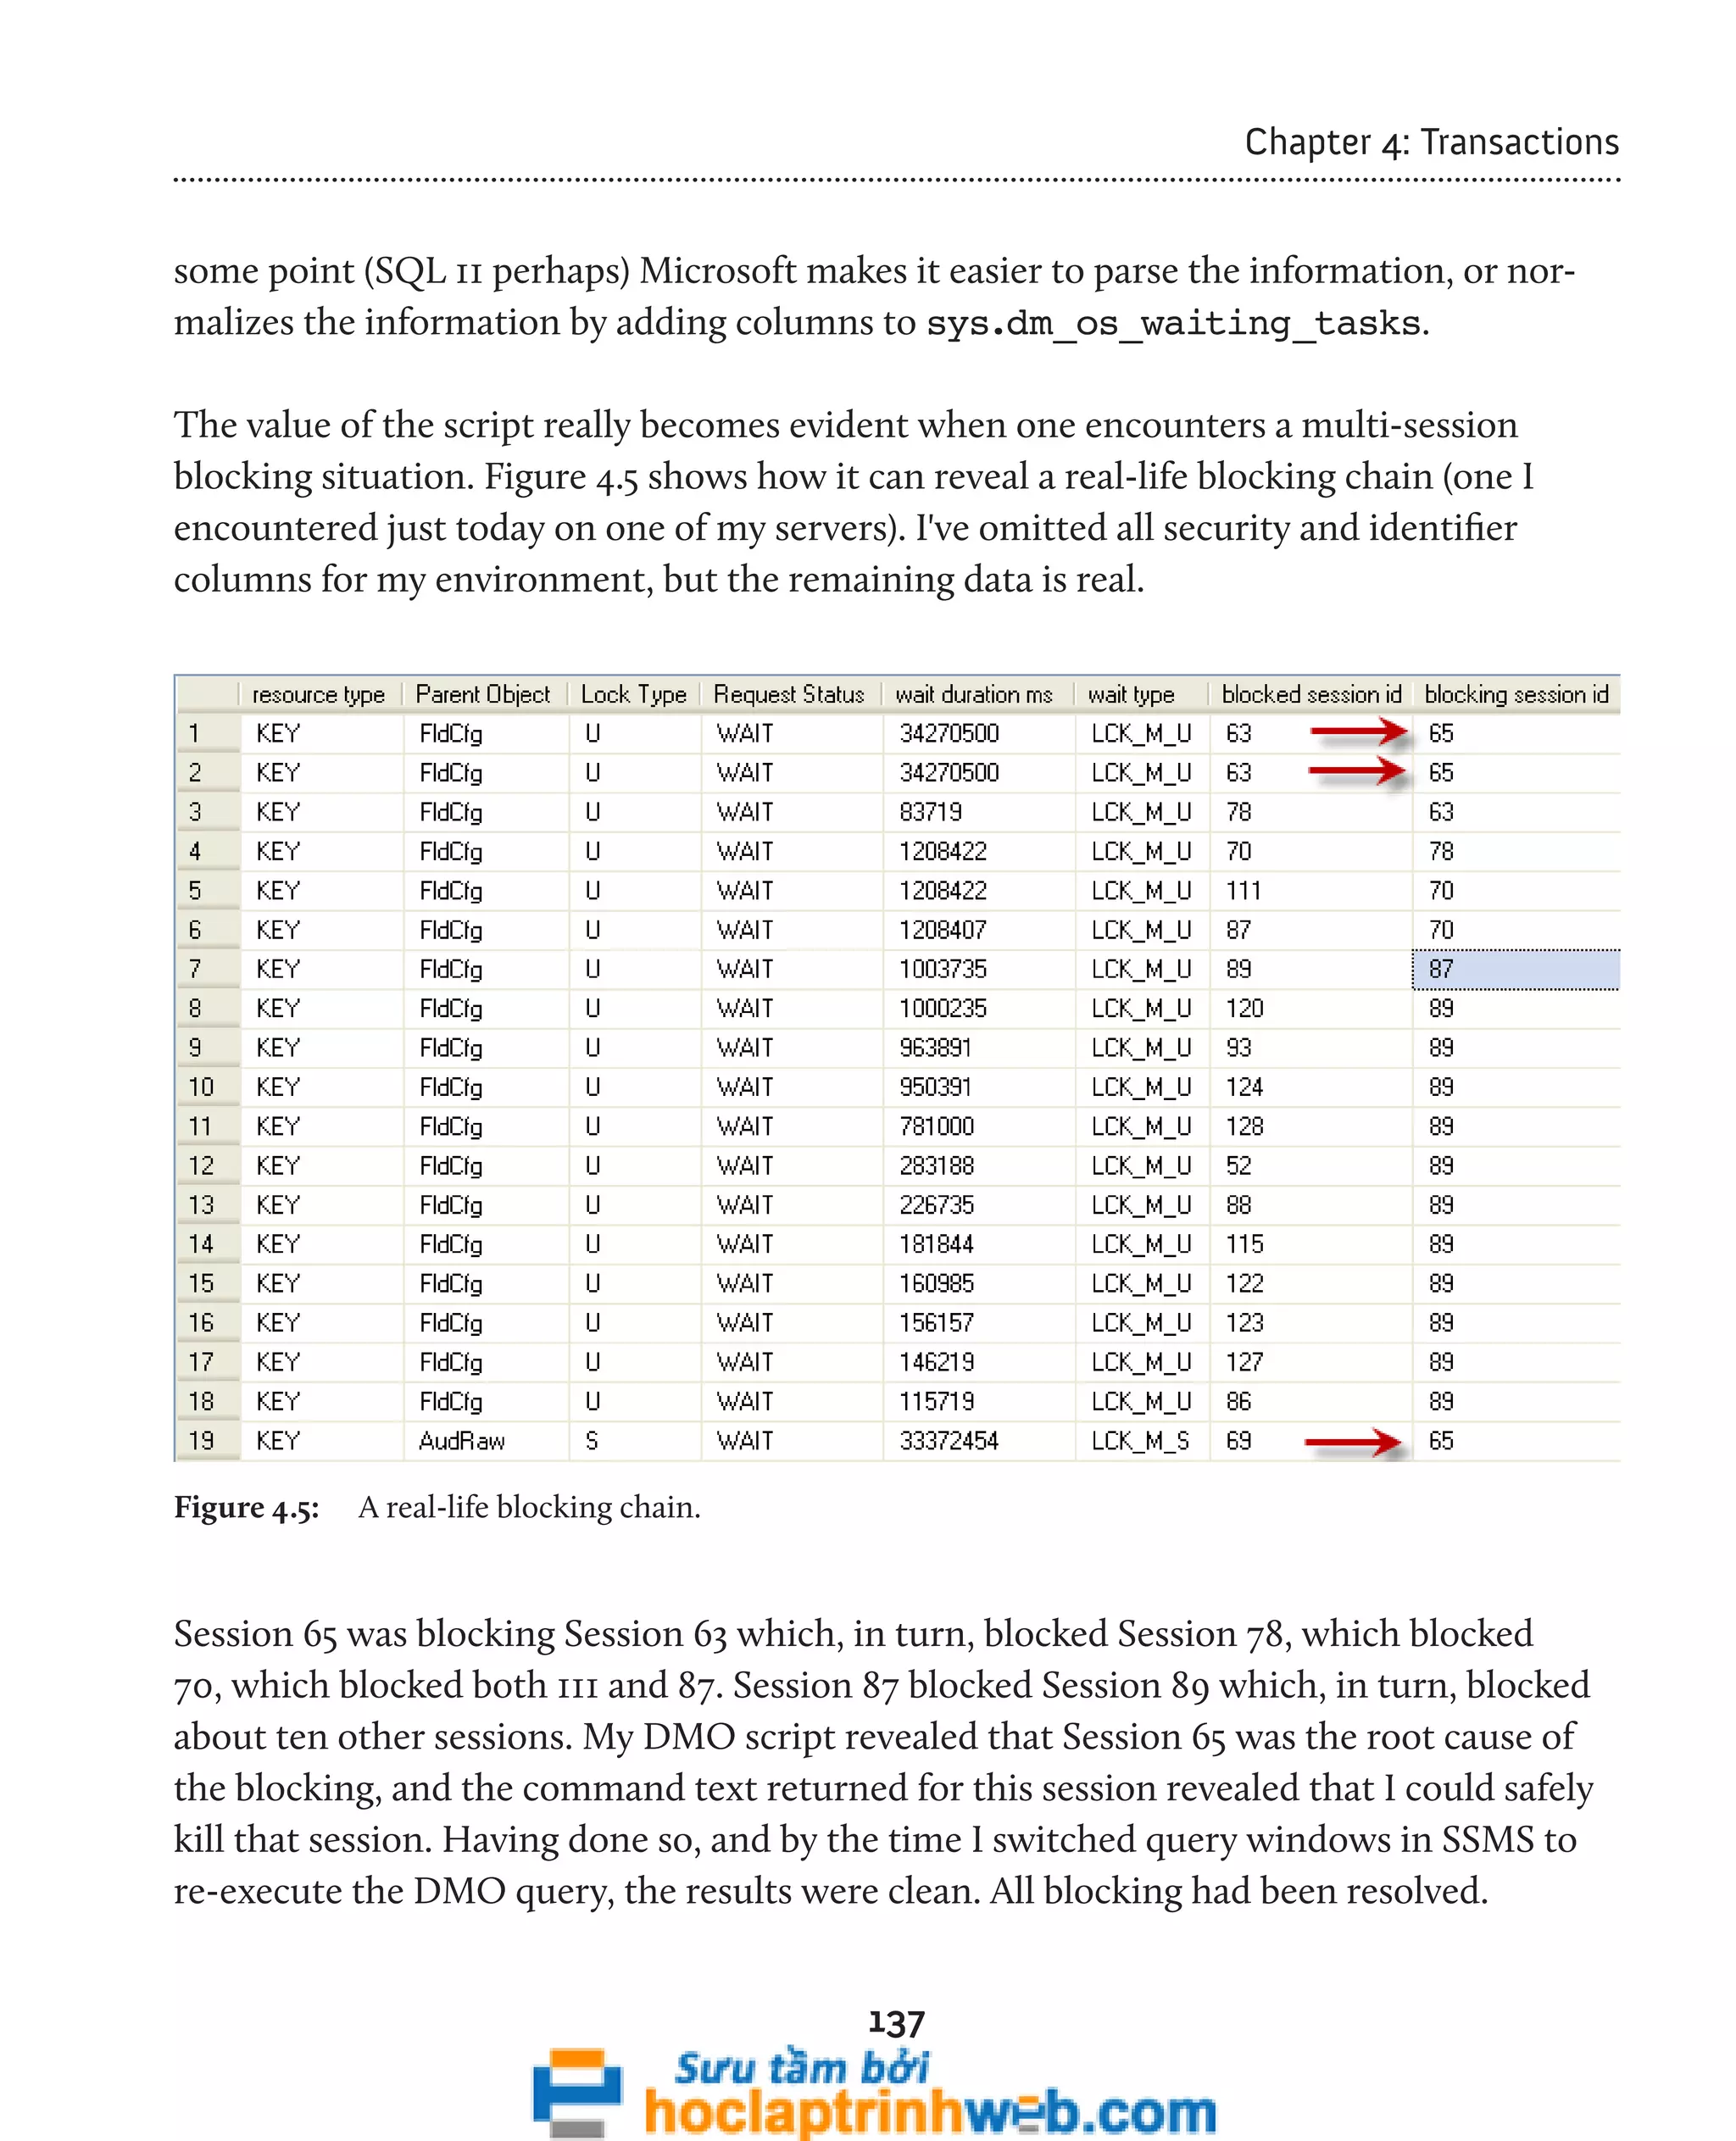
![133
Chapter 4: Transactions
When investigating blocking issues as a DBA, what we really need is a clear, single
page of data that shows the transactions involved in blocking, including the actual SQL
statements within those transactions, the sessions to which these transactions belong,
and the users who own these sessions.
In order to achieve this, we can start our investigation at the sys.dm_os_
waiting_tasks DMV. This DMV returns one row for each task that is waiting for a
resource to become available before proceeding (i.e. is blocked). Armed with a session_
id for any tasks that are currently waiting, we can use the resource_address column
in this DMV to join back to the lock_owner_address column in the sys.dm_tran_
locks DMV, and so relate the waiting tasks information to information on the locks
that are being held. Initially, it might seem more logical to join on session_id rather
than resource_address, but remember that the goal is to determine what resource
contention is occurring; what resource is locked and therefore causing waits for other
sessions that need to acquire locks on the object in contention.
From here, we can join to other session/transaction-related views in order to arrive,
ultimately, at a big picture overview of locks that may be causing blocking problems, the
sessions and statements that caused those locks to be acquired and those that are blocked
as a result. The resulting script, shown in Listing 4.6, will present both the blocking and
blocked requests on the same row, and so provide a very easy way to spot, analyze, and
diagnose blocking issues.
USE [AdventureWorks] ;
GO
SELECT DTL.[resource_type] AS [resource type] ,
CASE WHEN DTL.[resource_type] IN ( 'DATABASE', 'FILE', 'METADATA' )
THEN DTL.[resource_type]
WHEN DTL.[resource_type] = 'OBJECT'
THEN OBJECT_NAME(DTL.resource_associated_entity_id)
WHEN DTL.[resource_type] IN ( 'KEY', 'PAGE', 'RID' )
THEN ( SELECT OBJECT_NAME([object_id])
FROM sys.partitions
WHERE sys.partitions.[hobt_id] =
DTL.[resource_associated_entity_id]](https://image.slidesharecdn.com/ebookperformancetuningdavidsonford-141014034404-conversion-gate02/75/c-133-2048.jpg)
![134
Chapter 4: Transactions
)
ELSE 'Unidentified'
END AS [Parent Object] ,
DTL.[request_mode] AS [Lock Type] ,
DTL.[request_status] AS [Request Status] ,
DOWT.[wait_duration_ms] AS [wait duration ms] ,
DOWT.[wait_type] AS [wait type] ,
DOWT.[session_id] AS [blocked session id] ,
DES_blocked.[login_name] AS [blocked_user] ,
SUBSTRING(dest_blocked.text, der.statement_start_offset / 2,
( CASE WHEN der.statement_end_offset = -1
THEN DATALENGTH(dest_blocked.text)
ELSE der.statement_end_offset
END - der.statement_start_offset ) / 2
AS [blocked_command] ,
DOWT.[blocking_session_id] AS [blocking session id] ,
DES_blocking.[login_name] AS [blocking user] ,
DEST_blocking.[text] AS [blocking command] ,
DOWT.resource_description AS [blocking resource detail]
FROM sys.dm_tran_locks DTL
INNER JOIN sys.dm_os_waiting_tasks DOWT
ON DTL.lock_owner_address = DOWT.resource_address
INNER JOIN sys.[dm_exec_requests] DER
ON DOWT.[session_id] = DER.[session_id]
INNER JOIN sys.dm_exec_sessions DES_blocked
ON DOWT.[session_id] = DES_Blocked.[session_id]
INNER JOIN sys.dm_exec_sessions DES_blocking
ON DOWT.[blocking_session_id] = DES_Blocking.[session_id]
INNER JOIN sys.dm_exec_connections DEC
ON DTL.[request_session_id] = DEC.[most_recent_session_id]
CROSS APPLY sys.dm_exec_sql_text(DEC.[most_recent_sql_handle])
AS DEST_Blocking
CROSS APPLY sys.dm_exec_sql_text(DER.sql_handle) AS DEST_Blocked
WHERE DTL.[resource_database_id] = DB_ID()
Listing 4.6: Investigating locking and blocking based on waiting tasks.
To see it in action, we'll set up some activity on the Production.Culture table of the
AdventureWorks database. It's a narrow table with three columns and two indexes, one
clustered index on the primary key and one unique non-clustered index on the Name](https://image.slidesharecdn.com/ebookperformancetuningdavidsonford-141014034404-conversion-gate02/75/c-134-2048.jpg)
![140
Chapter 4: Transactions
BEGIN TRANSACTION
SELECT DTST.[session_id] ,
DTST.[transaction_id] ,
DTST.[is_user_transaction]
FROM sys.[dm_tran_session_transactions] AS DTST
WHERE DTST.[session_id] = @@SPID
ORDER BY DTST.[transaction_id]
COMMIT
session_id transaction_id is_user_transaction
----------- -------------------- -------------------
56 1550381 1
(1 row(s) affected)
Listing 4.10: Basic query against sys.dm_tran_session_transactions for transactions
on the current session.
sys.dm_tran_active_transactions
The sys.dm_tran_active_transactions DMV returns a list of all transactions
that are active at the time the query is executed. This view operates at the scope of the
entire SQL instance, meaning that results are returned for all databases on the instance.
Since this view provides a point-in-time snapshot of currently active transactions, the
results will change each time the query is executed, depending upon the state of the
individual transactions.
Identification columns returned by this view are transaction_id, which uniquely
identifies a transaction across the entire SQL Server instance, and name, which is the
name of the transaction. I consider it a good habit, if not a best practice, to name
transactions, as the following code snippet demonstrates:
BEGIN TRANSACTION Trans_Name
--Some SQL Code goes here
COMMIT TRANSACTION Trans_Name](https://image.slidesharecdn.com/ebookperformancetuningdavidsonford-141014034404-conversion-gate02/75/c-140-2048.jpg)
![141
Chapter 4: Transactions
In this example, Trans_Name will be returned as the value for the name column for
this record in sys.dm_tran_active_transactions, assuming the transaction is still
active when you issue a query against this DMV. If the transaction is not explicitly named,
this column will be populated by values such as SELECT, INSERT, UPDATE, DELETE in the
case of those Data Modification Language (DML) transactions. You'll also see Worktable
as a value when returning results from tempdb for the hashing and temp/intermediate
transactional processing that occurs there. Finally, you will see the value of DTCXACT for
unnamed distributed transactions.
This DMV also returns the time that the transaction was started (transaction_
begin_time), as well as columns that identify the type (transaction_type) and state
(transaction_state, or dtc_state for distributed transactions). These type and state
columns return integer values, the meanings of which are deciphered in the sample query
shown in Listing 4.11.
SELECT DTAT.transaction_id ,
DTAT.[name] ,
DTAT.transaction_begin_time ,
CASE DTAT.transaction_type
WHEN 1 THEN 'Read/write'
WHEN 2 THEN 'Read-only'
WHEN 3 THEN 'System'
WHEN 4 THEN 'Distributed'
END AS transaction_type ,
CASE DTAT.transaction_state
WHEN 0 THEN 'Not fully initialized'
WHEN 1 THEN 'Initialized, not started'
WHEN 2 THEN 'Active'
WHEN 3 THEN 'Ended' -- only applies to read-only transactions
WHEN 4 THEN 'Commit initiated'-- distributed transactions only
WHEN 5 THEN 'Prepared, awaiting resolution'
WHEN 6 THEN 'Committed'
WHEN 7 THEN 'Rolling back'
WHEN 8 THEN 'Rolled back'
END AS transaction_state ,
CASE DTAT.dtc_state
WHEN 1 THEN 'Active'
WHEN 2 THEN 'Prepared'](https://image.slidesharecdn.com/ebookperformancetuningdavidsonford-141014034404-conversion-gate02/75/c-141-2048.jpg)
![142
Chapter 4: Transactions
WHEN 3 THEN 'Committed'
WHEN 4 THEN 'Aborted'
WHEN 5 THEN 'Recovered'
END AS dtc_state
FROM sys.dm_tran_active_transactions DTAT
INNER JOIN sys.dm_tran_session_transactions DTST
ON DTAT.transaction_id = DTST.transaction_id
WHERE [DTST].[is_user_transaction] = 1
ORDER BY DTAT.transaction_begin_time
Listing 4.11: Querying sys.dm_db_tran_active_transactions.
Notice that we are able to isolate user transactions via a join back to sys.dm_tran_
session_transactions, filtering on the is_user_transaction column. The results
of this query are shown in Figure 4.6.
Figure 4.6: Currently active user transactions.
Had we not filtered out transactions associated with system sessions, we'd also have
seen results for hash work being performed in tempdb, similar to the record shown in
Figure 4.7.
Figure 4.7: Worktable transaction records in sys.dm_db_tran_active_transactions.
Queries against sys.dm_tran_active_transactions will often return a great num-ber
of results that look like this, since these worktables are created and destroyed all the](https://image.slidesharecdn.com/ebookperformancetuningdavidsonford-141014034404-conversion-gate02/75/c-142-2048.jpg)
![146
Chapter 4: Transactions
Assessing transaction log impact
The sys.dm_tran_database_transactions DMV is the only one that provides
insight into the effects of user activity on the database transaction logs. Using this
DMV, and joining across to other transaction-related and execution-related DMVs, as
described previously, we can develop a query, shown in Listing 4.14, which will identify
all active transactions and their physical effect on the databases' transaction logs. This is
especially useful when seeking out transactions that may be causing explosive transaction
log growth.
SELECT DTST.[session_id],
DES.[login_name] AS [Login Name],
DB_NAME (DTDT.database_id) AS [Database],
DTDT.[database_transaction_begin_time] AS [Begin Time],
-- DATEDIFF(ms,DTDT.[database_transaction_begin_time], GETDATE()) AS [Duration
ms],
CASE DTAT.transaction_type
WHEN 1 THEN 'Read/write'
WHEN 2 THEN 'Read-only'
WHEN 3 THEN 'System'
WHEN 4 THEN 'Distributed'
END AS [Transaction Type],
CASE DTAT.transaction_state
WHEN 0 THEN 'Not fully initialized'
WHEN 1 THEN 'Initialized, not started'
WHEN 2 THEN 'Active'
WHEN 3 THEN 'Ended'
WHEN 4 THEN 'Commit initiated'
WHEN 5 THEN 'Prepared, awaiting resolution'
WHEN 6 THEN 'Committed'
WHEN 7 THEN 'Rolling back'
WHEN 8 THEN 'Rolled back'
END AS [Transaction State],
DTDT.[database_transaction_log_record_count] AS [Log Records],
DTDT.[database_transaction_log_bytes_used] AS [Log Bytes Used],
DTDT.[database_transaction_log_bytes_reserved] AS [Log Bytes RSVPd],
DEST.[text] AS [Last Transaction Text],
DEQP.[query_plan] AS [Last Query Plan]
FROM sys.dm_tran_database_transactions DTDT](https://image.slidesharecdn.com/ebookperformancetuningdavidsonford-141014034404-conversion-gate02/75/c-146-2048.jpg)
![147
Chapter 4: Transactions
INNER JOIN sys.dm_tran_session_transactions DTST
ON DTST.[transaction_id] = DTDT.[transaction_id]
INNER JOIN sys.[dm_tran_active_transactions] DTAT
ON DTST.[transaction_id] = DTAT.[transaction_id]
INNER JOIN sys.[dm_exec_sessions] DES
ON DES.[session_id] = DTST.[session_id]
INNER JOIN sys.dm_exec_connections DEC
ON DEC.[session_id] = DTST.[session_id]
LEFT JOIN sys.dm_exec_requests DER
ON DER.[session_id] = DTST.[session_id]
CROSS APPLY sys.dm_exec_sql_text (DEC.[most_recent_sql_handle]) AS DEST
OUTER APPLY sys.dm_exec_query_plan (DER.[plan_handle]) AS DEQP
ORDER BY DTDT.[database_transaction_log_bytes_used] DESC;
-- ORDER BY [Duration ms] DESC;
Listing 4.14: Transaction log impact of active transactions.
Note the use of OUTER APPLY to join to sys.dm_exec_query_plan. The OUTER
APPLY functions as a hybrid of OUTER JOIN and CROSS APPLY in that it will return NULL
if no value is returned by the function. This prevents the entire row from being excluded
from the result set in cases where a plan does not exist for the request (the request may
no longer exist in sys.dm_exec_requests by the time Listing 4.14 is run). Sample
output from this listing is shown in Figure 4.8.
Figure 4.8: Transactions writing heavily to the transaction log.](https://image.slidesharecdn.com/ebookperformancetuningdavidsonford-141014034404-conversion-gate02/75/c-147-2048.jpg)
![151
Chapter 4: Transactions
SELECT SD.[name] ,
SD.snapshot_isolation_state_desc ,
SD.is_read_committed_snapshot_on
FROM sys.databases SD
WHERE SD.snapshot_isolation_state_desc = 'ON'
Listing 4.18: Which databases are using snapshot isolation?
Sample output is shown in Figure 4.9.
Figure 4.9: Master and msdb databases always run under snapshot isolation.
Note that this query will return a minimum of two rows, since both master and msdb
run under SNAPSHOT isolation. Concurrency is extremely important in these two system
databases because so many crucial actions require rapid reads against them, in order
to keep SQL Server and SQL Server Agent running. For example, SQL Server accesses
the master database every time it needs to perform a restore, check rights and validate
a login's password, or maintain mirroring or log shipping. If it were forced to wait for
shared read locks to be released before proceeding, SQL Server would grind to a halt!
Investigating snapshot isolation
While the use of snapshot isolation can be beneficial in terms of improving the
concurrency, its use does, of course, lead to increased storage requirements, and higher
traffic in tempdb. It is important to be able to investigate the effects on tempdb and to](https://image.slidesharecdn.com/ebookperformancetuningdavidsonford-141014034404-conversion-gate02/75/c-151-2048.jpg)
![156
Chapter 4: Transactions
Current snapshot activity
To provide a quick demonstration of how snapshot isolation works, and how to track
current activity using the DMOs, let's create a small test database called DMV, containing
an inexact copy of the Production.Culture table from the AdventureWorks
database, with only three rows.
CREATE TABLE [dbo].[Culture]
(
[CultureID] [nchar](6) NOT NULL ,
[Name] NVARCHAR(50) NOT NULL ,
[ModifiedDate] [datetime] NOT NULL ,
CONSTRAINT [PK_Culture_CultureID] PRIMARY KEY CLUSTERED
( [CultureID] ASC )
WITH ( PAD_INDEX = OFF, STATISTICS_NORECOMPUTE = OFF,
IGNORE_DUP_KEY = OFF, ALLOW_ROW_LOCKS = ON,
ALLOW_PAGE_LOCKS = ON ) ON [PRIMARY]
)
ON [PRIMARY]
GO
Listing 4.19: Creating the sample table.
The first step is to enable snapshot isolation for the DMV database, as shown in
Listing 4.20.
-- Specify that snapshot isolation is enabled
-- does not affect the default behavior.
ALTER DATABASE DMV SET ALLOW_SNAPSHOT_ISOLATION ON ;
GO
-- READ_COMMITTED_SNAPSHOT becomes the default isolation level.
ALTER DATABASE DMV SET READ_COMMITTED_SNAPSHOT ON ;
GO
Listing 4.20: Enabling snapshot isolation in the DMV database.](https://image.slidesharecdn.com/ebookperformancetuningdavidsonford-141014034404-conversion-gate02/75/c-156-2048.jpg)
![157
Chapter 4: Transactions
Open a tab in SSMS that queries the Culture table, starts a transaction that updates a
row in the table, and keeps the transaction open.
USE DMV ;
GO
SELECT CultureID ,
Name
FROM dbo.Culture ;
BEGIN TRANSACTION
UPDATE dbo.[Culture]
SET [Name] = 'English-British'
WHERE [Name] = 'English' ;
-- COMMIT ;
-- ROLLBACK;
Listing 4.21: Tab 1, query then update the Culture table.
Open a second tab in SSMS and start a transaction that inserts one more row into the
table, and keep the transaction open.
USE DMV ;
GO
BEGIN TRANSACTION ;
INSERT INTO dbo.[Culture] ([CultureID], [Name], [ModifiedDate])
VALUES ('jp', 'Japanese', '2010-08-01') ;
-- COMMIT ;
Listing 4.22: Tab 2, an open transaction that inserts a row into the Culture table.
A transaction running with an isolation level such as REPEATABLE READ will be blocked
if some of the data it needs to read is locked. However, under SNAPSHOT isolation mode,](https://image.slidesharecdn.com/ebookperformancetuningdavidsonford-141014034404-conversion-gate02/75/c-157-2048.jpg)

![159
Chapter 4: Transactions
FROM dbo.Culture ;
-- COMMIT;
Listing 4.24: Tab 4, a query using READ_COMMITTED_SNAPSHOT isolation.
So far, the queries return exactly the same results under either SNAPSHOT or READ_
COMMITTED_SNAPSHOT mode. At this point, let's investigate current snapshot activity
using our DMOs. The first simple query we can run is simply to get a count of currently
active snapshots, from the sys.dm_tran_transactions_snapshot DMV, as shown
in Listing 4.25.
SELECT COUNT([transaction_sequence_num]) AS [snapshot transaction count]
FROM sys.dm_tran_transactions_snapshot ;
Listing 4.25: A count of currently active snapshot transactions.
This returns a snapshot transaction count of two, since our SNAPSHOT query in Listing
4.5 relies on the ultimate result of our two open transactions in Listings 4.21 (Tab 1) and
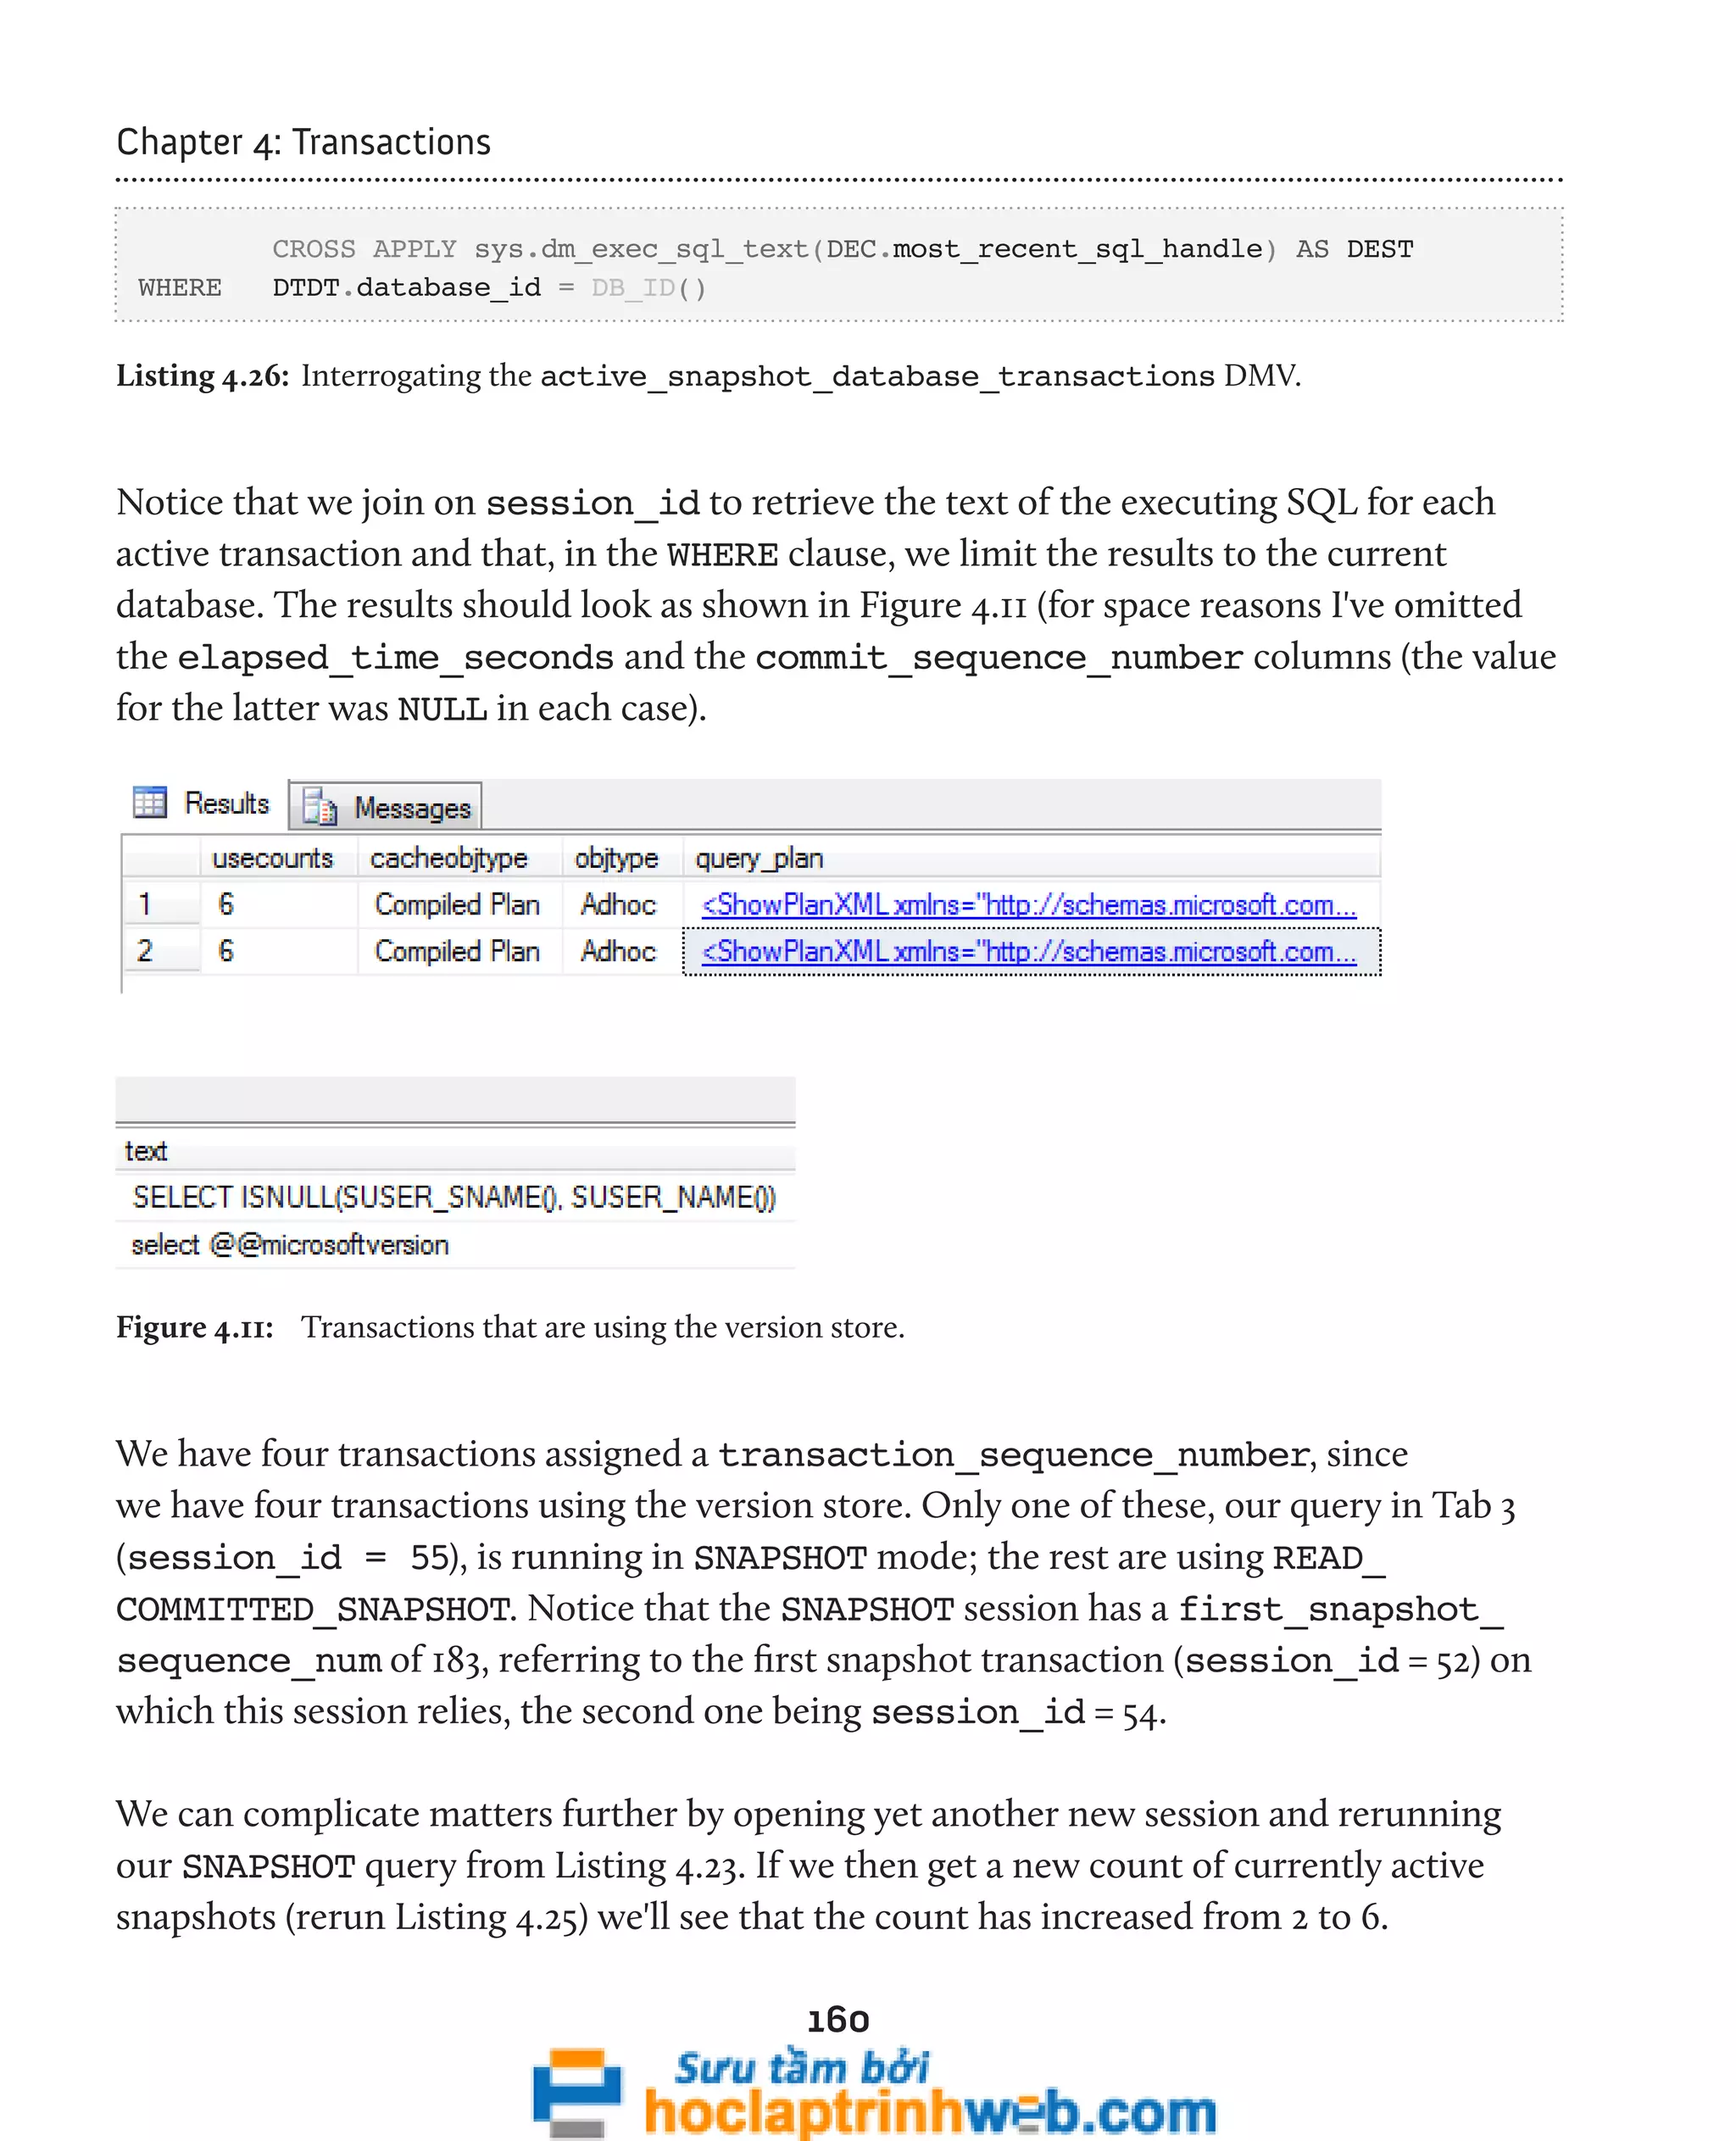
4.22 (Tab 2). Next, let's interrogate the active_snapshot_database_transactions
DMV, as shown in Listing 4.26.
SELECT DTASDT.transaction_id ,
DTASDT.session_id ,
DTASDT.transaction_sequence_num ,
DTASDT.first_snapshot_sequence_num ,
DTASDT.commit_sequence_num ,
DTASDT.is_snapshot ,
DTASDT.elapsed_time_seconds ,
DEST.text AS [command text]
FROM sys.dm_tran_active_snapshot_database_transactions DTASDT
INNER JOIN sys.dm_exec_connections DEC
ON DTASDT.session_id = DEC.most_recent_session_id
INNER JOIN sys.dm_tran_database_transactions DTDT
ON DTASDT.transaction_id = DTDT.transaction_id](https://image.slidesharecdn.com/ebookperformancetuningdavidsonford-141014034404-conversion-gate02/75/c-159-2048.jpg)
![161
Chapter 4: Transactions
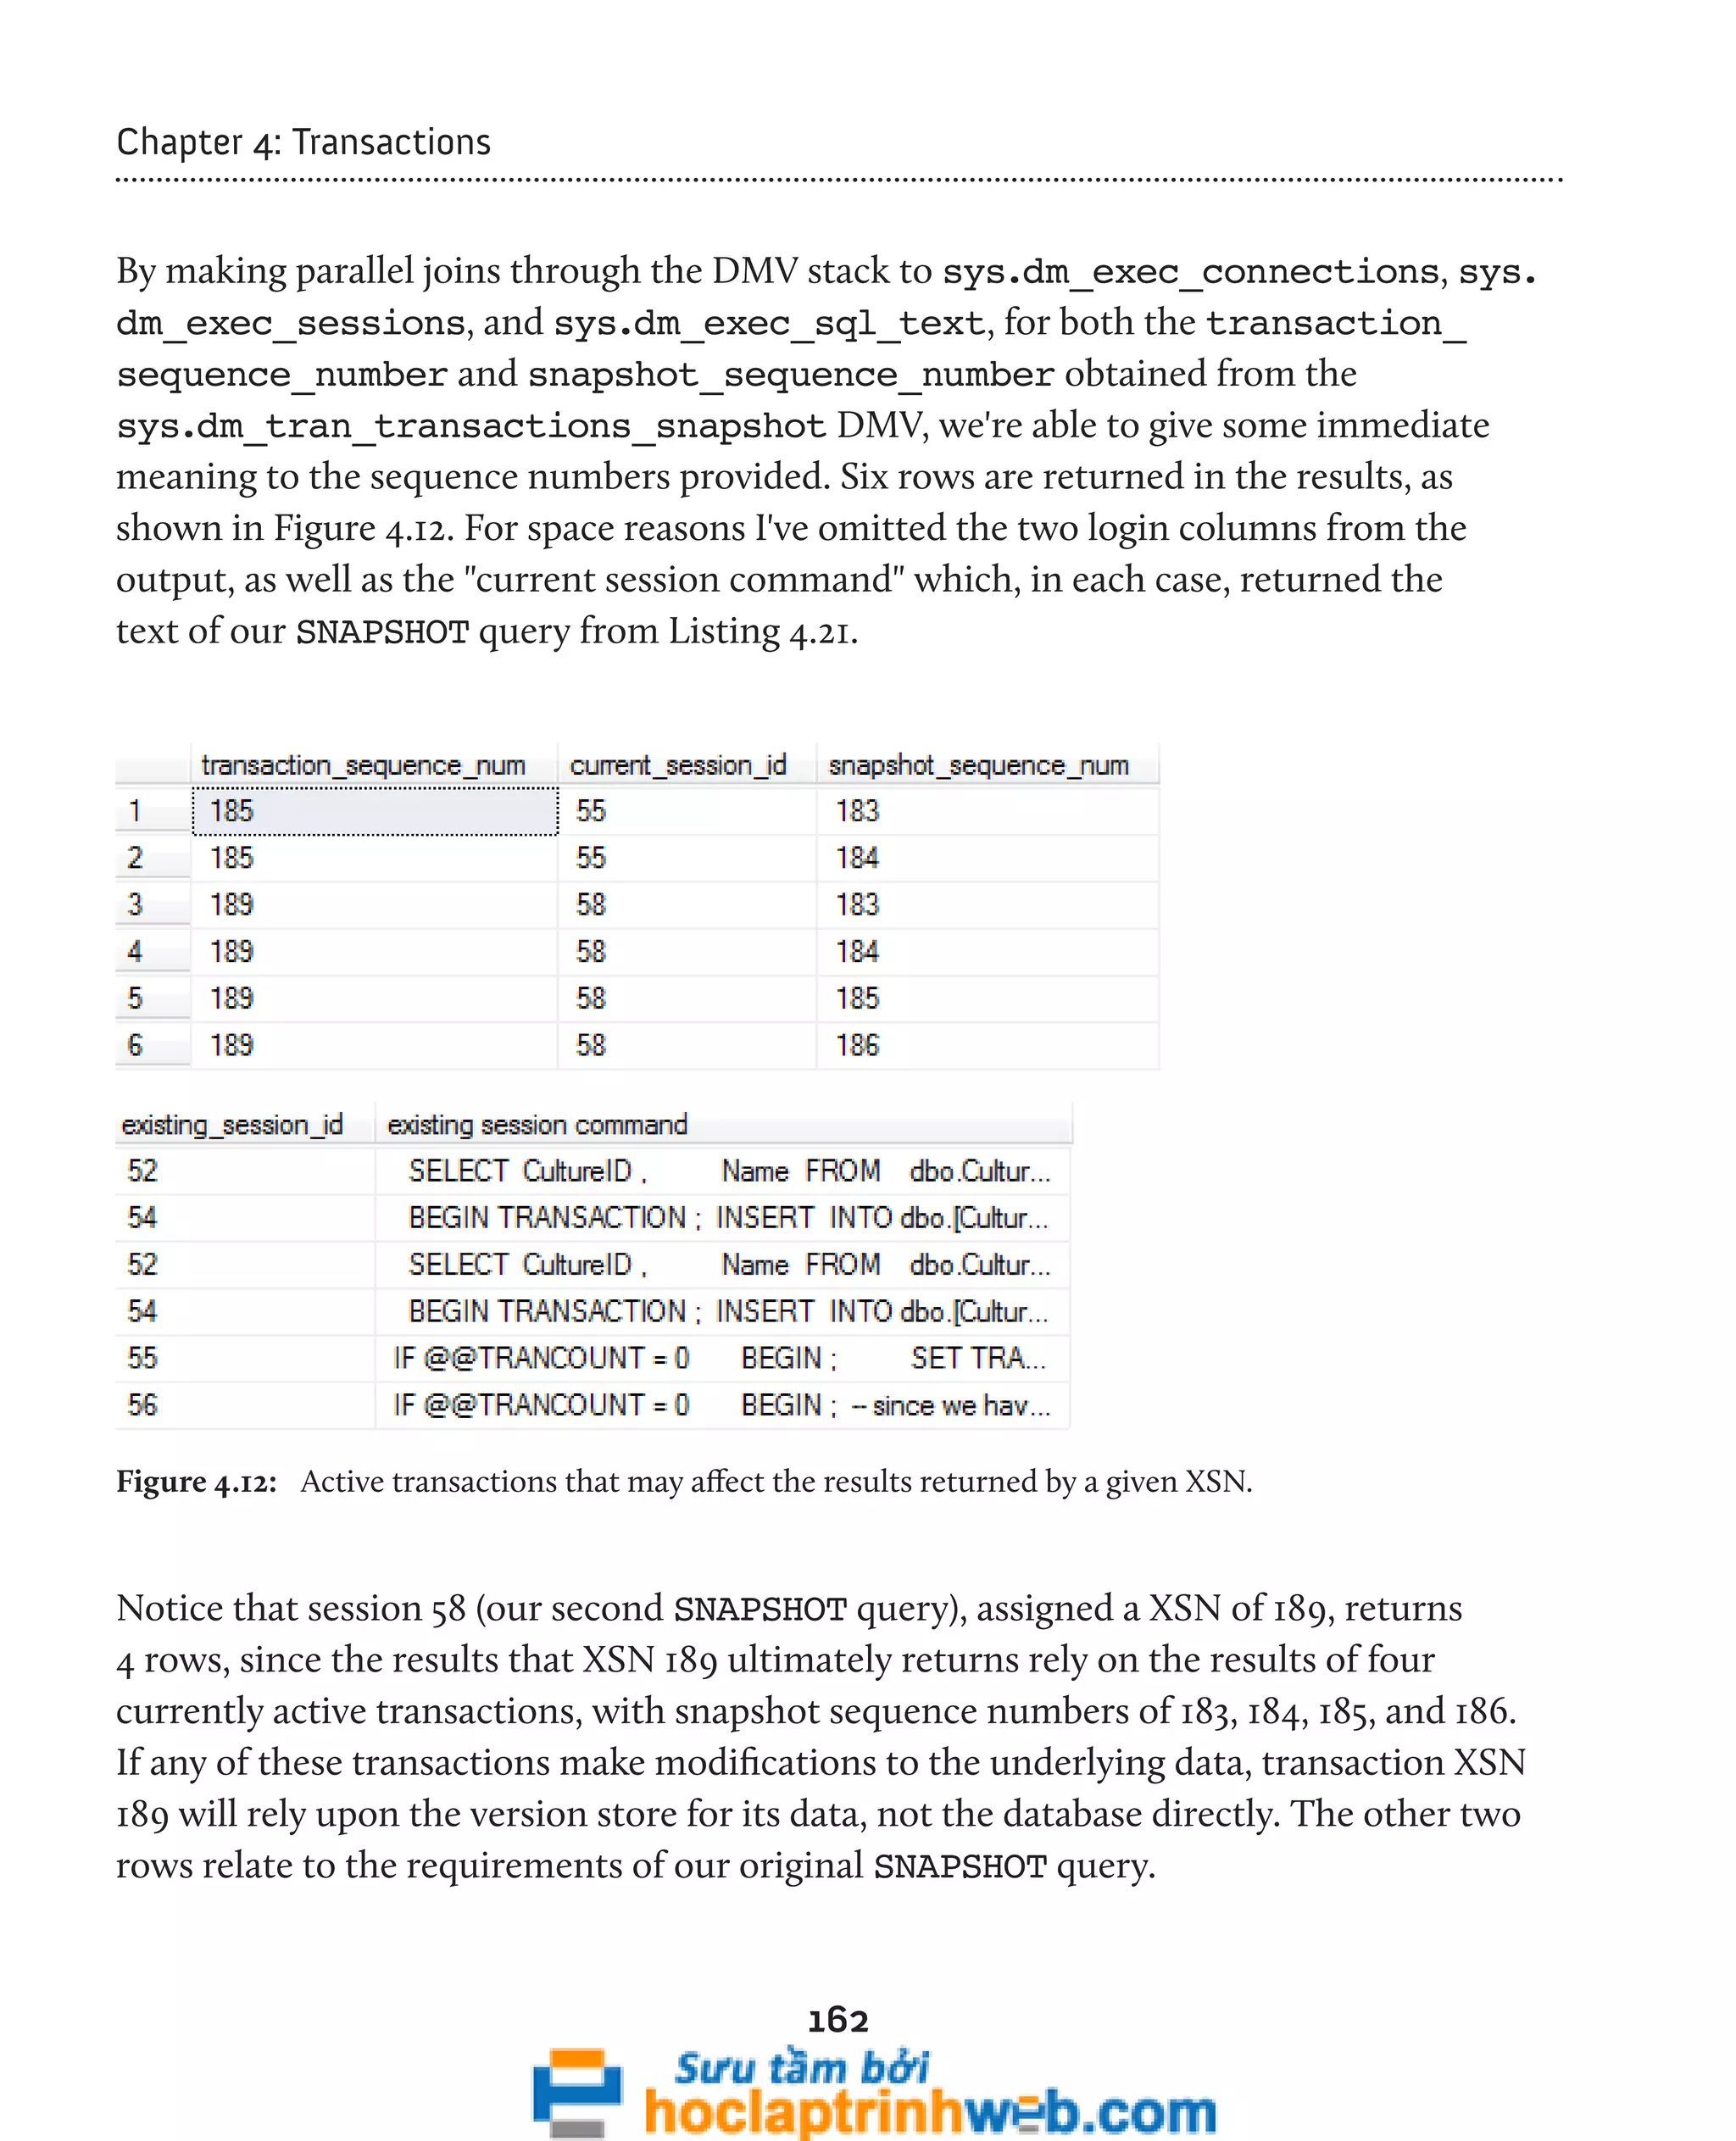
In order to get a clearer picture of what's going on, we can run the query shown in Listing
4.27 to correlate the activity of the various transactions that are using the version store.
SELECT DTTS.[transaction_sequence_num] ,
trx_current.[session_id] AS current_session_id ,
DES_current.[login_name] AS [current session login] ,
DEST_current.text AS [current session command] ,
DTTS.[snapshot_sequence_num] ,
trx_existing.[session_id] AS existing_session_id ,
DES_existing.[login_name] AS [existing session login] ,
DEST_existing.text AS [existing session command]
FROM sys.dm_tran_transactions_snapshot DTTS
INNER JOIN sys.[dm_tran_active_snapshot_database_transactions]
trx_current
ON DTTS.[transaction_sequence_num] =
trx_current.[transaction_sequence_num]
INNER JOIN sys.[dm_exec_connections] DEC_current
ON trx_current.[session_id] =
DEC_current.[most_recent_session_id]
INNER JOIN sys.[dm_exec_sessions] DES_current
ON DEC_current.[most_recent_session_id] =
DES_current.[session_id]
INNER JOIN sys.[dm_tran_active_snapshot_database_transactions]
trx_existing
ON DTTS.[snapshot_sequence_num] =
trx_existing.[transaction_sequence_num]
INNER JOIN sys.[dm_exec_connections] DEC_existing
ON trx_existing.[session_id] =
DEC_existing.[most_recent_session_id]
INNER JOIN sys.[dm_exec_sessions] DES_existing
ON DEC_existing.[most_recent_session_id] =
DES_existing.[session_id]
CROSS APPLY sys.[dm_exec_sql_text]
(DEC_current.[most_recent_sql_handle]) DEST_current
CROSS APPLY sys.[dm_exec_sql_text]
(DEC_existing.[most_recent_sql_handle]) DEST_existing
ORDER BY DTTS.[transaction_sequence_num] ,
DTTS.[snapshot_sequence_num] ;
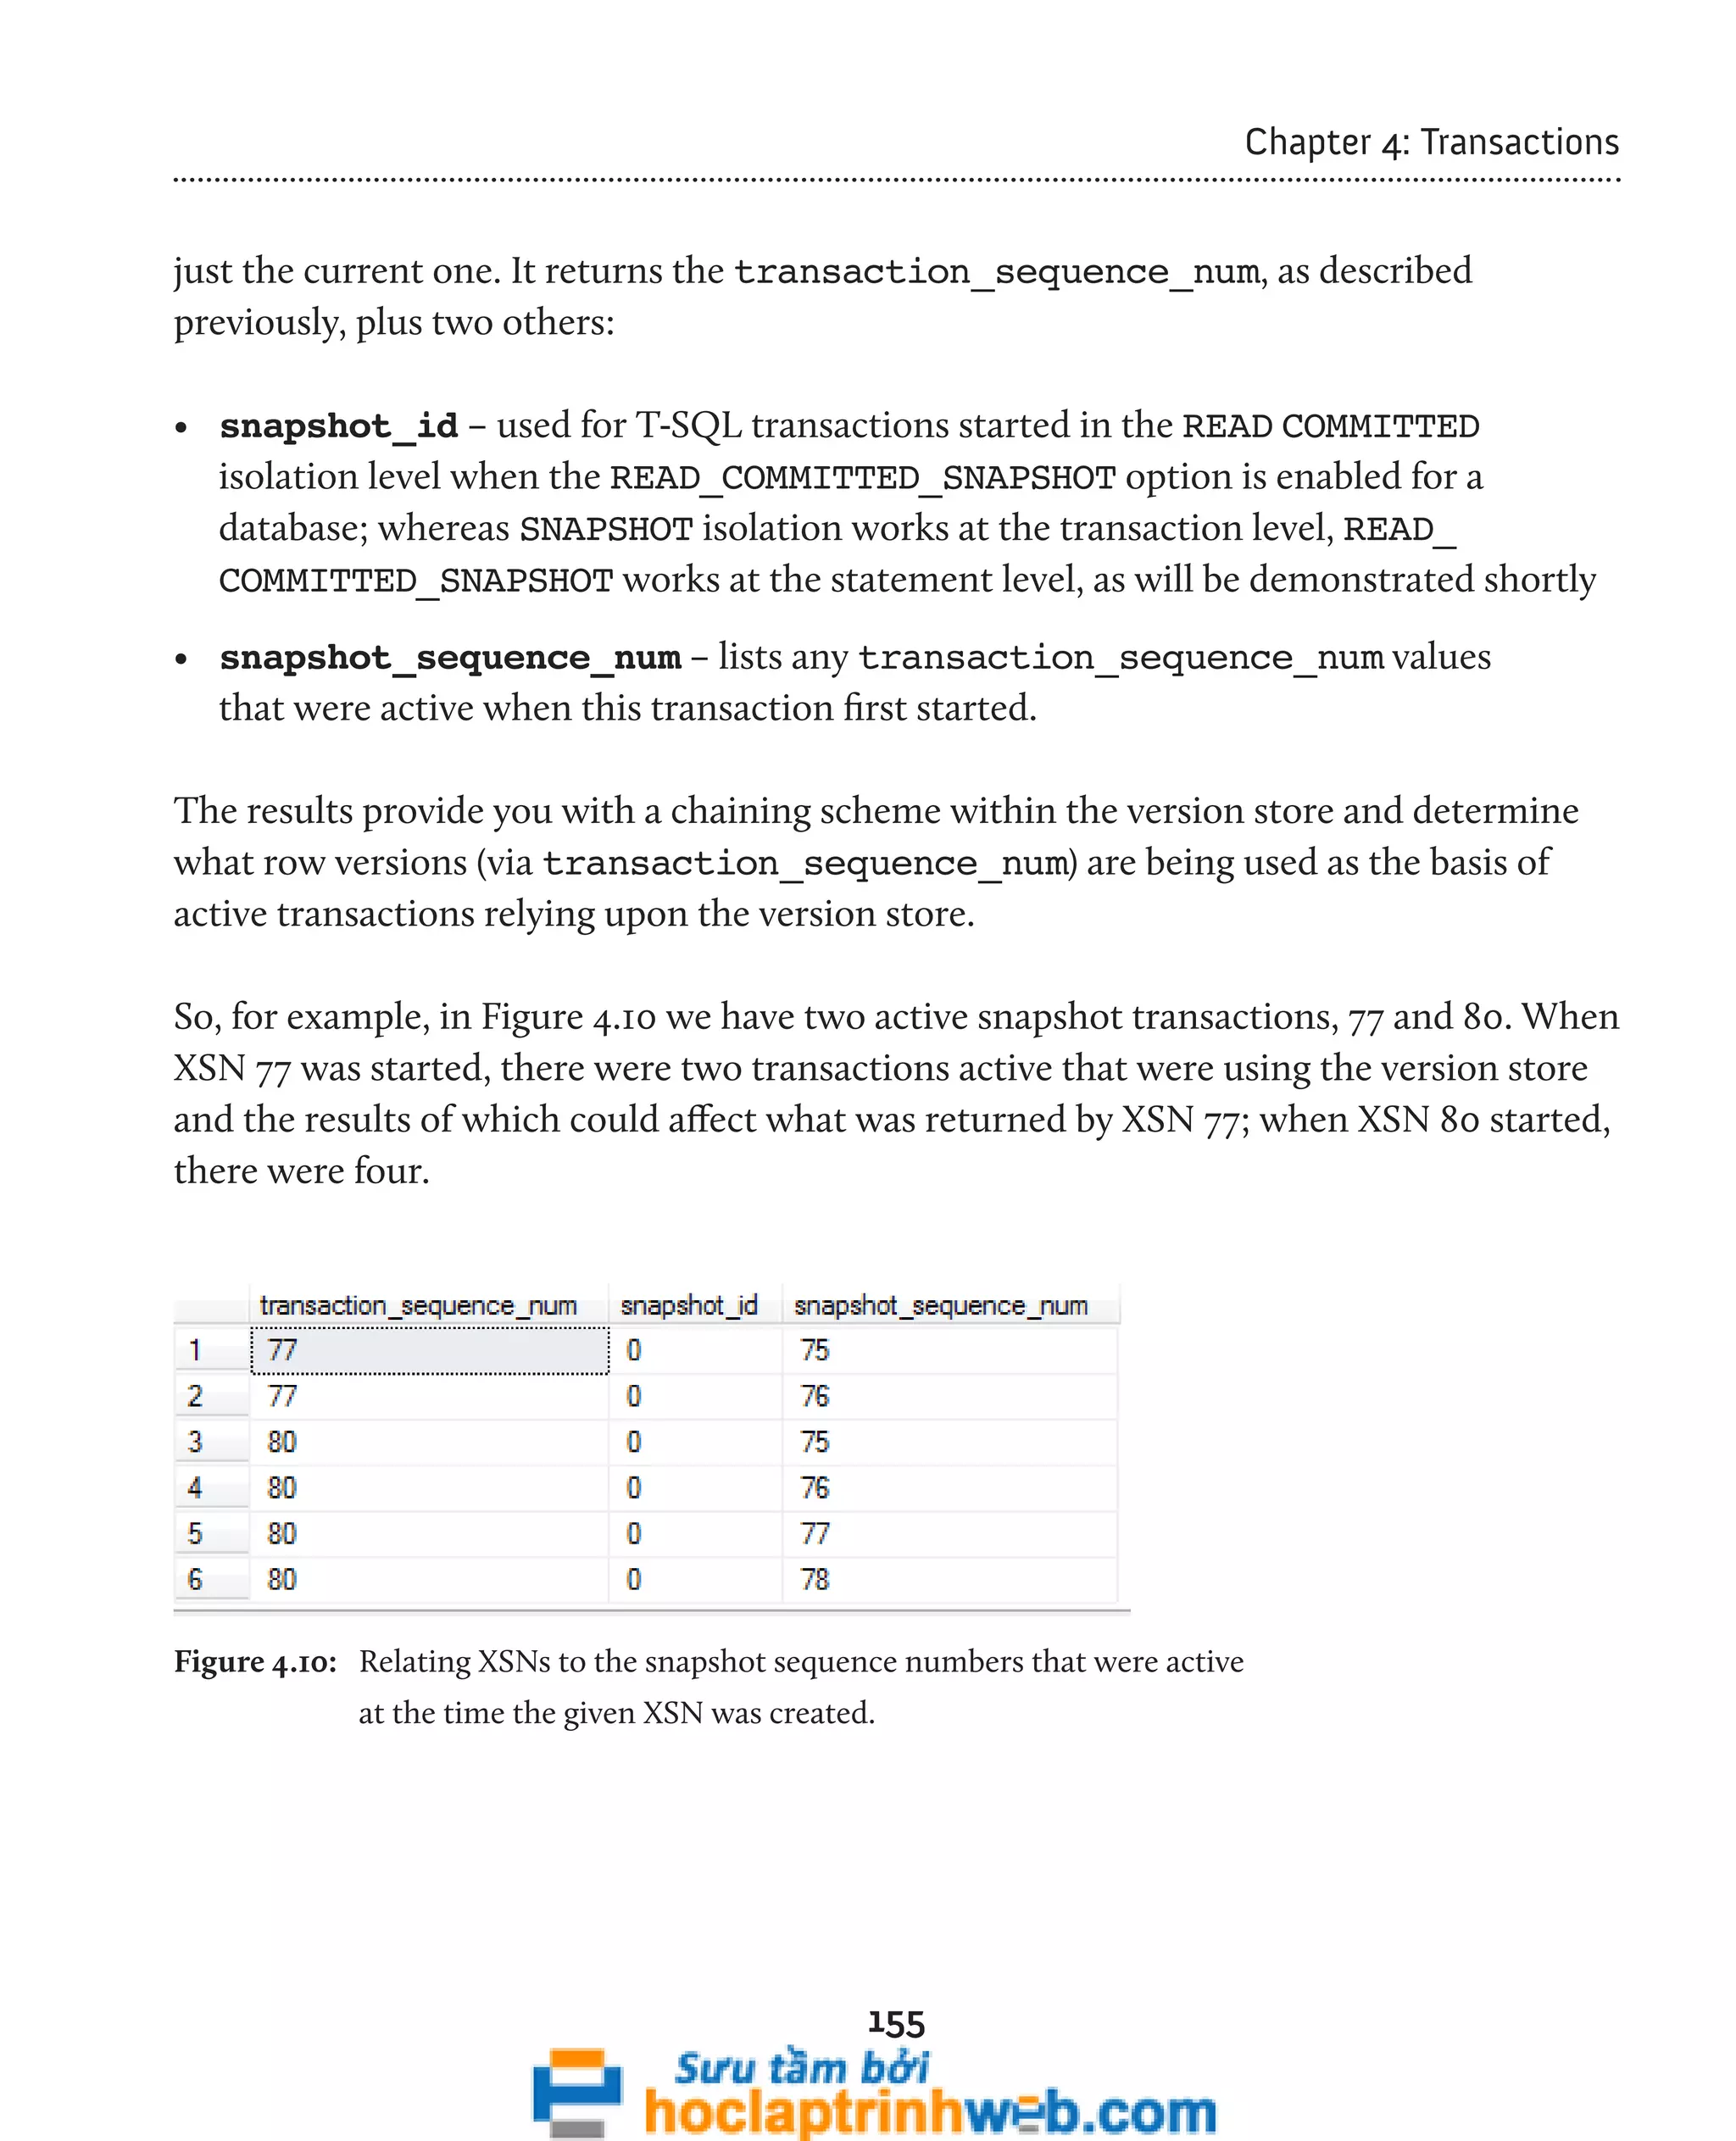
Listing 4.27: Correlating the activity of the various transactions that are using the version store.](https://image.slidesharecdn.com/ebookperformancetuningdavidsonford-141014034404-conversion-gate02/75/c-161-2048.jpg)
![166
Chapter 4: Transactions
• record_length_second_part_in_bytes – length of the second part of the
version record.
• record_image_second_part – second varbinary(8000) part of the
versioned row.
Listing 4.28 returns raw data from this view regarding the current state of our
version store.
SELECT DB_NAME(DTVS.database_id) AS [Database Name] ,
DTVS.[transaction_sequence_num] ,
DTVS.[version_sequence_num] ,
CASE DTVS.[status]
WHEN 0 THEN '1'
WHEN 1 THEN '2'
END AS [pages] ,
DTVS.[record_length_first_part_in_bytes]
+ DTVS.[record_length_second_part_in_bytes] AS [record length (bytes)]
FROM sys.dm_tran_version_store DTVS
ORDER BY DB_NAME(DTVS.database_id) ,
DTVS.transaction_sequence_num ,
DTVS.version_sequence_num
Listing 4.28: Returning raw data from sys.dm_tran_version_store.
Sample results are shown in Figure 4.14.
Figure 4.14: Version store usage for the AdventureWorks database.](https://image.slidesharecdn.com/ebookperformancetuningdavidsonford-141014034404-conversion-gate02/75/c-166-2048.jpg)
![167
Chapter 4: Transactions
In Listing 4.29, we identify overall storage requirements inside the version store, by
database, by aggregating on the database_id.
SELECT DB_NAME(DTVS.[database_id]) ,
SUM(DTVS.[record_length_first_part_in_bytes]
+ DTVS.[record_length_second_part_in_bytes]) AS [total store bytes
consumed]
FROM sys.dm_tran_version_store DTVS
GROUP BY DB_NAME(DTVS.[database_id]) ;
Listing 4.29: Storage requirements for the version store in the AdventureWorks database.
Sample results are shown in Figure 4.15.
Figure 4.15: Total storage space used in the version store, by AdventureWorks.
Currently, we're only using 228 bytes within tempdb for the version store, because this is
a test system with only a few sample transactions running. When I ran this query against
one of my production servers that is using snapshot isolation, I saw figures closer to 200
MB. This figure must be taken into consideration when you size tempdb for a given
instance. Obviously that figure is not too alarming in this day and age of cheap storage,
but when you start dealing with version stores in the 10s and 100s of GB it will at least
begin to register on the DBA's radar – or so I would hope!
However, a more informative breakdown of version store usage, in terms of the highest-consuming
version store record within tempdb, is given in Listing 4.28.](https://image.slidesharecdn.com/ebookperformancetuningdavidsonford-141014034404-conversion-gate02/75/c-167-2048.jpg)
![168
Chapter 4: Transactions
WITH version_store ( [rowset_id], [bytes consumed] )
AS ( SELECT TOP 1
[rowset_id] ,
SUM([record_length_first_part_in_bytes]
+ [record_length_second_part_in_bytes])
AS [bytes consumed]
FROM sys.dm_tran_version_store
GROUP BY [rowset_id]
ORDER BY SUM([record_length_first_part_in_bytes]
+ [record_length_second_part_in_bytes])
)
SELECT VS.[rowset_id] ,
VS.[bytes consumed] ,
DB_NAME(DTVS.[database_id]) AS [database name] ,
DTASDT.[session_id] AS session_id ,
DES.[login_name] AS [session login] ,
DEST.text AS [session command]
FROM version_store VS
INNER JOIN sys.[dm_tran_version_store] DTVS
ON VS.rowset_id = DTVS.[rowset_id]
INNER JOIN sys.[dm_tran_active_snapshot_database_transactions]
DTASDT
ON DTVS.[transaction_sequence_num] =
DTASDT.[transaction_sequence_num]
INNER JOIN sys.dm_exec_connections DEC
ON DTASDT.[session_id] = DEC.[most_recent_session_id]
INNER JOIN sys.[dm_exec_sessions] DES
ON DEC.[most_recent_session_id] = DES.[session_id]
CROSS APPLY sys.[dm_exec_sql_text](DEC.[most_recent_sql_handle])
DEST ;
Listing 4.30: Finding the highest-consuming version store record within tempdb.
Sample results are shown in Figure 4.16.
Figure 4.16: The top generator of version store records.](https://image.slidesharecdn.com/ebookperformancetuningdavidsonford-141014034404-conversion-gate02/75/c-168-2048.jpg)
![169
Chapter 4: Transactions
sys.dm_tran_top_version_generators
The sys.dm_tran_top_version_generators DMV simply returns aggregated
records from the sys.dm_tran_version_store DMV. If you examine the graphical
execution plan, shown in Figure 4.17, for the call to sys.dm_tran_top_version_
generators, you can see that it is making a call to sys.dm_tran_version_store
and then performing the aggregation processes within the query engine.
Figure 4.17: Execution plan for a query against the sys.dm_tran_top_version_generators DMV.
This DMV groups results from sys.dm_tran_version_store on the database_id
and rowset_id columns. Notable columns for this view include:
• database_id – the database of the item in the version store
• rowset_id – the identifier of the rowset in the version store
• aggregated_record_length_in_bytes – total length of all rows for the rowset.
Listing 4.31 returns raw data from this DMV.
SELECT DB_NAME(DTTVG.[database_id]) ,
DTTVG.[rowset_id] ,
DTTVG.[aggregated_record_length_in_bytes]
FROM sys.[dm_tran_top_version_generators] DTTVG
ORDER BY DTTVG.[aggregated_record_length_in_bytes] DESC ;
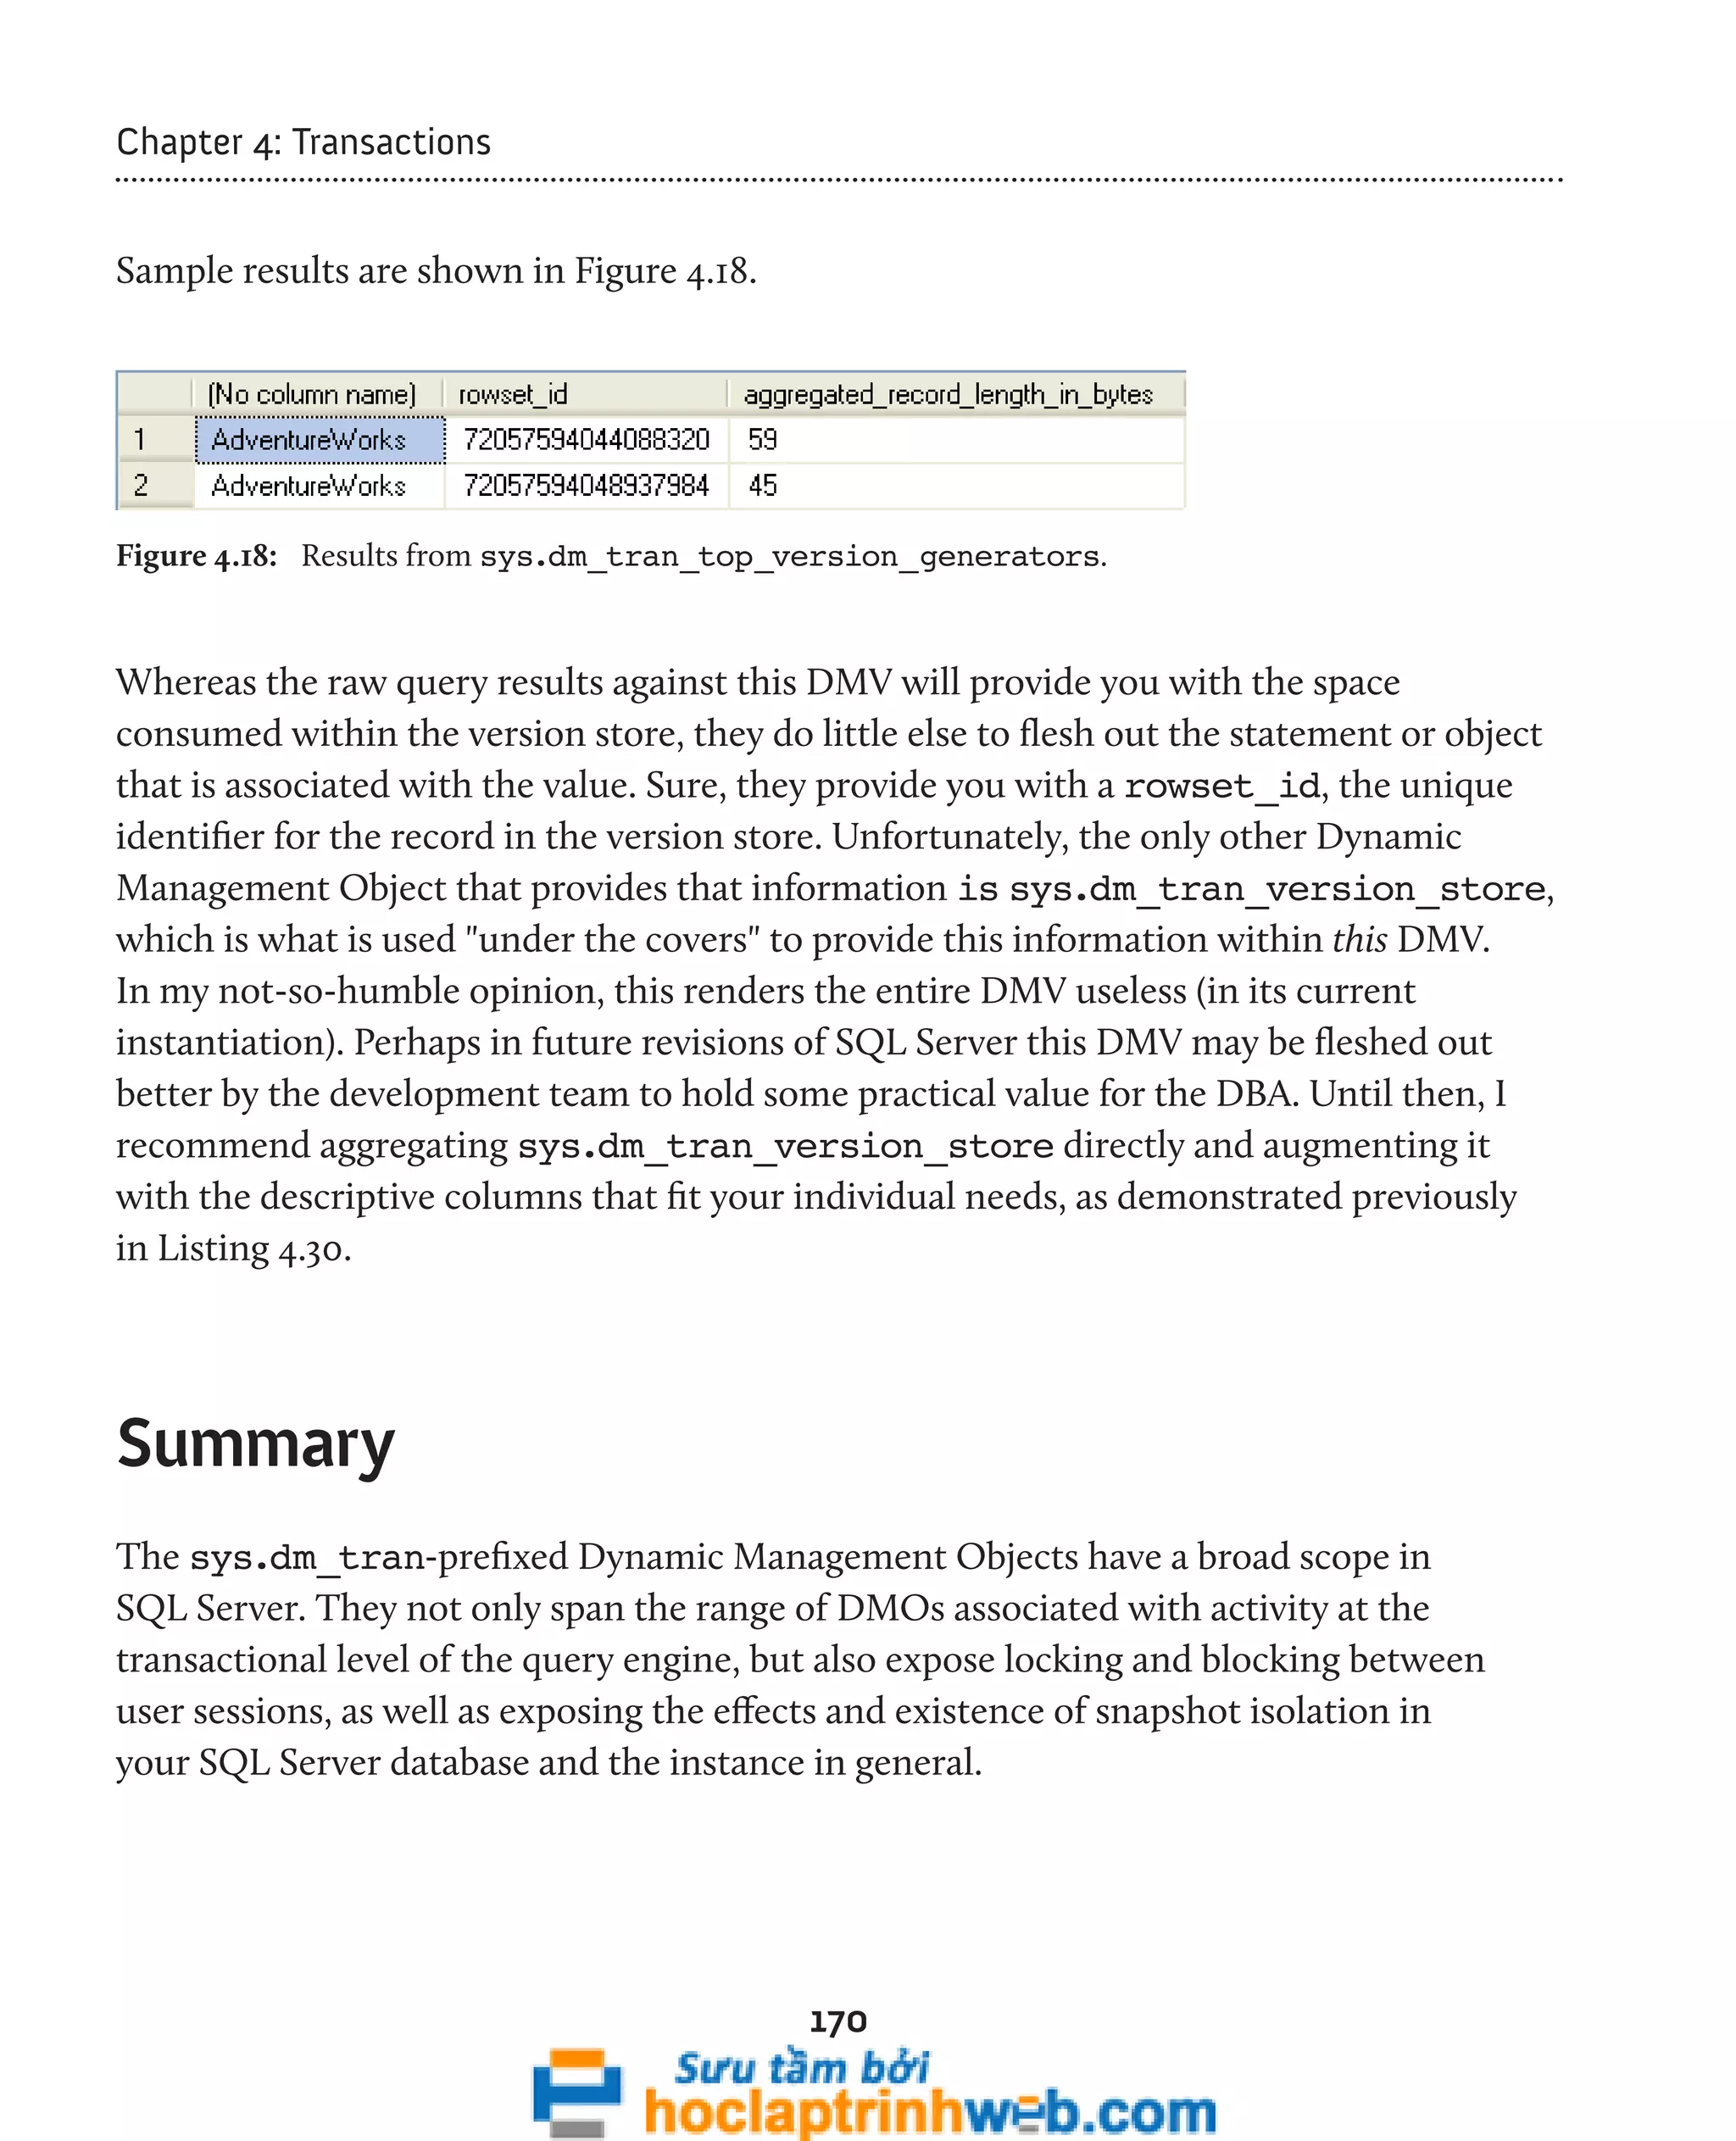
Listing 4.31: Returning raw data from sys.dm_tran_top_version_generators.](https://image.slidesharecdn.com/ebookperformancetuningdavidsonford-141014034404-conversion-gate02/75/c-169-2048.jpg)
![Chapter 5: Indexing Strategy and Maintenance
5.1, which returns some statistics from the dm_db_index_usage_stats DMV, and
joins to sys.indexes to get the index names.
SELECT DB_NAME(ddius.[database_id]) AS database_name ,
OBJECT_NAME(ddius.[object_id], DB_ID('AdventureWorks'))
174
AS [object_name] ,
asi.[name] AS index_name ,
ddius.user_seeks + ddius.user_scans + ddius.user_lookups AS user_reads
FROM sys.dm_db_index_usage_stats ddius
INNER JOIN AdventureWorks.sys.indexes asi
ON ddius.[object_id] = asi.[object_id]
AND ddius.index_id = asi.index_id ;
Listing 5.1: Querying index use in the AdventureWorks database.
The results are shown in Figure 5.1.
Figure 5.1: Results for indexes in the AdventureWorks database.
Firstly, you may notice the use of the OBJECT_NAME function to return the table/view
that owns the indexes retrieved from sys.dm_db_index_usage_stats. Note that
database_id is not an identified column in these system catalog views. This is because
these views reside in each database on the SQL Server instance, not within one of the
system databases (globally) across the instance. Therefore, we'll make use of a little-known
feature of the OBJECT_NAME function which, in SQL 2005 and later editions,
accepts the database_id in the second parameter slot. In Listing 5.1, we could have
simply used:
OBJECT_NAME(ddius.[object_id], ddius.[database_id]) AS [object_name]](https://image.slidesharecdn.com/ebookperformancetuningdavidsonford-141014034404-conversion-gate02/75/c-174-2048.jpg)
![Chapter 5: Indexing Strategy and Maintenance
However, I wanted to show that we can pass the value of database_id even if we do not
know it, by embedding the DB_ID function.
When we make joins from the DMOs at the instance level to the system catalog views
that reside in each database, in order to extract index details, we need to ensure that
we uniquely identify the index in question at the instance level. In fact, this isn't
possible directly. In Listing 5.1, we join on the combination of object_id and index_
id, which guarantees uniqueness at the database level (index_id alone is only unique
at the table level).
However, not even the combination of object_id and index_id can guarantee
uniqueness at the instance level, as Listing 5.2 demonstrates.
SELECT DB_NAME(ddius.[database_id]) AS [database_name] ,
175
ddius.[database_id] ,
ddius.[object_id] ,
ddius.[index_id]
FROM sys.[dm_db_index_usage_stats] ddius
INNER JOIN AdventureWorks.sys.[indexes] asi
ON ddius.[object_id] = asi.[object_id]
AND ddius.[index_id] = asi.[index_id]
Listing 5.2: The combination of object_id and index_id cannot guarantee uniqueness
at the instance level.
The first few rows of the resultset are shown in Figure 5.2, and it's clear that, for
example, the key of object_id = 4 and index_id = 1 exists in both the master
and the AdventureWorks databases.](https://image.slidesharecdn.com/ebookperformancetuningdavidsonford-141014034404-conversion-gate02/75/c-175-2048.jpg)
![Chapter 5: Indexing Strategy and Maintenance
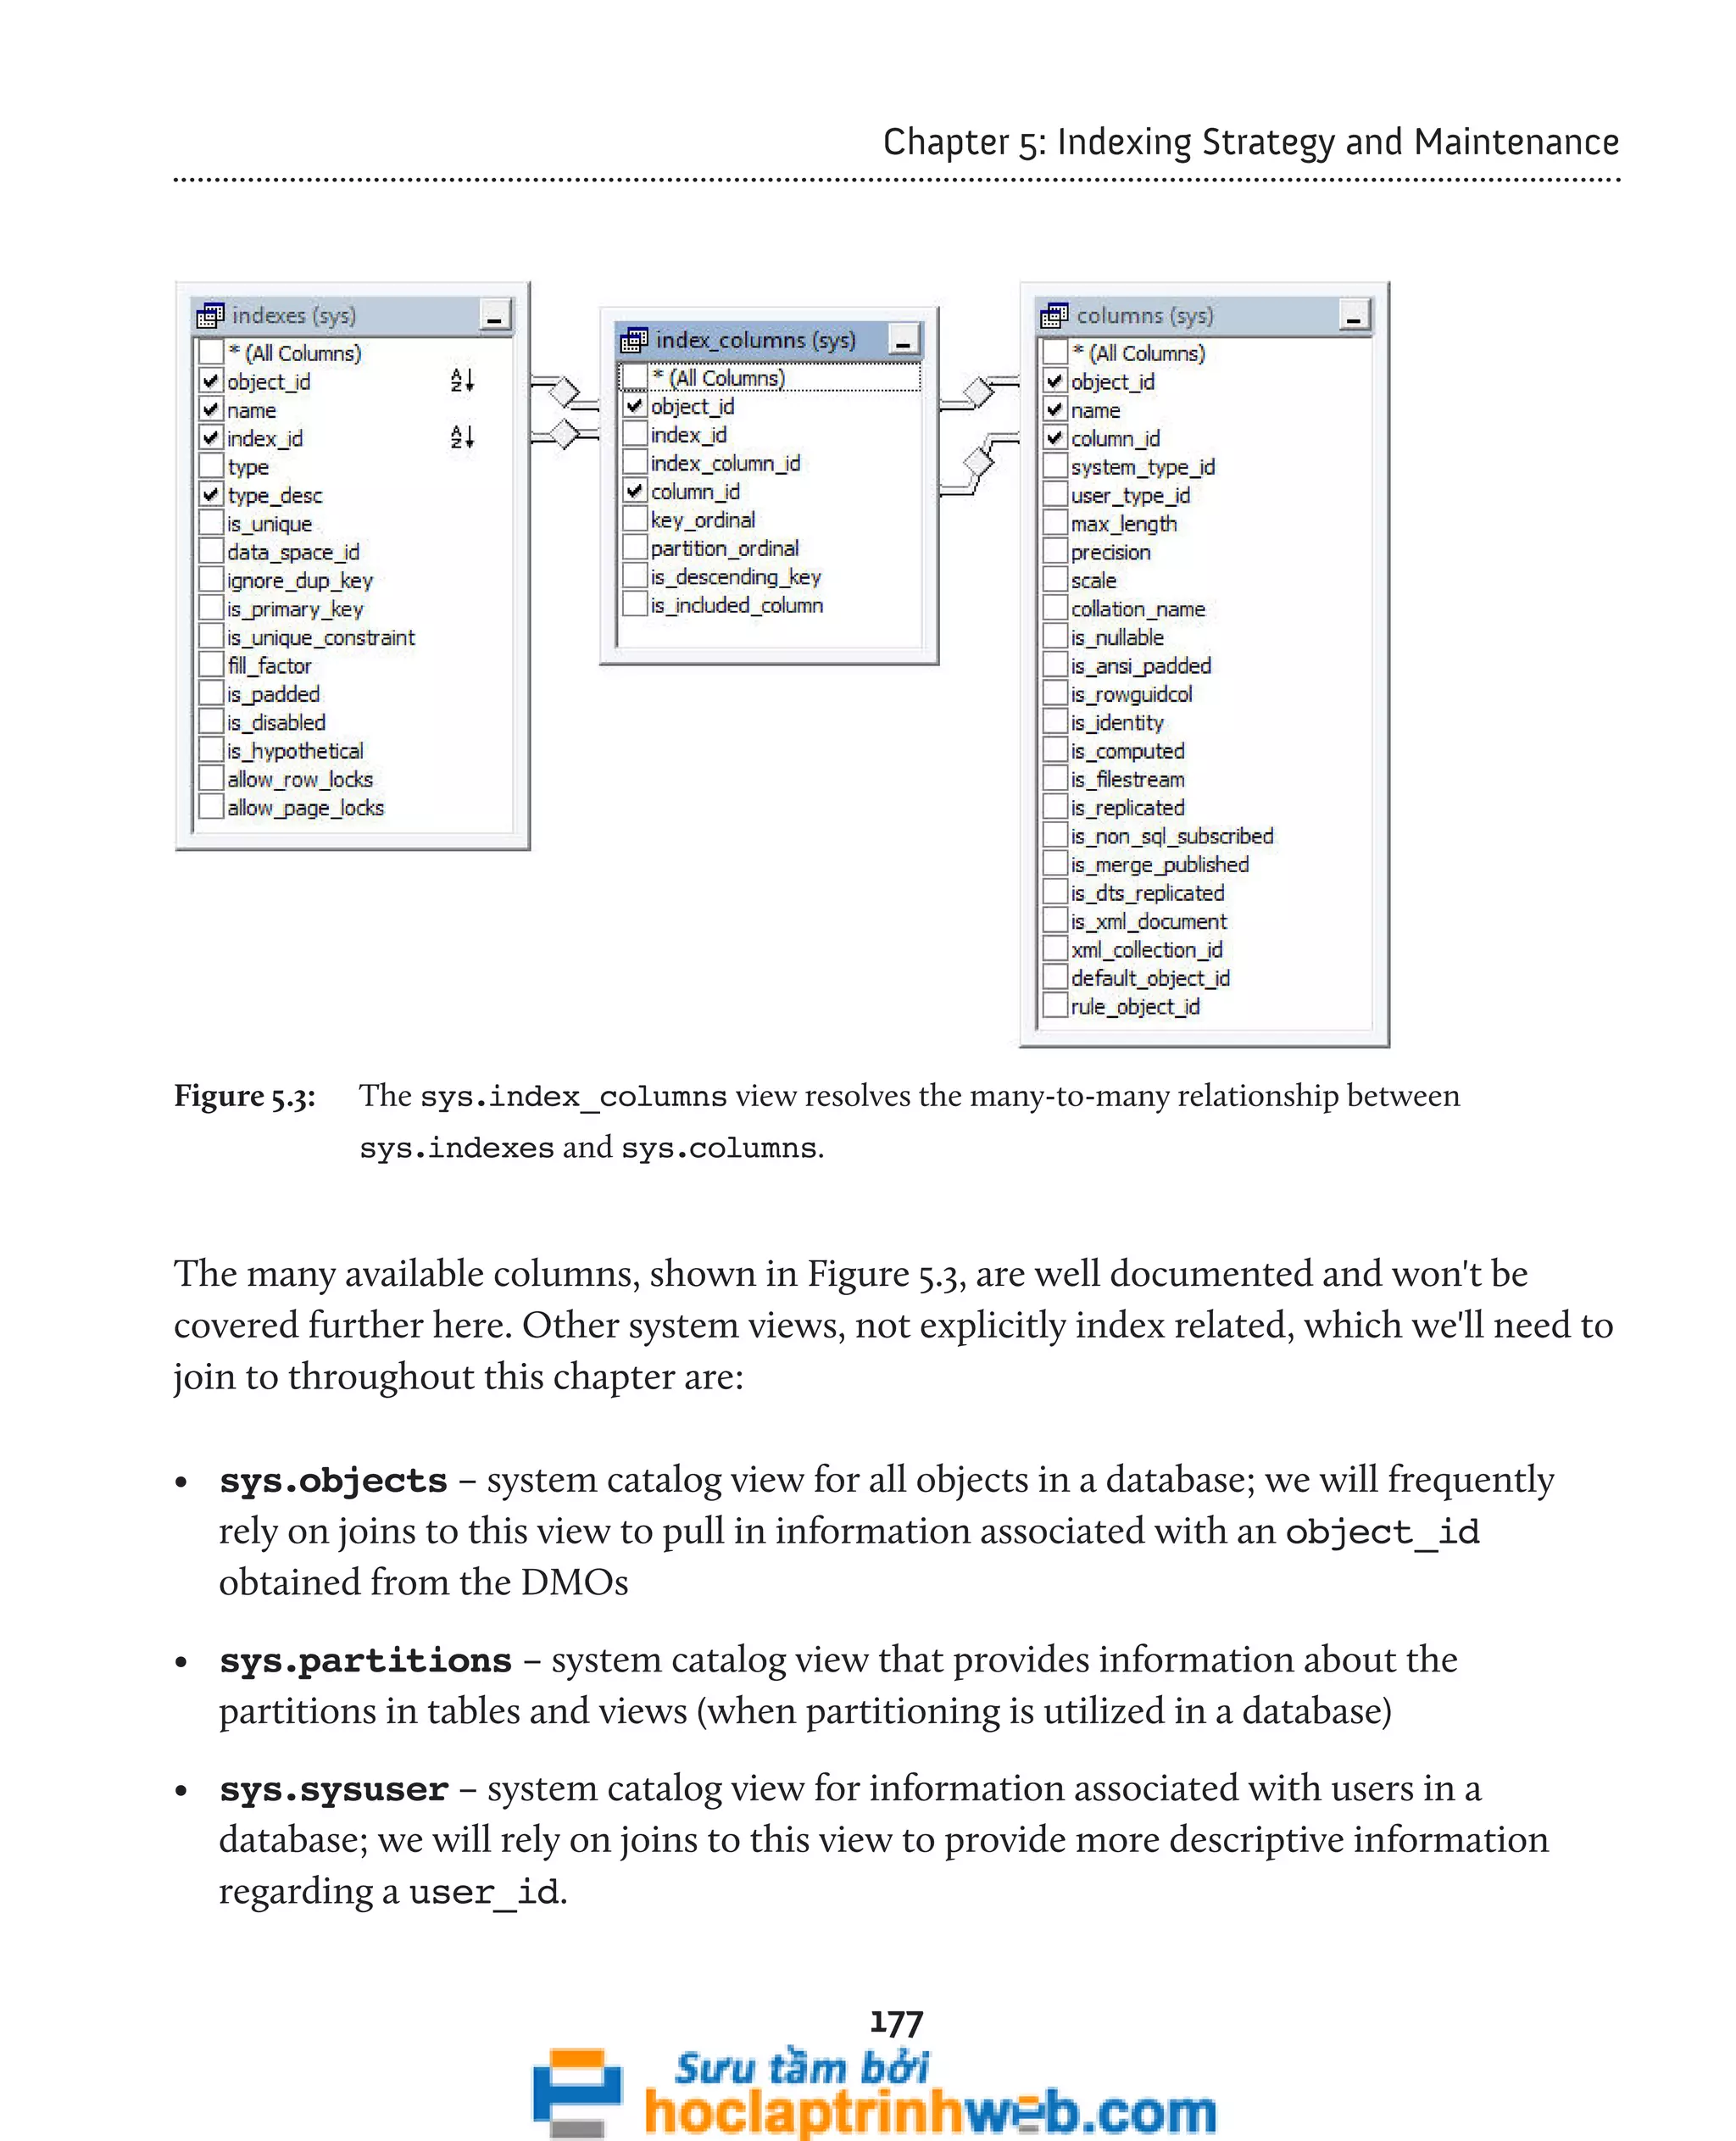
Figure 5.2: Both the master and AdventureWorks databases have an object identified by
object_id = 4 and index_id = 1.
This is why we had to filter the results by database in the WHERE clause in Listing 5.1. That
allows us to run this query under the context of any database and still receive the same
results. Alternatively, we could have used WHERE ddius.[database_id] = DB_ID().
However, we would then have had to run the query under the context of the Northwind
database in order to return the same results.
Occasionally, we may need to join to other indexing catalog views, such as sys.columns,
to find out details about specific columns in the index, such as their length, data type, and
so on. When we do so, we need to join via the intermediate view, sys.index_columns,
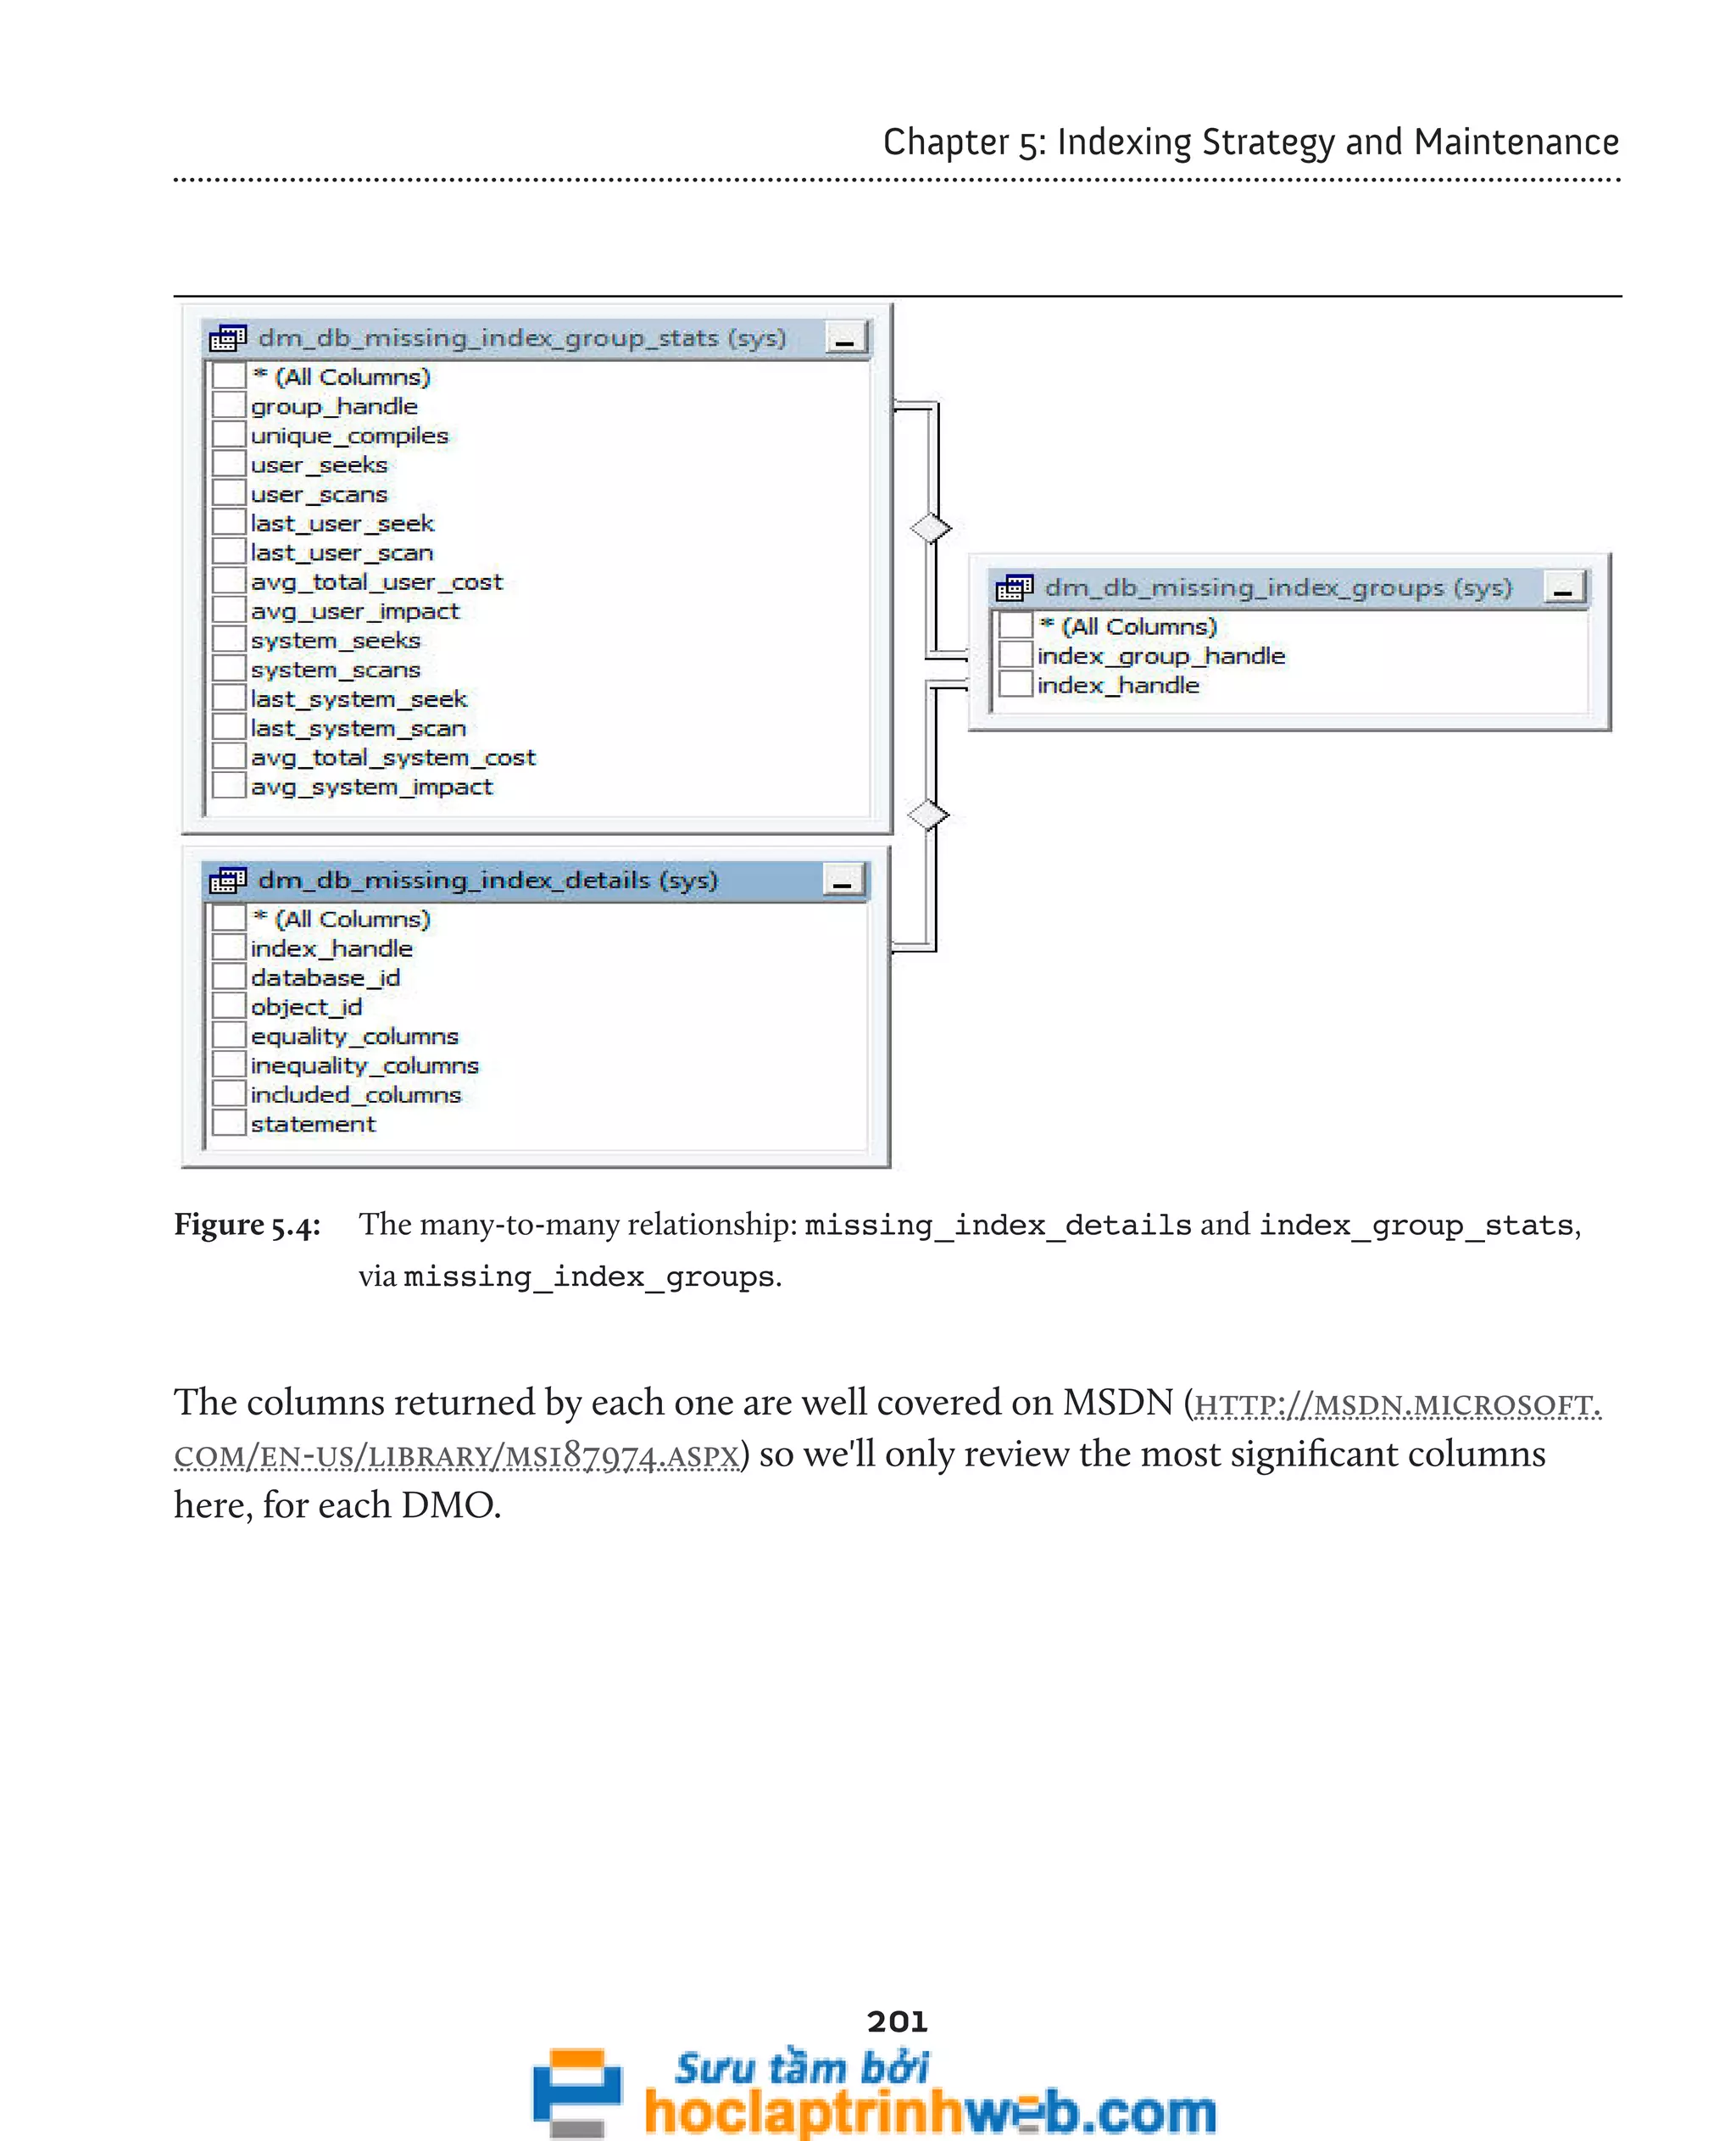
as shown in Figure 5.3.
176](https://image.slidesharecdn.com/ebookperformancetuningdavidsonford-141014034404-conversion-gate02/75/c-176-2048.jpg)
![Chapter 5: Indexing Strategy and Maintenance
SELECT OBJECT_NAME(ddius.[object_id], ddius.database_id) AS [object_name] ,
ddius.index_id ,
ddius.user_seeks ,
ddius.user_scans ,
ddius.user_lookups ,
ddius.user_seeks + ddius.user_scans + ddius.user_lookups
184
AS user_reads ,
ddius.user_updates AS user_writes ,
ddius.last_user_scan ,
ddius.last_user_update
FROM sys.dm_db_index_usage_stats ddius
WHERE ddius.database_id > 4 -- filter out system tables
AND OBJECTPROPERTY(ddius.object_id, 'IsUserTable') = 1
AND ddius.index_id > 0 -- filter out heaps
ORDER BY ddius.user_scans DESC
Listing 5.3: Usage stats for indexes that have been used to resolve a query.
You will see that, in this query and all the ones that follow, we use the following formula
to calculate the total number of times that the index is used by the optimizer to resolve a
user query:
[user_seeks] + [user_scans] + [user_lookups] = [user reads]
The user_updates column on its own provides the total number of times the index has
been updated as a result of data modifications (writes). From a performance tuning
perspective, this DMV is invaluable as it shows exactly how the indexes are being used
and, critically, it tells us something that no previous version of SQL Server did: which
indexes are not being used or, more pertinently, not being used but being frequently](https://image.slidesharecdn.com/ebookperformancetuningdavidsonford-141014034404-conversion-gate02/75/c-184-2048.jpg)
![Chapter 5: Indexing Strategy and Maintenance
updated. A similar calculation can be used to get the total system reads of an index.
However, we'll ignore any system activity from this point forward as it is almost always
negligible in comparison to user-driven activity.
Over the coming sections, we'll present scripts to:
• find indexes on your system that have never been read or written
• find indexes that have never been read but are being maintained (i.e. updated in
response to modification of the underlying table data)
• get detailed read/write stats on all indexes, looking for those where the maintenance
burden may outweigh their usefulness in boosting query performance.
These indexes are candidates for removal, after thorough investigation. You should
never blindly drop indexes, and you must be certain that an index really isn't used (e.g. by
infrequent, yet critical, monthly or quarterly reporting queries) before dropping it.
Identify indexes that have never been accessed
Listing 5.4 uses sys.indexes and sys.objects to find tables and indexes in the current
database that do not show up in sys.dm_db_index_usage_stats. This means that
these indexes have had no reads or writes since SQL Server was last started, or since the
current database was closed or detached, whichever is shorter.
-- List unused indexes
SELECT OBJECT_NAME(i.[object_id]) AS [Table Name] ,
185
i.name
FROM sys.indexes AS i
INNER JOIN sys.objects AS o ON i.[object_id] = o.[object_id]
WHERE i.index_id NOT IN ( SELECT ddius.index_id
FROM sys.dm_db_index_usage_stats AS ddius
WHERE ddius.[object_id] = i.[object_id]
AND i.index_id = ddius.index_id](https://image.slidesharecdn.com/ebookperformancetuningdavidsonford-141014034404-conversion-gate02/75/c-185-2048.jpg)
![Chapter 5: Indexing Strategy and Maintenance
AND database_id = DB_ID() )
186
AND o.[type] = 'U'
ORDER BY OBJECT_NAME(i.[object_id]) ASC ;
Listing 5.4: Finding unused indexes.
If SQL Server has been running long enough for you to have a complete, representative
workload, there is a good chance that those indexes (and perhaps tables) are "dead,"
meaning they are no longer used by your database and can potentially be dropped,
after some further investigation.
Identify indexes that are being maintained but not used
Listing 5.5 identifies clustered and non-clustered indexes that are consuming resources,
in terms of writes and maintenance, but are never being selected for use by the optimizer,
so have never been read, at least since the last time the cache was cleared of accumulated
usage data. It uses a fully-qualified naming convention and is identified as "statement,"
in order to conform to the output that you will see when querying the missing indexes
DMOs. We identify the name of the index via a join to the sys.indexes system catalog
view, on the object_id and index_id columns, and we join to the sys.partitions
system view on the same columns in order to return the total_rows metric (the total
number of rows in the index).
SELECT '[' + DB_NAME() + '].[' + su.[name] + '].[' + o.[name] + ']'
AS [statement] ,
i.[name] AS [index_name] ,
ddius.[user_seeks] + ddius.[user_scans] + ddius.[user_lookups]
AS [user_reads] ,
ddius.[user_updates] AS [user_writes] ,
SUM(SP.rows) AS [total_rows]
FROM sys.dm_db_index_usage_stats ddius
INNER JOIN sys.indexes i ON ddius.[object_id] = i.[object_id]
AND i.[index_id] = ddius.[index_id]
INNER JOIN sys.partitions SP ON ddius.[object_id] = SP.[object_id]
AND SP.[index_id] = ddius.[index_id]](https://image.slidesharecdn.com/ebookperformancetuningdavidsonford-141014034404-conversion-gate02/75/c-186-2048.jpg)
![Chapter 5: Indexing Strategy and Maintenance
INNER JOIN sys.objects o ON ddius.[object_id] = o.[object_id]
INNER JOIN sys.sysusers su ON o.[schema_id] = su.[UID]
WHERE ddius.[database_id] = DB_ID() -- current database only
AND OBJECTPROPERTY(ddius.[object_id], 'IsUserTable') = 1
AND ddius.[index_id] > 0
187
GROUP BY su.[name] ,
o.[name] ,
i.[name] ,
ddius.[user_seeks] + ddius.[user_scans] + ddius.[user_lookups] ,
ddius.[user_updates]
HAVING ddius.[user_seeks] + ddius.[user_scans] + ddius.[user_lookups] = 0
ORDER BY ddius.[user_updates] DESC ,
su.[name] ,
o.[name] ,
i.[name ]
Listing 5.5: Querying sys.dm_db_index_usage_stats for indexes that are being
maintained but not used.](https://image.slidesharecdn.com/ebookperformancetuningdavidsonford-141014034404-conversion-gate02/75/c-187-2048.jpg)
![Chapter 5: Indexing Strategy and Maintenance
I ran this query recently in my production environment against a database supplied and
administered by a third party; I knew I would see some scary things, but I was amazed
when it returned over 120 indexes that had not been read. It is possible, at the same time
as listing these high-write/zero-read indexes, to generate the commands to drop them,
simply by inserting the following at the end of the SELECT clause:
'DROP INDEX [' + i.[name] + '] ON [' + su.[name] + '].[' + o.[name]
+ '] WITH ( ONLINE = OFF )' AS [drop_command]
Having verified the need to drop an index from the database, simply copy the DROP
INDEX command text from the result set into a new query window and execute it. As
always, we advocate testing such processes in your development environment first, before
running against a production database. Furthermore, it is recommended you take a
backup of the database before running such a command.
As noted earlier, I would not like to encourage readers to go around wildly dropping
large numbers of indexes without proper investigation. For a start, it is always advisable
to check how recently the usage stats were cleared, by querying sys.sysdatabases, as
shown in Listing 5.6.
SELECT DATEDIFF(DAY, sd.crdate, GETDATE()) AS days_history
FROM sys.sysdatabases sd
WHERE sd.[name] = 'tempdb' ;
Listing 5.6: How old are the index usage stats?
Also, an index may not have been used recently simply because its functionality is cyclical
in nature (perhaps only used in a month-end process), or simply because it is a recently-implemented
index. Once again, it is important not to drop or create indexes, without
first performing adequate testing in a non-production environment.
188](https://image.slidesharecdn.com/ebookperformancetuningdavidsonford-141014034404-conversion-gate02/75/c-188-2048.jpg)
![Chapter 5: Indexing Strategy and Maintenance
189
Identify inefficient indexes
Our final sys.dm_db_index_usage_stats query filters by the current database,
and only includes non-clustered indexes. It can help you decide whether the cost of
maintaining a particular index outweighs the benefit you are receiving from having
it in place.
-- Potentially inefficient non-clustered indexes (writes > reads)
SELECT OBJECT_NAME(ddius.[object_id]) AS [Table Name] ,
i.name AS [Index Name] ,
i.index_id ,
user_updates AS [Total Writes] ,
user_seeks + user_scans + user_lookups AS [Total Reads] ,
user_updates - ( user_seeks + user_scans + user_lookups )
AS [Difference]
FROM sys.dm_db_index_usage_stats AS ddius WITH ( NOLOCK )
INNER JOIN sys.indexes AS i WITH ( NOLOCK )
ON ddius.[object_id] = i.[object_id]
AND i.index_id = ddius.index_id
WHERE OBJECTPROPERTY(ddius.[object_id], 'IsUserTable') = 1
AND ddius.database_id = DB_ID()
AND user_updates > ( user_seeks + user_scans + user_lookups )
AND i.index_id > 1
ORDER BY [Difference] DESC ,
[Total Writes] DESC ,
[Total Reads] ASC ;
Listing 5.7: Finding rarely-used indexes.
Make sure that the SQL Server instance has been running long enough to ensure that
the complete, typical workload will be represented in the reported statistics. Again, don't
forget about periodic, reporting workloads that might not show up in the day-to-day
workload. Even though the indexes that facilitate such workloads will be infrequently
used, their presence will be critical.](https://image.slidesharecdn.com/ebookperformancetuningdavidsonford-141014034404-conversion-gate02/75/c-189-2048.jpg)
![Chapter 5: Indexing Strategy and Maintenance
This DMF offers many more columns; for example, to investigate use of row overflow
data, LOB data, and so on. For a full listing, see Books Online. Let's take a look at this
DMF in action.
Detailed activity information for indexes not used
for user reads
The script in Listing 5.8 isolates just those indexes that are not being used for user reads,
courtesy of sys.dm_db_index_usage_stats, and then provides detailed information
on the type of writes still being incurred, using the leaf_*_count and nonleaf_*_
count columns of sys.dm_db_index_operational_stats. In this way, you gain
a deep feel for how indexes are being used, and just exactly how much the index is
costing you.
SELECT '[' + DB_NAME() + '].[' + su.[name] + '].[' + o.[name] + ']'
192
AS [statement] ,
i.[name] AS [index_name] ,
ddius.[user_seeks] + ddius.[user_scans] + ddius.[user_lookups]
AS [user_reads] ,
ddius.[user_updates] AS [user_writes] ,
ddios.[leaf_insert_count] ,
ddios.[leaf_delete_count] ,
ddios.[leaf_update_count] ,
ddios.[nonleaf_insert_count] ,
ddios.[nonleaf_delete_count] ,
ddios.[nonleaf_update_count]
FROM sys.dm_db_index_usage_stats ddius
INNER JOIN sys.indexes i ON ddius.[object_id] = i.[object_id]
AND i.[index_id] = ddius.[index_id]
INNER JOIN sys.partitions SP ON ddius.[object_id] = SP.[object_id]
AND SP.[index_id] = ddius.[index_id]
INNER JOIN sys.objects o ON ddius.[object_id] = o.[object_id]
INNER JOIN sys.sysusers su ON o.[schema_id] = su.[UID]
INNER JOIN sys.[dm_db_index_operational_stats](DB_ID(), NULL, NULL,
NULL)
AS ddios
ON ddius.[index_id] = ddios.[index_id]](https://image.slidesharecdn.com/ebookperformancetuningdavidsonford-141014034404-conversion-gate02/75/c-192-2048.jpg)
![Chapter 5: Indexing Strategy and Maintenance
AND ddius.[object_id] = ddios.[object_id]
AND SP.[partition_number] = ddios.[partition_number]
AND ddius.[database_id] = ddios.[database_id]
WHERE OBJECTPROPERTY(ddius.[object_id], 'IsUserTable') = 1
AND ddius.[index_id] > 0
AND ddius.[user_seeks] + ddius.[user_scans] + ddius.[user_lookups] = 0
193
ORDER BY ddius.[user_updates] DESC ,
su.[name] ,
o.[name] ,
i.[name ]
Listing 5.8: Detailed write information for unused indexes.
Upon review of the output it's quite clear that some of these indexes are still being
hammered by inserts even though the users are not benefiting from their existence in
regard to reads. If I encountered metadata like this in the real world (wink, wink) you
could be sure that I would do something about it.](https://image.slidesharecdn.com/ebookperformancetuningdavidsonford-141014034404-conversion-gate02/75/c-193-2048.jpg)
![Chapter 5: Indexing Strategy and Maintenance
Identify locking and blocking at the row level
We can also return information about locking, latching, and blocking from sys.dm_
db_index_operational_stats. Listing 5.9 returns records that relate to locking and
blocking at the row level for the indexes of the active database.
SELECT '[' + DB_NAME(ddios.[database_id]) + '].[' + su.[name] + '].['
+ o.[name] + ']' AS [statement] ,
i.[name] AS 'index_name' ,
ddios.[partition_number] ,
ddios.[row_lock_count] ,
ddios.[row_lock_wait_count] ,
CAST (100.0 * ddios.[row_lock_wait_count]
/ ( ddios.[row_lock_count] ) AS DECIMAL(5, 2)) AS [%_times_blocked] ,
ddios.[row_lock_wait_in_ms] ,
CAST (1.0 * ddios.[row_lock_wait_in_ms]
/ ddios.[row_lock_wait_count] AS DECIMAL(15, 2))
AS [avg_row_lock_wait_in_ms]
FROM sys.dm_db_index_operational_stats(DB_ID(), NULL, NULL, NULL) ddios
INNER JOIN sys.indexes i ON ddios.[object_id] = i.[object_id]
AND i.[index_id] = ddios.[index_id]
INNER JOIN sys.objects o ON ddios.[object_id] = o.[object_id]
INNER JOIN sys.sysusers su ON o.[schema_id] = su.[UID]
194
WHERE ddios.row_lock_wait_count > 0
AND OBJECTPROPERTY(ddios.[object_id], 'IsUserTable') = 1
AND i.[index_id] > 0
ORDER BY ddios.[row_lock_wait_count] DESC ,
su.[name] ,
o.[name] ,
i.[name ]](https://image.slidesharecdn.com/ebookperformancetuningdavidsonford-141014034404-conversion-gate02/75/c-194-2048.jpg)
![Chapter 5: Indexing Strategy and Maintenance
Listing 5.9: Retrieving locking and blocking details for each index.
Notice that in the calculations of both the [%_times_blocked] and avg_row_lock_
wait_in_ms columns, we've had to use a decimal multiplication factor:
CAST (100.0 * ddios.[row_lock_wait_count] / (ddios.[row_lock_count])
195
AS decimal(5,2))
CAST (1.0 * ddios.[row_lock_wait_in_ms] / ddios.[row_lock_wait_count]
AS decimal(15,2)).
This is due to an unfortunate glitch in the data type conversion process within T-SQL
that you are never aware of until it sneaks up on you, and you spend hours trying to
figure out why your results don't follow basic mathematical rules. Unless a mathematical
formula includes a decimal, float, or other non-integer numeric data type, the results will
only produce an integer result, even when the math warrants a non-integer result. You
can try this for yourself. What do you get when you execute the code "SELECT 3/2" in a
query window?
I bet you the answer is not 1.5. The way to fix this is to force a conversion to decimal
form by including a constant that best fits your formula, in the form of a decimal, as
demonstrated in the previous calculations.](https://image.slidesharecdn.com/ebookperformancetuningdavidsonford-141014034404-conversion-gate02/75/c-195-2048.jpg)
![Chapter 5: Indexing Strategy and Maintenance
196
Identify latch waits
Listing 5.10 highlights which of our indexes are encountering latch contention using the
page_io_latch_wait_count and page_io_wait_in_ms columns.
SELECT '[' + DB_NAME() + '].[' + OBJECT_SCHEMA_NAME(ddios.[object_id])
+ '].[' + OBJECT_NAME(ddios.[object_id]) + ']' AS [object_name] ,
i.[name] AS index_name ,
ddios.page_io_latch_wait_count ,
ddios.page_io_latch_wait_in_ms ,
( ddios.page_io_latch_wait_in_ms / ddios.page_io_latch_wait_count )
AS avg_page_io_latch_wait_in_ms
FROM sys.dm_db_index_operational_stats(DB_ID(), NULL, NULL, NULL) ddios
INNER JOIN sys.indexes i ON ddios.[object_id] = i.[object_id]
AND i.index_id = ddios.index_id
WHERE ddios.page_io_latch_wait_count > 0
AND OBJECTPROPERTY(i.object_id, 'IsUserTable') = 1
ORDER BY ddios.page_io_latch_wait_count DESC ,
avg_page_io_latch_wait_in_ms DESC
Listing 5.10: Investigating latch waits.
Latching occurs when the engine reads a physical page. Upon doing so, it issues a latch,
scans the page, reads the row, and then releases the latch when, and this is important,
the page is needed for another process. This process is called lazy latching. Though
latching is quite a benign process, it is of interest to have handy such information as this
query provides. It allows us to identify which of our indexes are encountering significant
waits when trying to issue a latch, because another latch has already been issued. I/O
latching occurs on disk-to-memory transfers, and high I/O latch counts could be a](https://image.slidesharecdn.com/ebookperformancetuningdavidsonford-141014034404-conversion-gate02/75/c-196-2048.jpg)
![Chapter 5: Indexing Strategy and Maintenance
reflection of a disk subsystem issue, particularly when you see average latch wait times of
over 15 milliseconds.
197
Identify lock escalations
As discussed in Chapter 4, SQL Server may attempt to escalate locks in response to a need
to reduce the total number of locks being held and the memory therefore required to
hold and manage them. For example, individual row locks may be escalated to a single
table lock, or page locks may be escalated to a table lock. While this will result in lower
overhead on SQL Server, the downside is lower concurrency. If processes are running
on your servers that are causing lock escalation, it's worth investigating whether the
escalation is justified, or if SQL tuning can be performed to prevent it.
The sys.dm_db_index_operational_stats DMV can be queried to return
information on the count of attempts made by SQL Server to escalate row and page
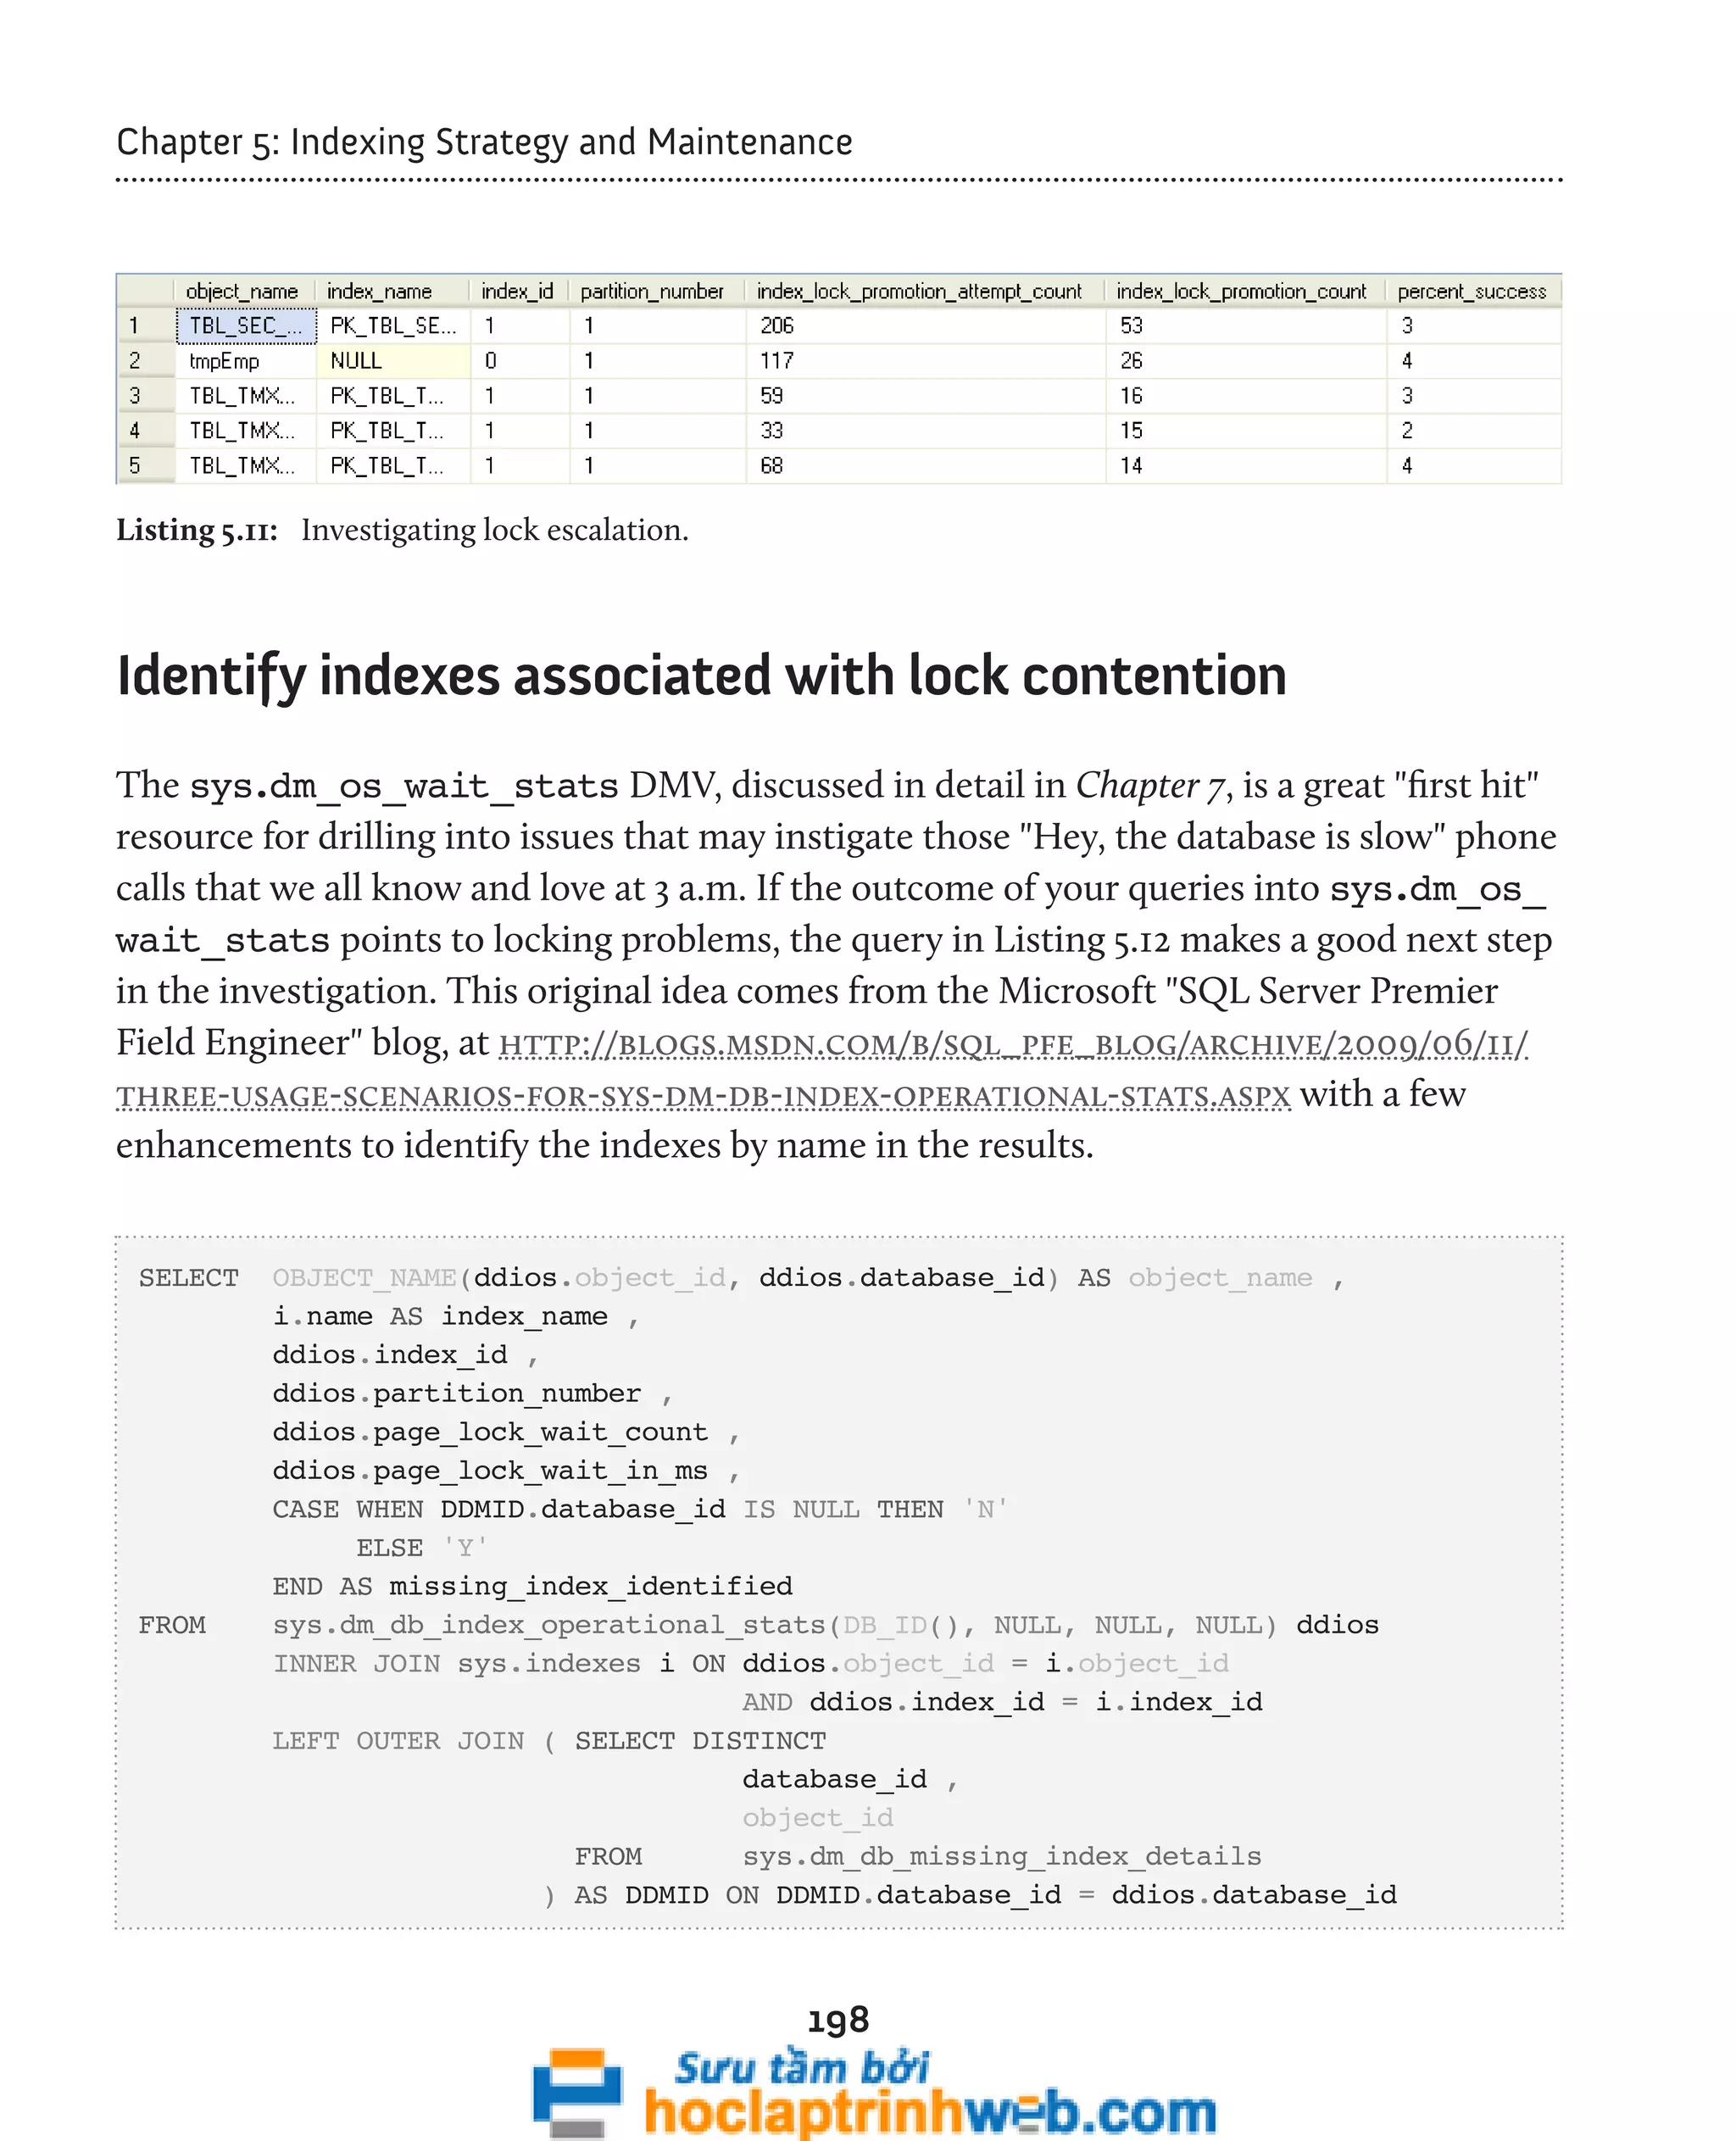
locks to table locks for a specific object. The query in Listing 5.11 provides information
regarding how frequently these escalation attempts were made, and the percentage
success in performing the escalation.
SELECT OBJECT_NAME(ddios.[object_id], ddios.database_id) AS [object_name] ,
i.name AS index_name ,
ddios.index_id ,
ddios.partition_number ,
ddios.index_lock_promotion_attempt_count ,
ddios.index_lock_promotion_count ,
( ddios.index_lock_promotion_attempt_count
/ ddios.index_lock_promotion_count ) AS percent_success
FROM sys.dm_db_index_operational_stats(DB_ID(), NULL, NULL, NULL) ddios
INNER JOIN sys.indexes i ON ddios.object_id = i.object_id
AND ddios.index_id = i.index_id
WHERE ddios.index_lock_promotion_count > 0
ORDER BY index_lock_promotion_count DESC ;](https://image.slidesharecdn.com/ebookperformancetuningdavidsonford-141014034404-conversion-gate02/75/c-197-2048.jpg)

![Chapter 5: Indexing Strategy and Maintenance
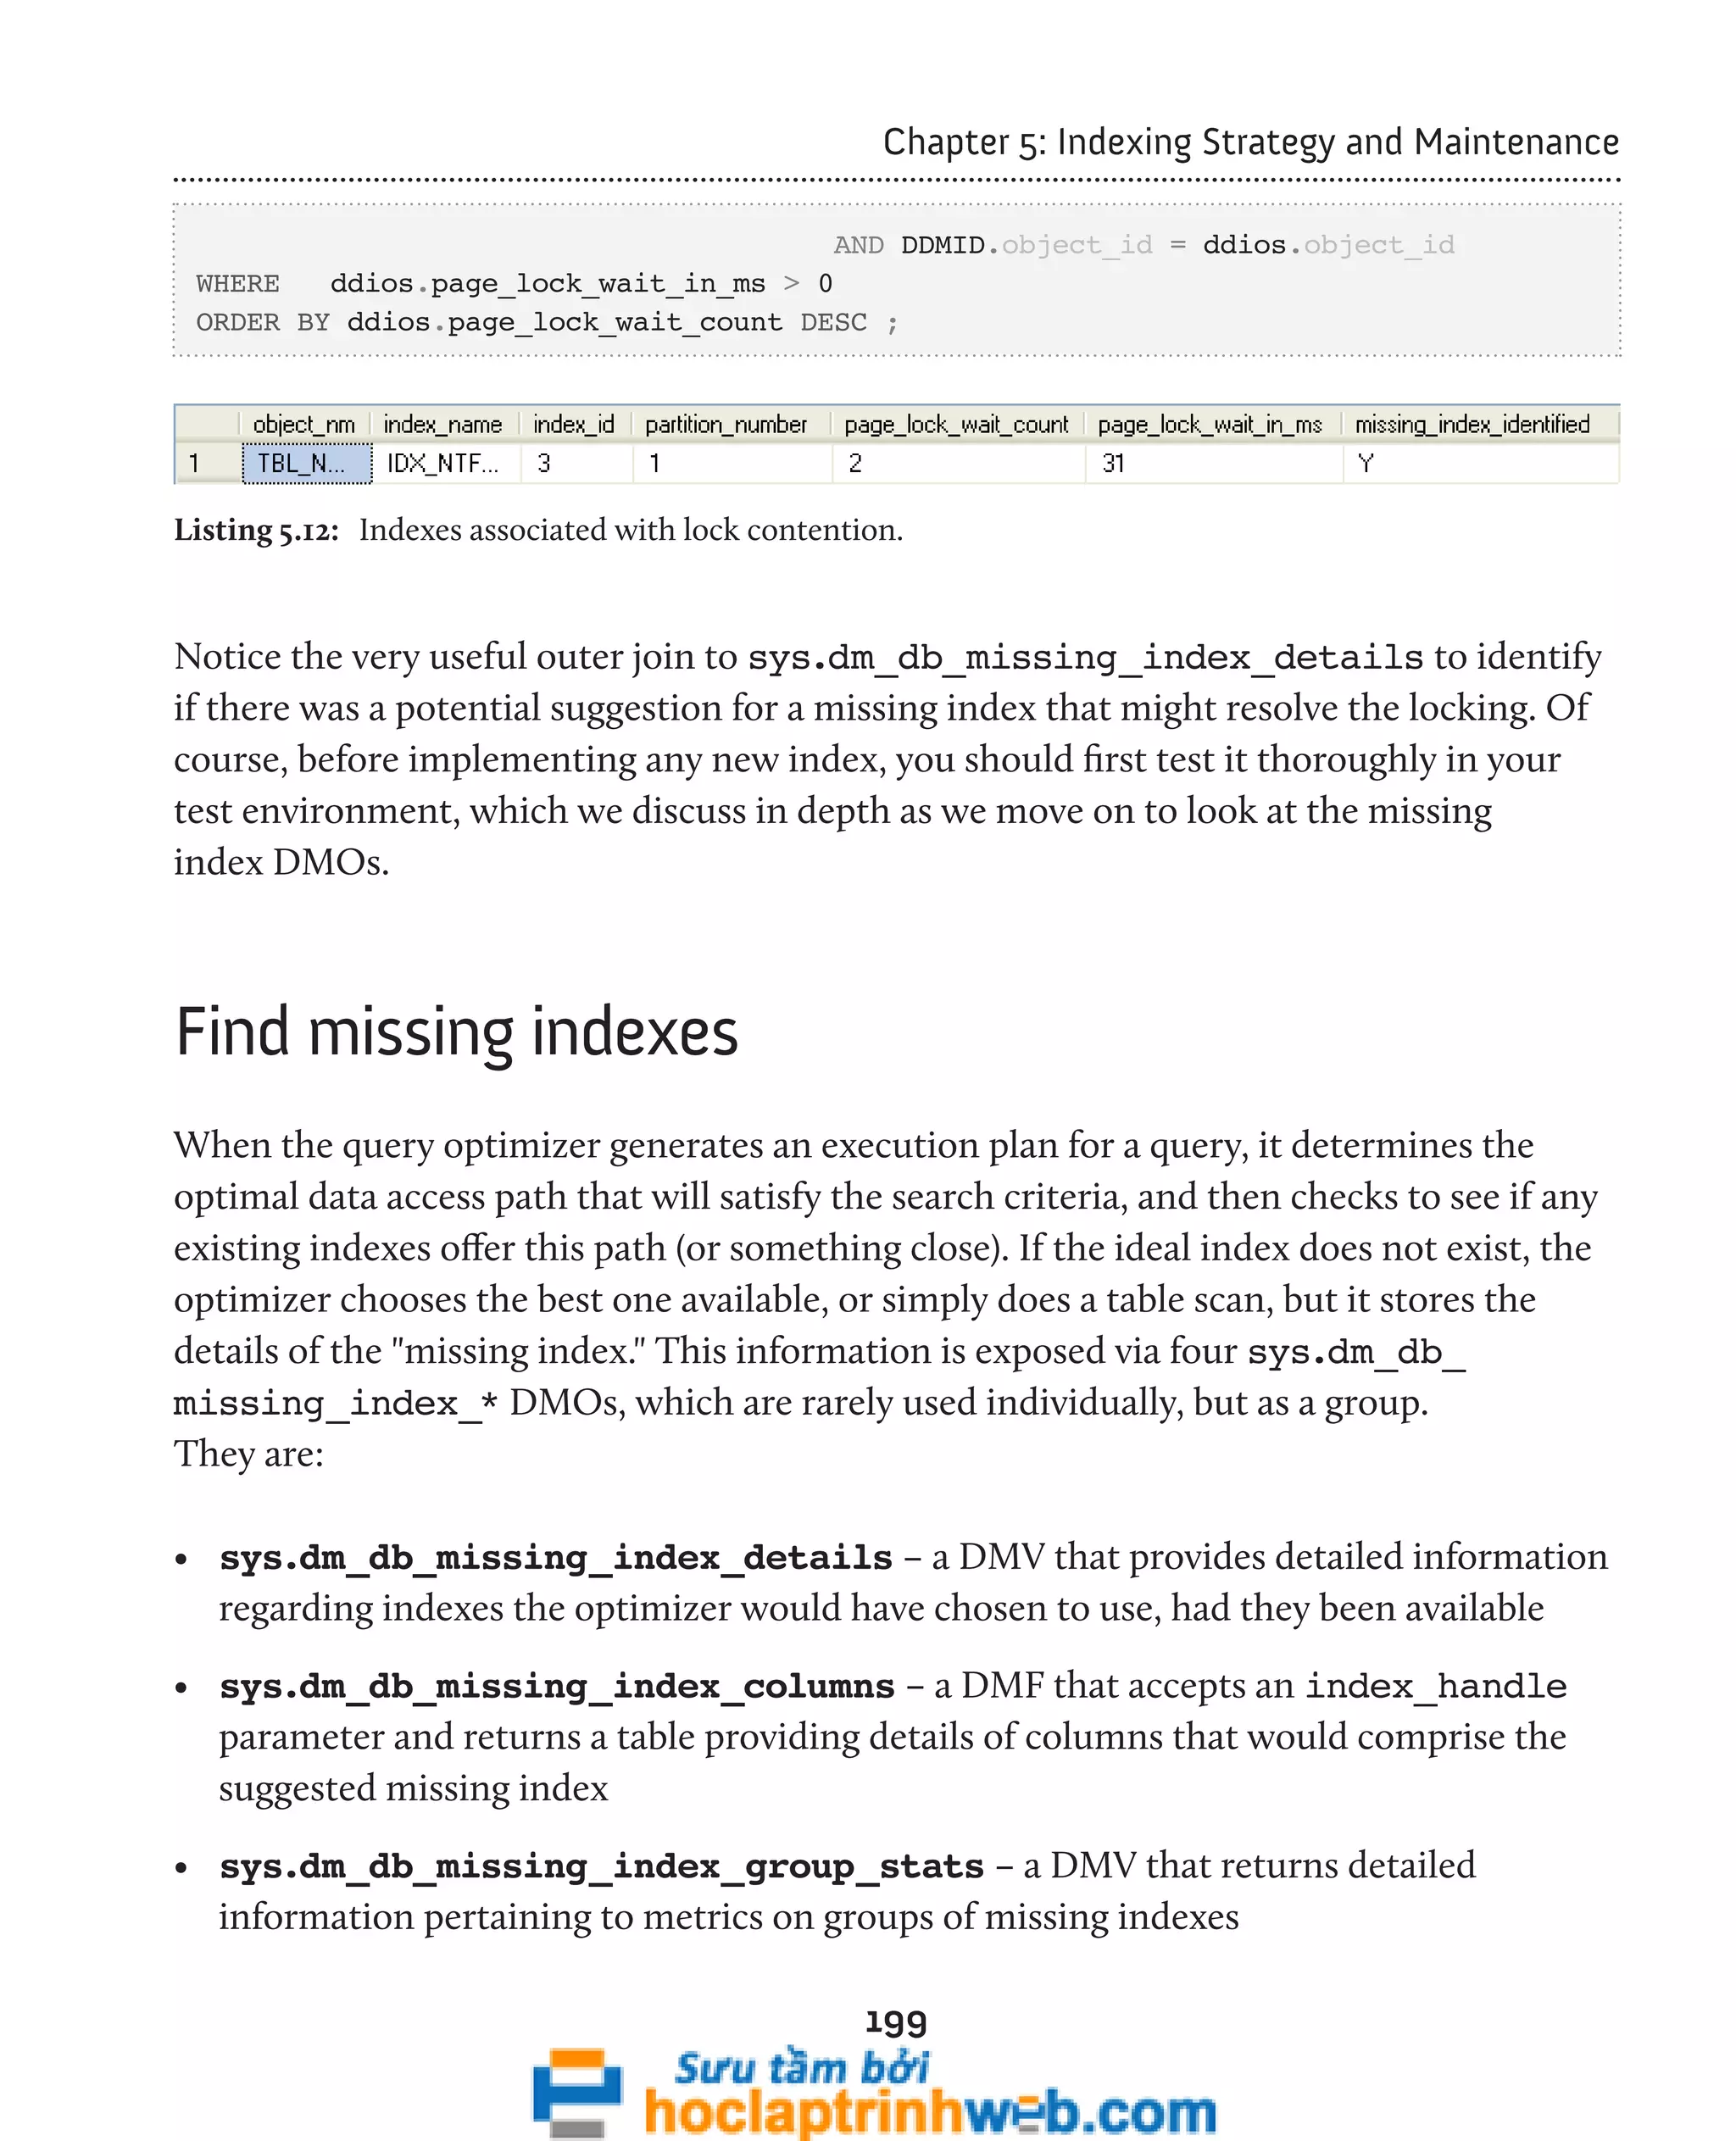
Listing 5.13 provides a quick and useful query, based on this formula, that DBAs can run
to identify potentially useful indexes. The results of this query are instance-wide, so be
sure to limit your results to just the database in question, in the WHERE clause, as
demonstrated here. This query provides the DBA with information directly from the
query optimizer history, accrued since the last restart of the SQL Server service. It
provides information on columns the optimizer would have preferred to have indexed,
based upon the original parse of the query upon execution. Equality columns,
inequality columns, and included columns are each identified. Also presented are the
accrued counts of compiles and seeks, as well as calculated figures that denote the
amount of improvement to be gained if the indexes were created.
SELECT user_seeks * avg_total_user_cost * ( avg_user_impact * 0.01 )
206
AS [index_advantage] ,
dbmigs.last_user_seek ,
dbmid.[statement] AS [Database.Schema.Table] ,
dbmid.equality_columns ,
dbmid.inequality_columns ,
dbmid.included_columns ,
dbmigs.unique_compiles ,
dbmigs.user_seeks ,
dbmigs.avg_total_user_cost ,
dbmigs.avg_user_impact
FROM sys.dm_db_missing_index_group_stats AS dbmigs WITH ( NOLOCK )
INNER JOIN sys.dm_db_missing_index_groups AS dbmig WITH ( NOLOCK )
ON dbmigs.group_handle = dbmig.index_group_handle
INNER JOIN sys.dm_db_missing_index_details AS dbmid WITH ( NOLOCK )
ON dbmig.index_handle = dbmid.index_handle
WHERE dbmid.[database_id] = DB_ID()
ORDER BY index_advantage DESC ;](https://image.slidesharecdn.com/ebookperformancetuningdavidsonford-141014034404-conversion-gate02/75/c-206-2048.jpg)


![Chapter 5: Indexing Strategy and Maintenance
• forwarded_record_count – for heaps, the number of forwarding pointers;
forwarding pointers are very bad for performance when using heaps, because they
are always resolved immediately as they are encountered.
Detecting and fixing fragmentation
Every index encounters some level of fragmentation, and its resolution is a two-part
process. Part 1 is detecting unacceptable fragmentation levels. The query in Listing 5.14
will return fragmentation information for each index in the current database, where the
average_fragmentation_in_percent column is greater than 15% and where the
page count is greater than 500. On a busy system, this can be a resource-intensive query
so please keep that in mind when setting the scope of your query (via the parameters for
the DMF) and the time of day when you are going to execute the query.
SELECT '[' + DB_NAME() + '].[' + OBJECT_SCHEMA_NAME(ddips.[object_id],
212
DB_ID()) + '].['
+ OBJECT_NAME(ddips.[object_id], DB_ID()) + ']' AS [statement] ,
i.[name] AS [index_name] ,
ddips.[index_type_desc] ,
ddips.[partition_number] ,
ddips.[alloc_unit_type_desc] ,
ddips.[index_depth] ,
ddips.[index_level] ,
CAST(ddips.[avg_fragmentation_in_percent] AS SMALLINT)
AS [avg_frag_%] ,
CAST(ddips.[avg_fragment_size_in_pages] AS SMALLINT)
AS [avg_frag_size_in_pages] ,
ddips.[fragment_count] ,
ddips.[page_count]
FROM sys.dm_db_index_physical_stats(DB_ID(), NULL,
NULL, NULL, 'limited') ddips
INNER JOIN sys.[indexes] i ON ddips.[object_id] = i.[object_id]
AND ddips.[index_id] = i.[index_id]
WHERE ddips.[avg_fragmentation_in_percent] > 15
AND ddips.[page_count] > 500](https://image.slidesharecdn.com/ebookperformancetuningdavidsonford-141014034404-conversion-gate02/75/c-212-2048.jpg)
![Chapter 5: Indexing Strategy and Maintenance
ORDER BY ddips.[avg_fragmentation_in_percent] ,
OBJECT_NAME(ddips.[object_id], DB_ID()) ,
i.[name ]
213
Listing 5.14: Investigating fragmented indexes.
Note that this query does not ignore heaps. Fragmentation occurs in heaps just as in
indexes; but fixing this fragmentation in heaps is a little different than in clustered and
non-clustered indexes (as will be explained shortly).
The rule of thumb for index reorganization is 15–30% fragmentation. The often-recommended
process for indexes with fragmentation greater than 30% is a rebuild of](https://image.slidesharecdn.com/ebookperformancetuningdavidsonford-141014034404-conversion-gate02/75/c-213-2048.jpg)
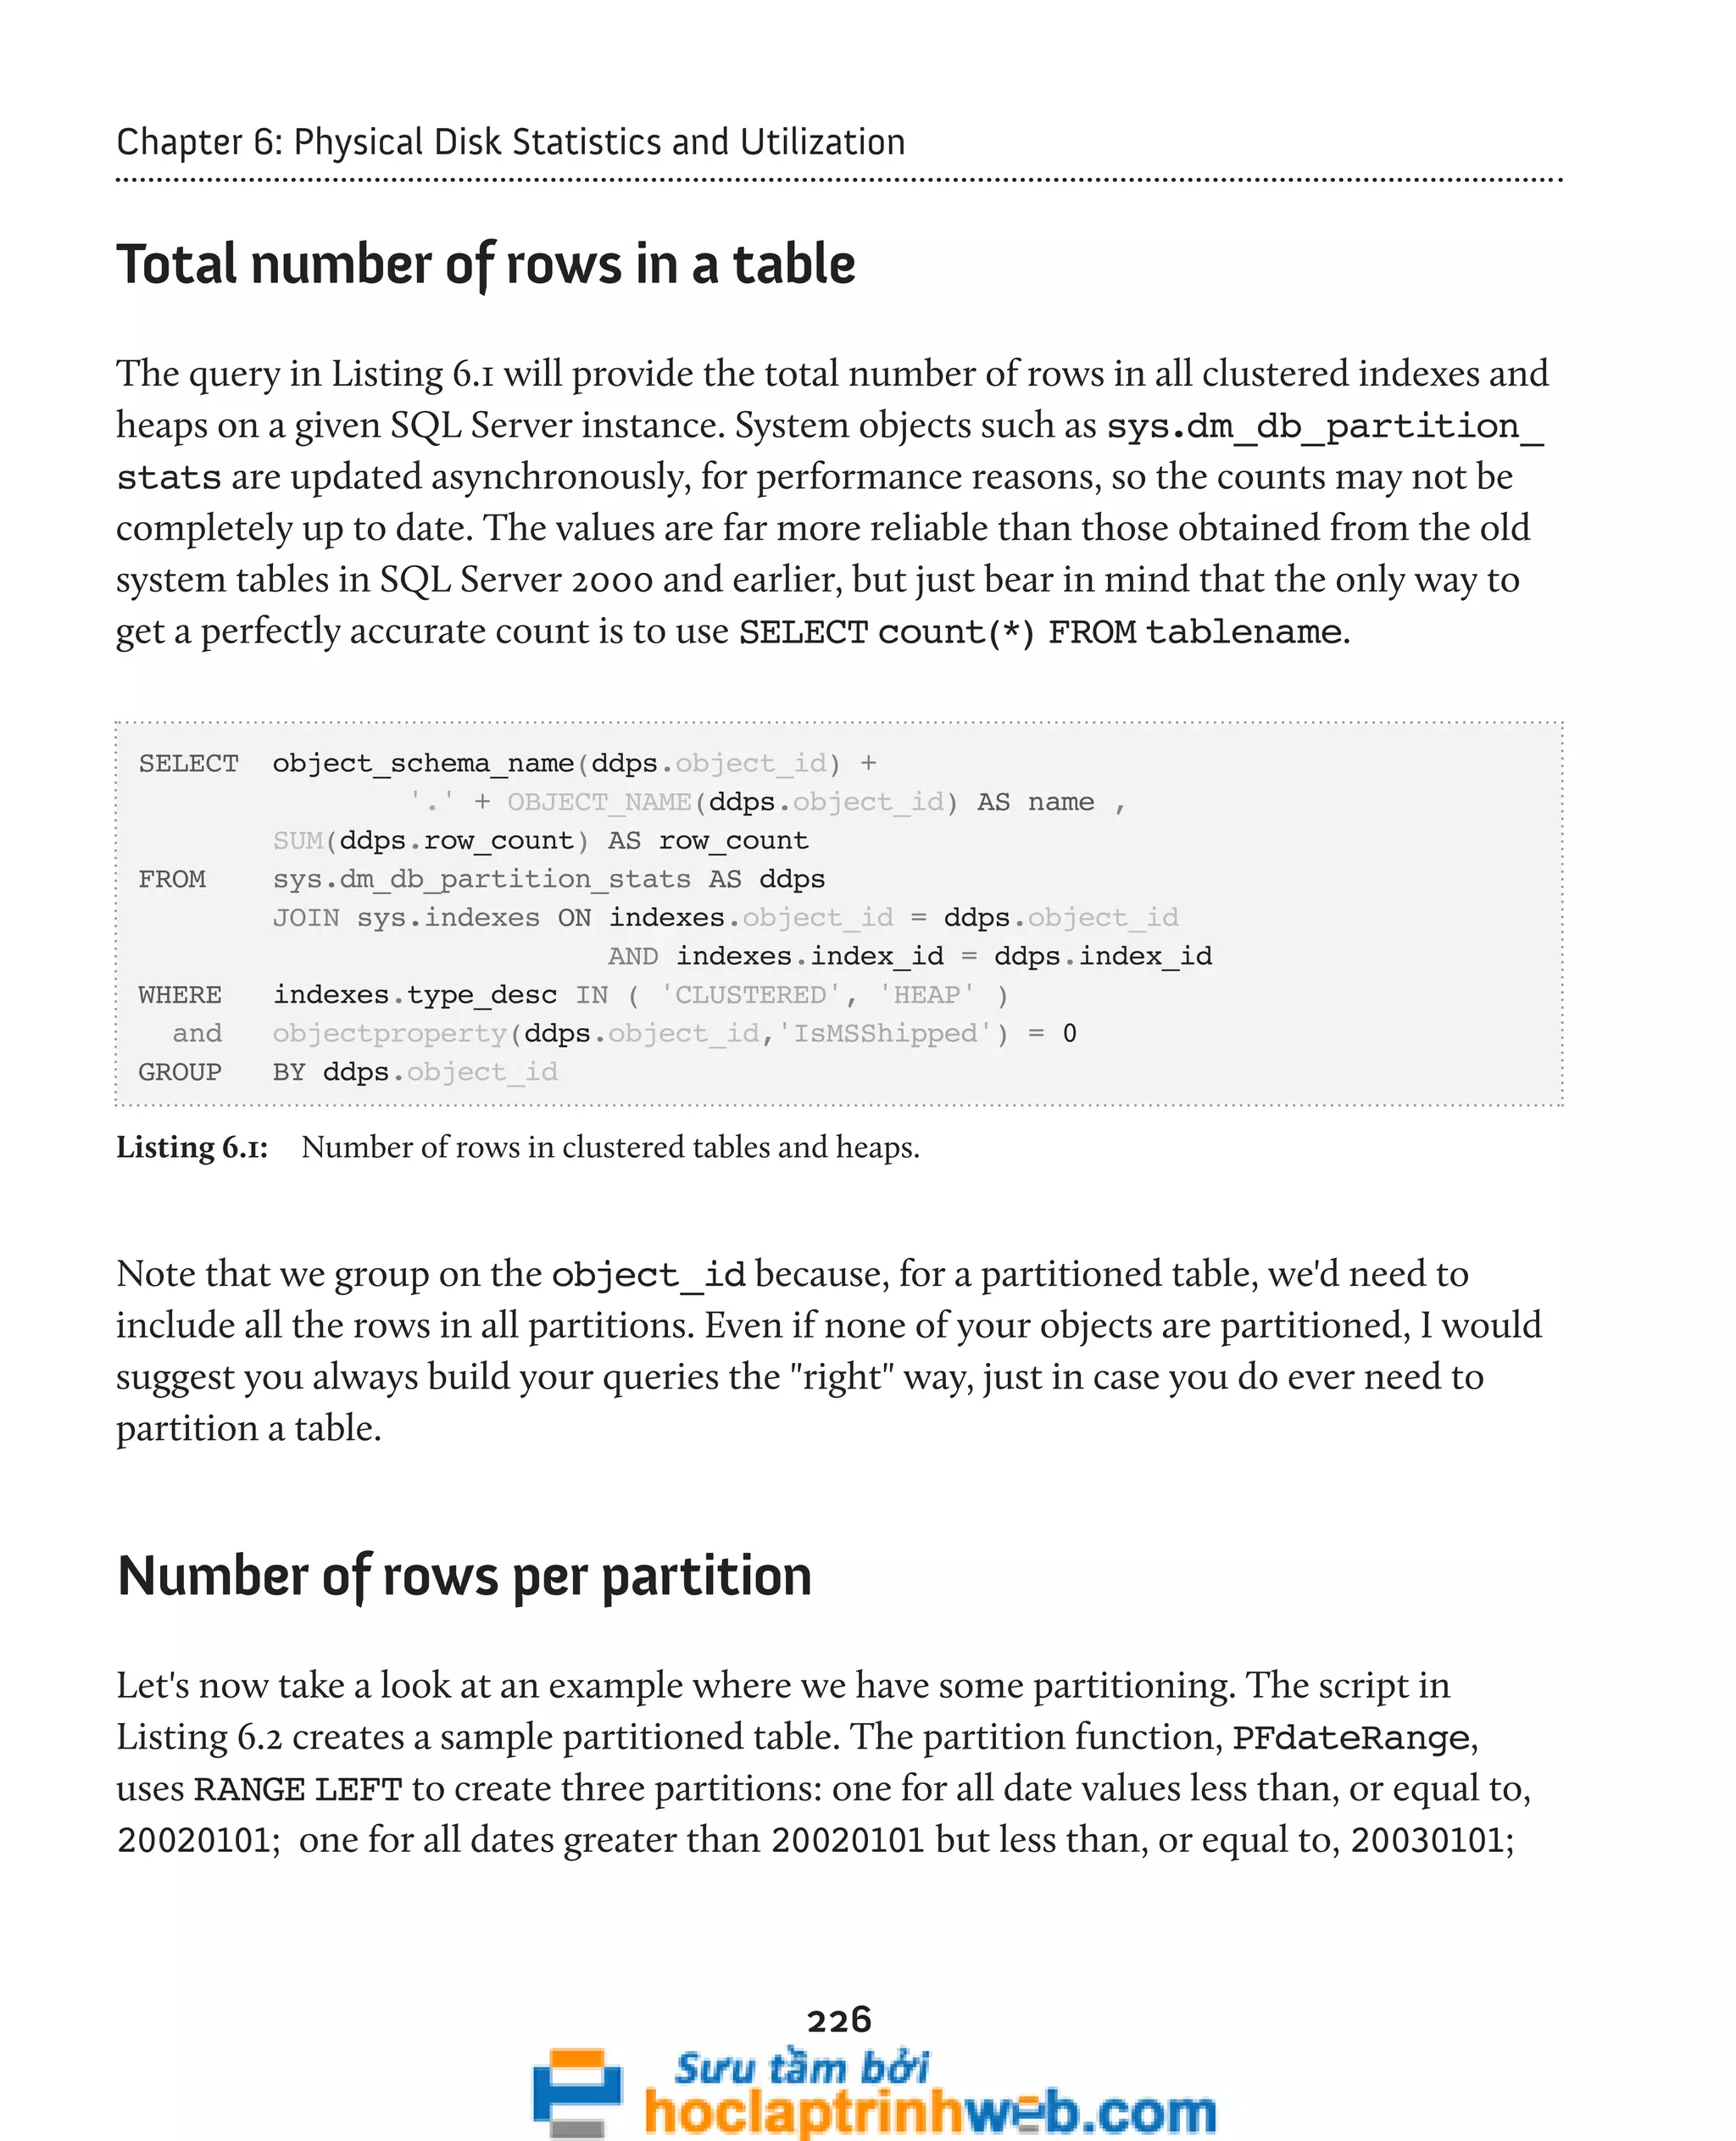
![Chapter 6: Physical Disk Statistics and Utilization
and one for all values greater than 20030101. We then assign rows to each partition
according to the value in the orderDate column.
CREATE PARTITION FUNCTION PFdateRange (SMALLDATETIME)
AS RANGE LEFT FOR VALUES ('20020101','20030101') ;
GO
CREATE PARTITION SCHEME PSdateRange
AS PARTITION PFdateRange ALL TO ( [PRIMARY] )
GO
CREATE TABLE salesOrder
(
salesOrderId INT ,
customerId INT ,
orderAmount DECIMAL(10, 2) ,
orderDate SMALLDATETIME ,
CONSTRAINT PKsalesOrder PRIMARY KEY NONCLUSTERED ( salesOrderId )
ON [Primary] ,
CONSTRAINT AKsalesOrder UNIQUE CLUSTERED ( salesOrderId, orderDate )
)
--the ON clause causes this clustered table to be partitioned by orderDate
--using the partition function/scheme
ON PSdateRange(orderDate)
GO
--Generate some random data
INSERT INTO salesOrder
227
SELECT SalesOrderId ,
CustomerId ,
TotalDue ,
OrderDate
FROM AdventureWorks.Sales.SalesOrderHeader
Listing 6.2: Creating a three-partition salesOrder table.
To find out how many rows are in each partition, we can use the query shown in
Listing 6.3.](https://image.slidesharecdn.com/ebookperformancetuningdavidsonford-141014034404-conversion-gate02/75/c-227-2048.jpg)
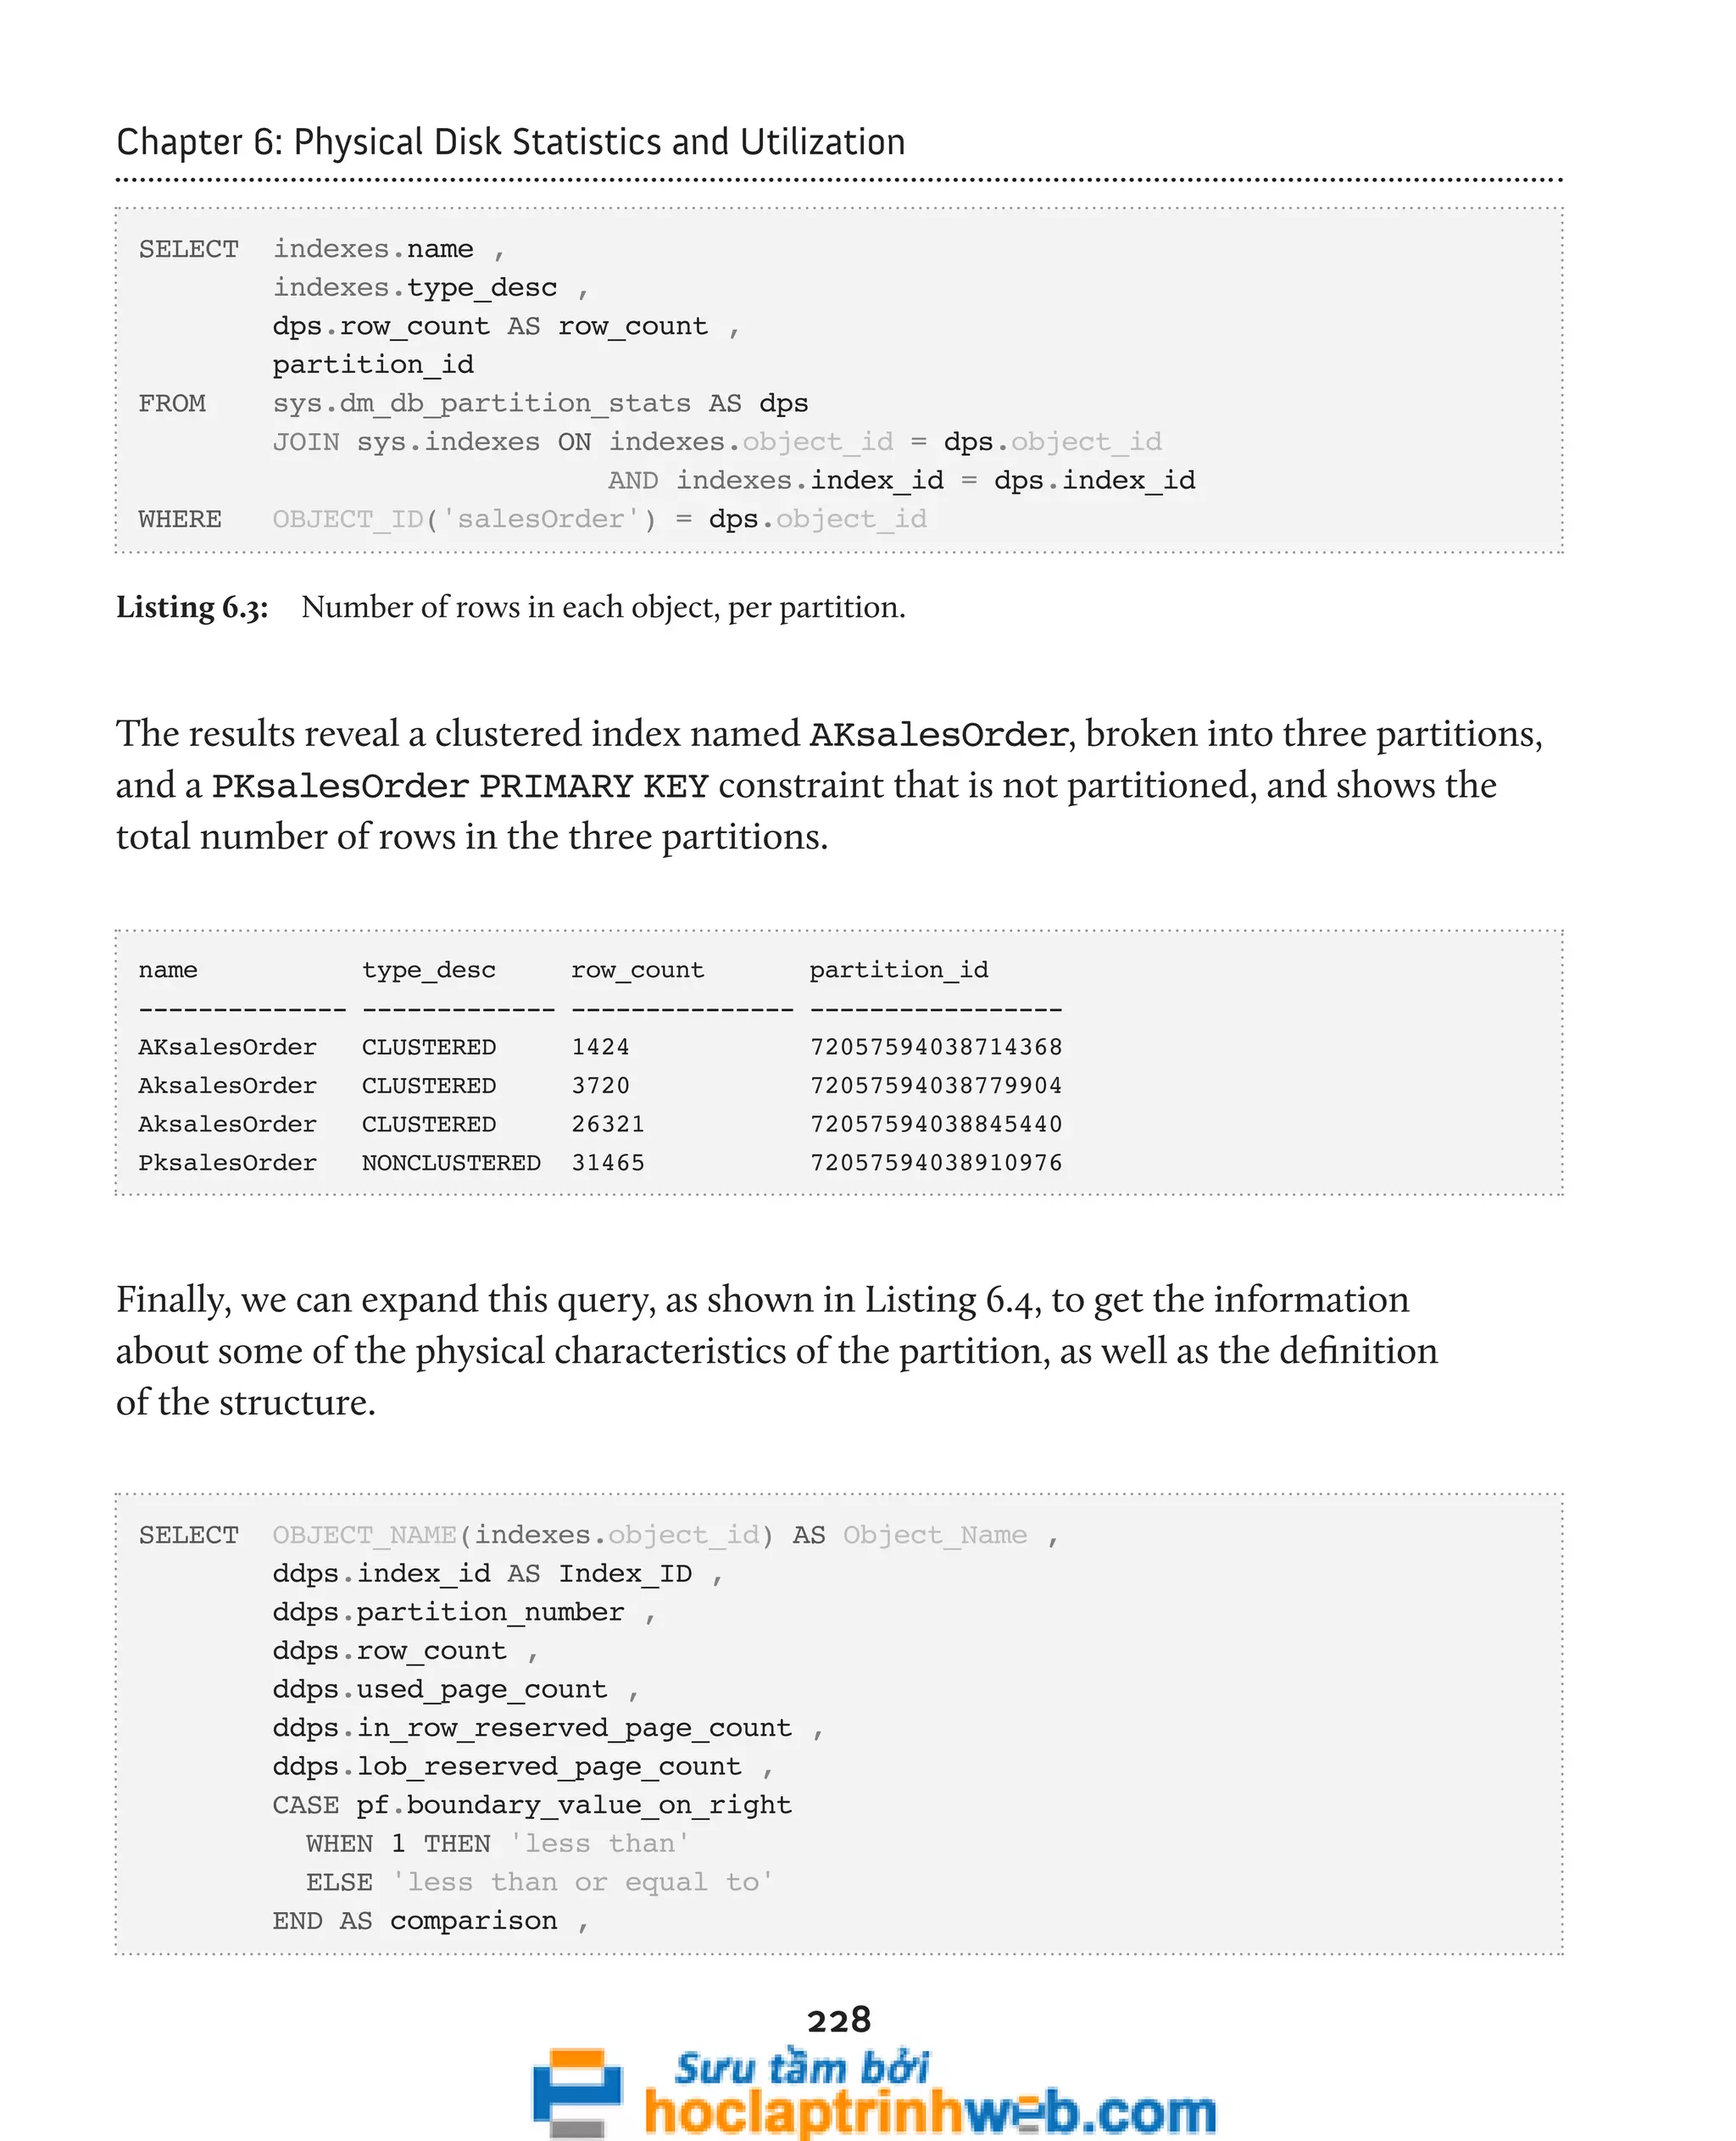
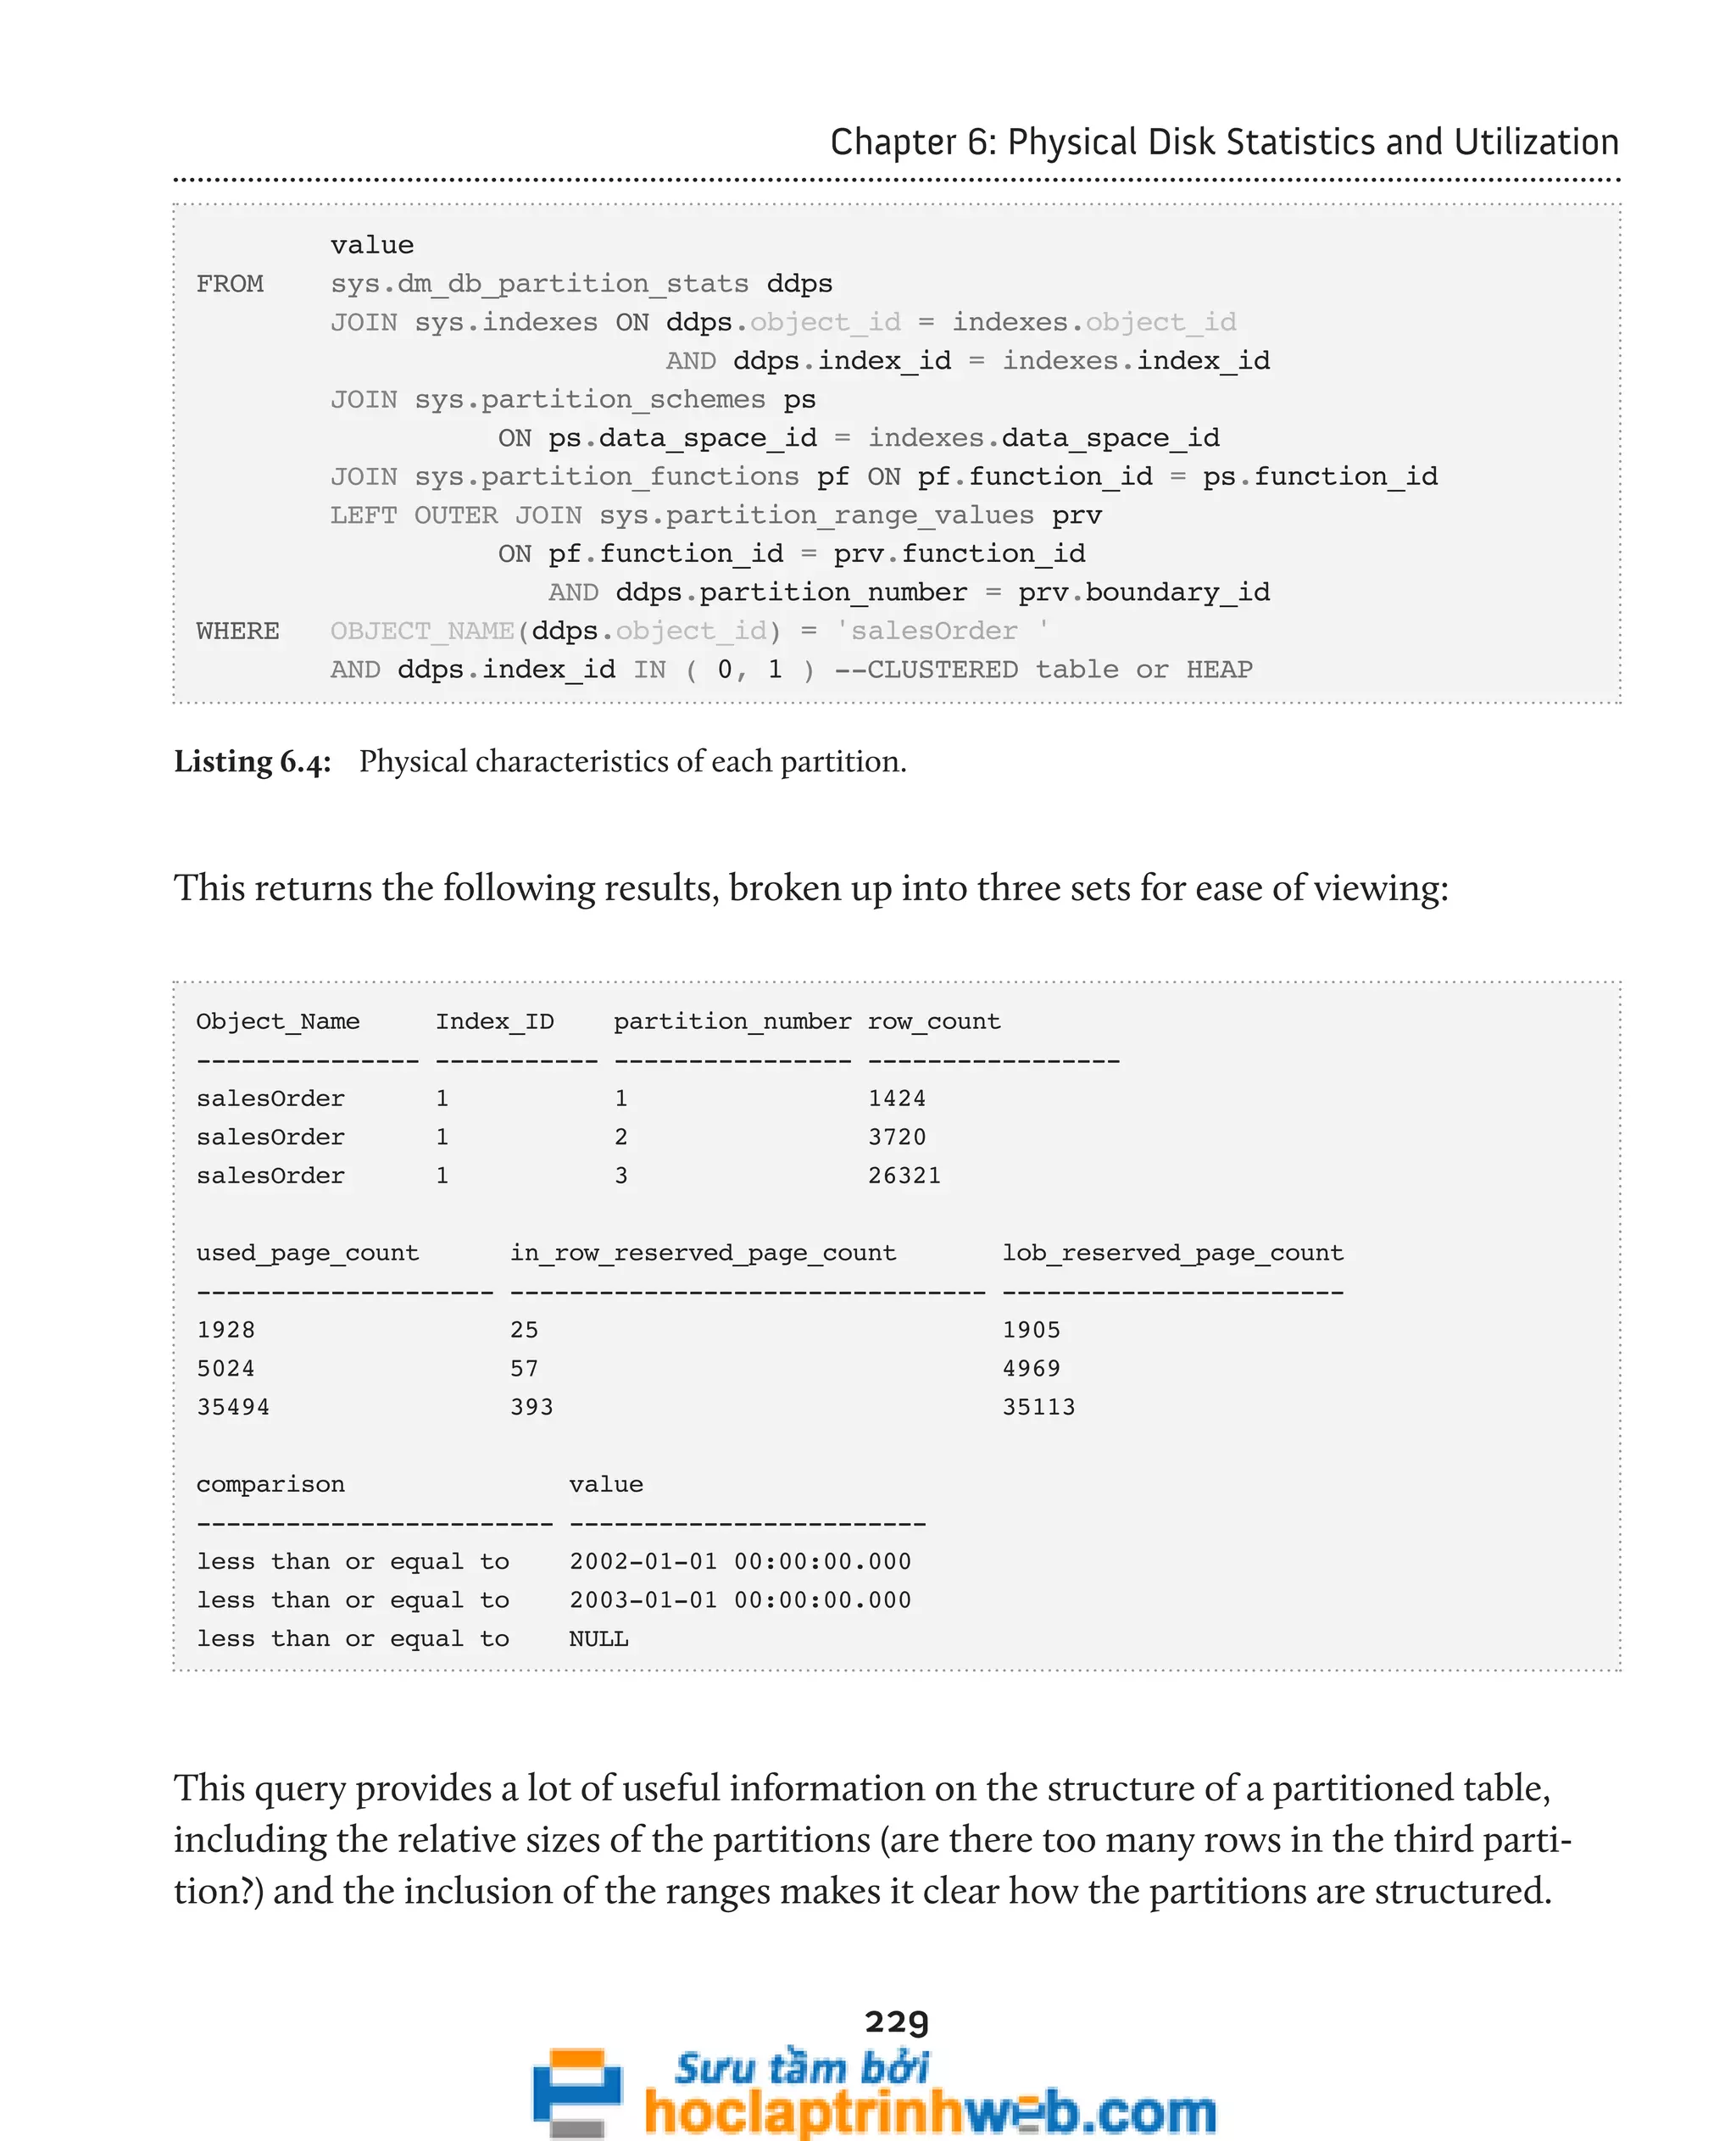

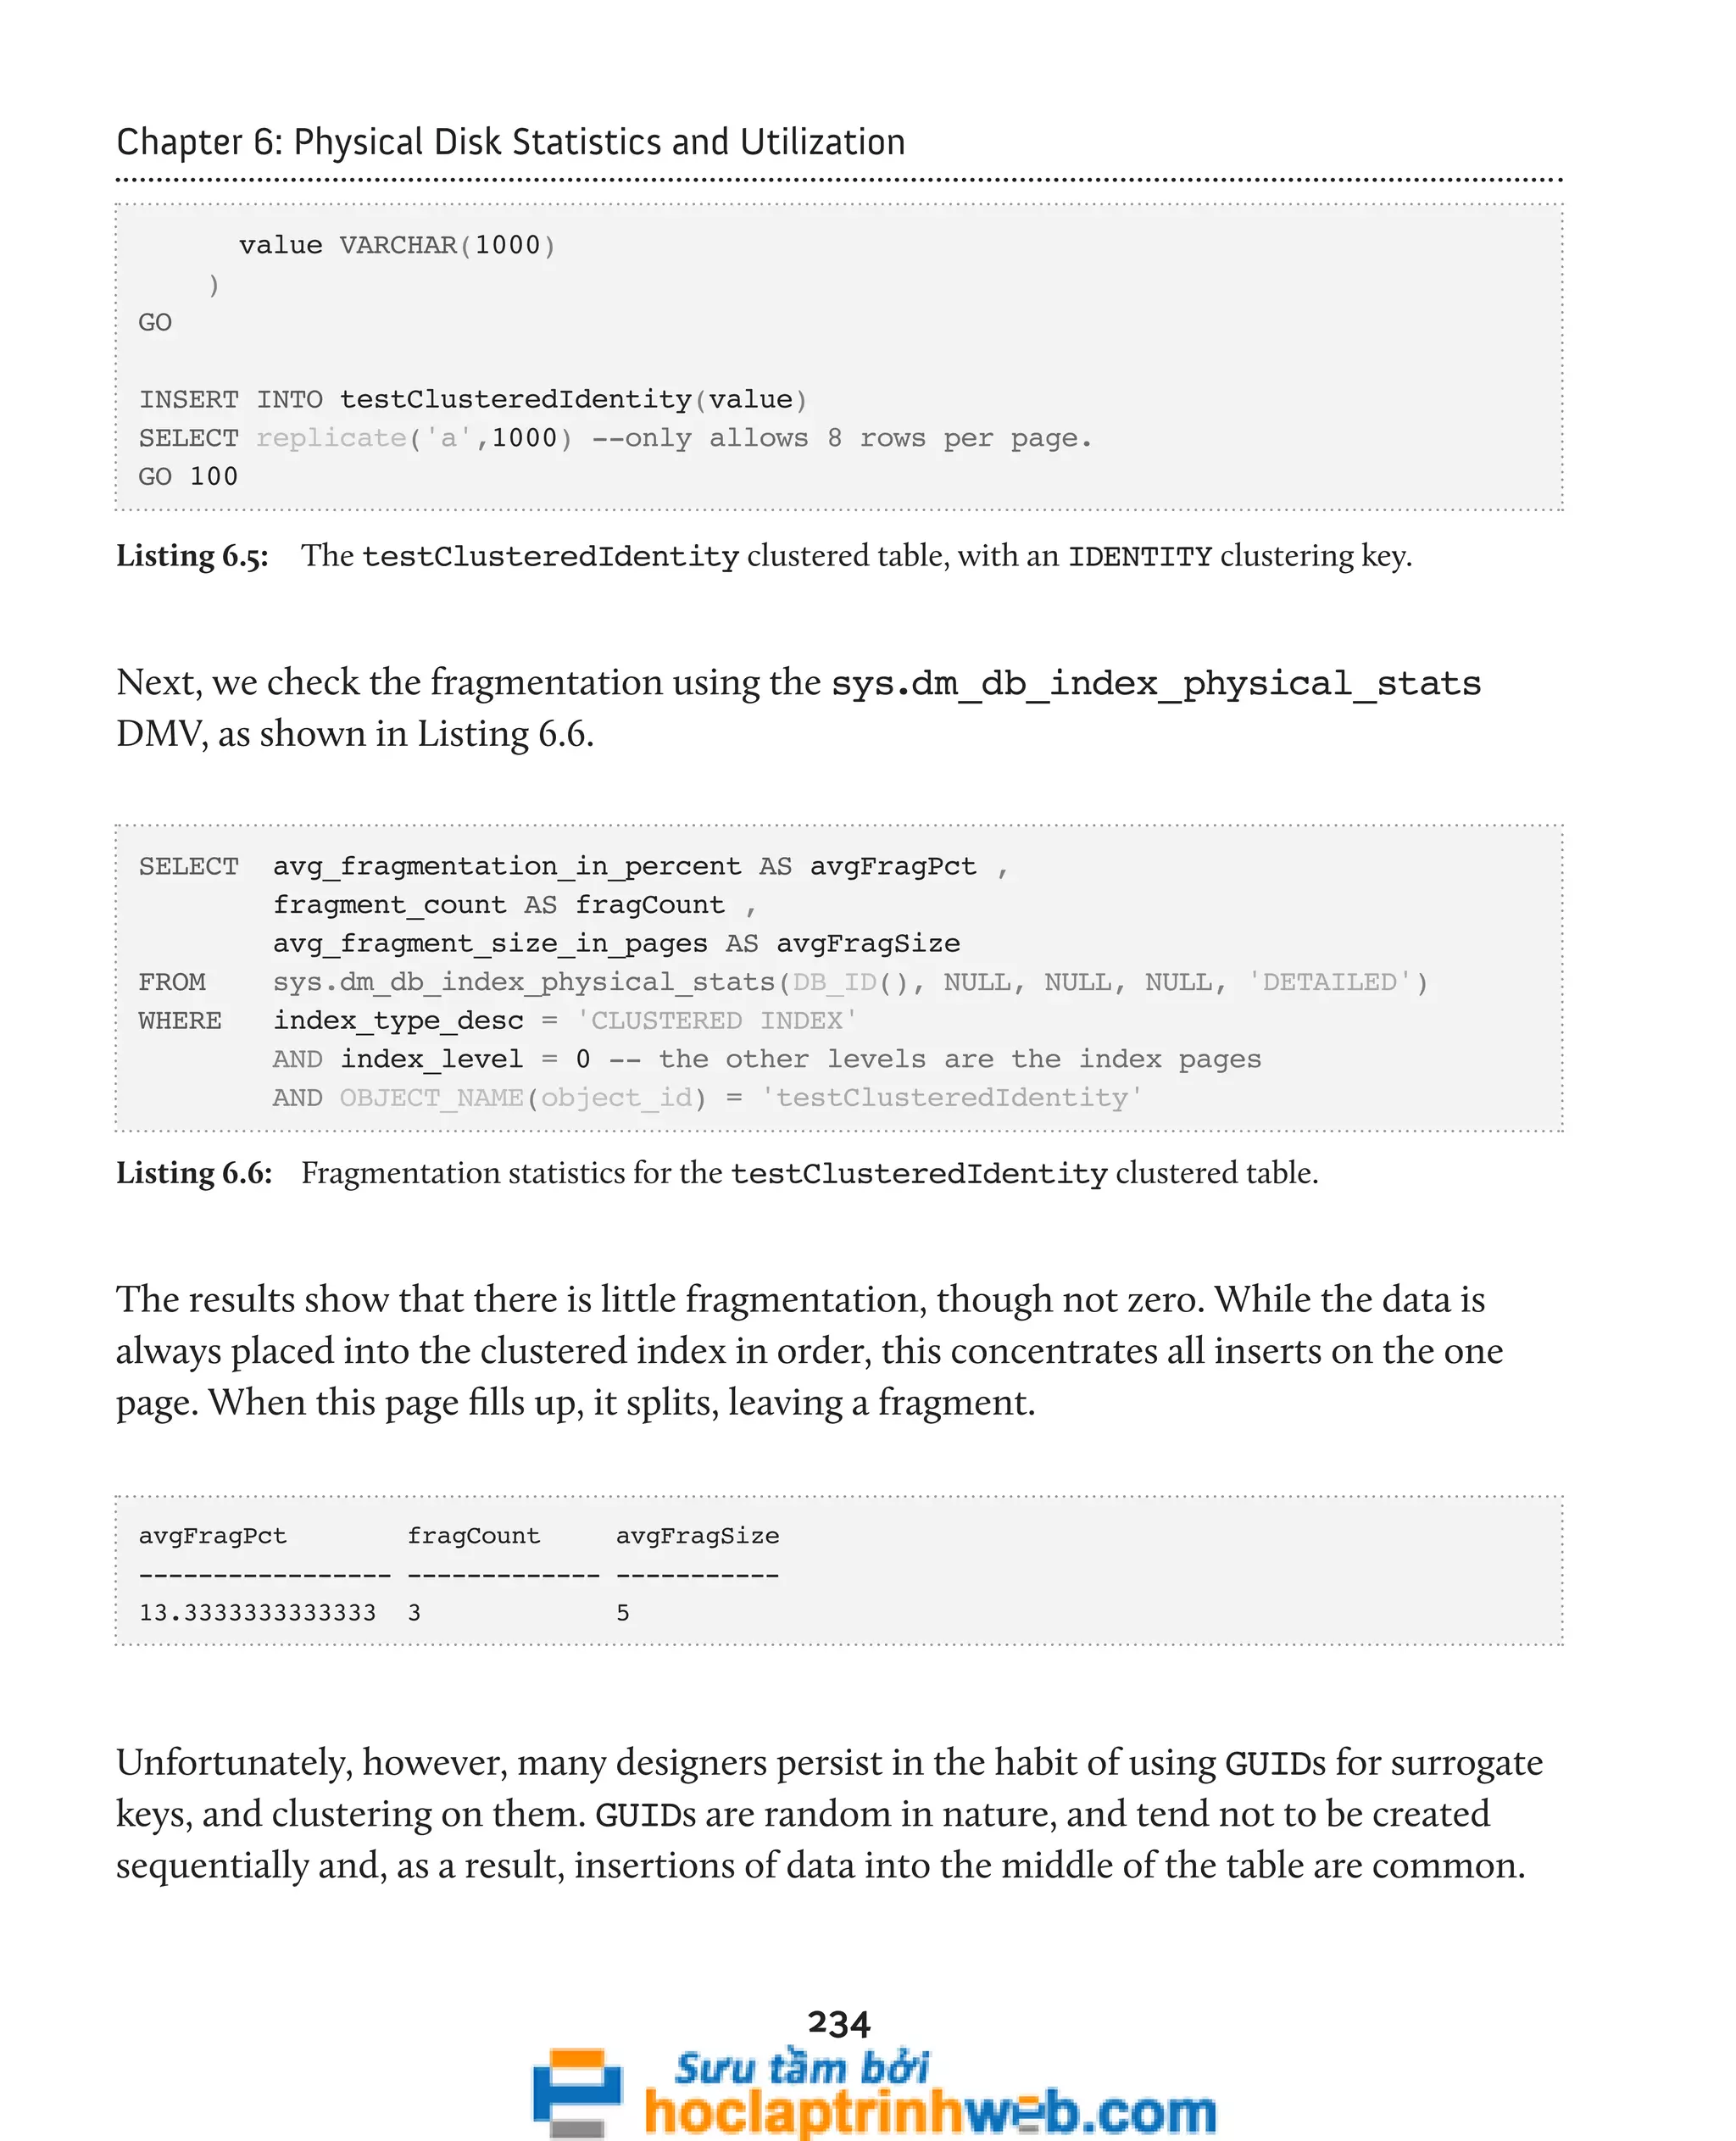
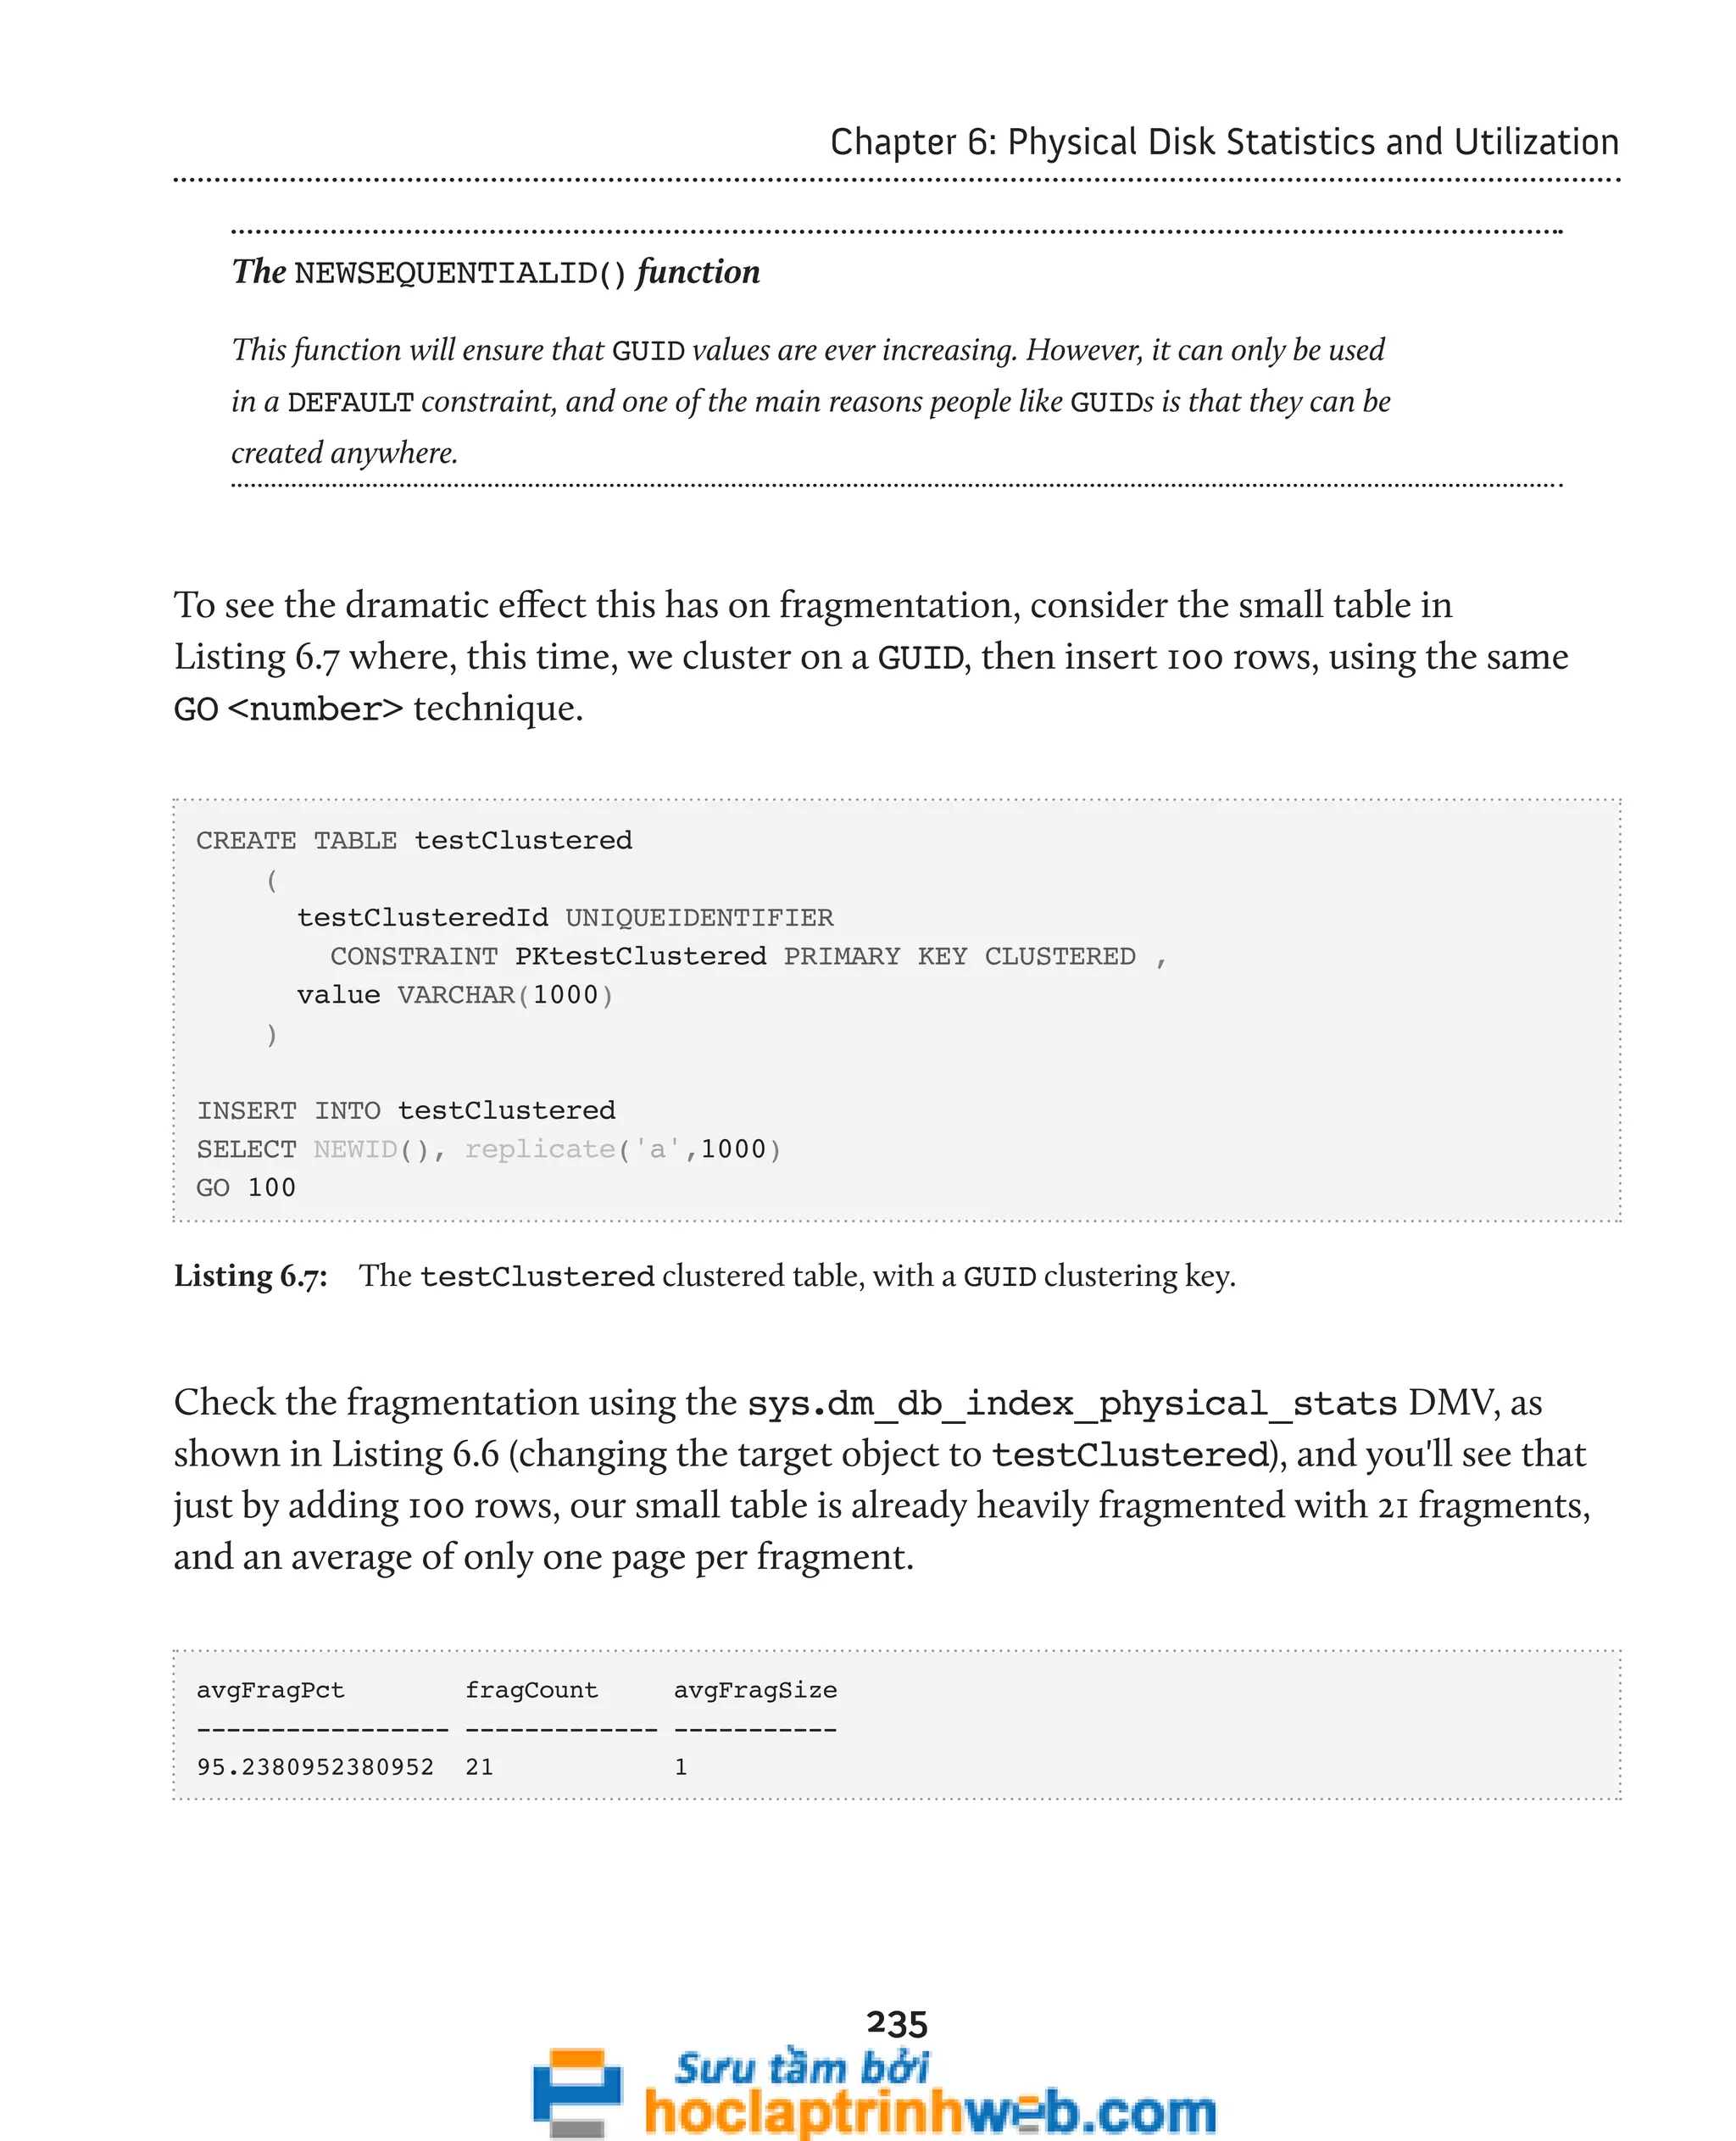
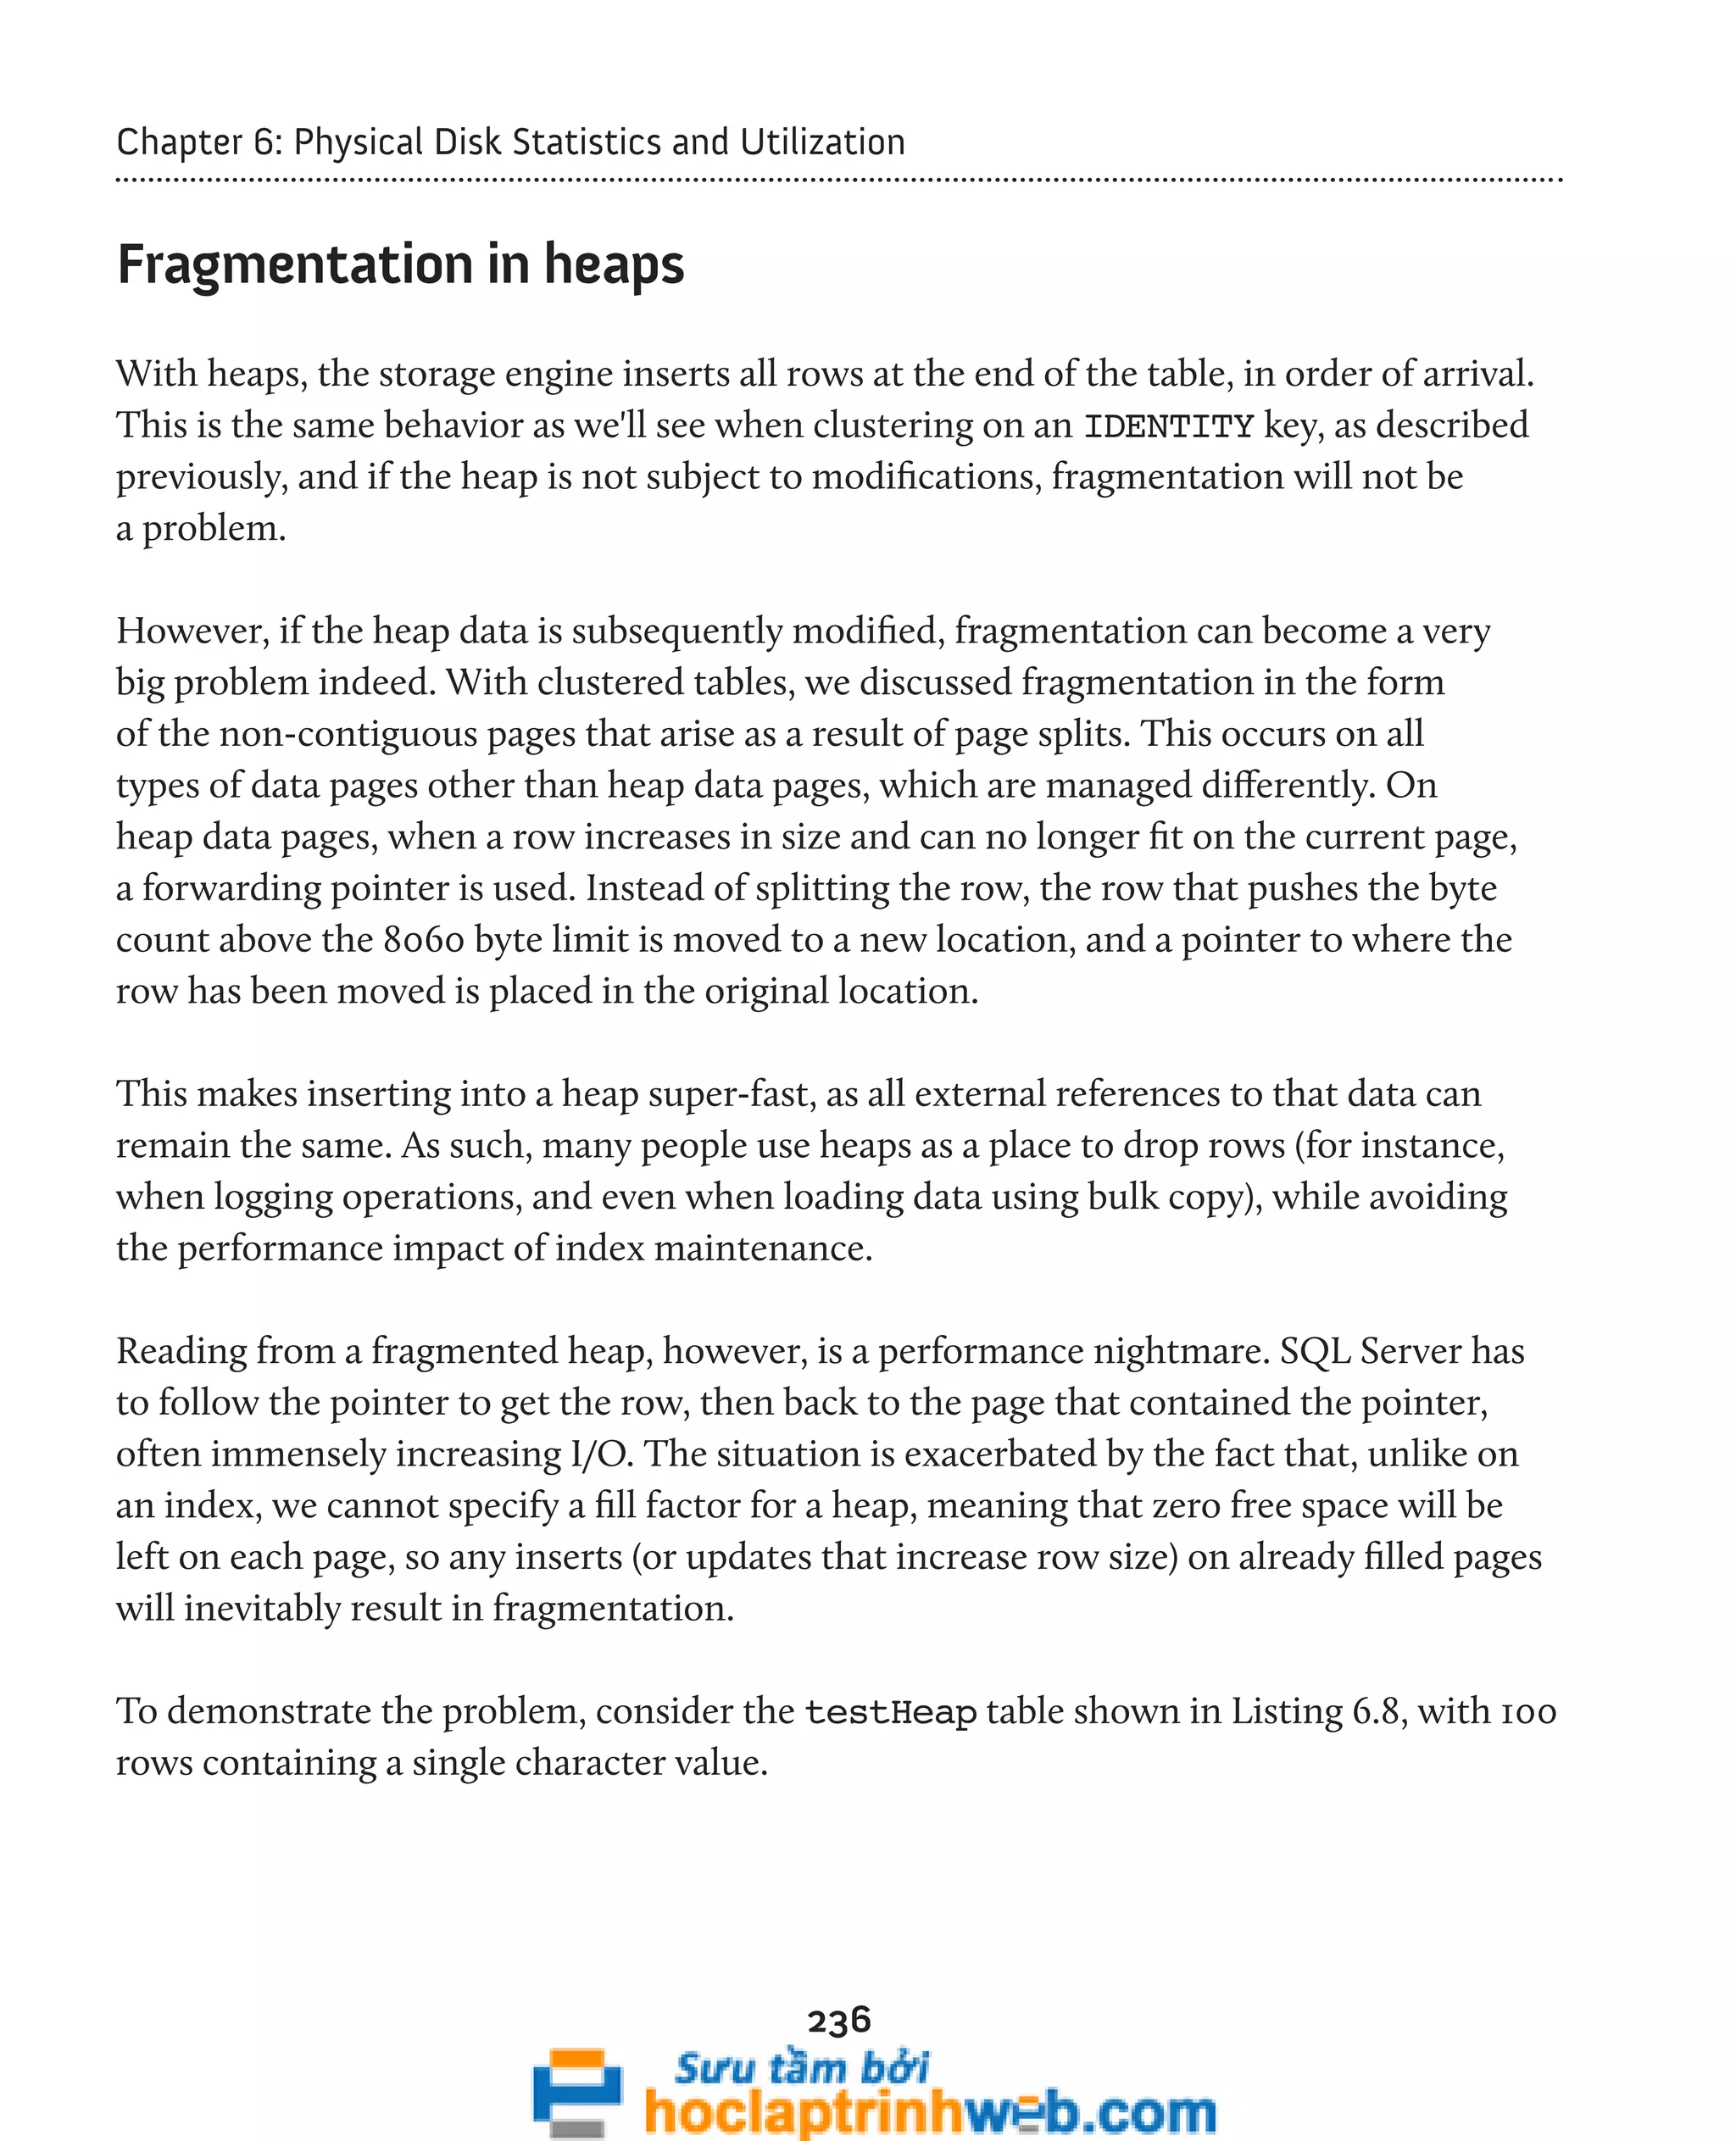
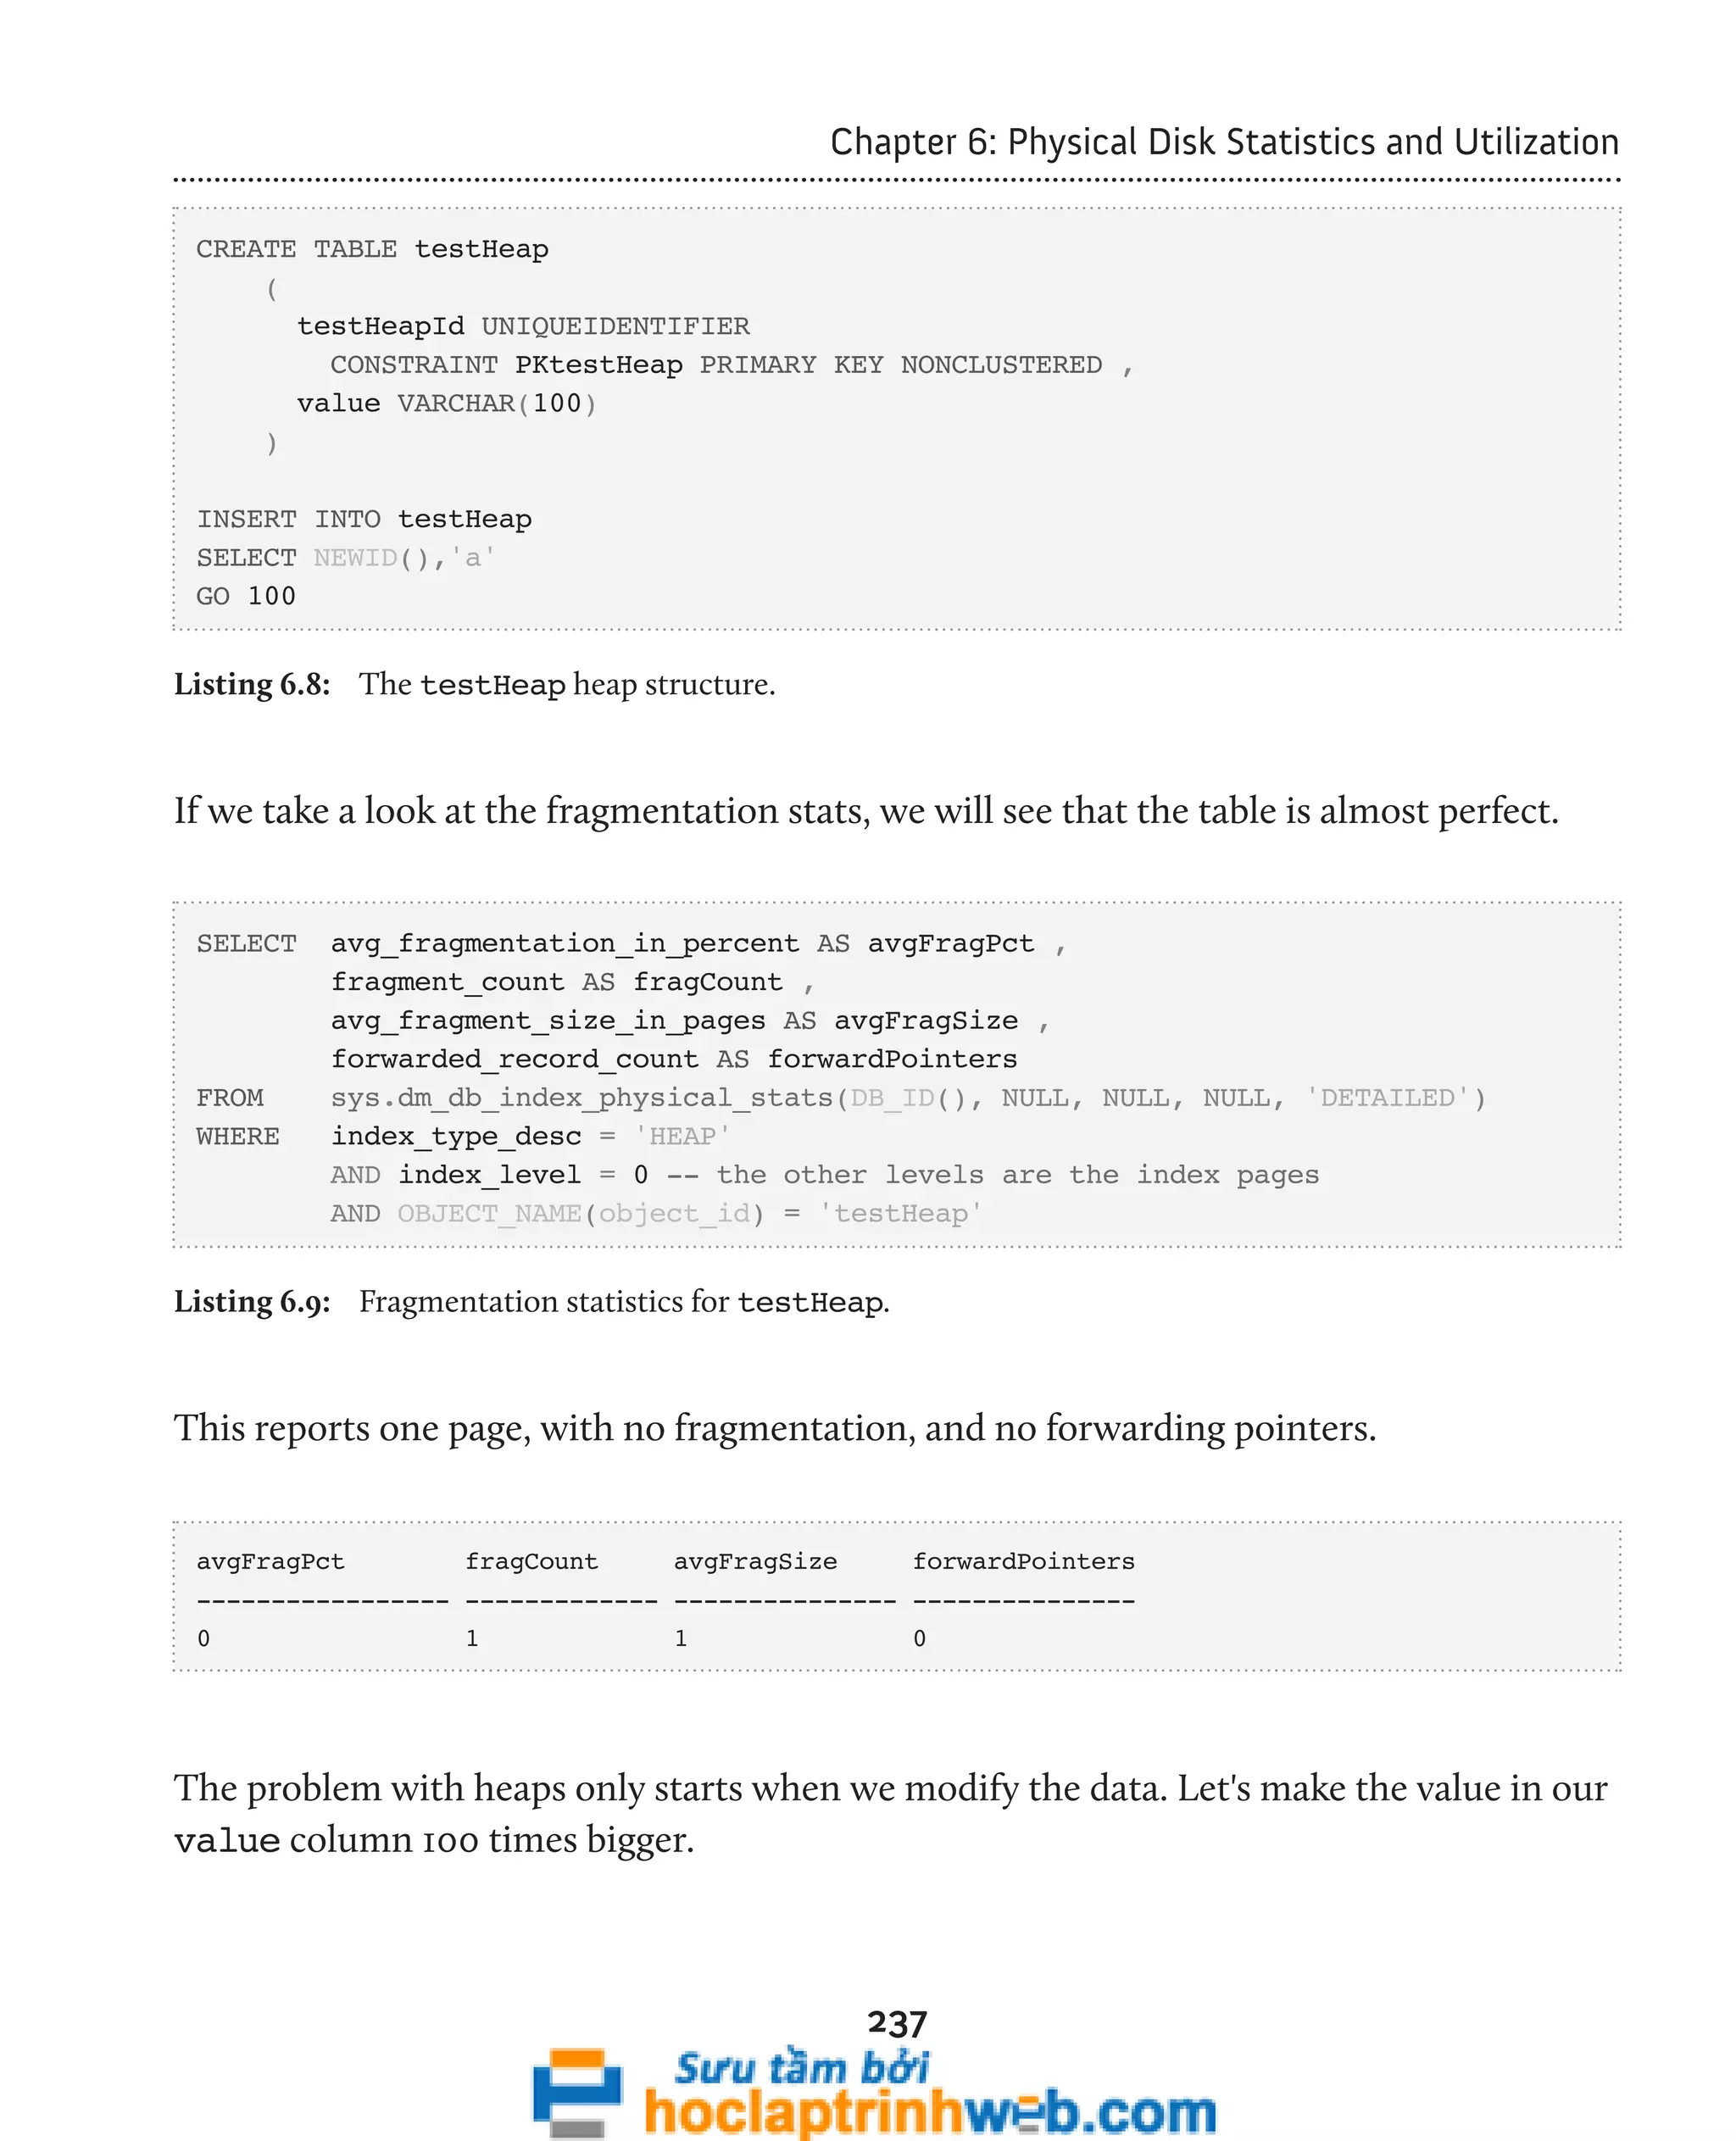
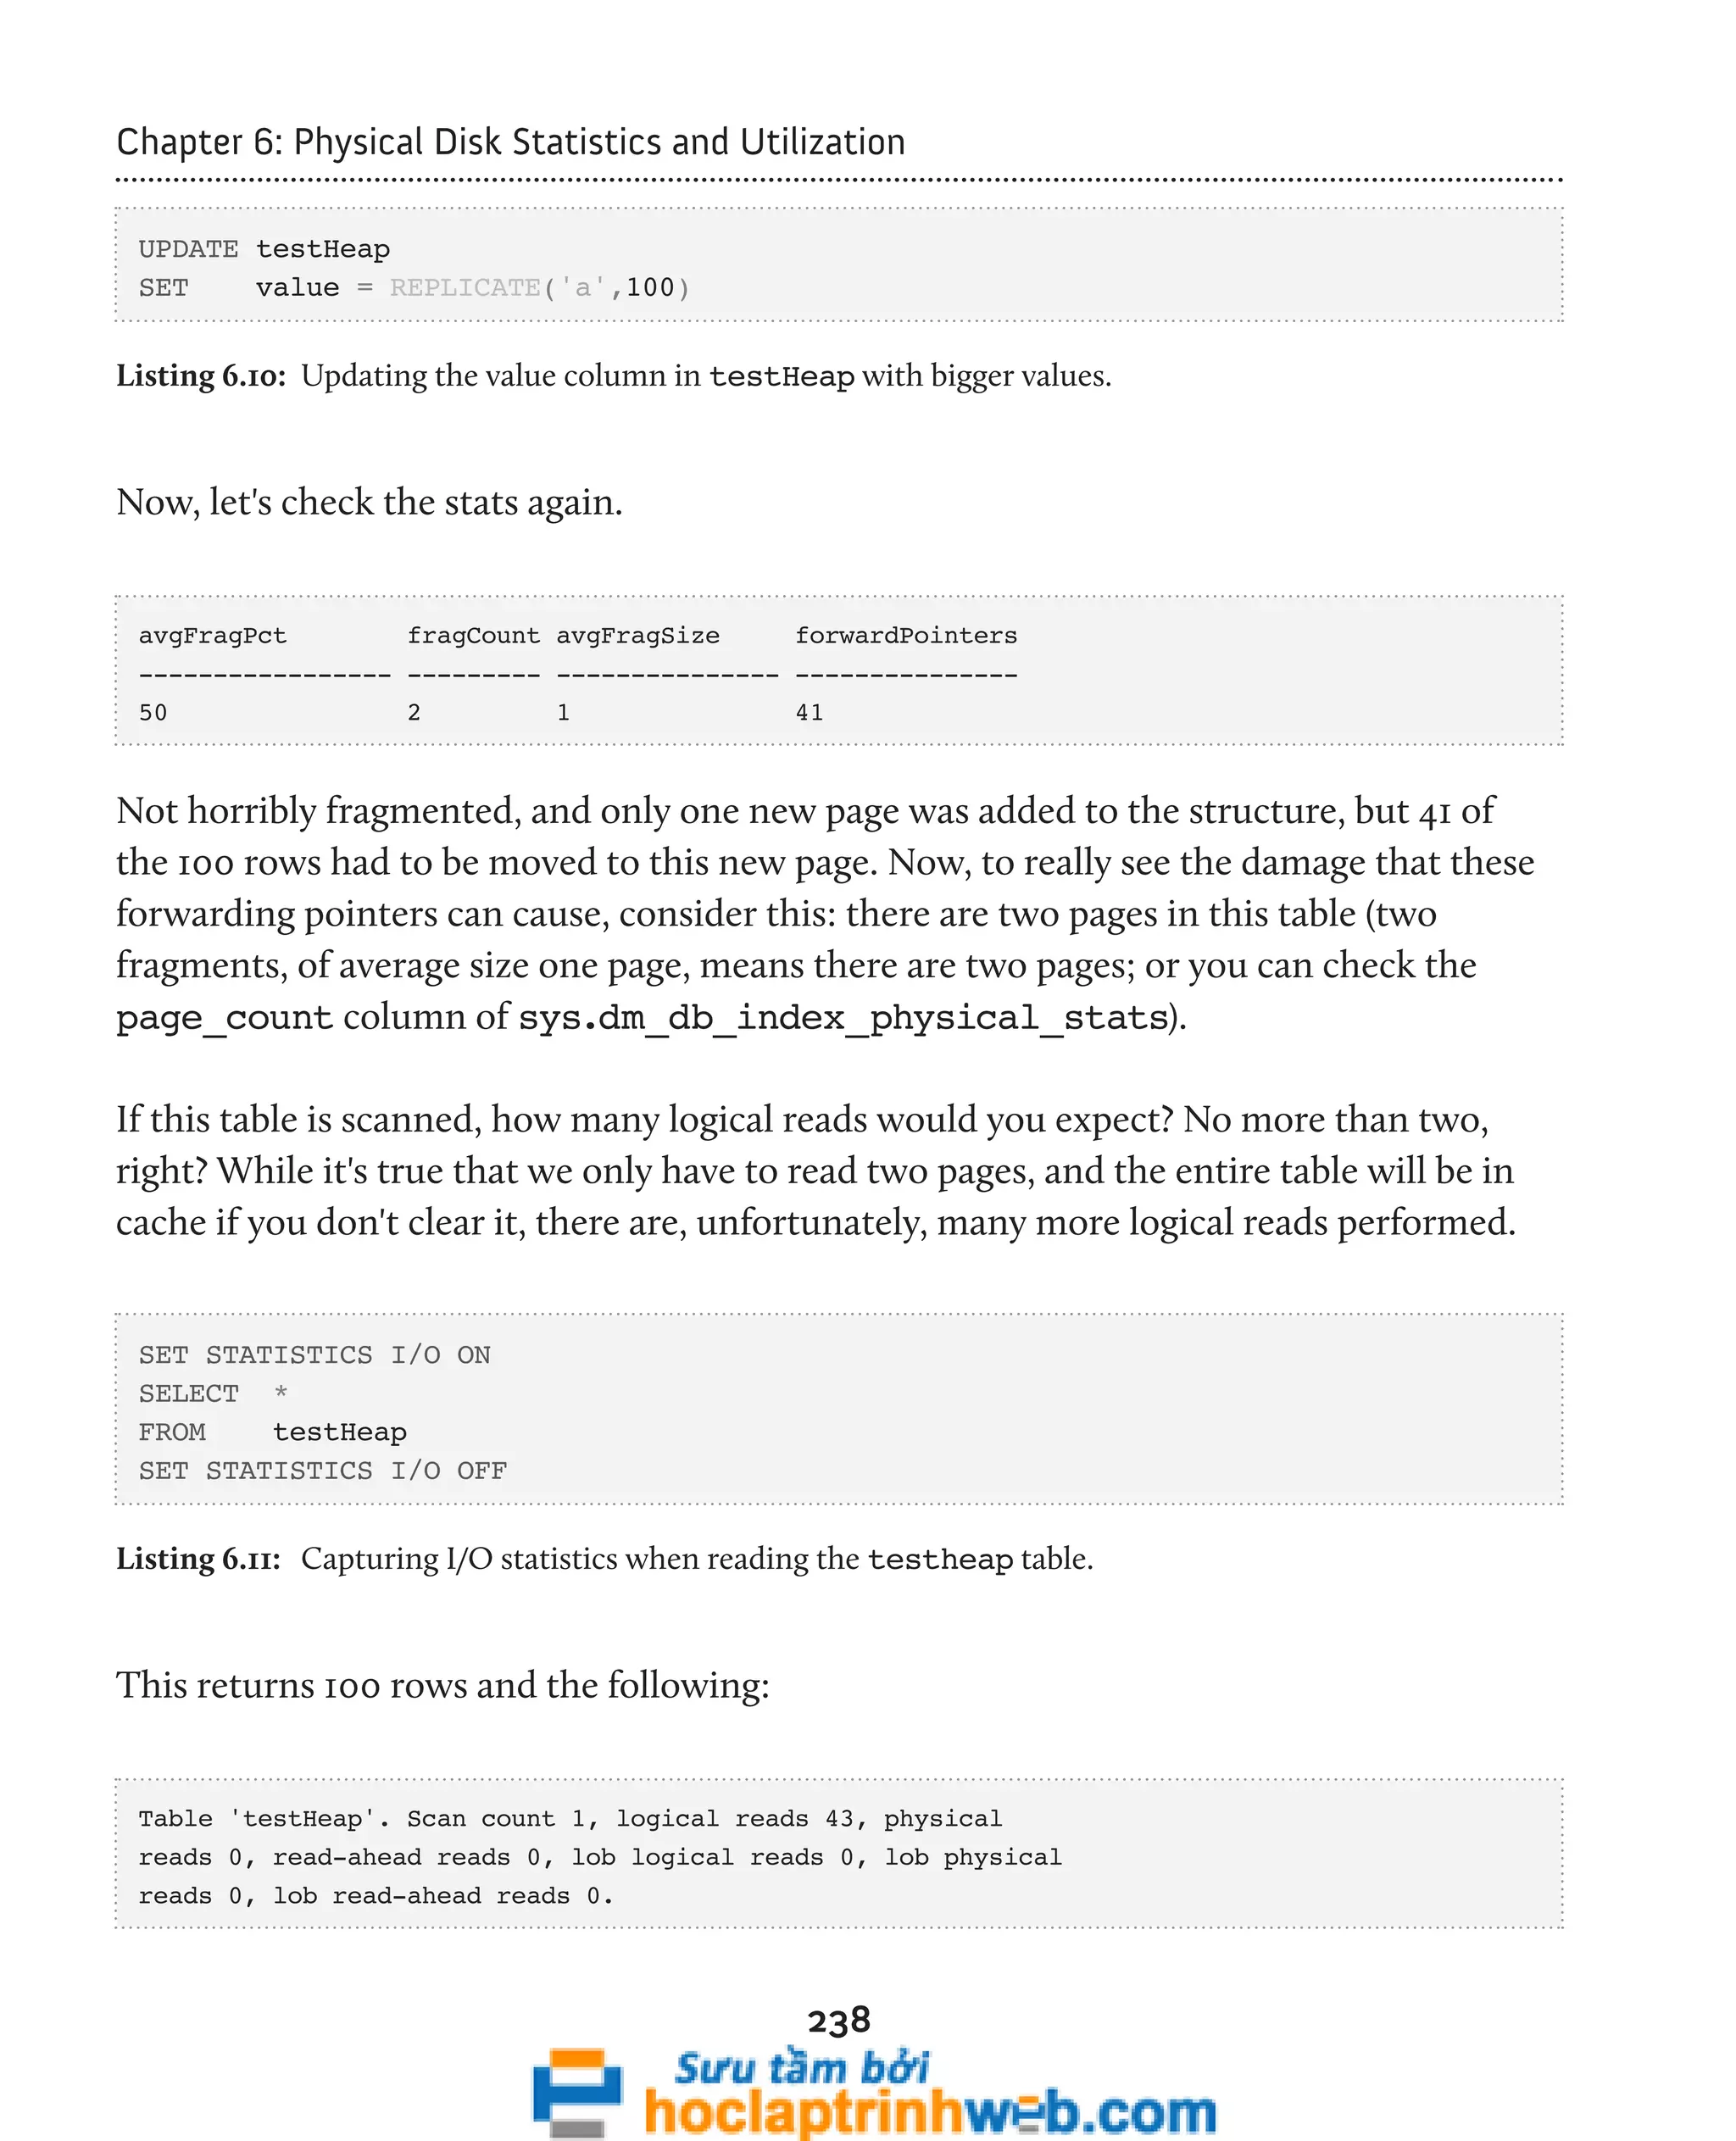
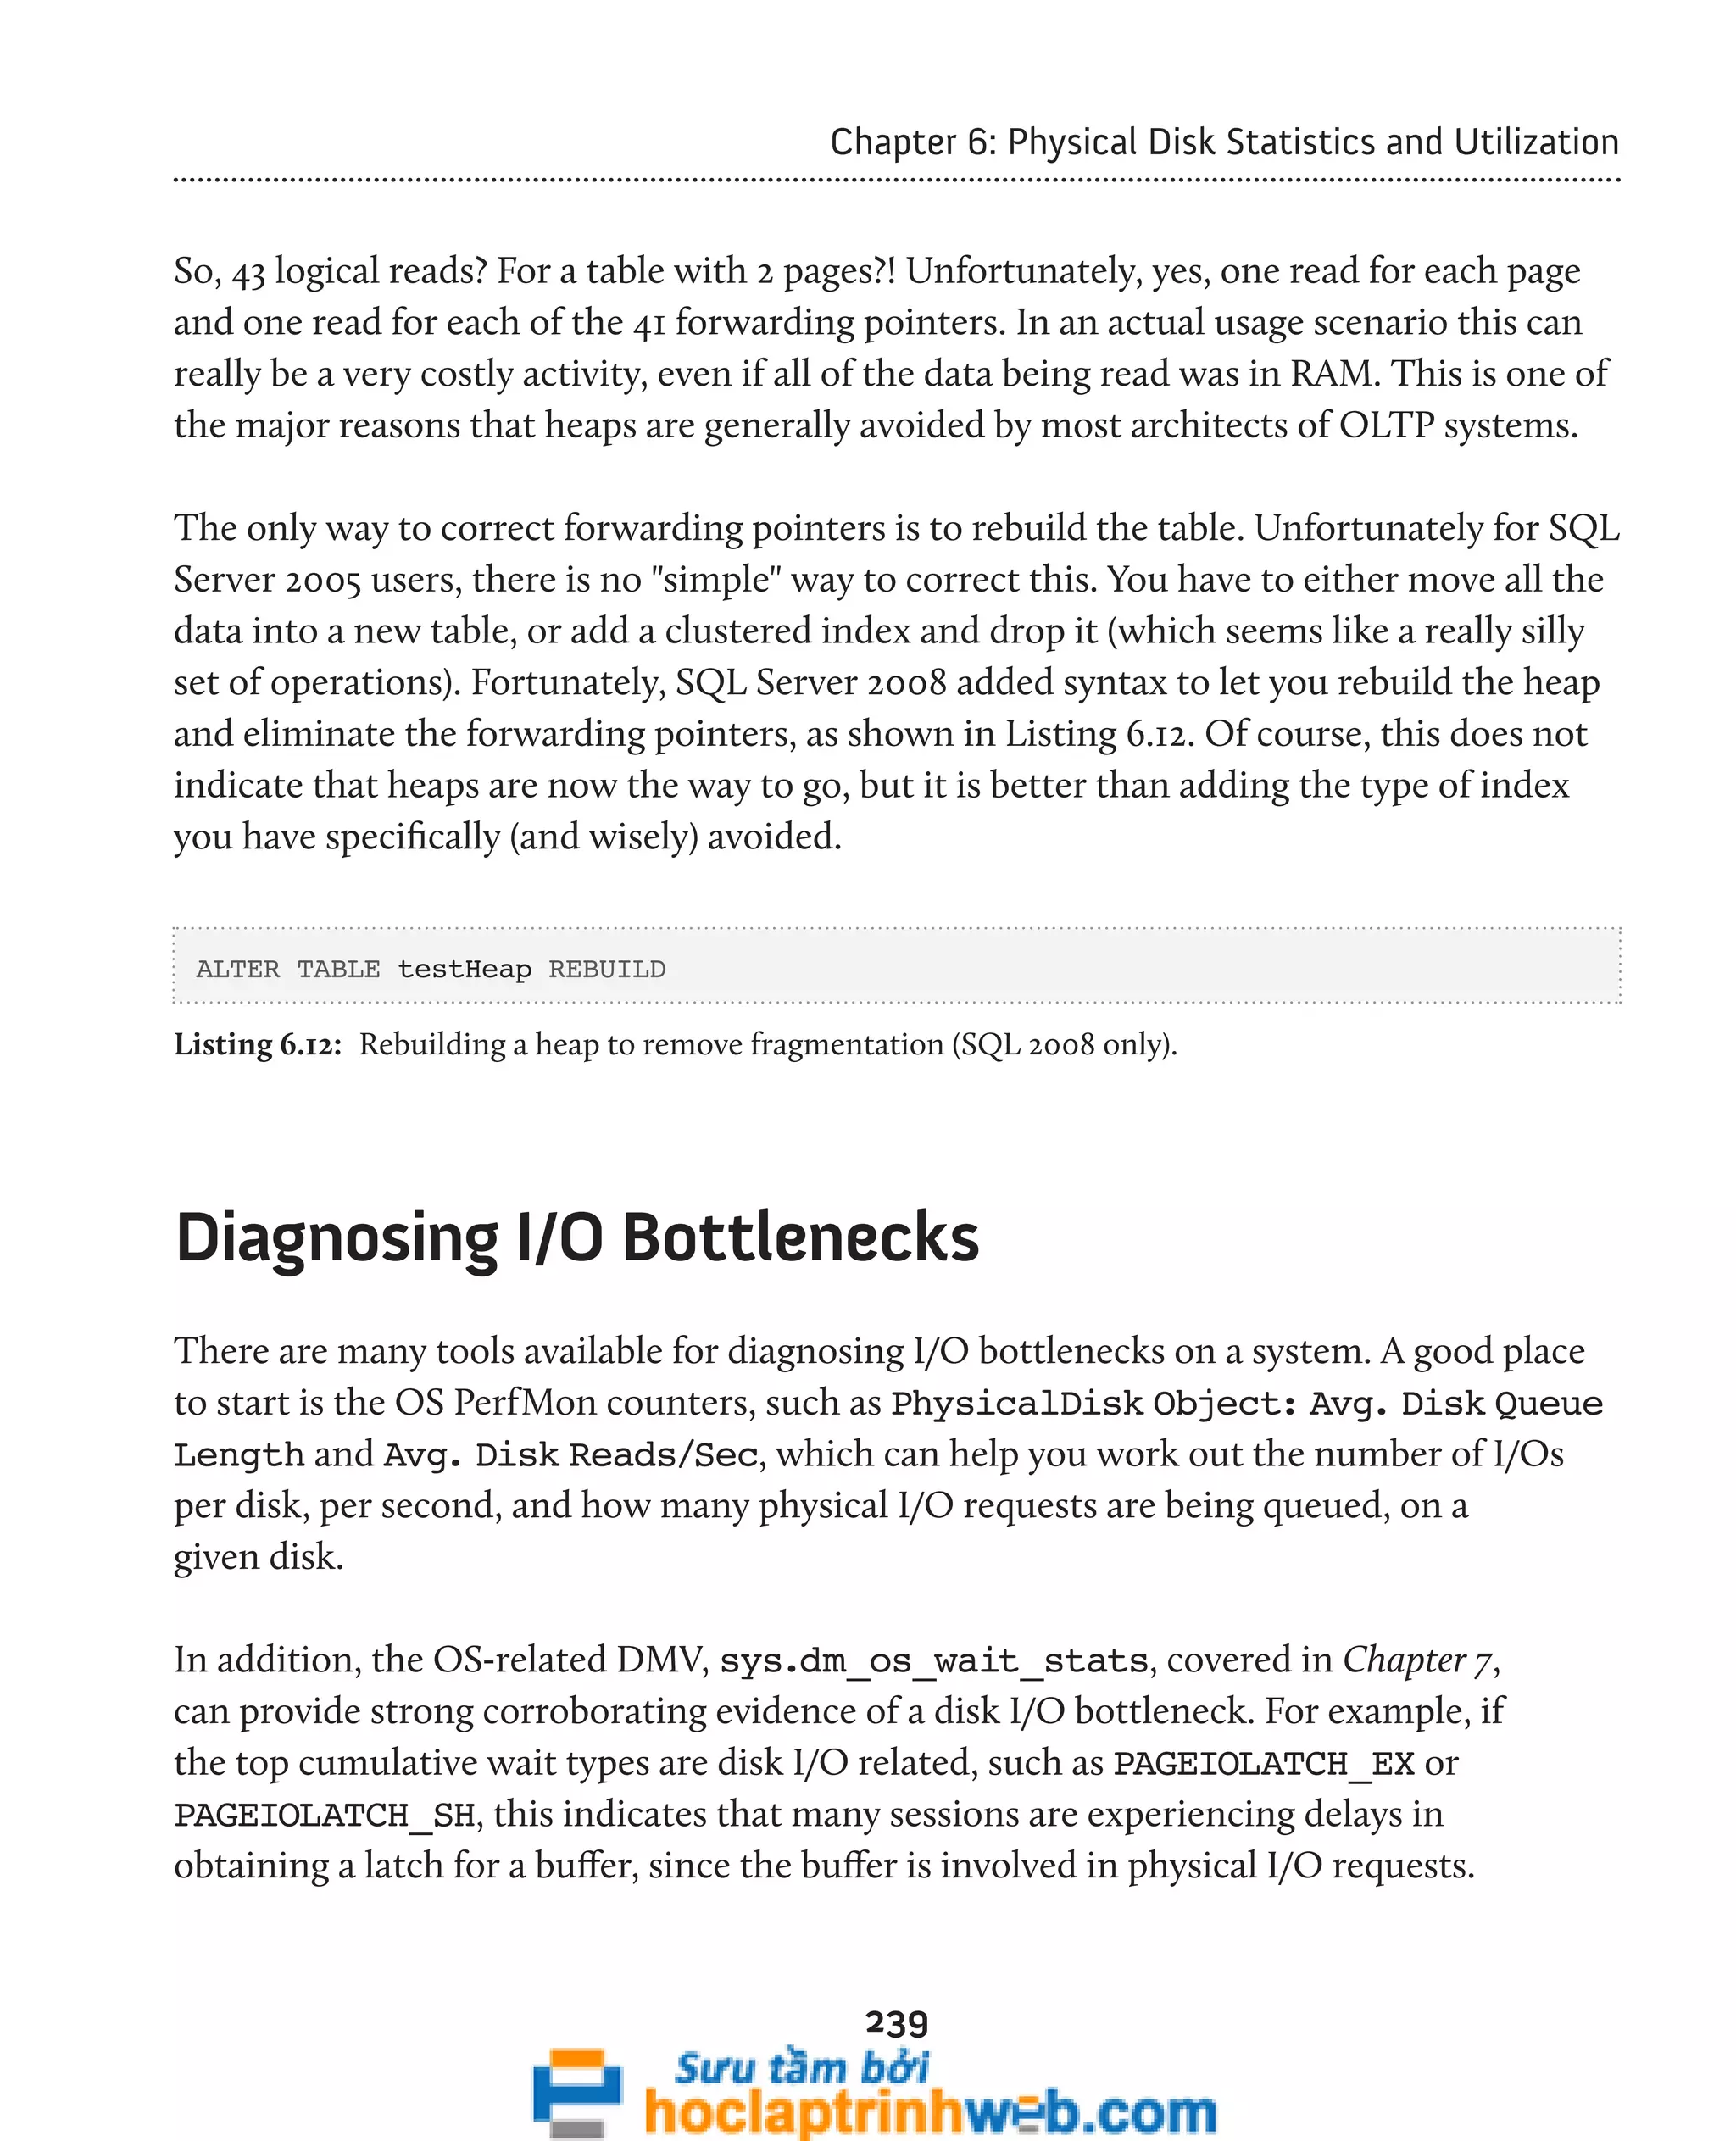

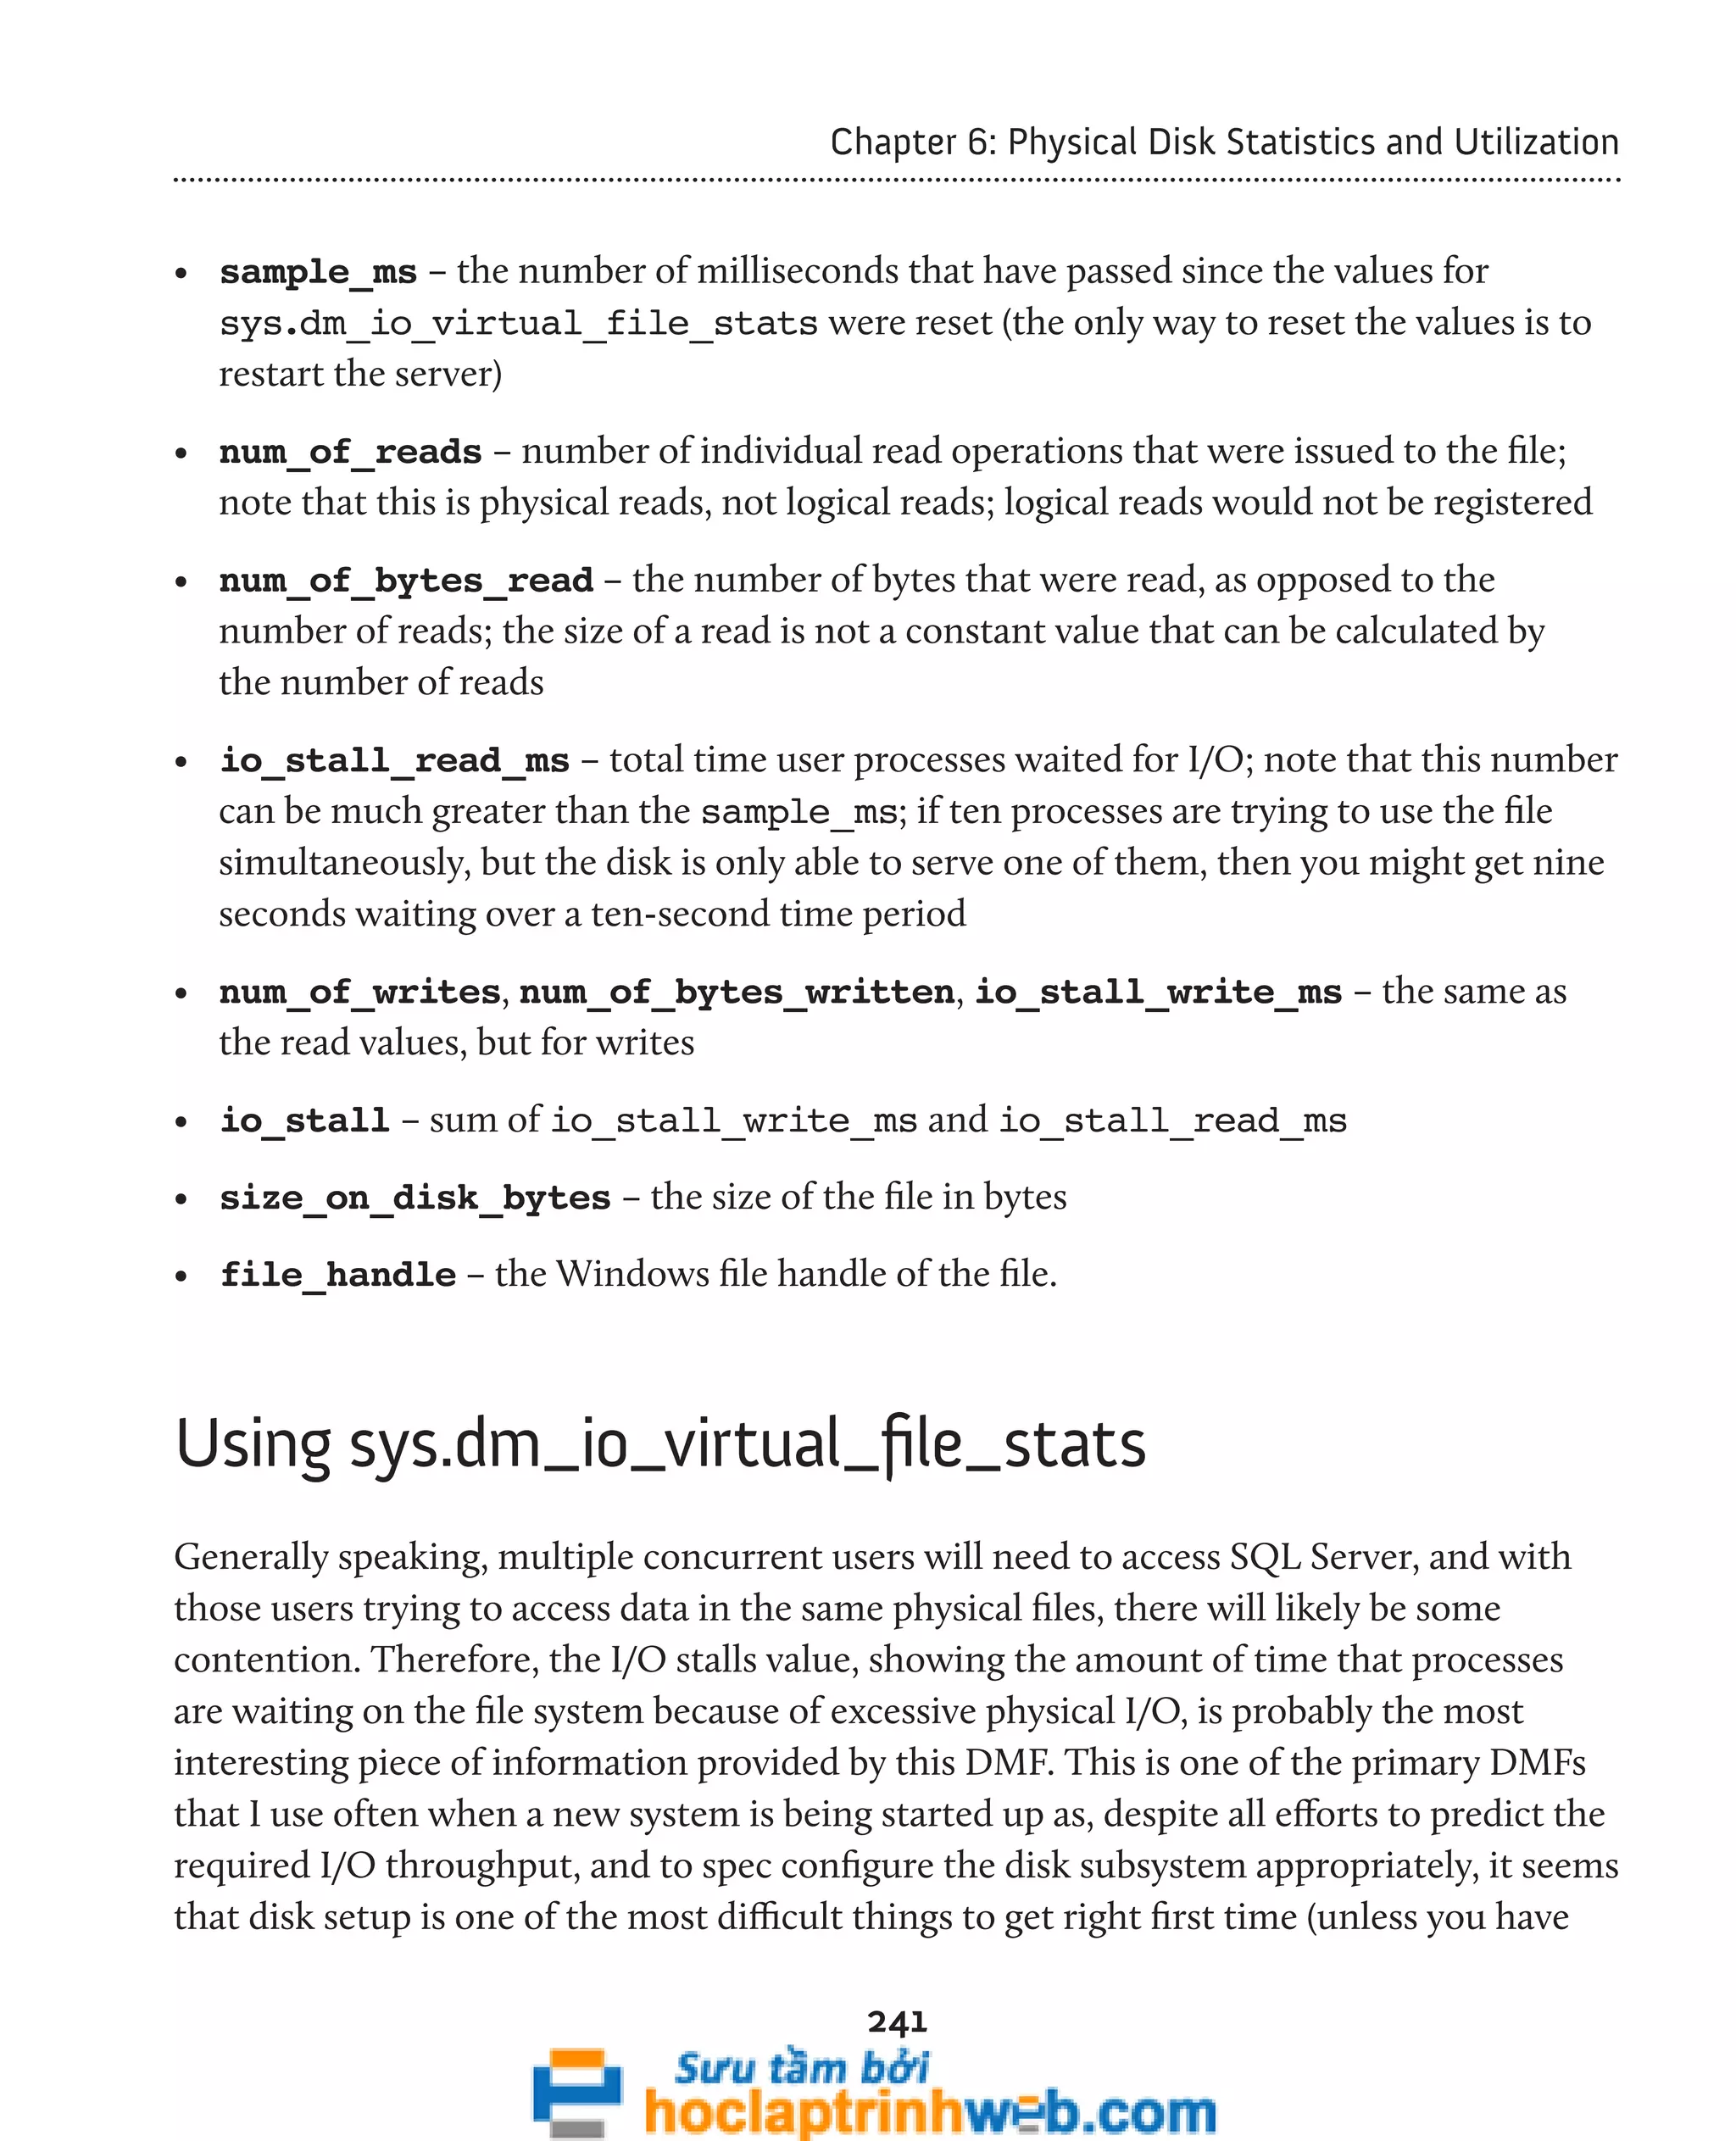
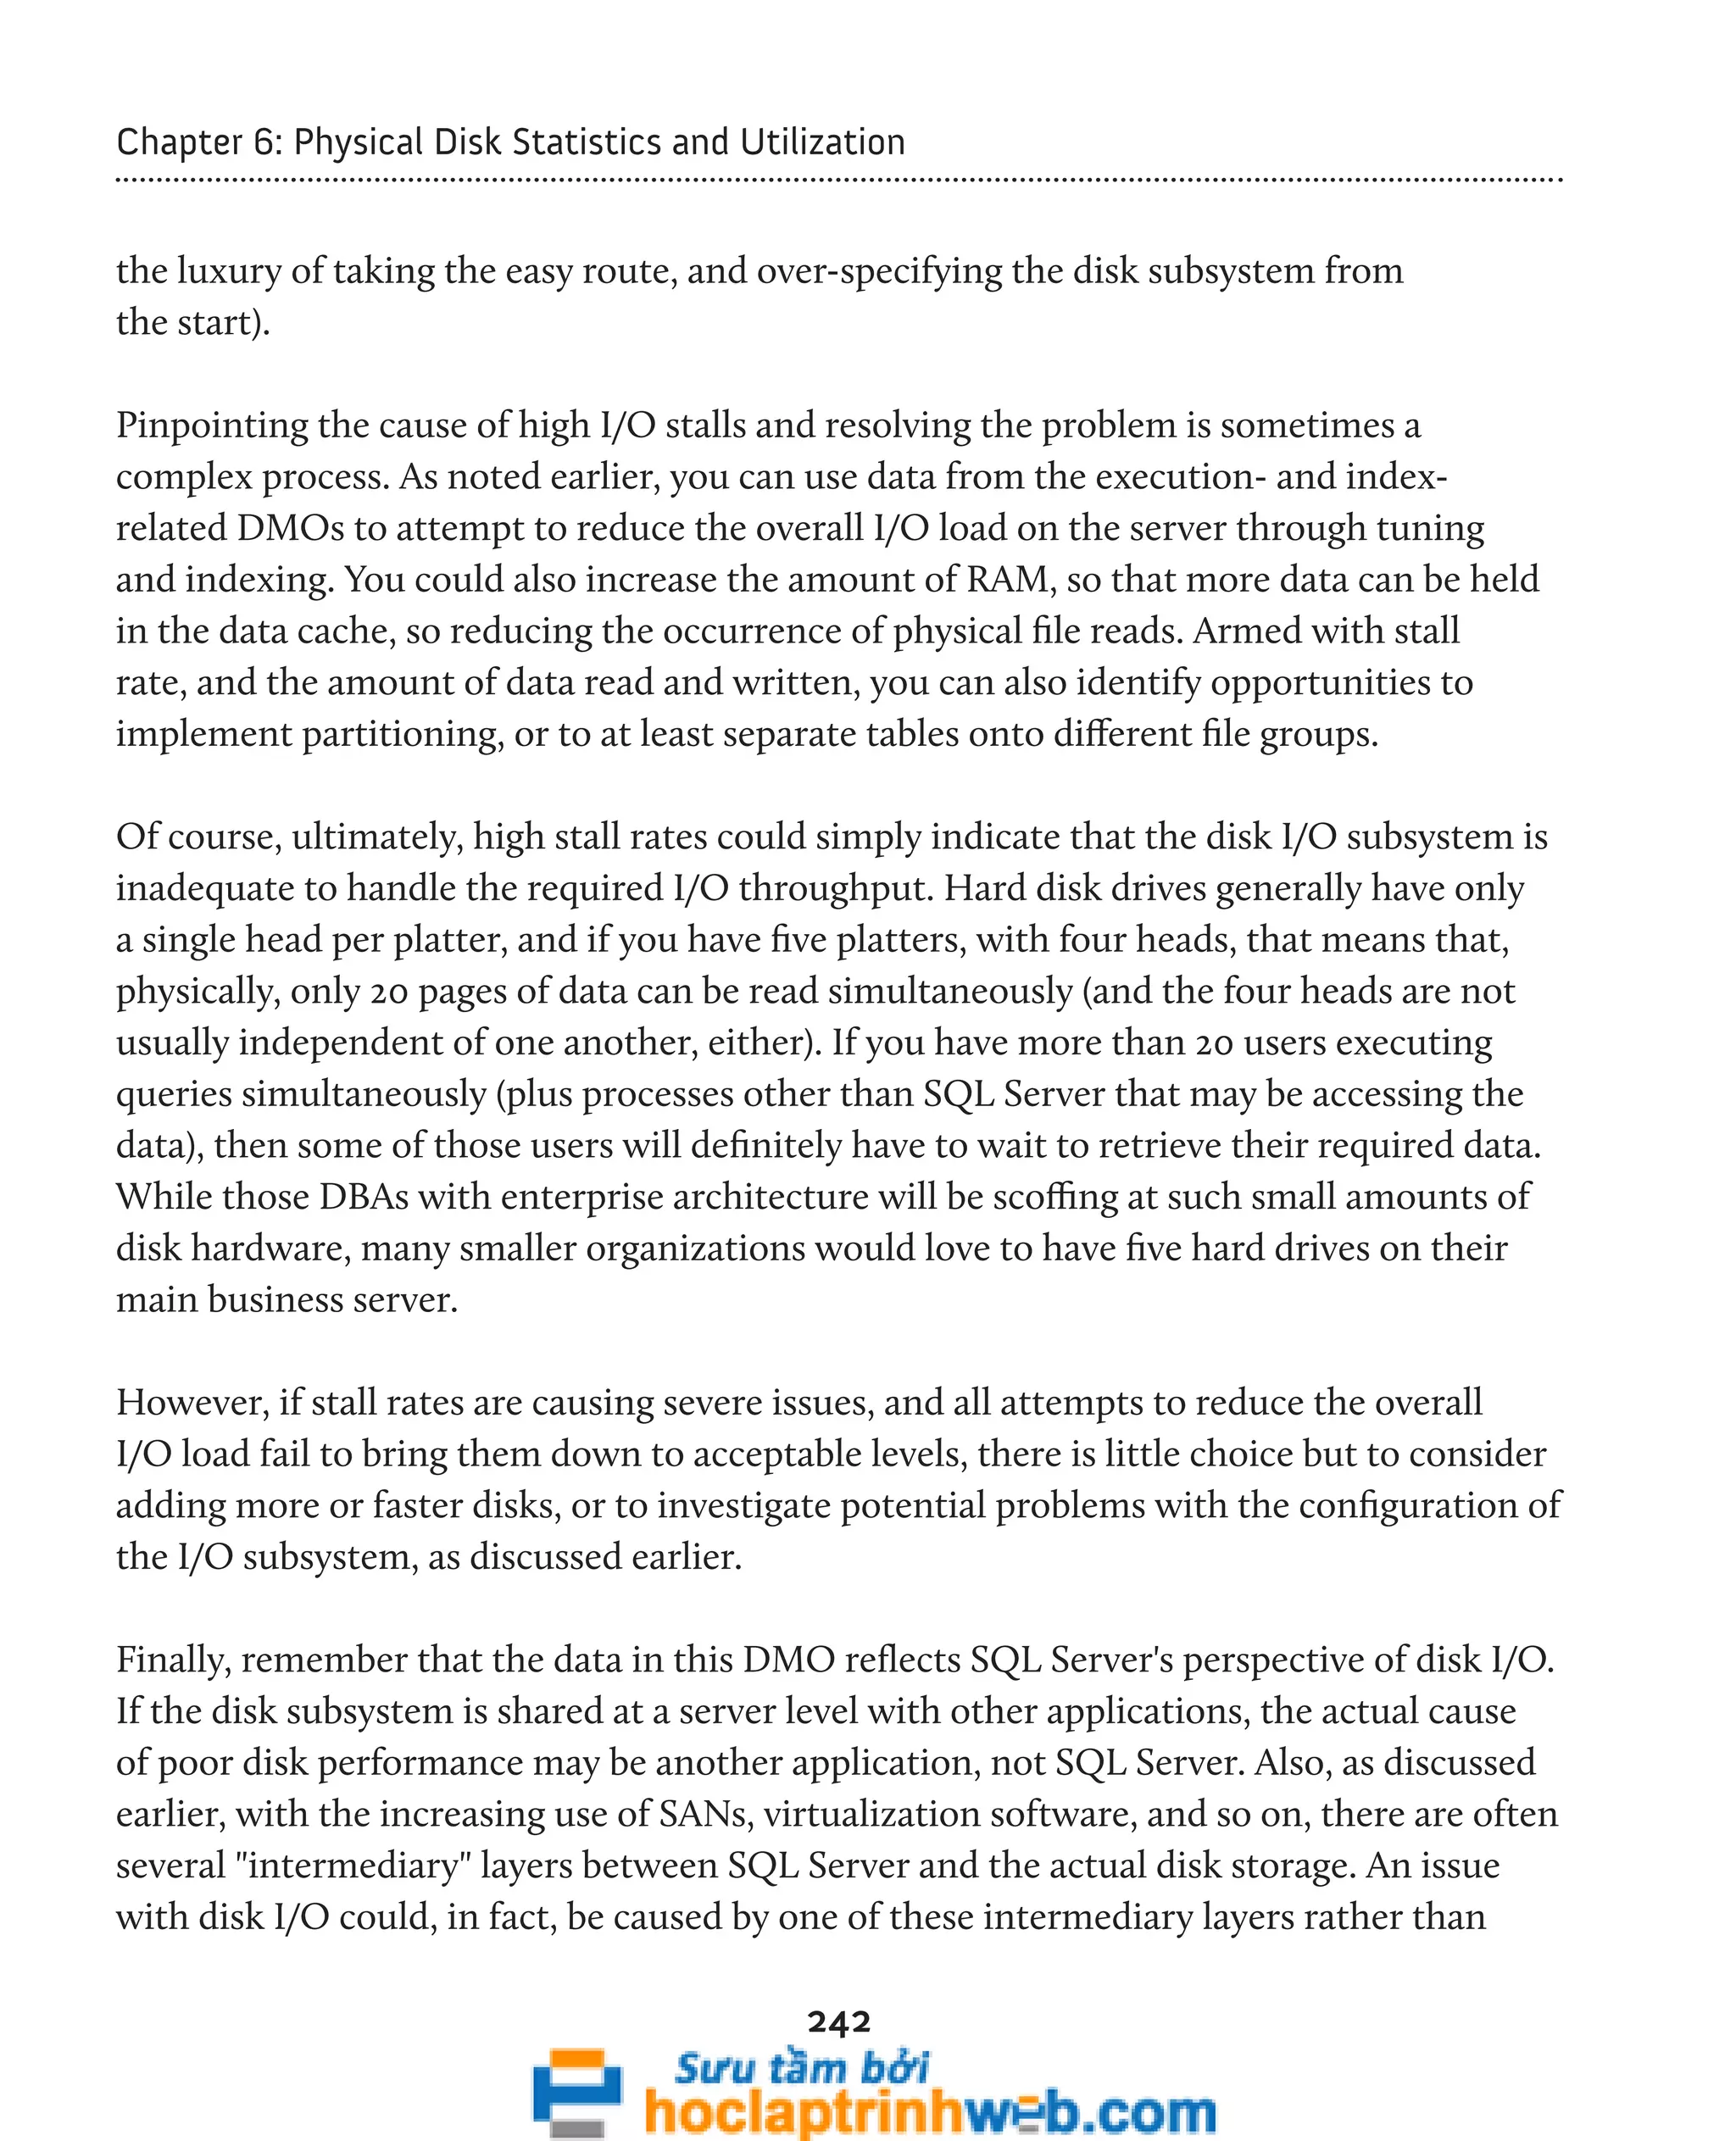
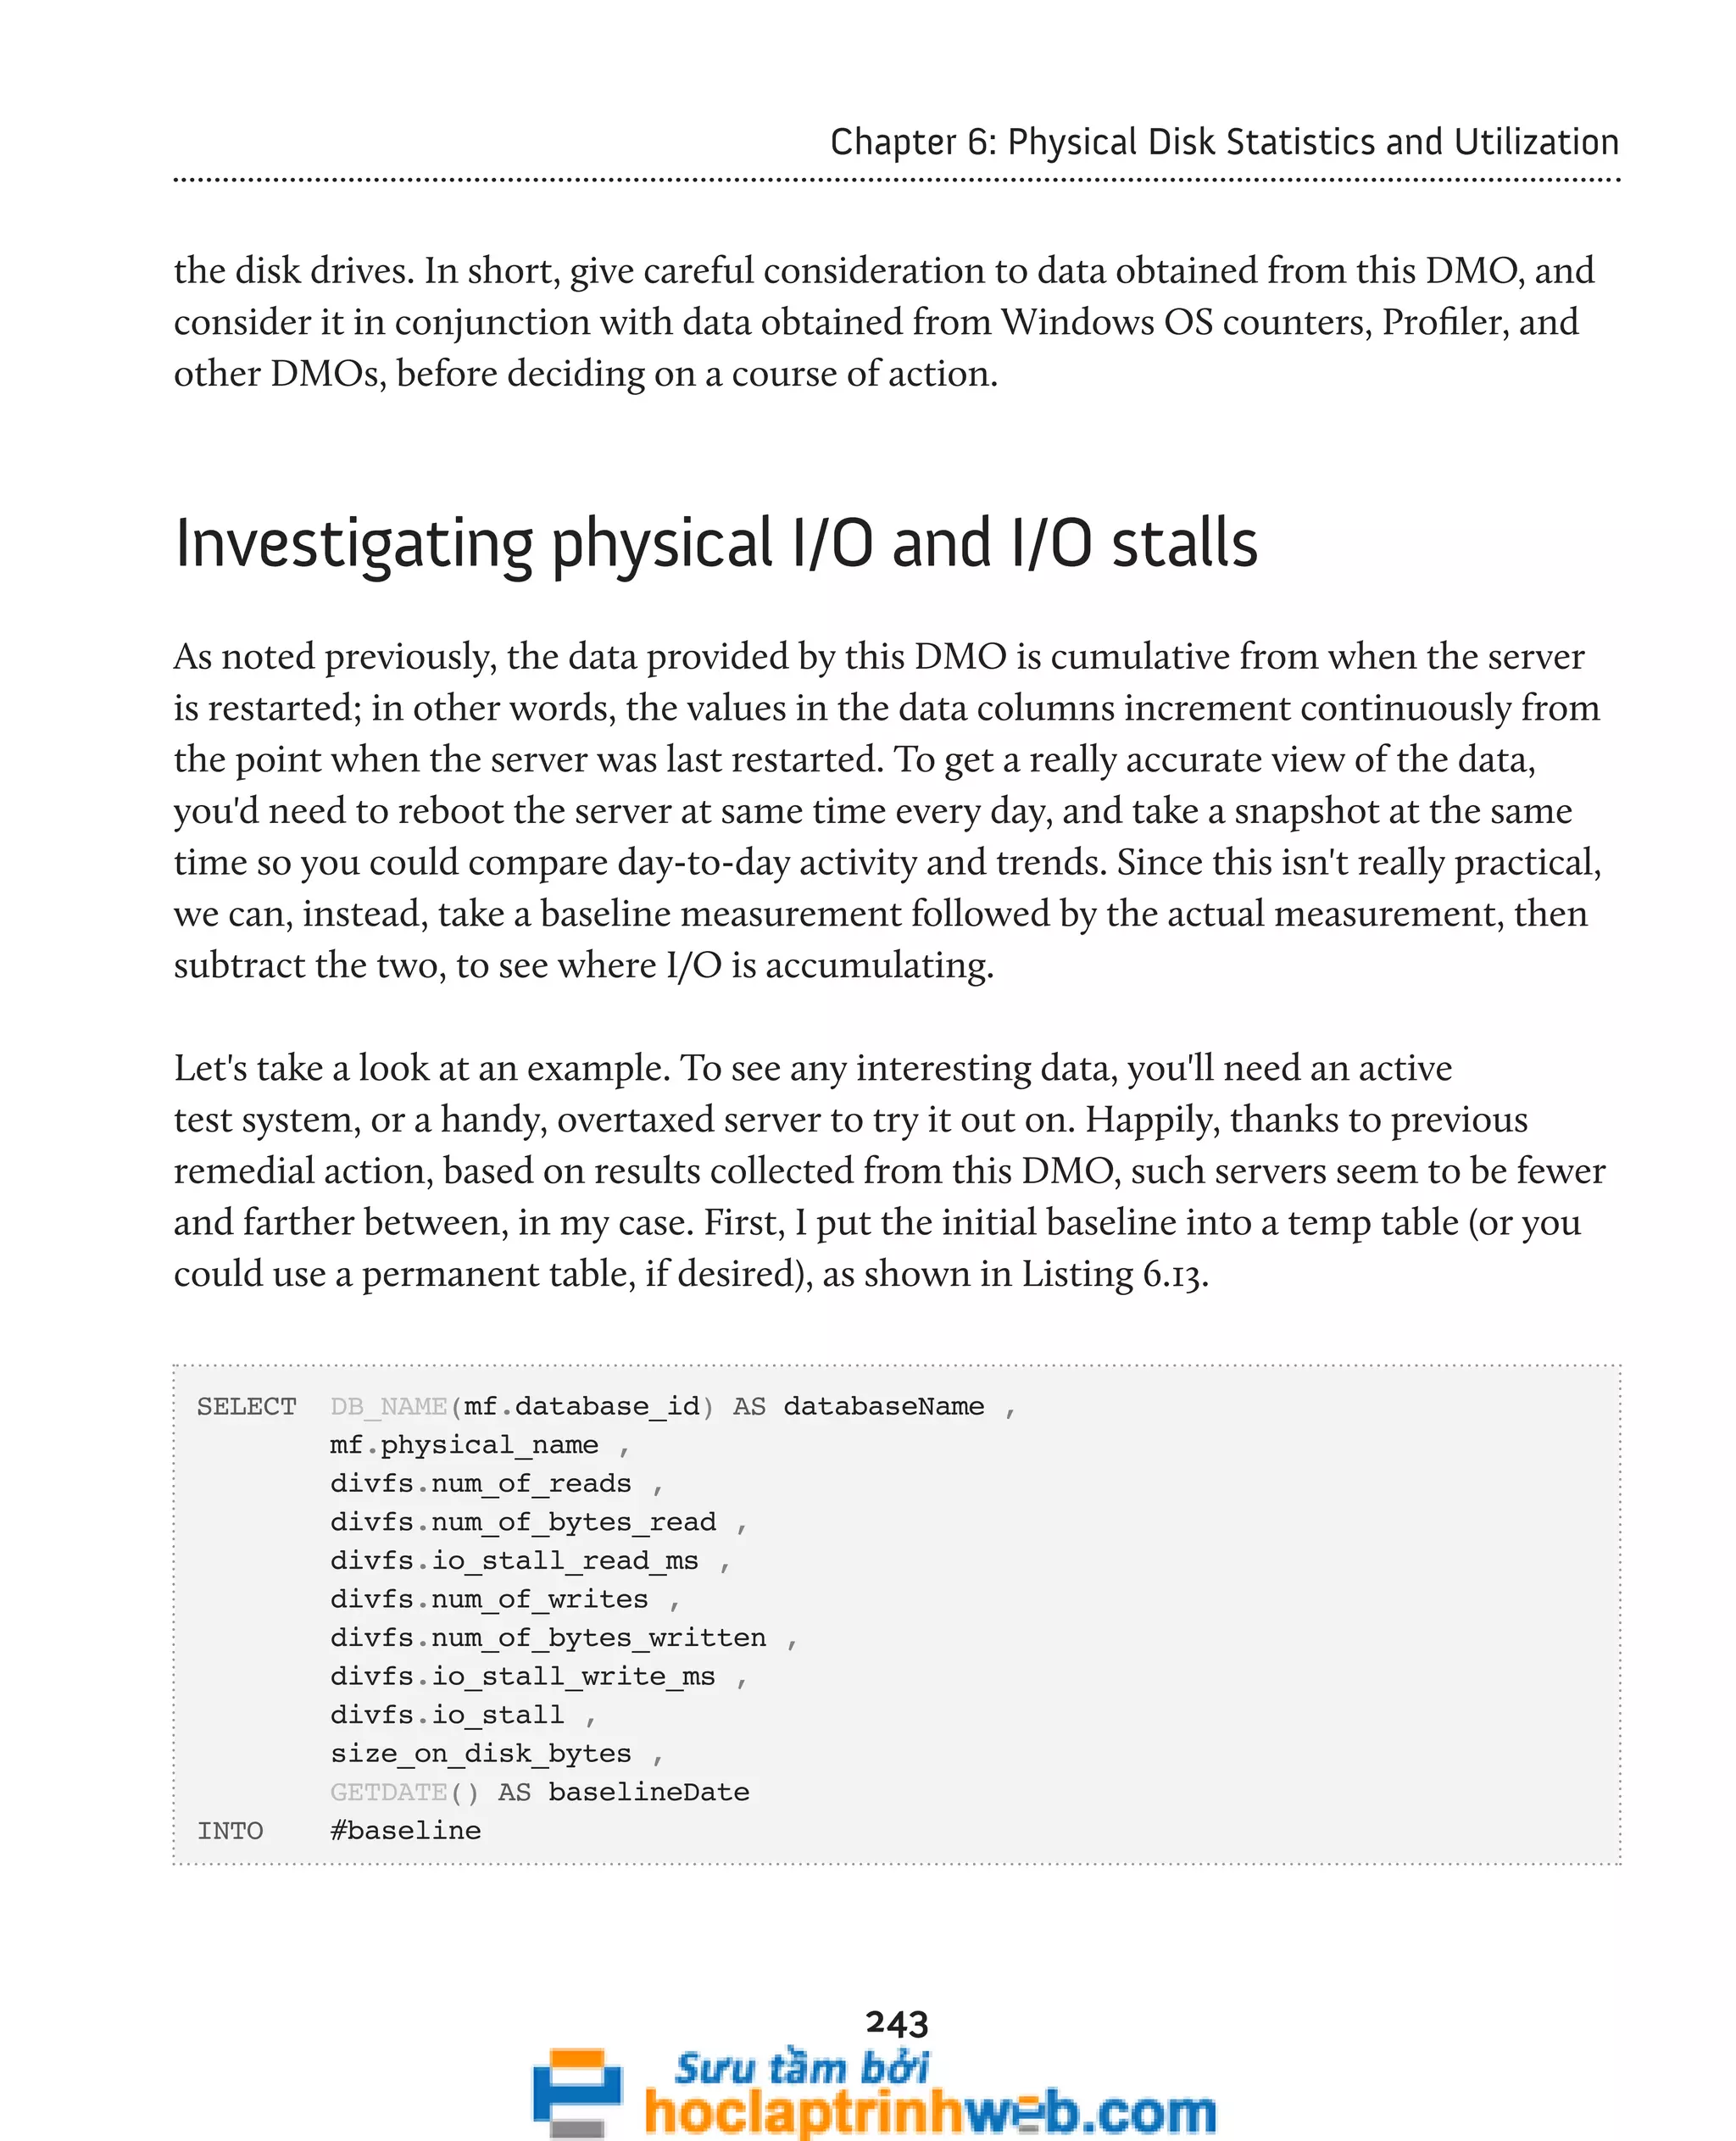
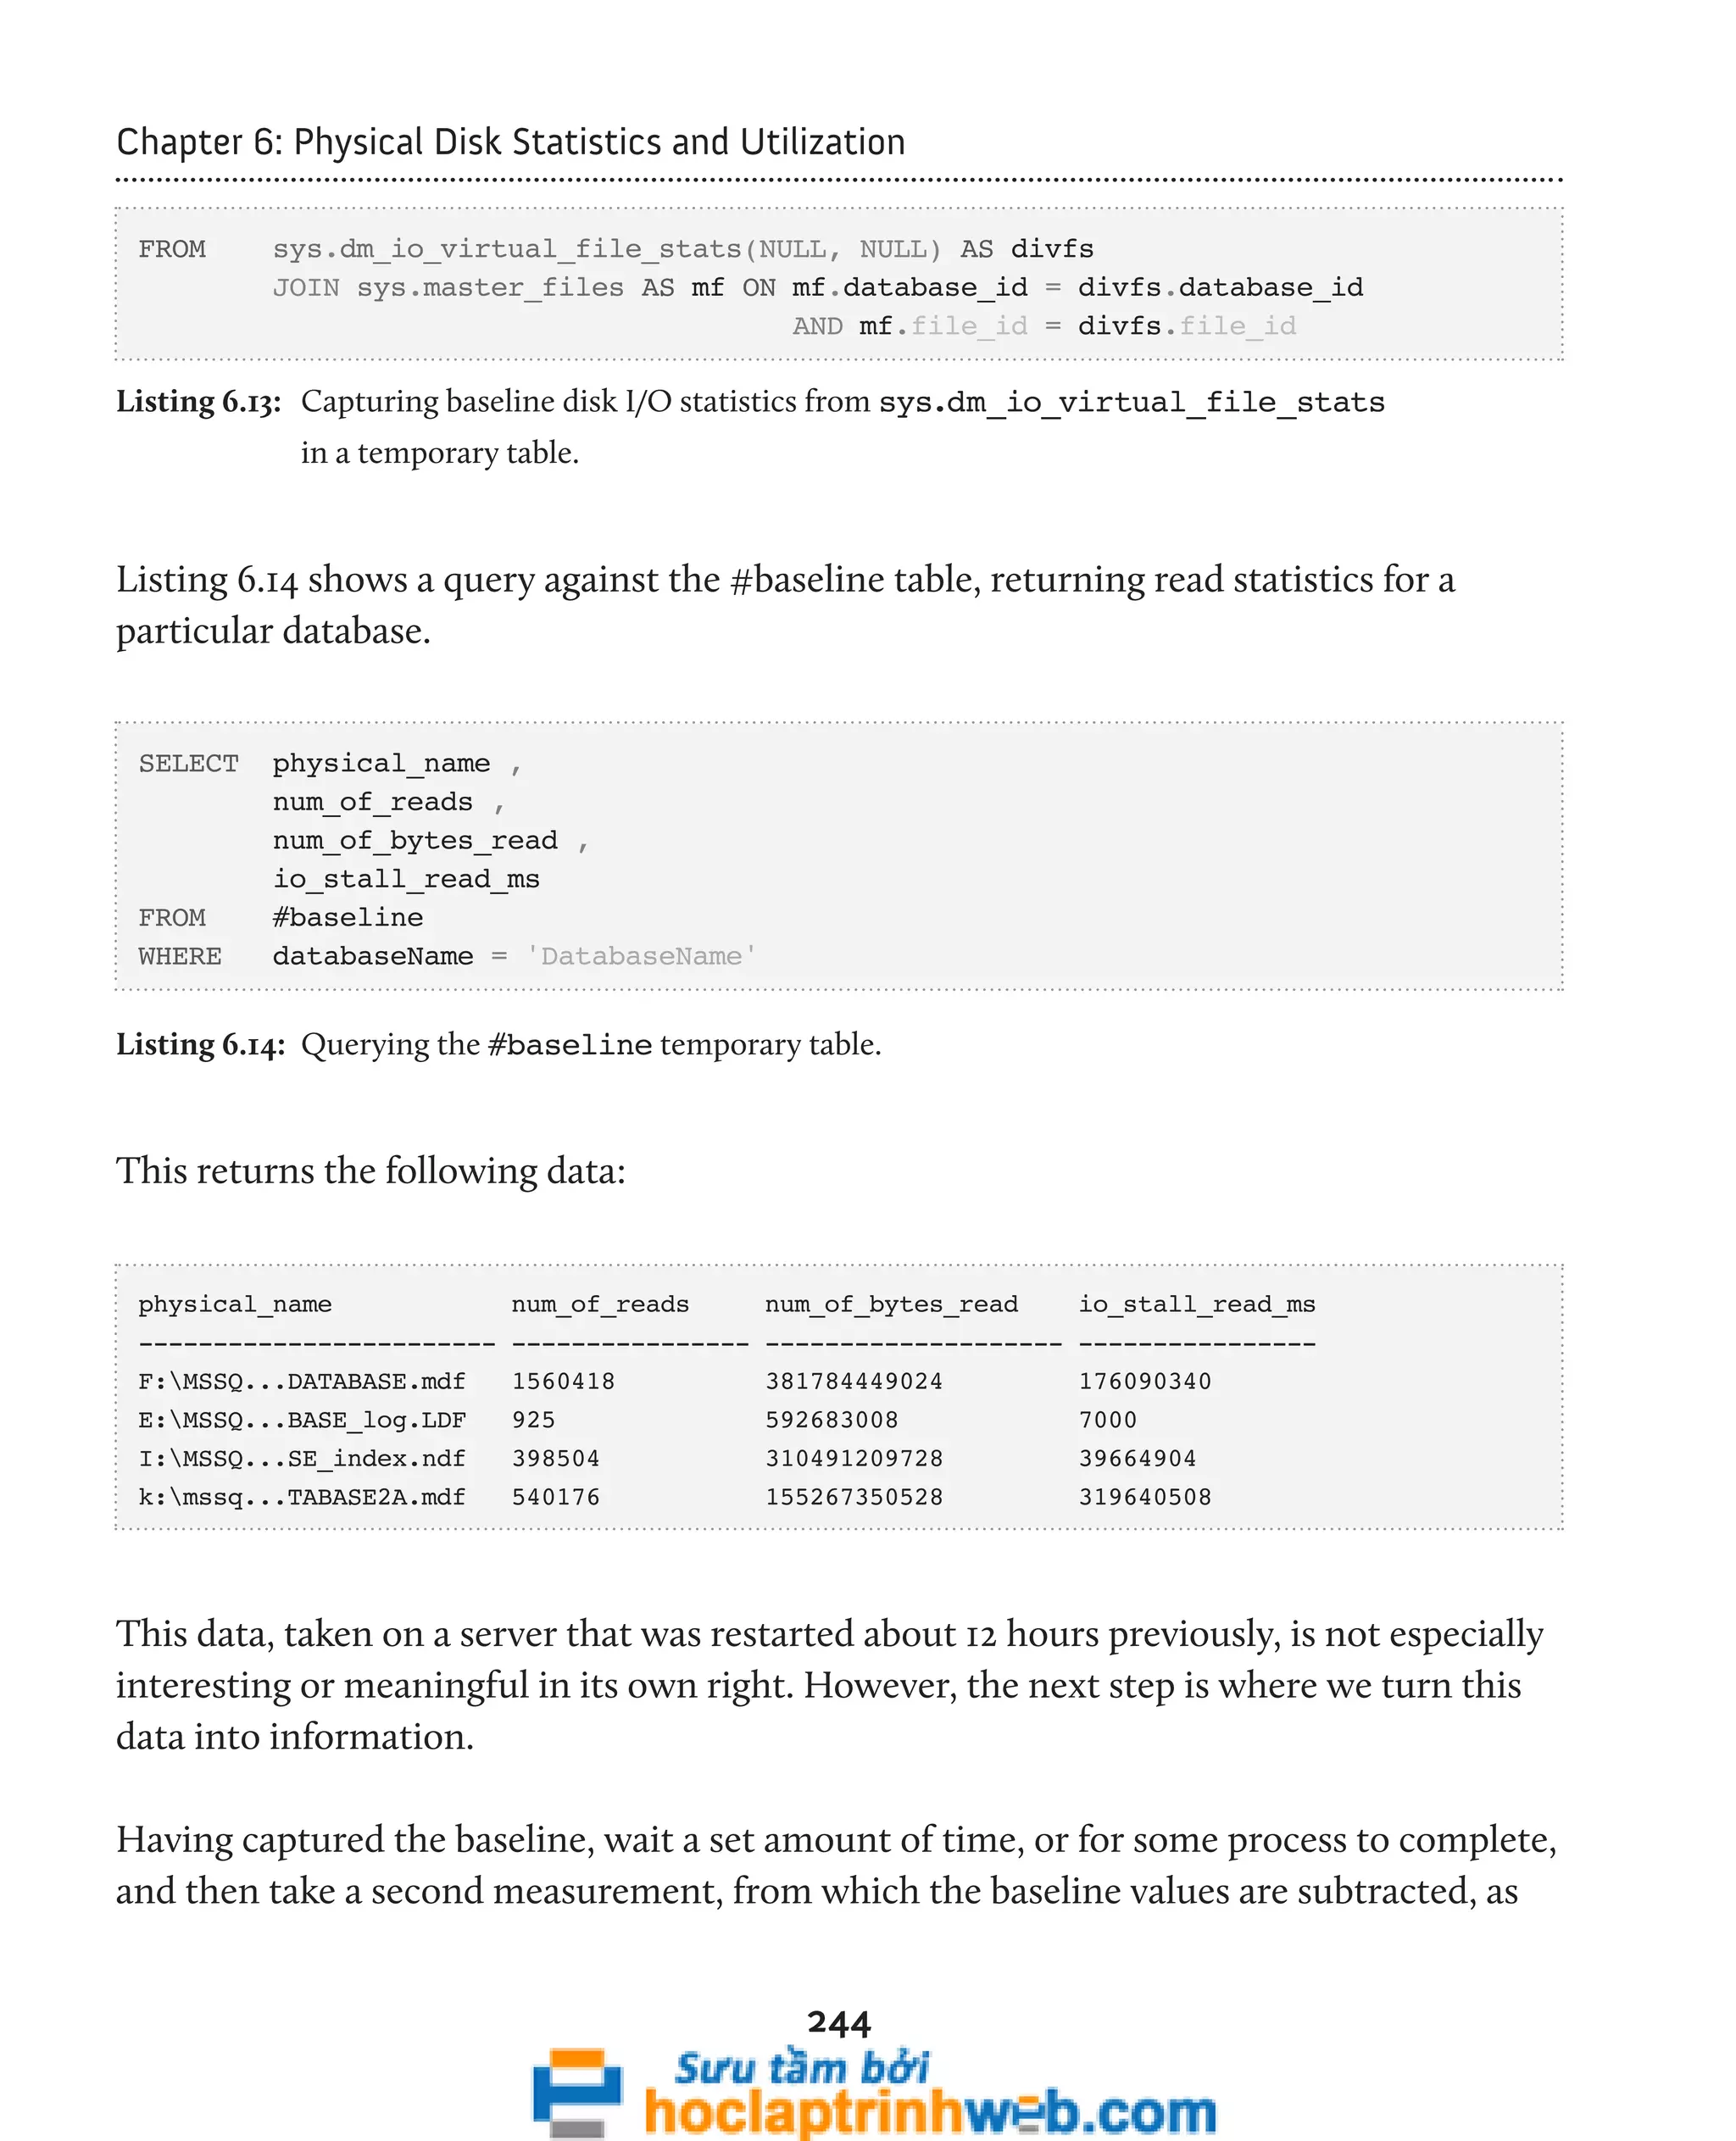
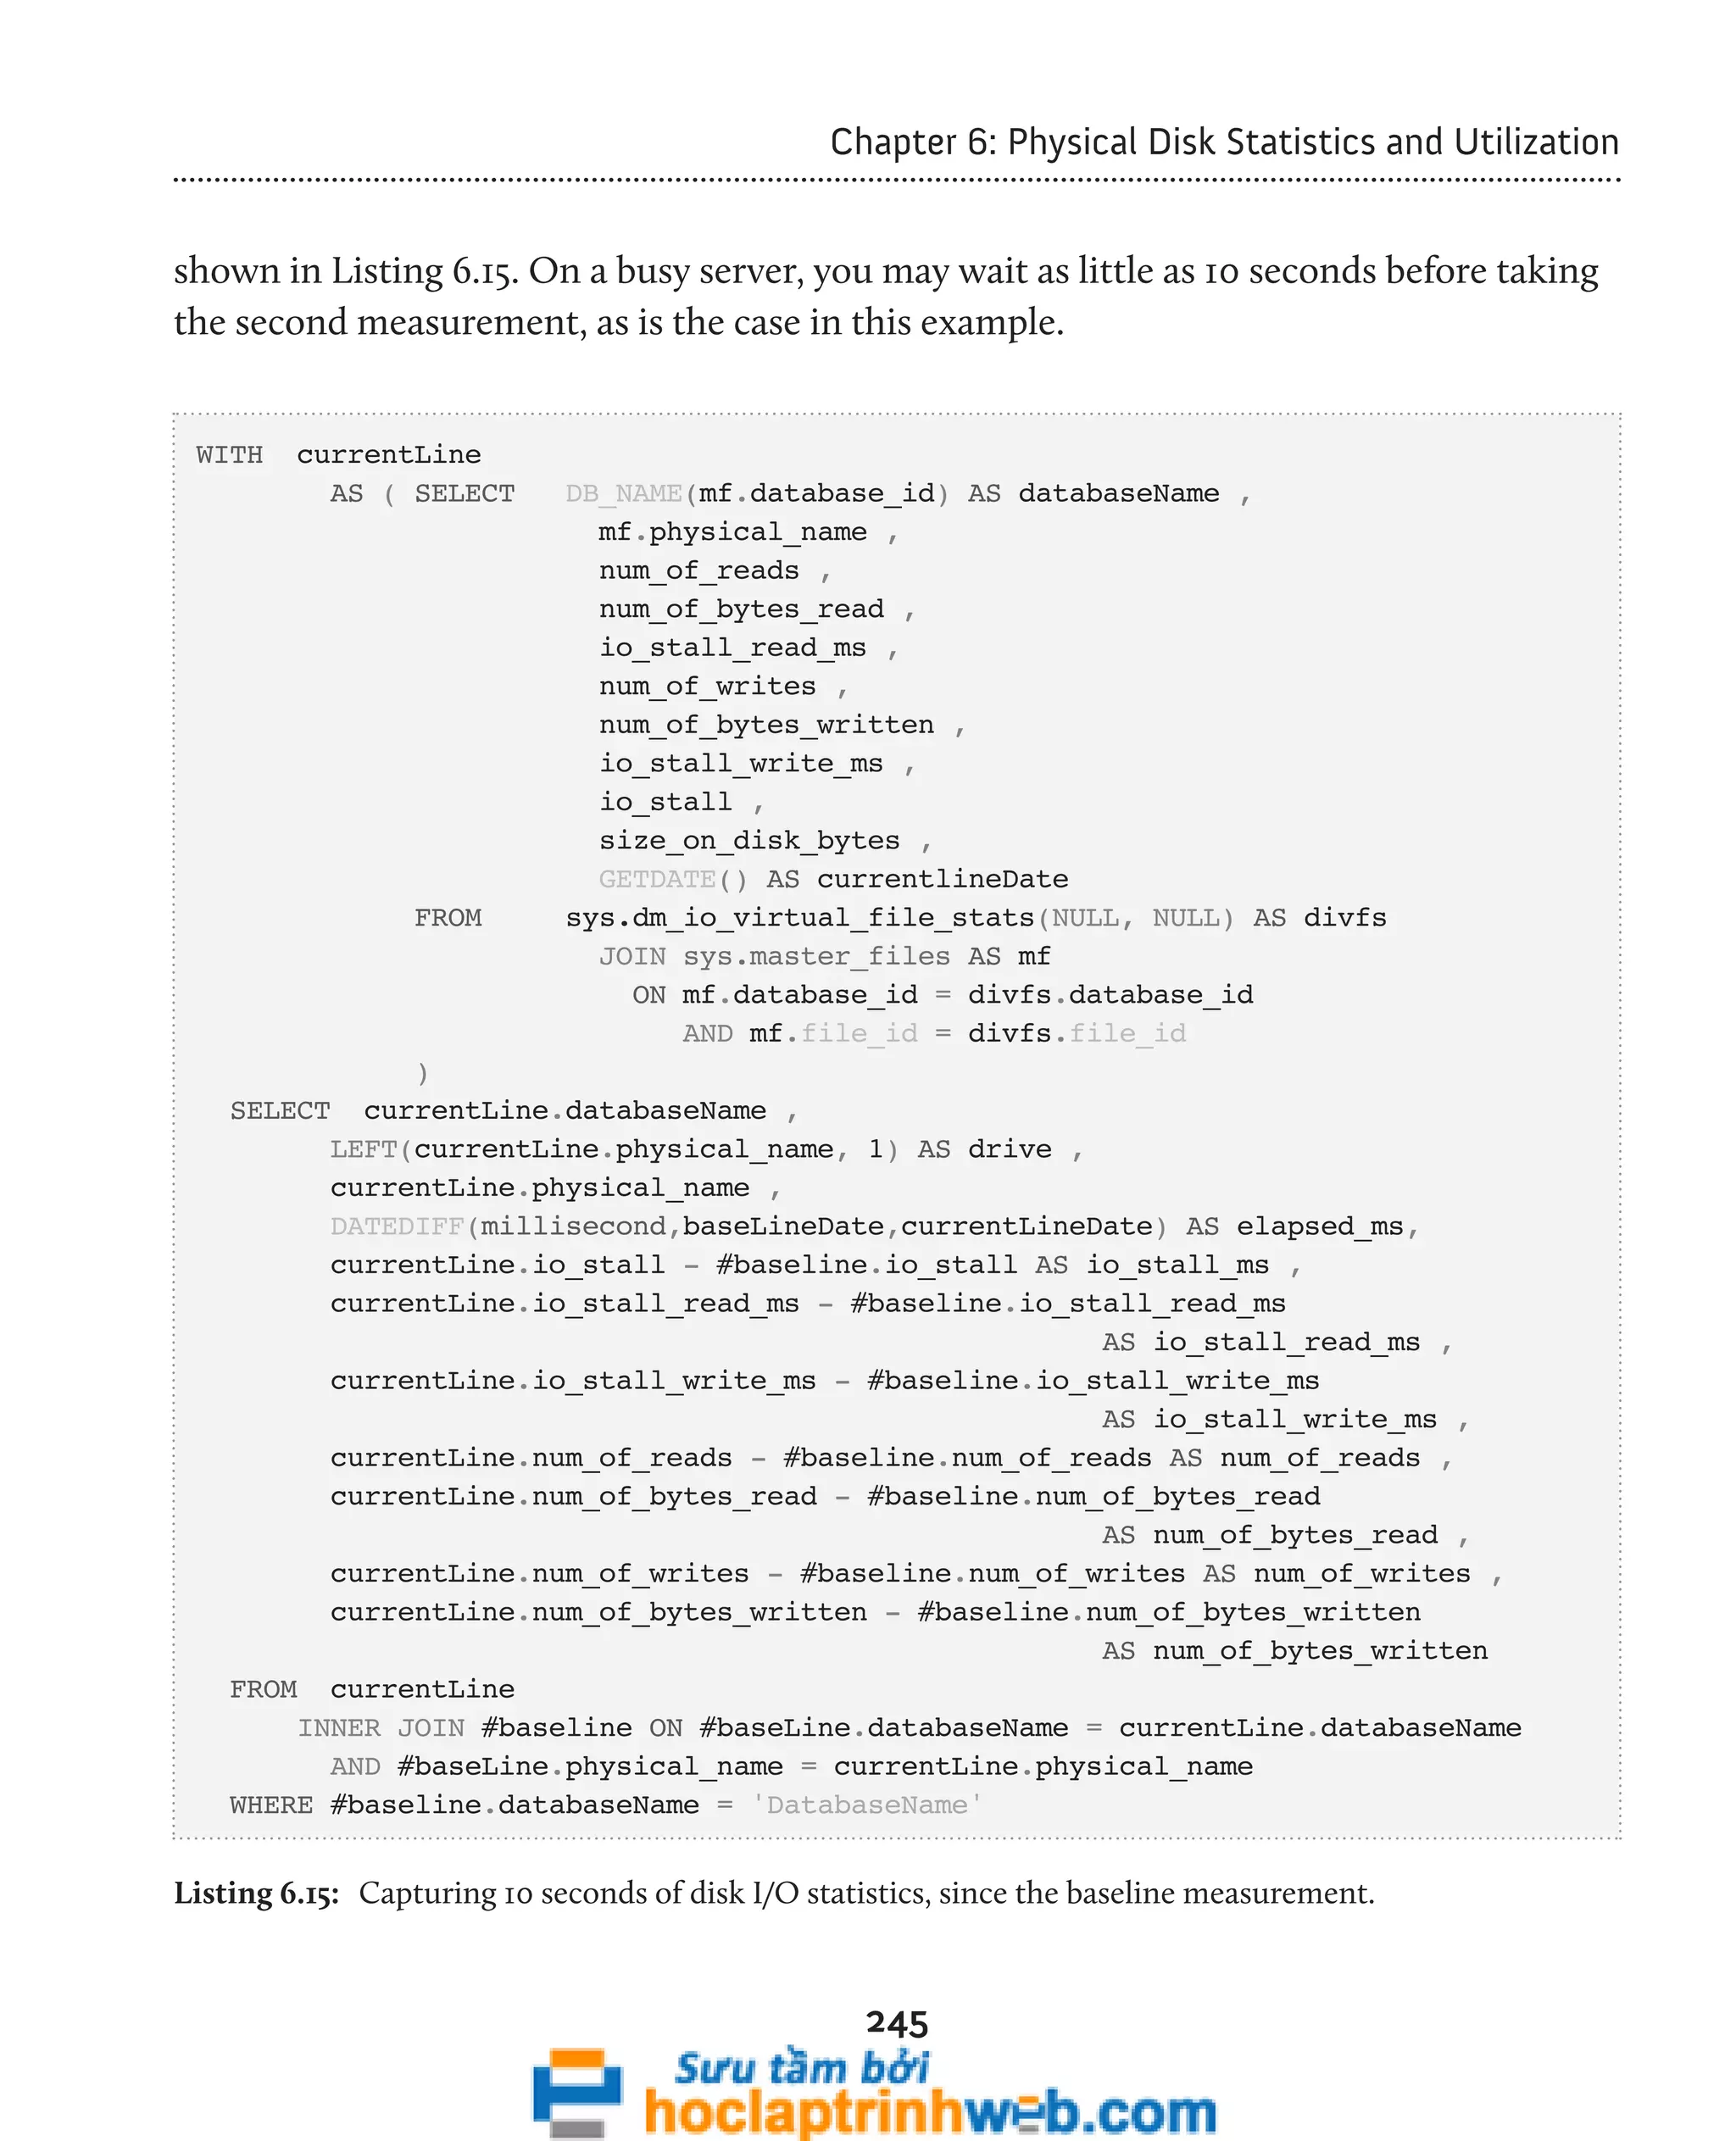
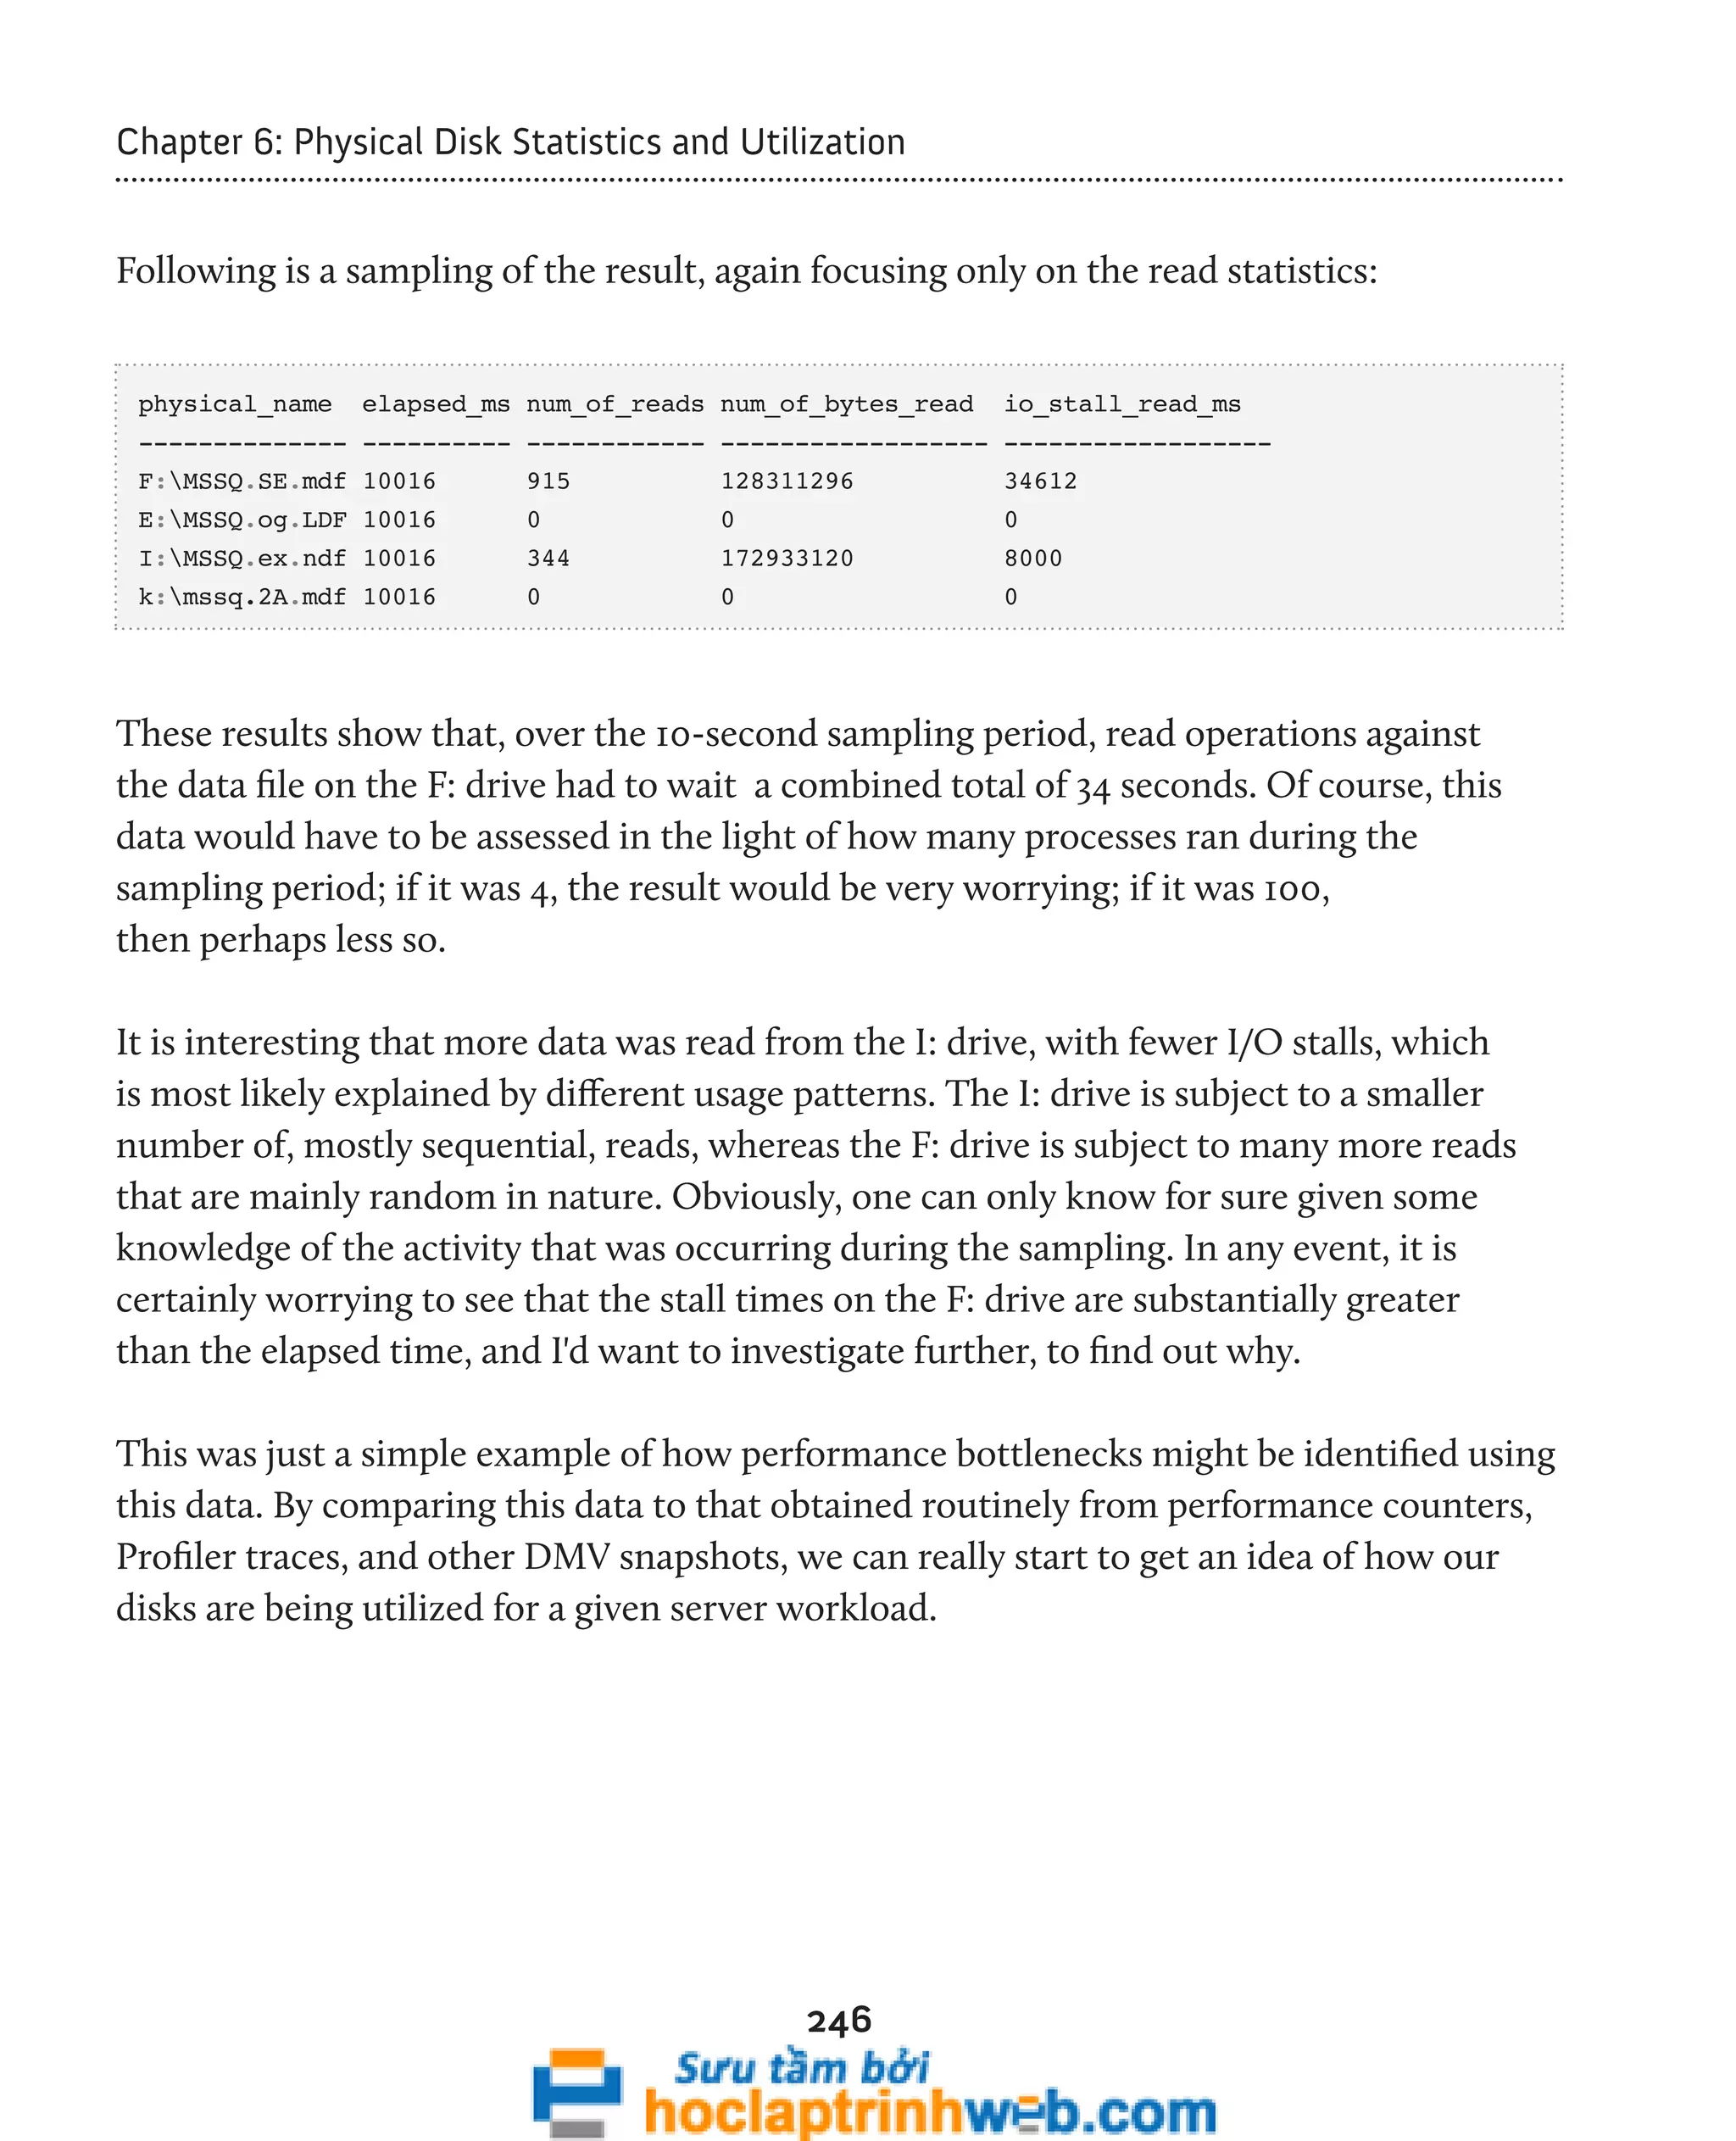
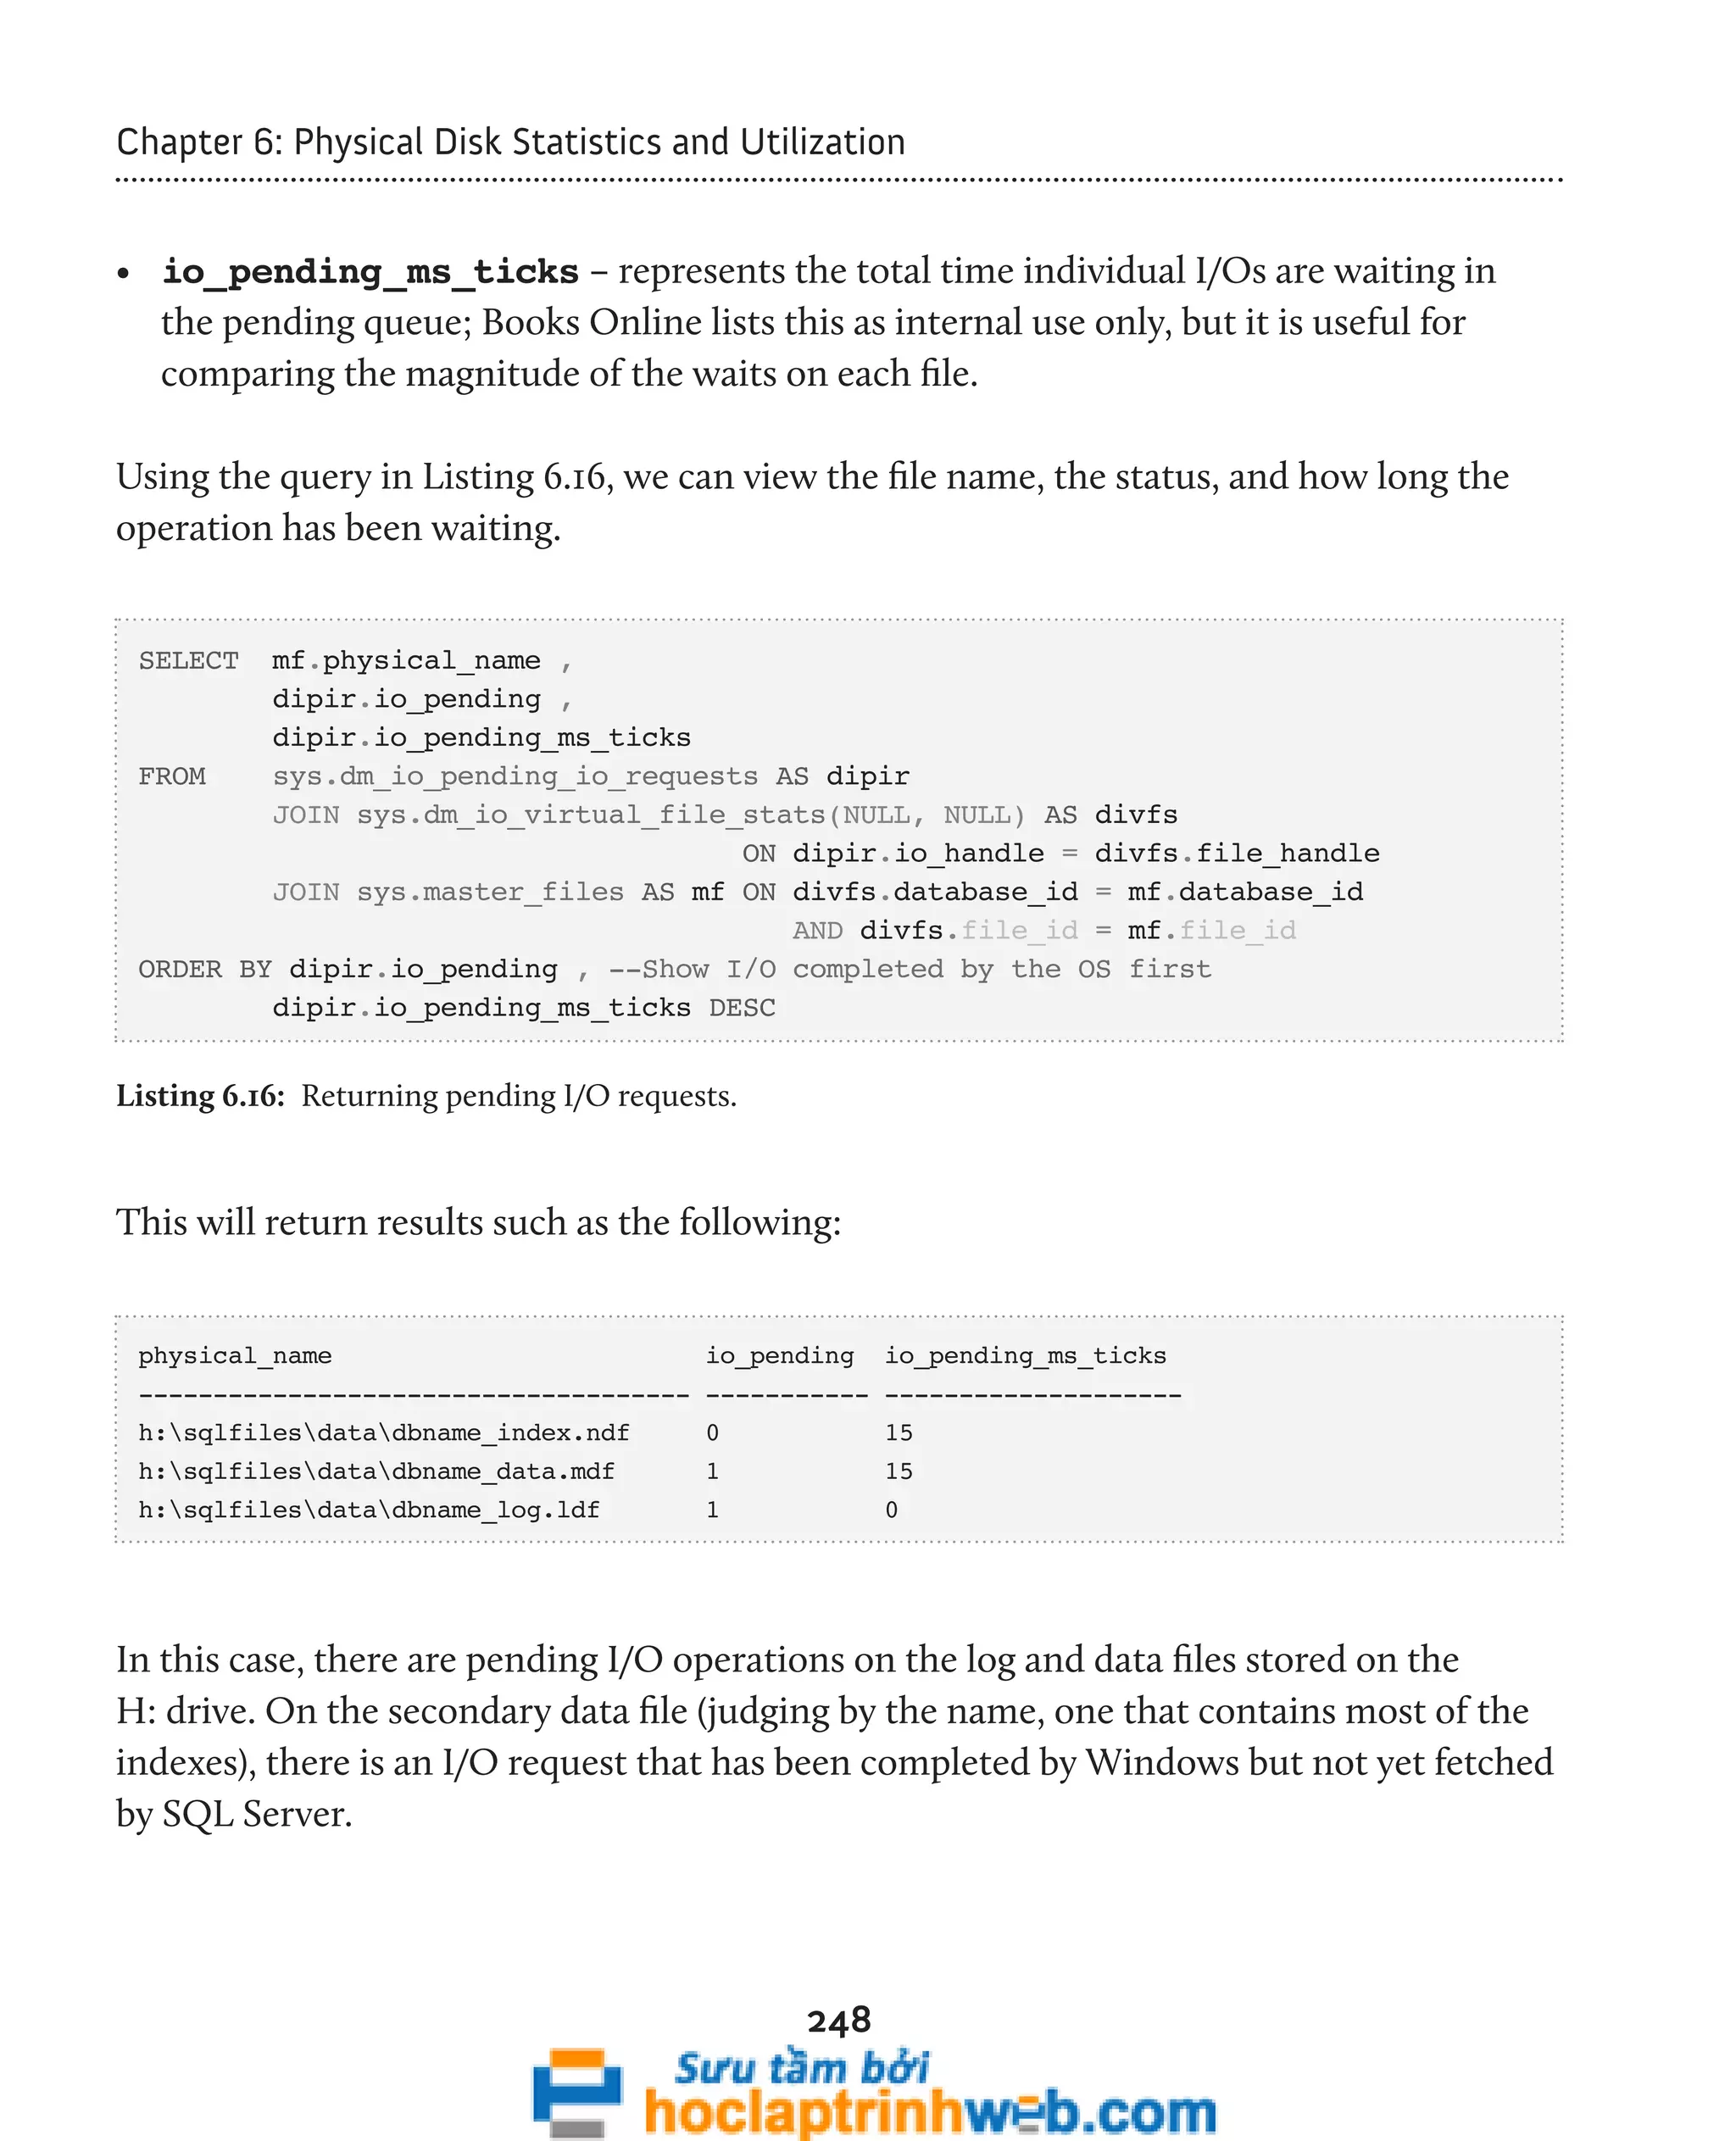
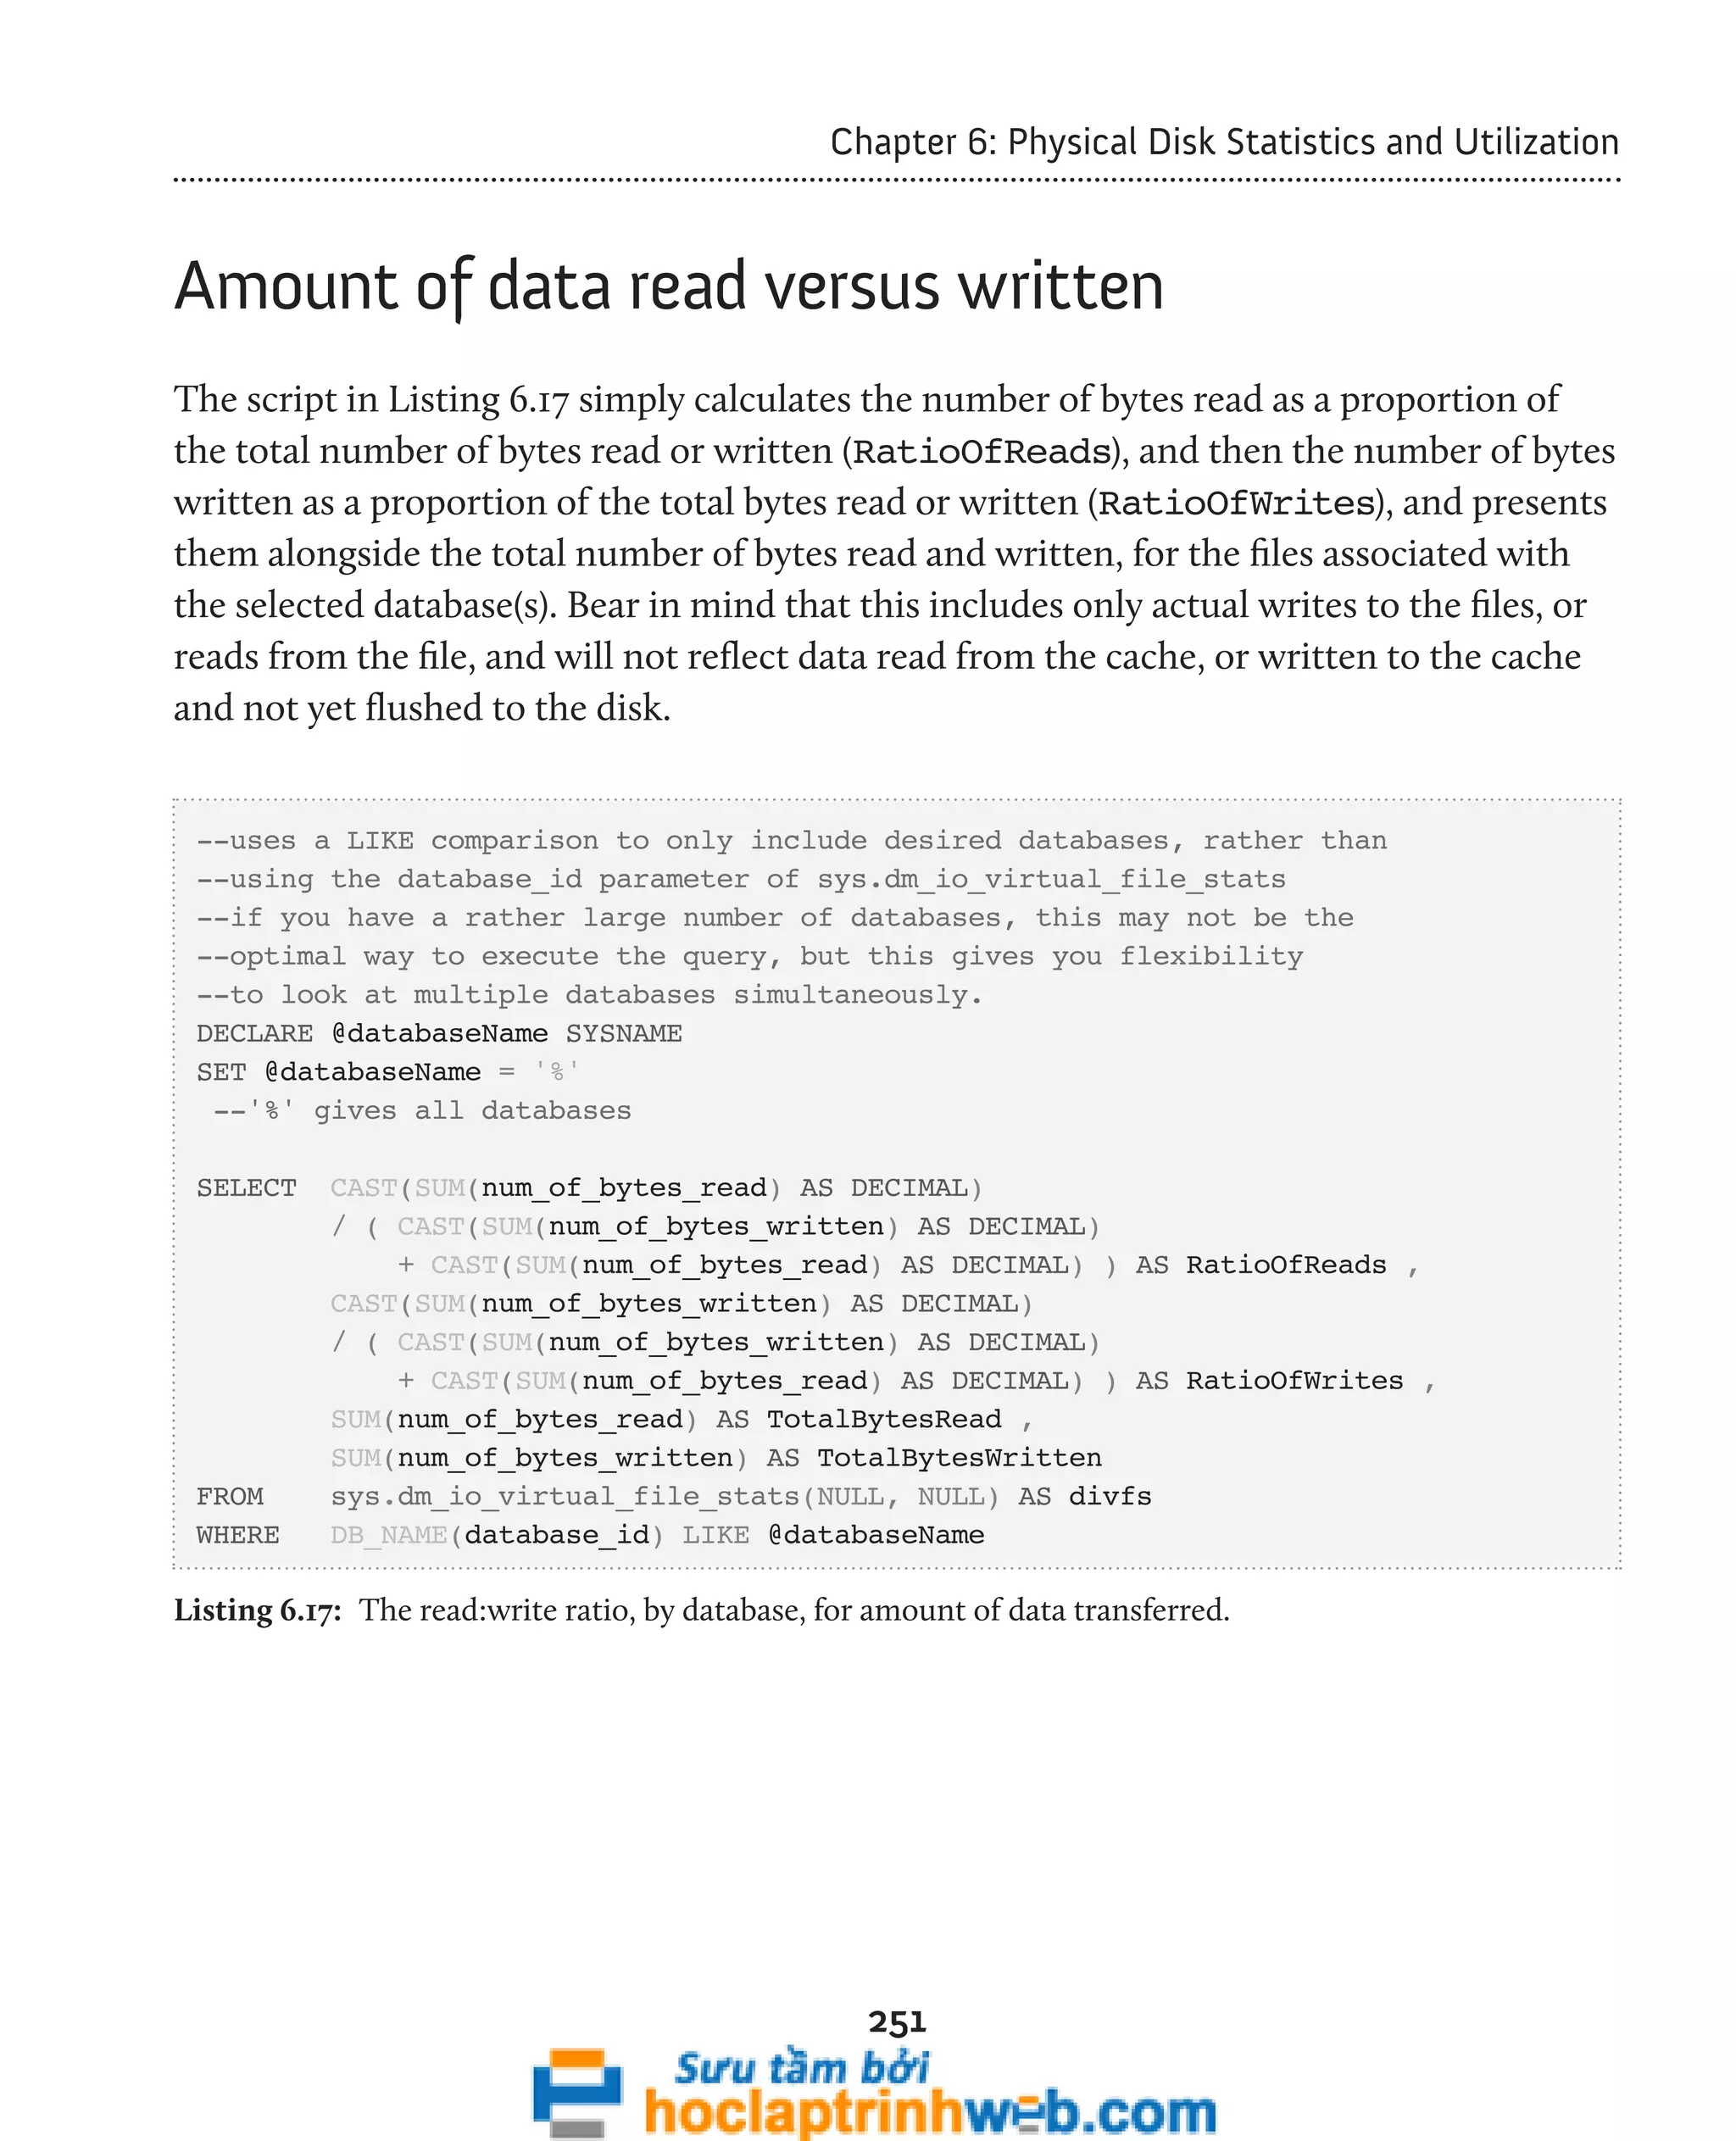
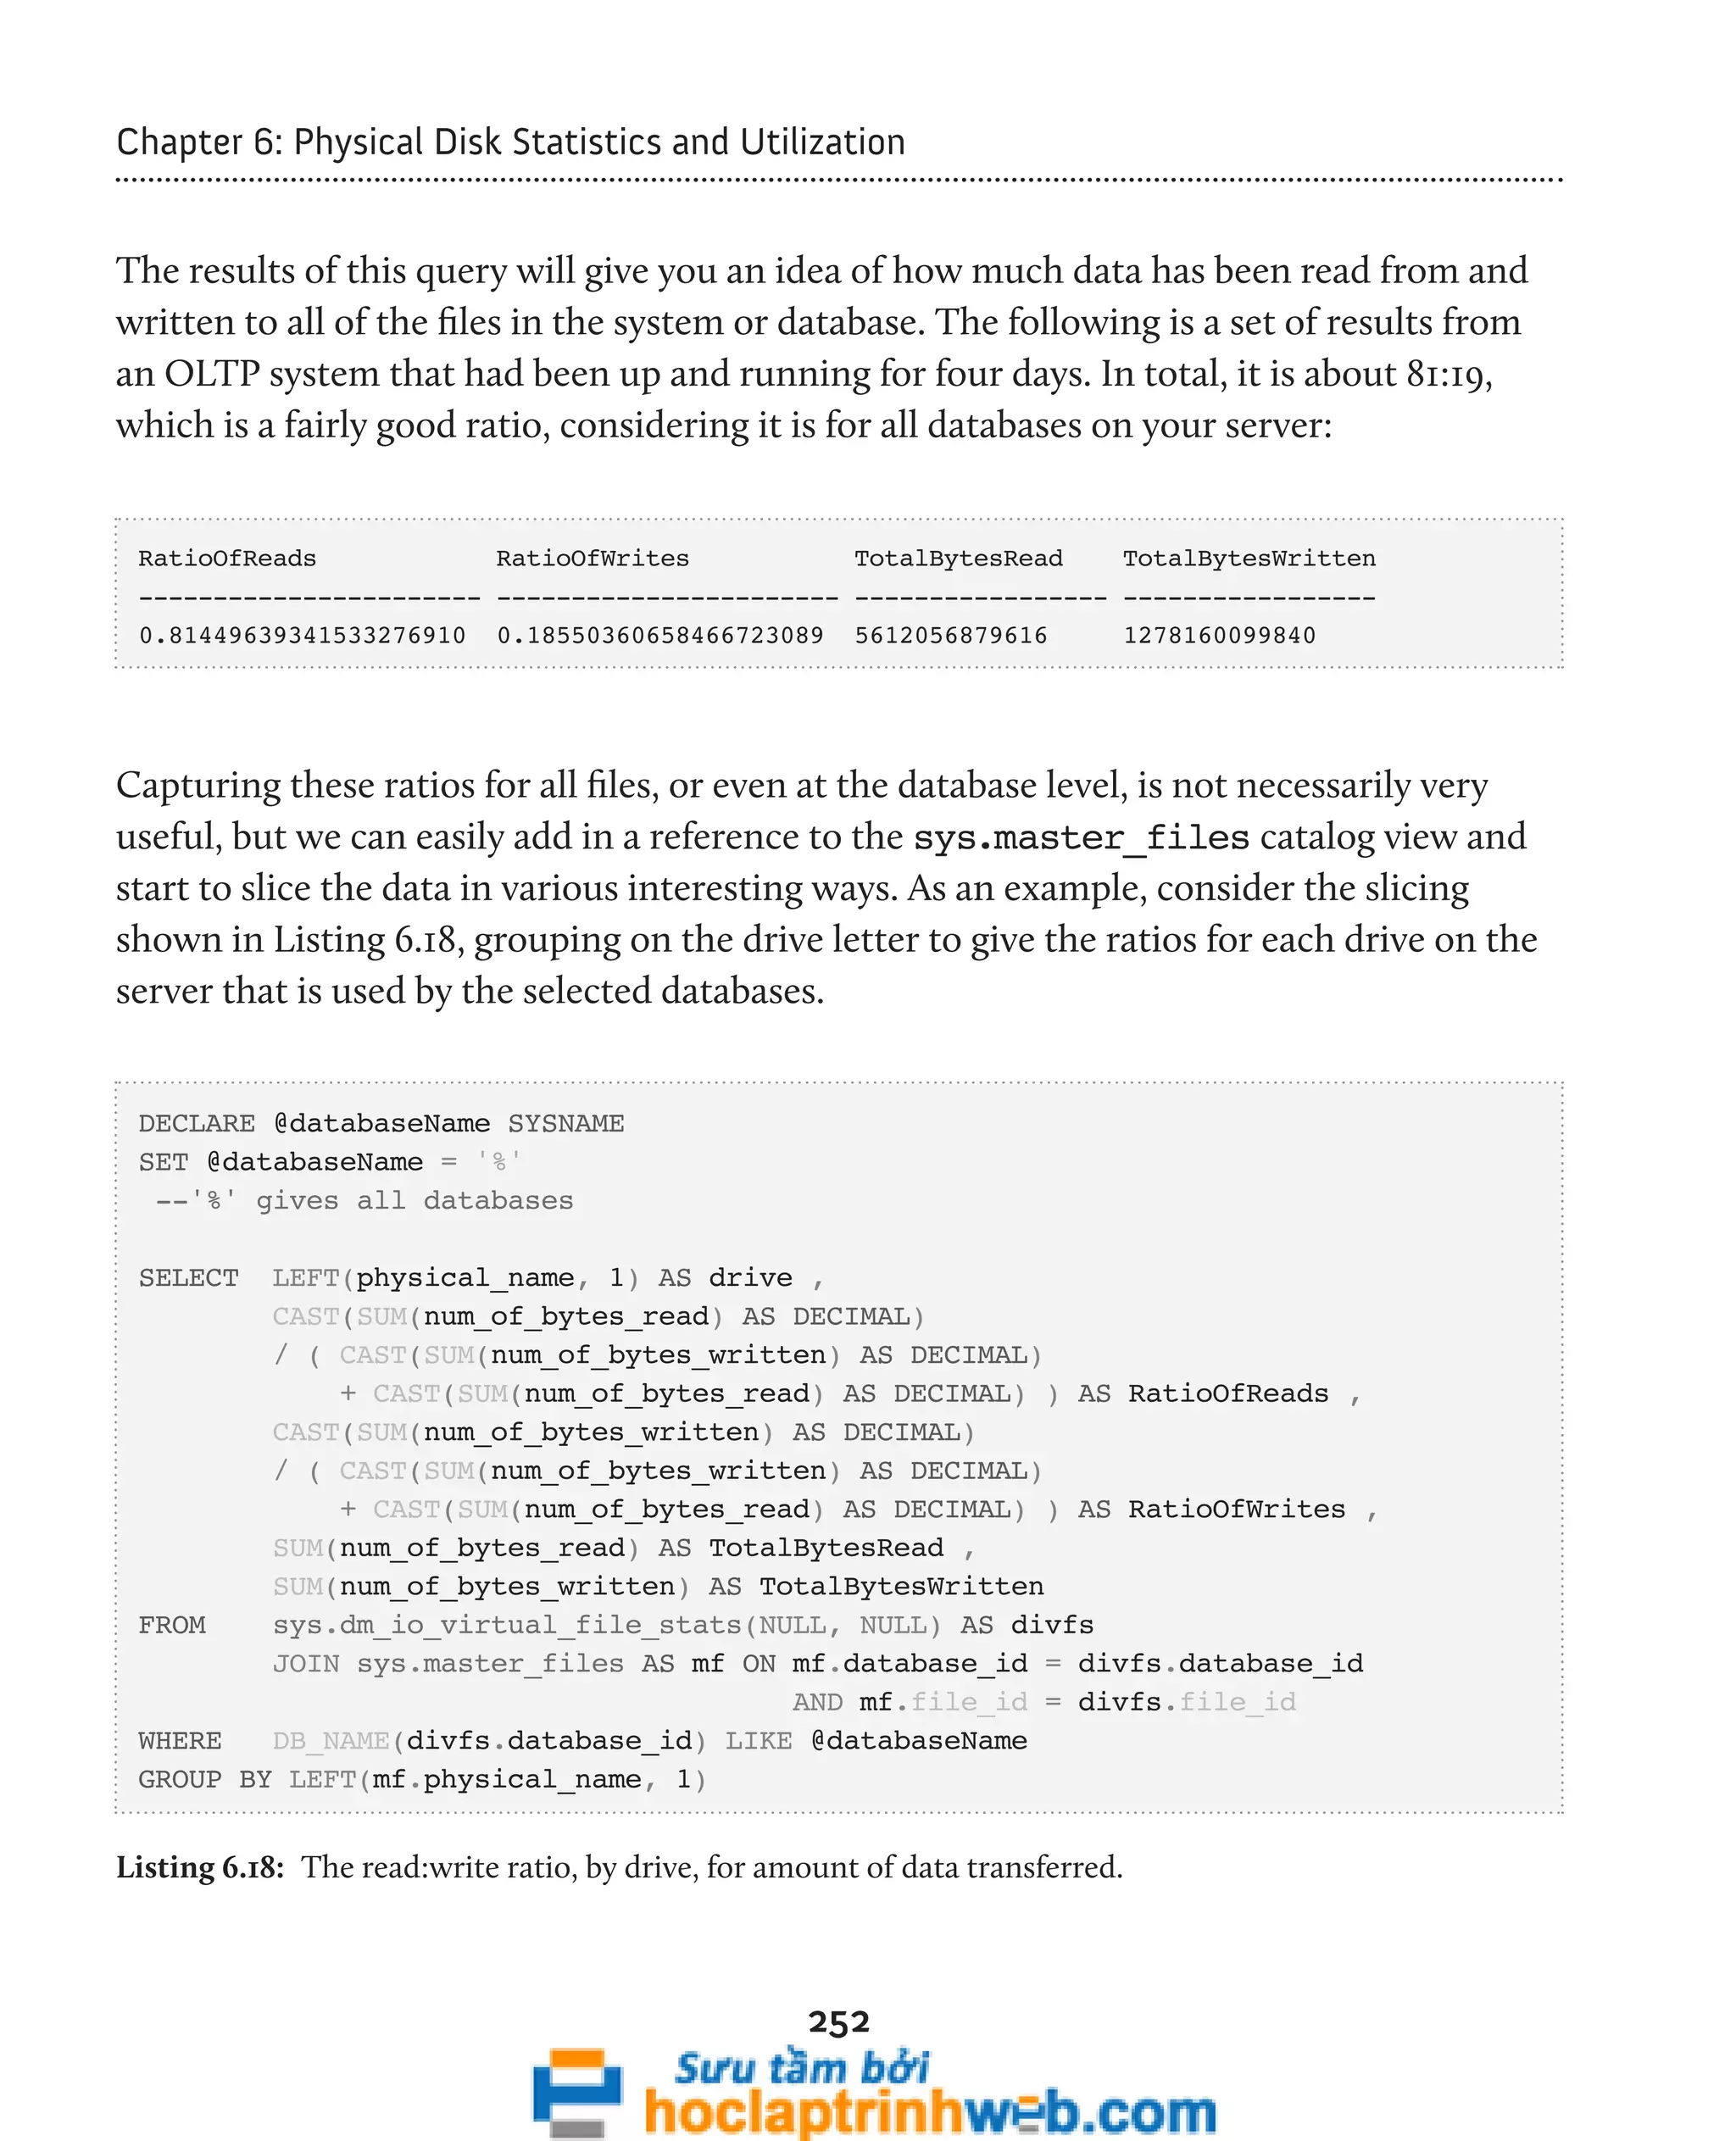
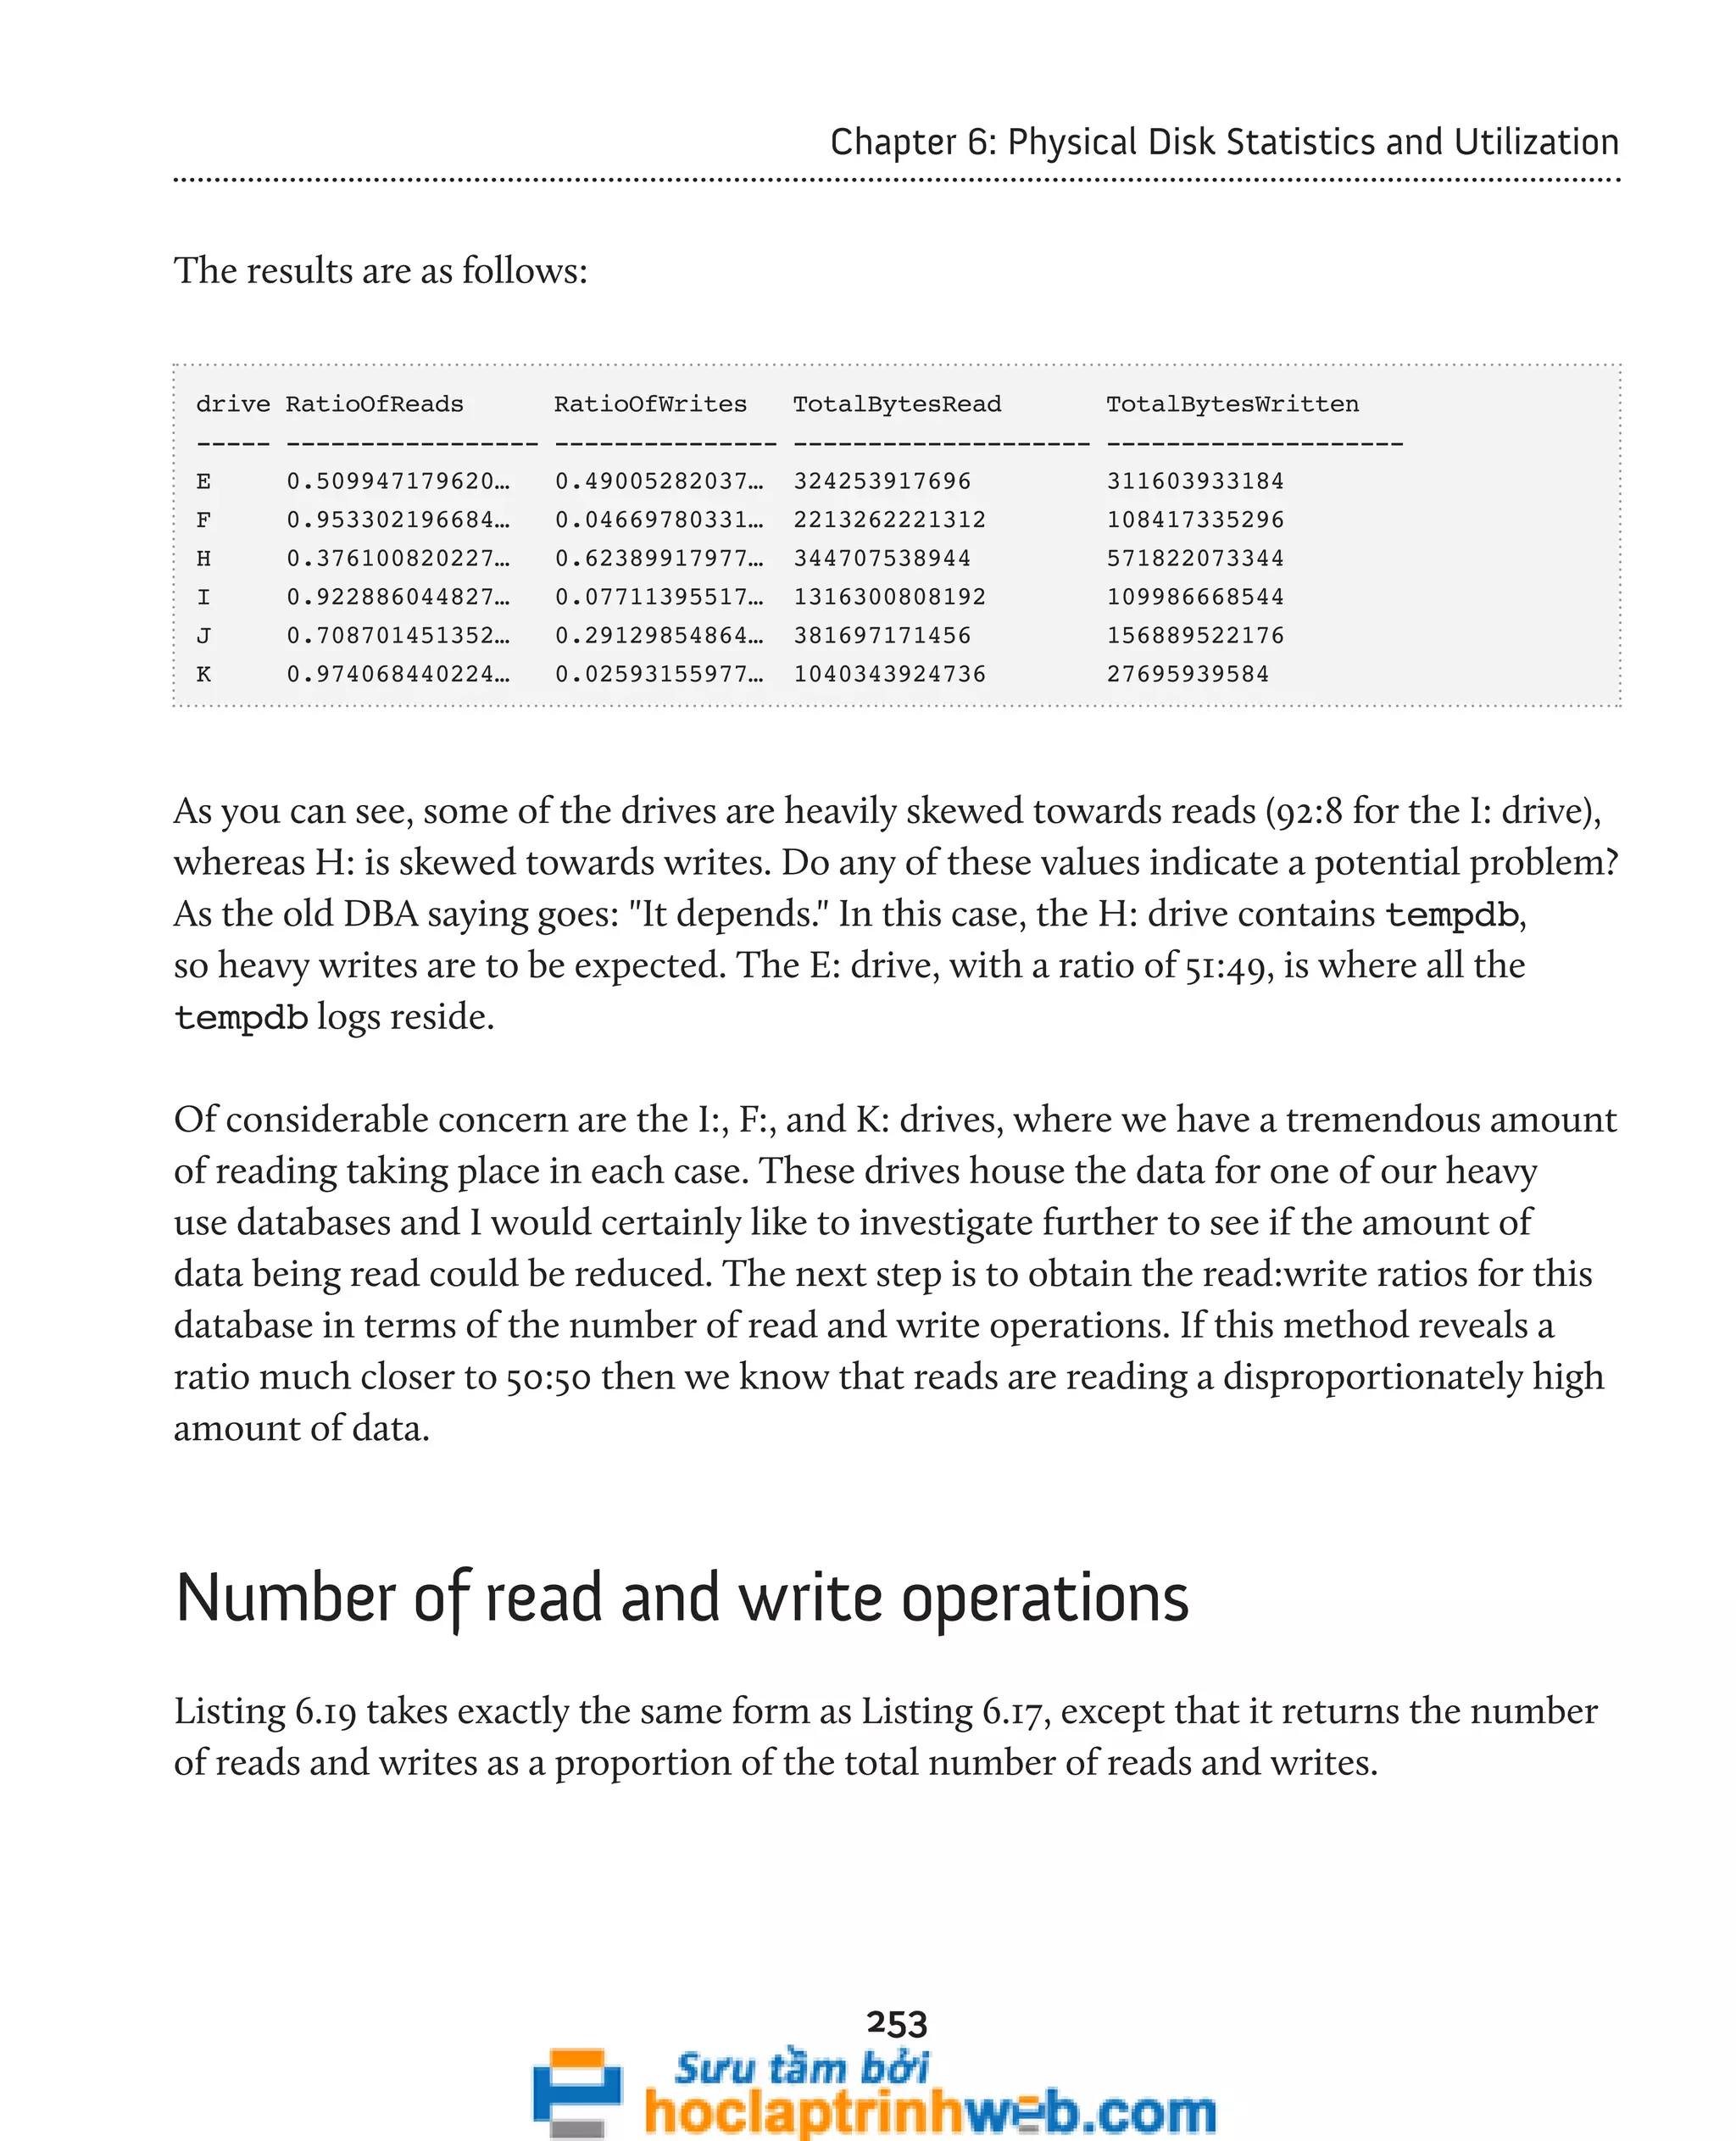
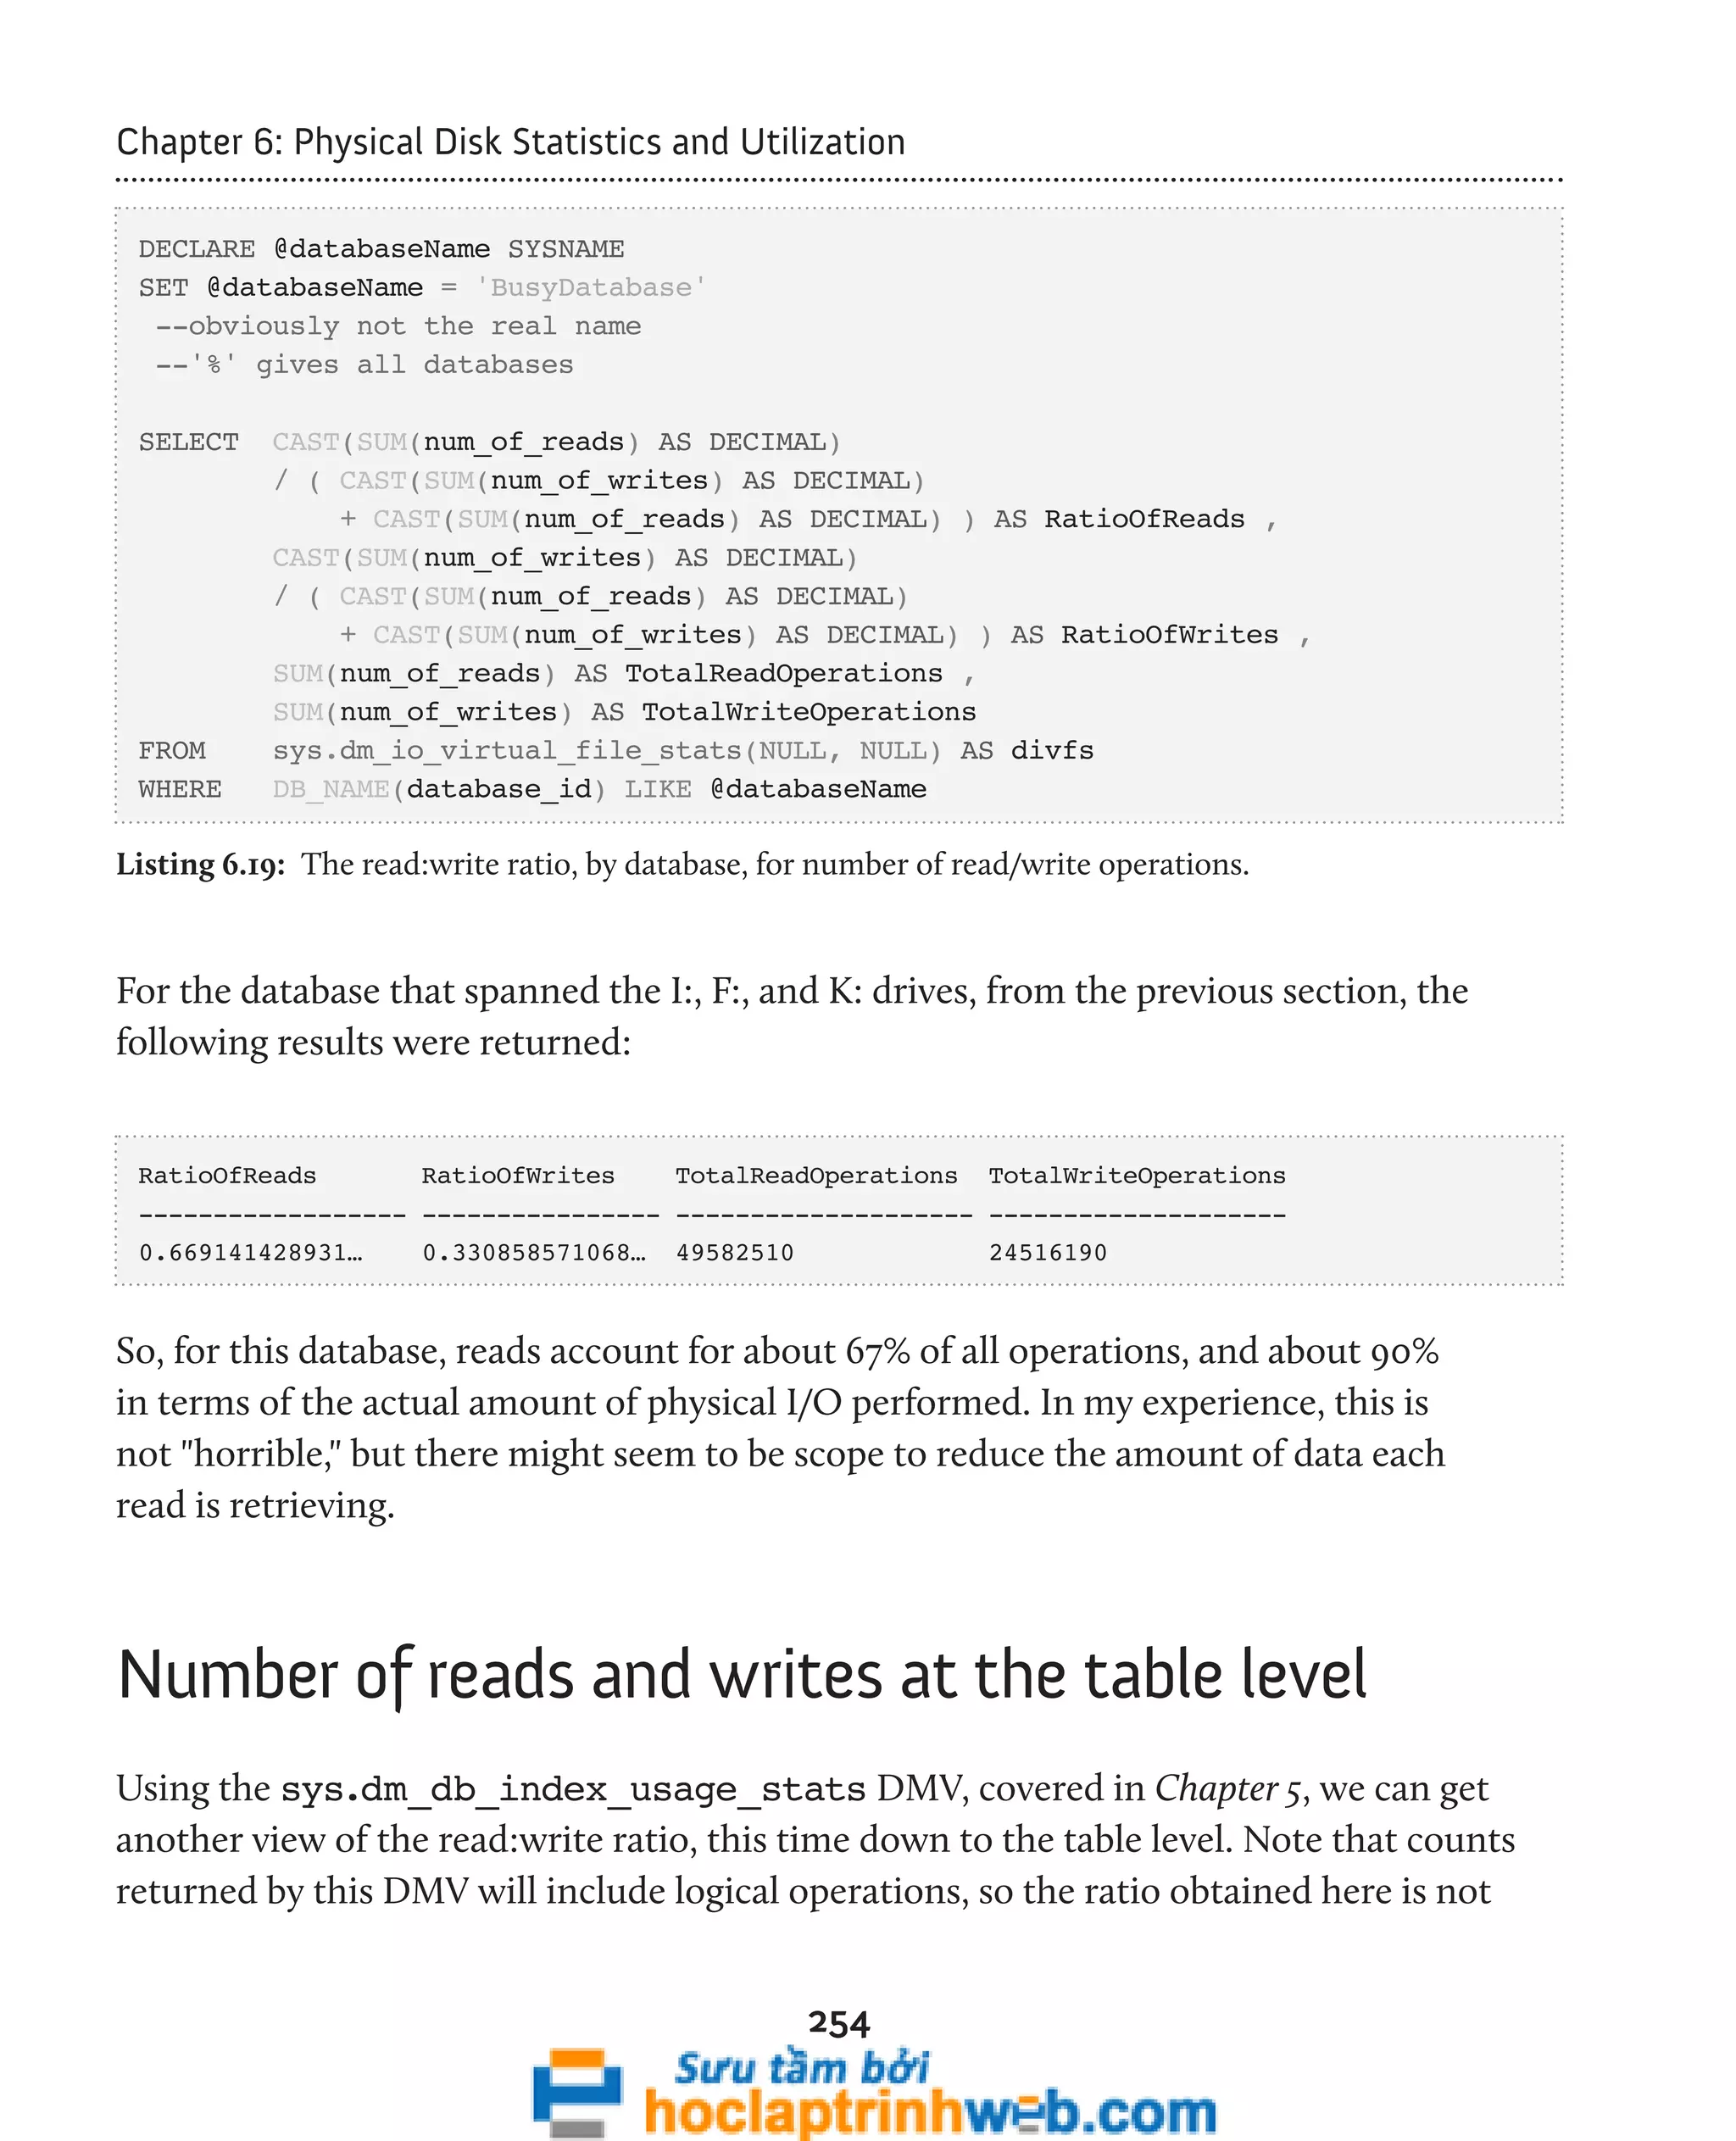
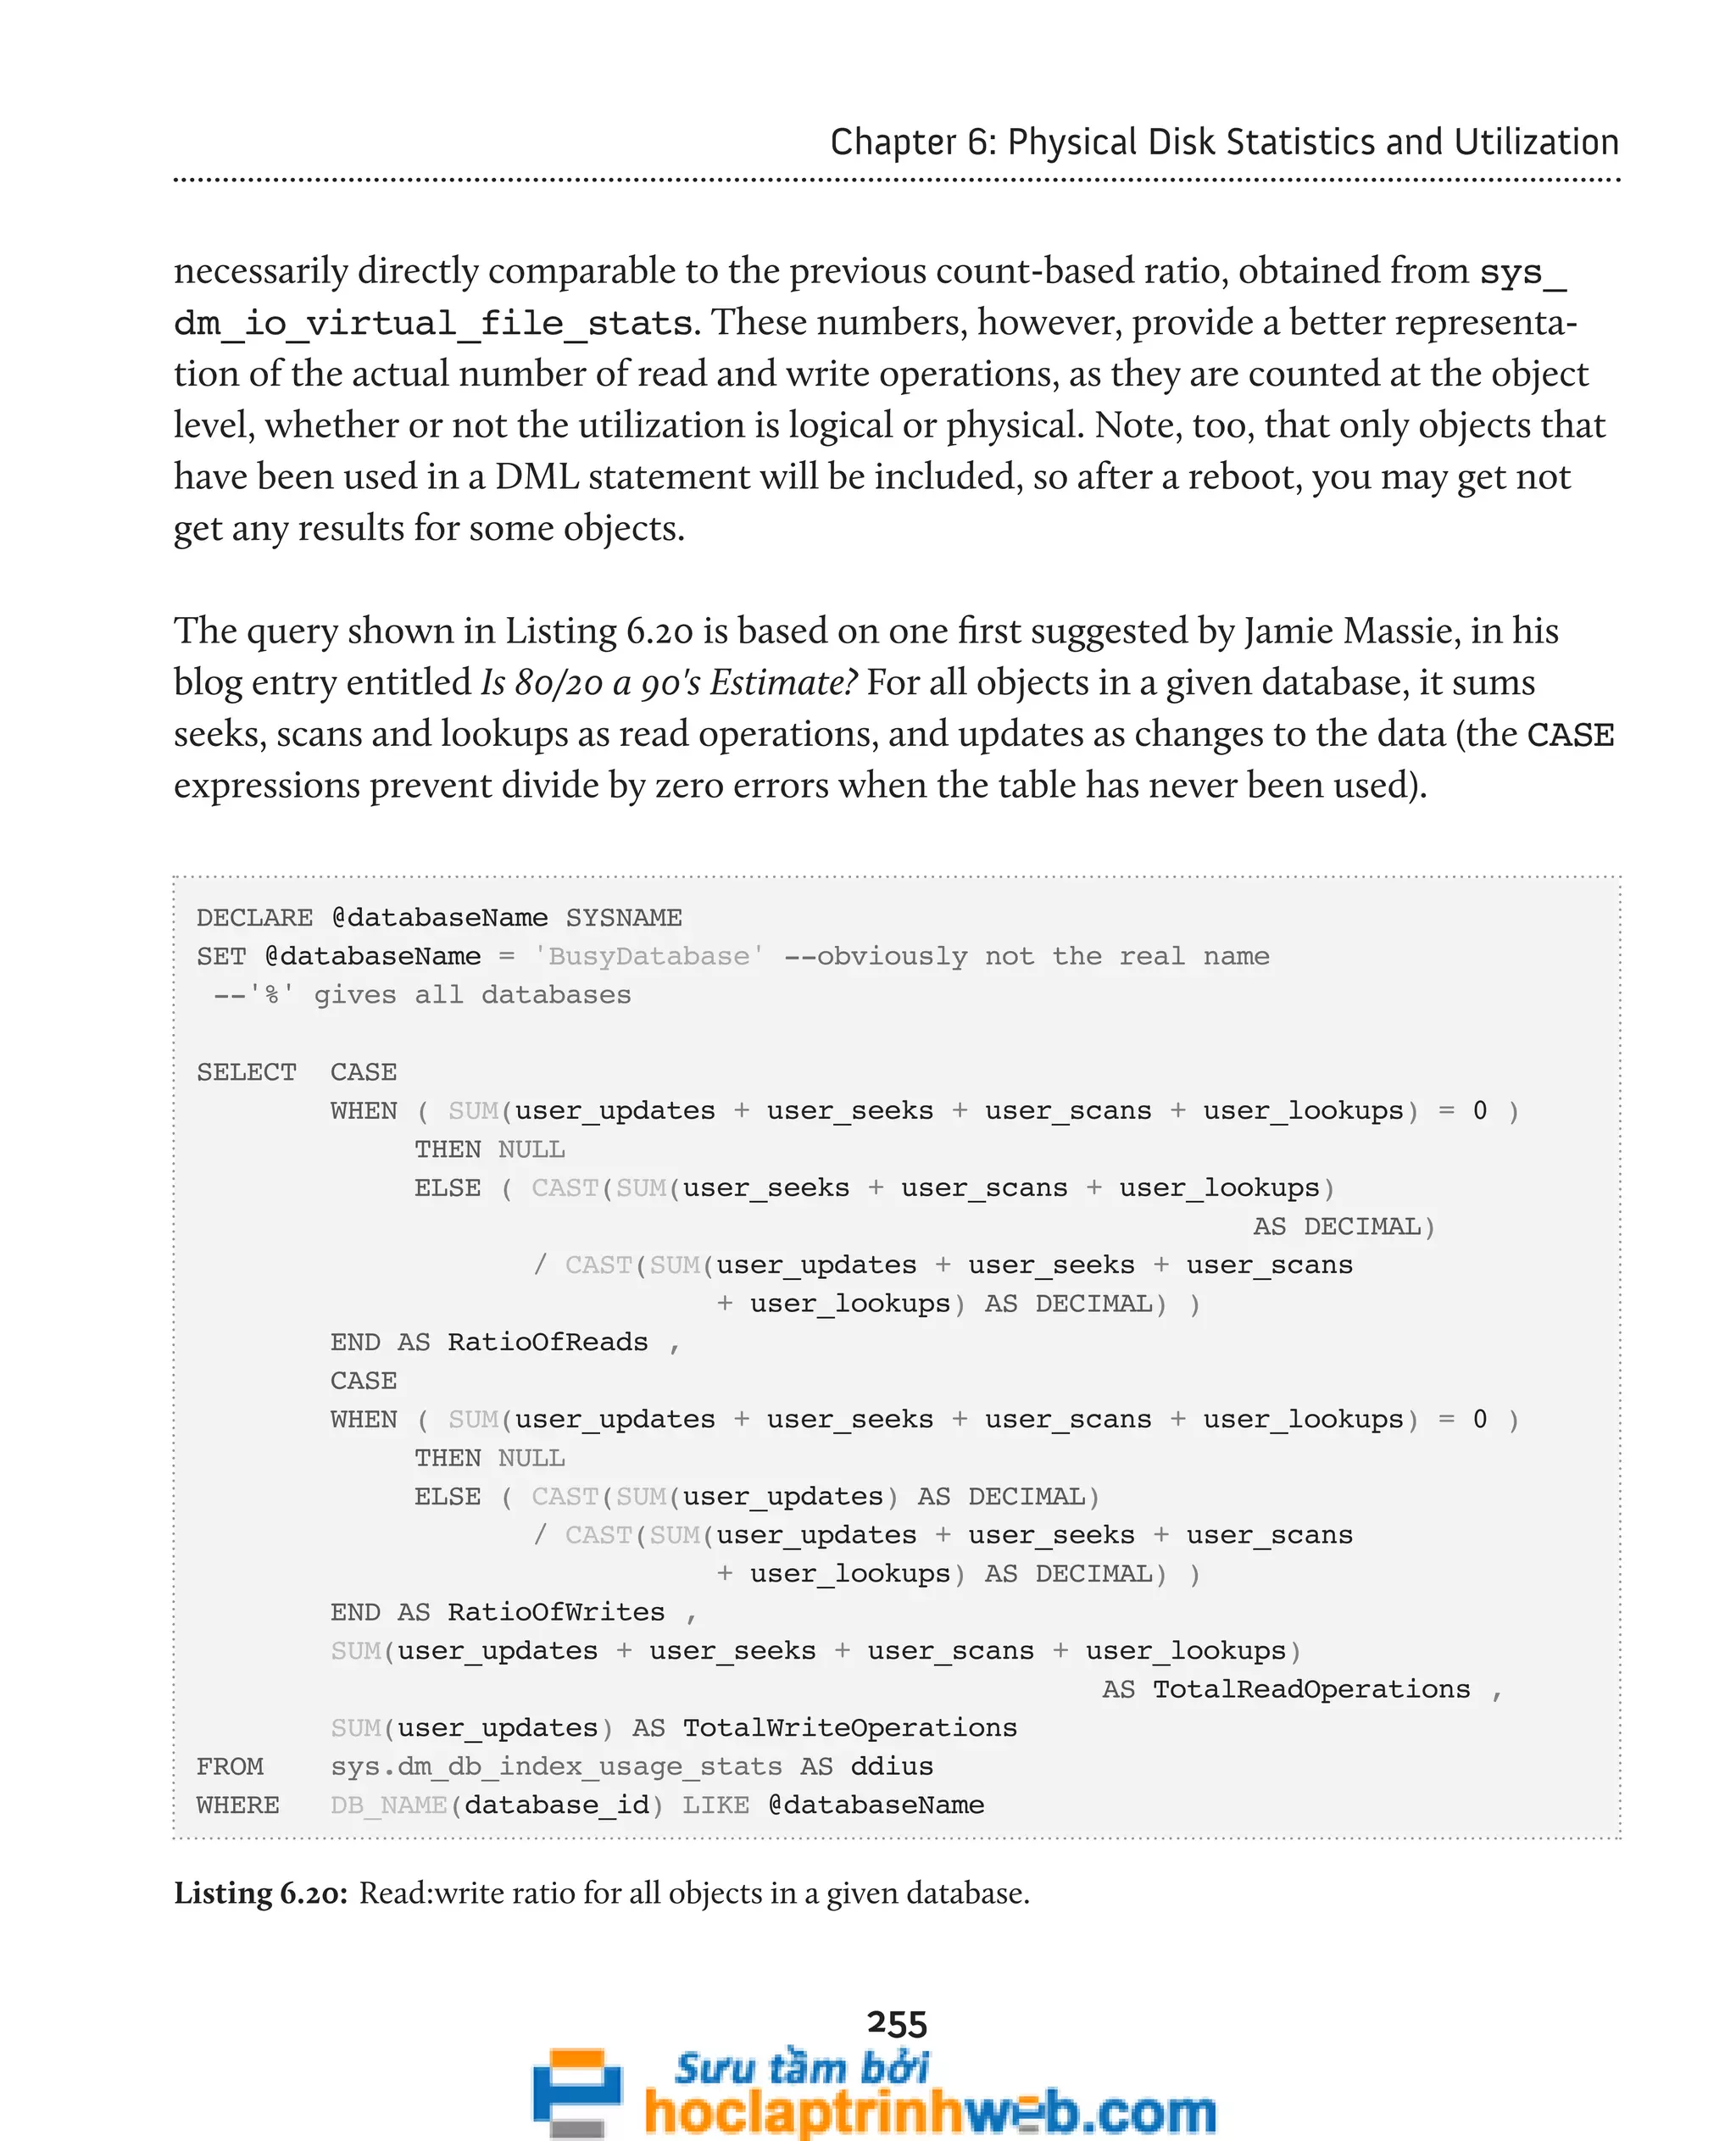
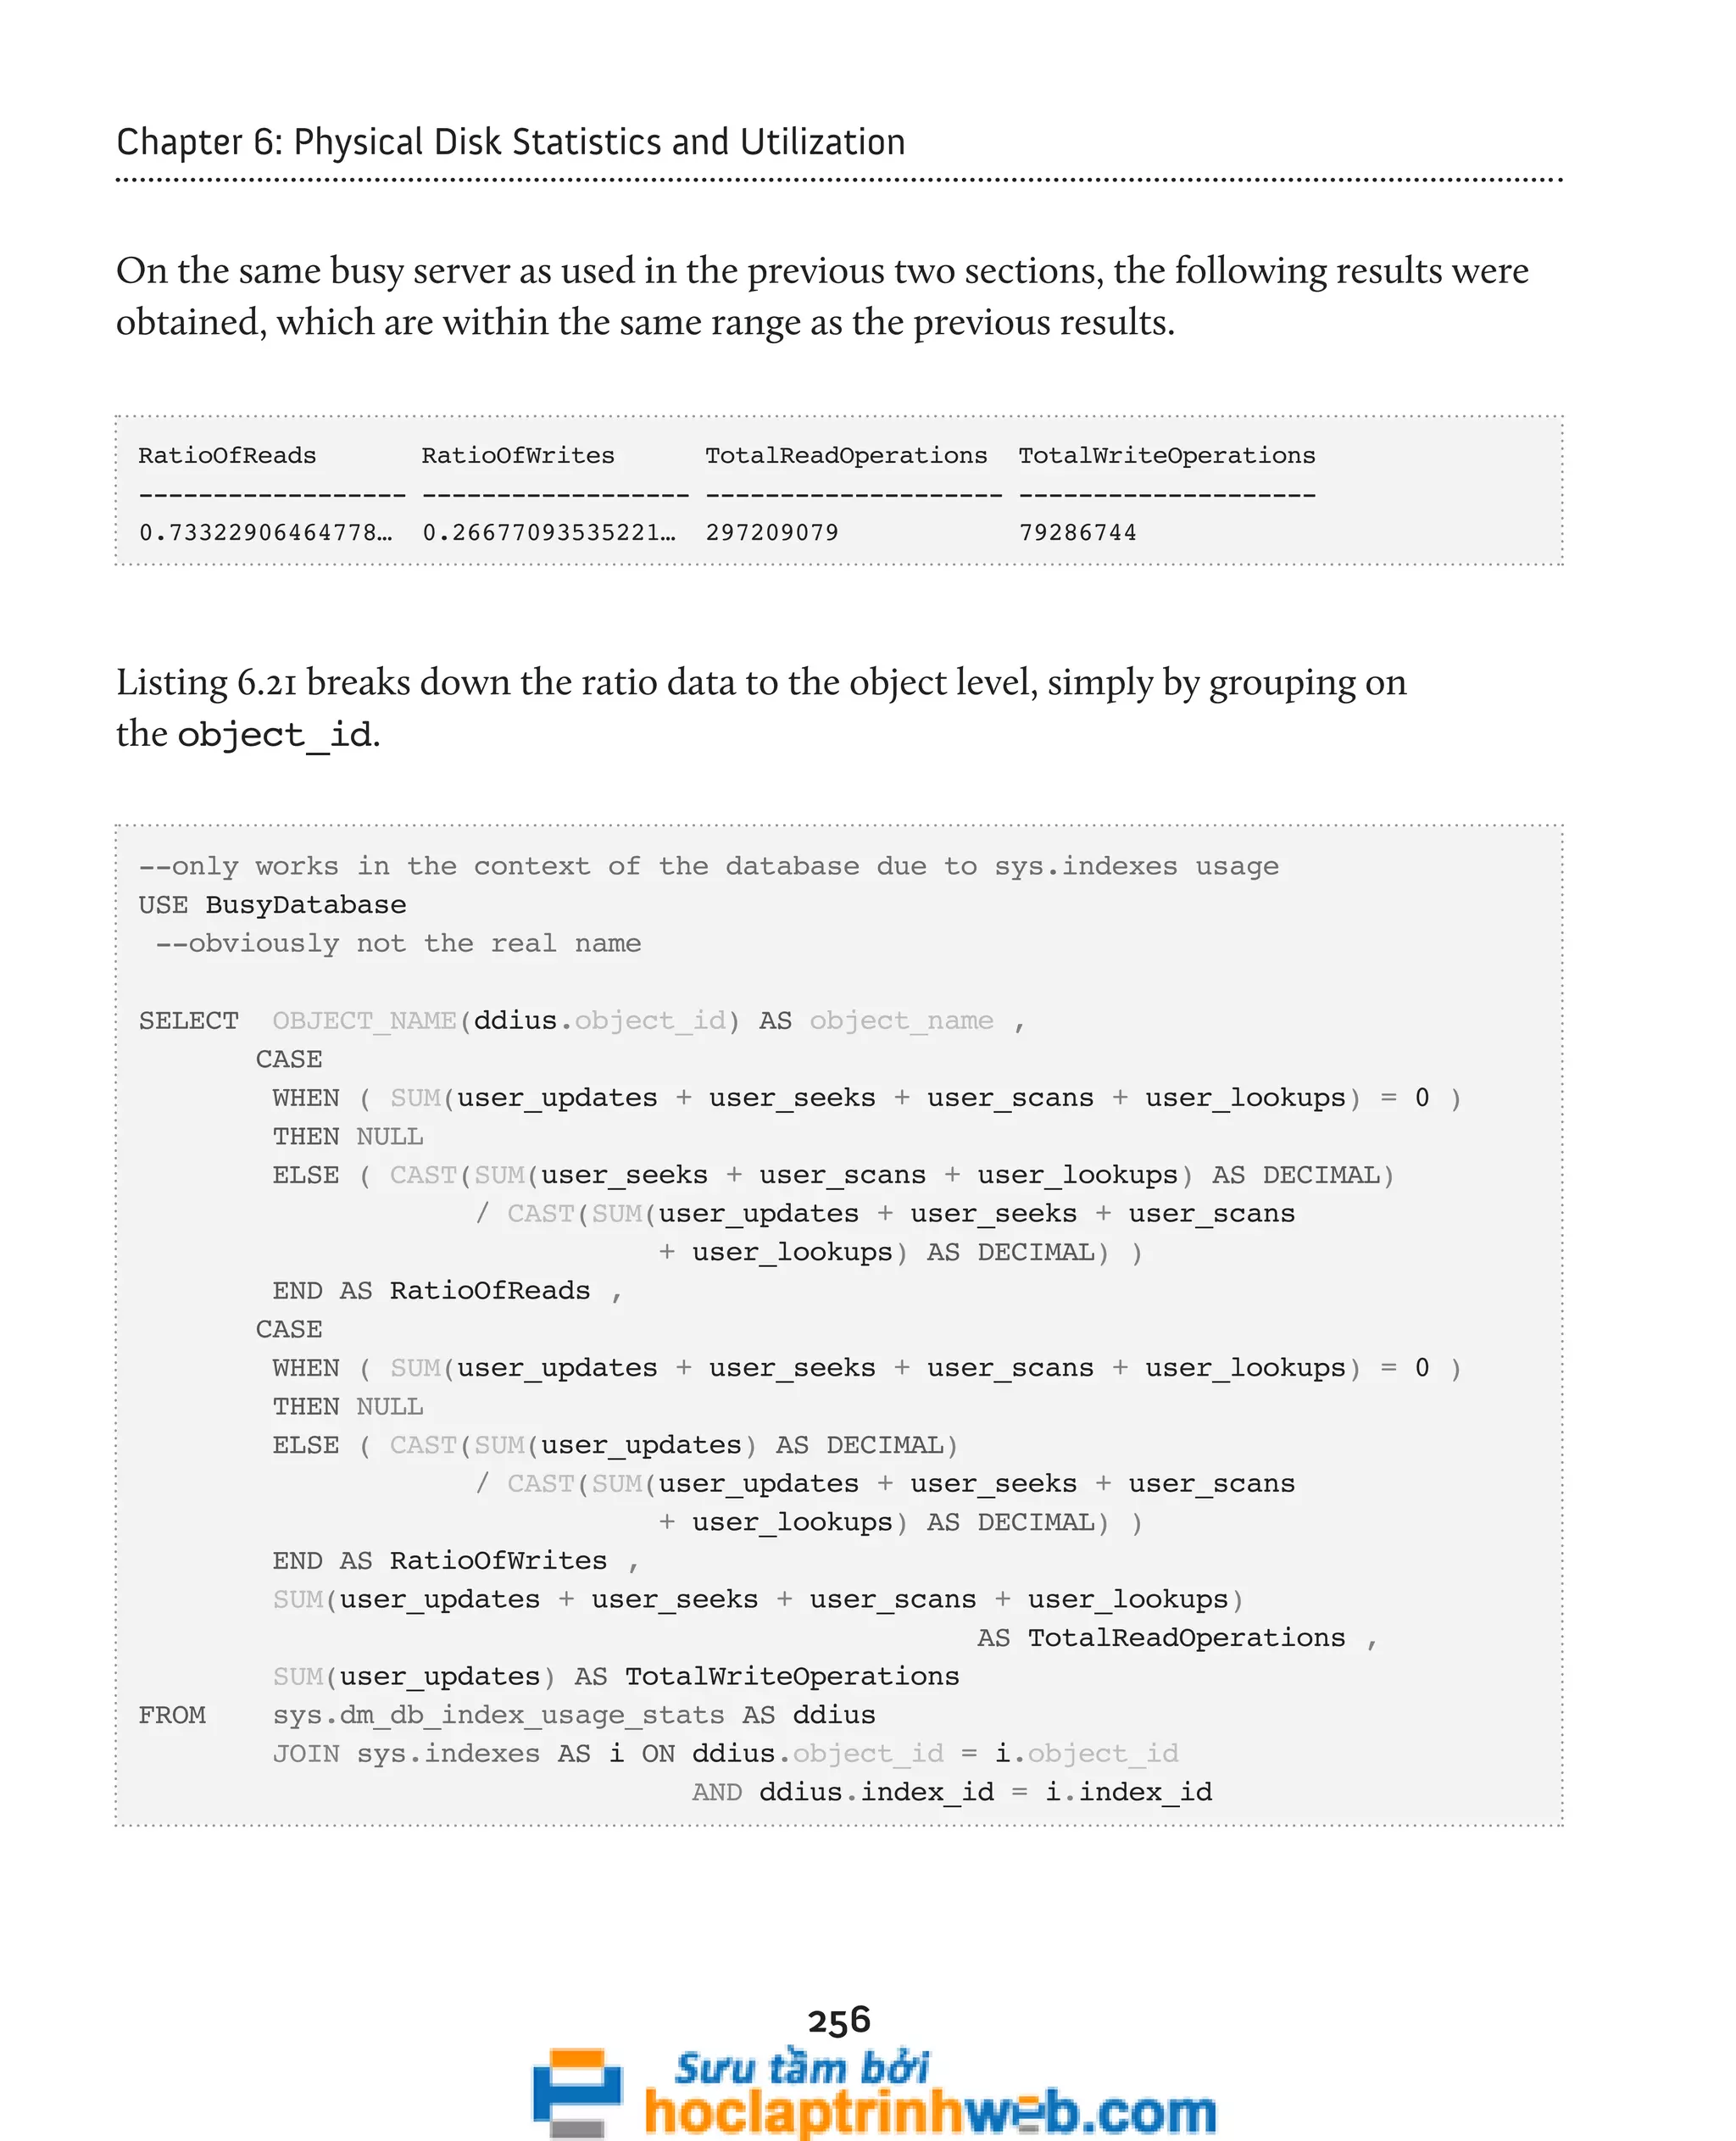
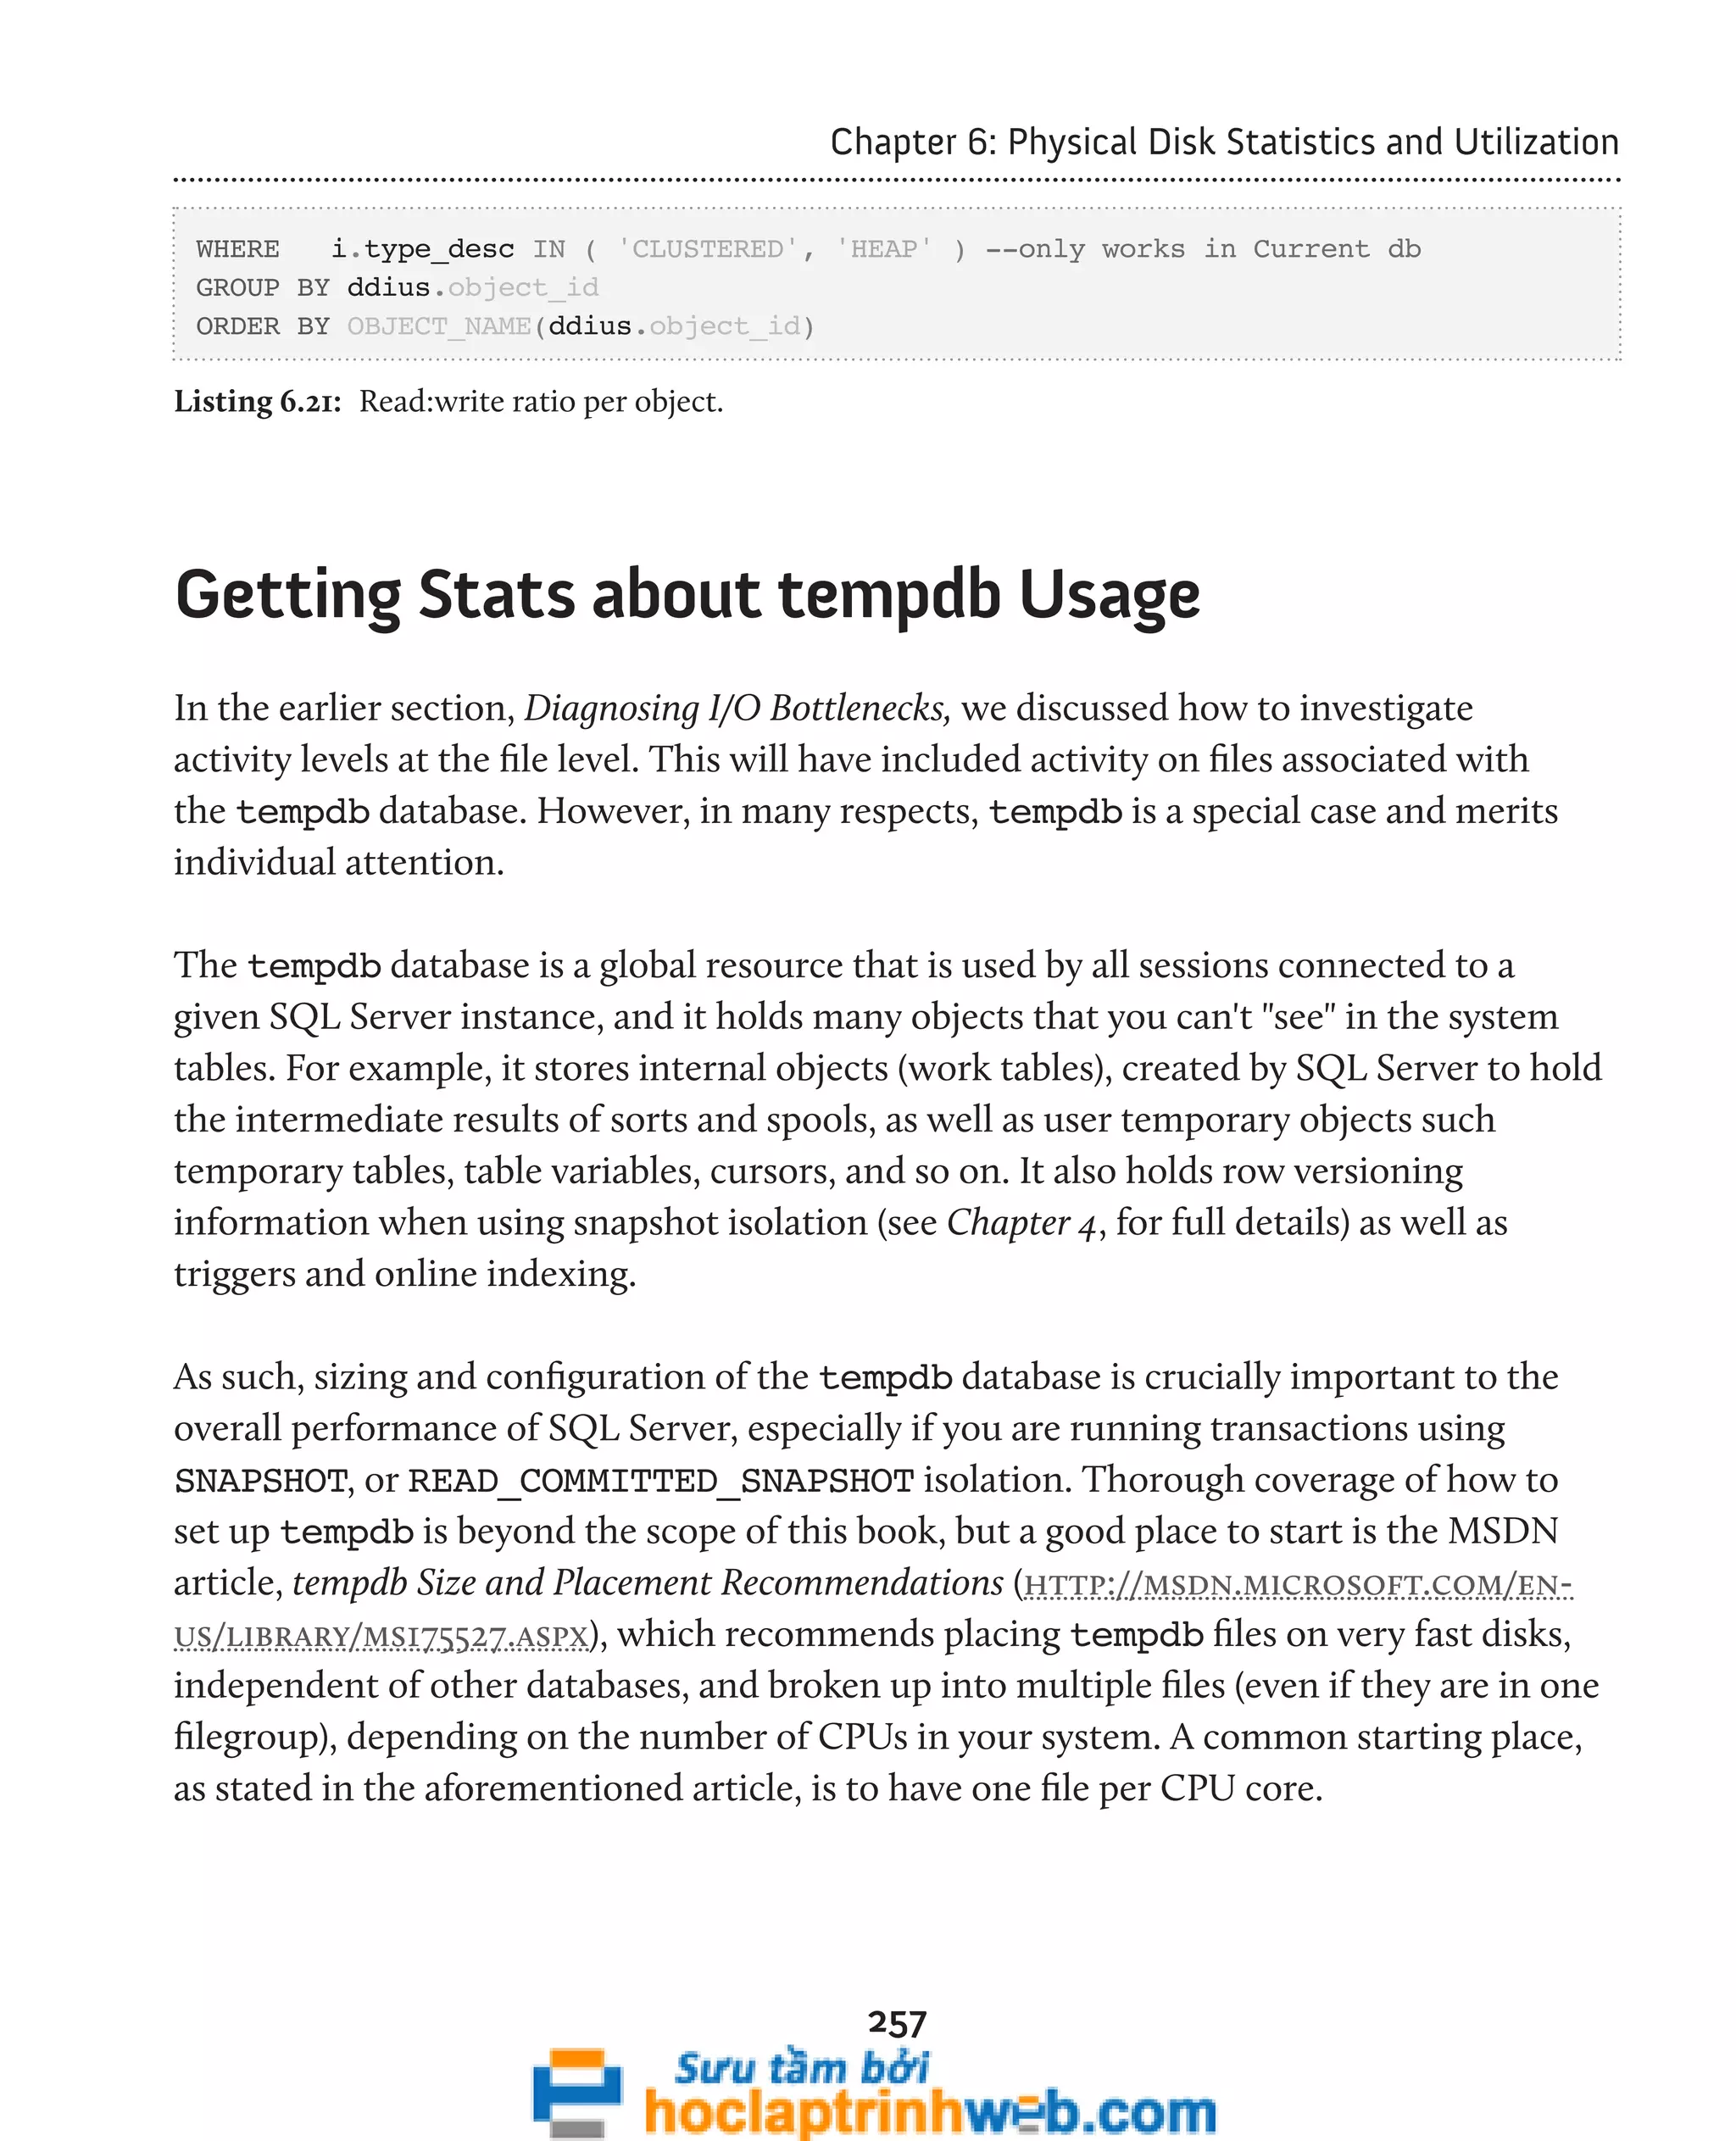
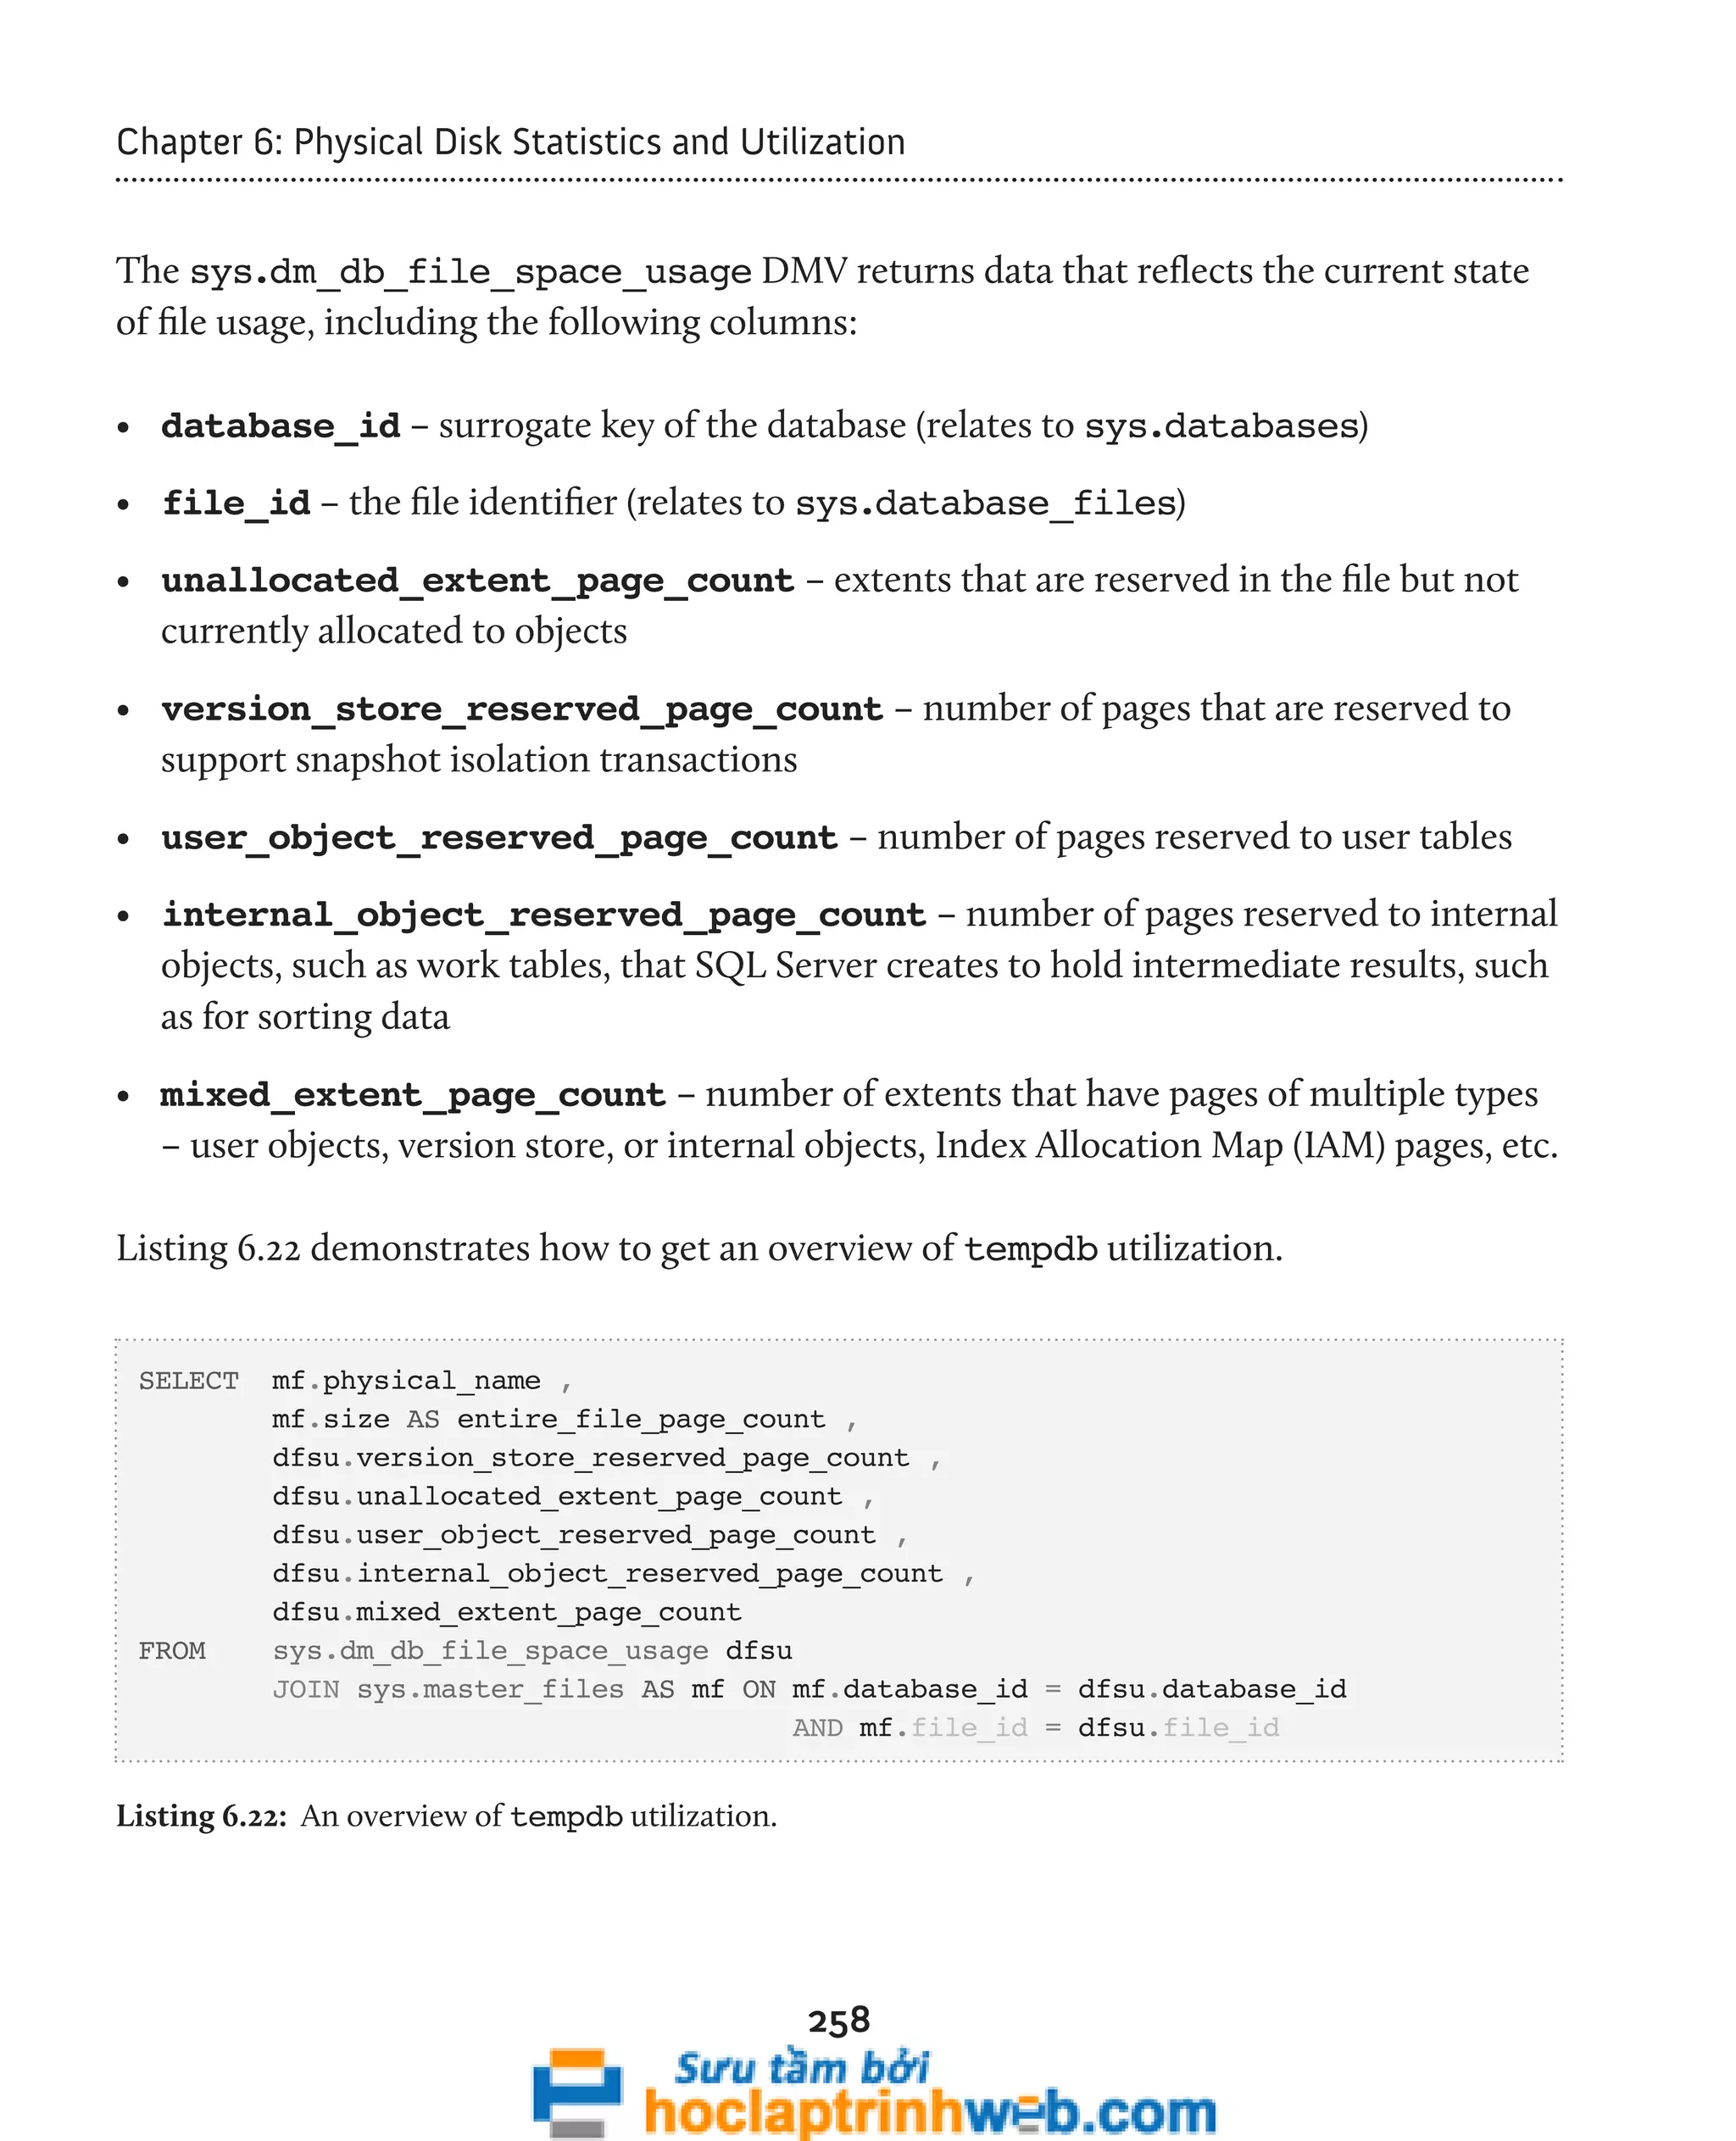
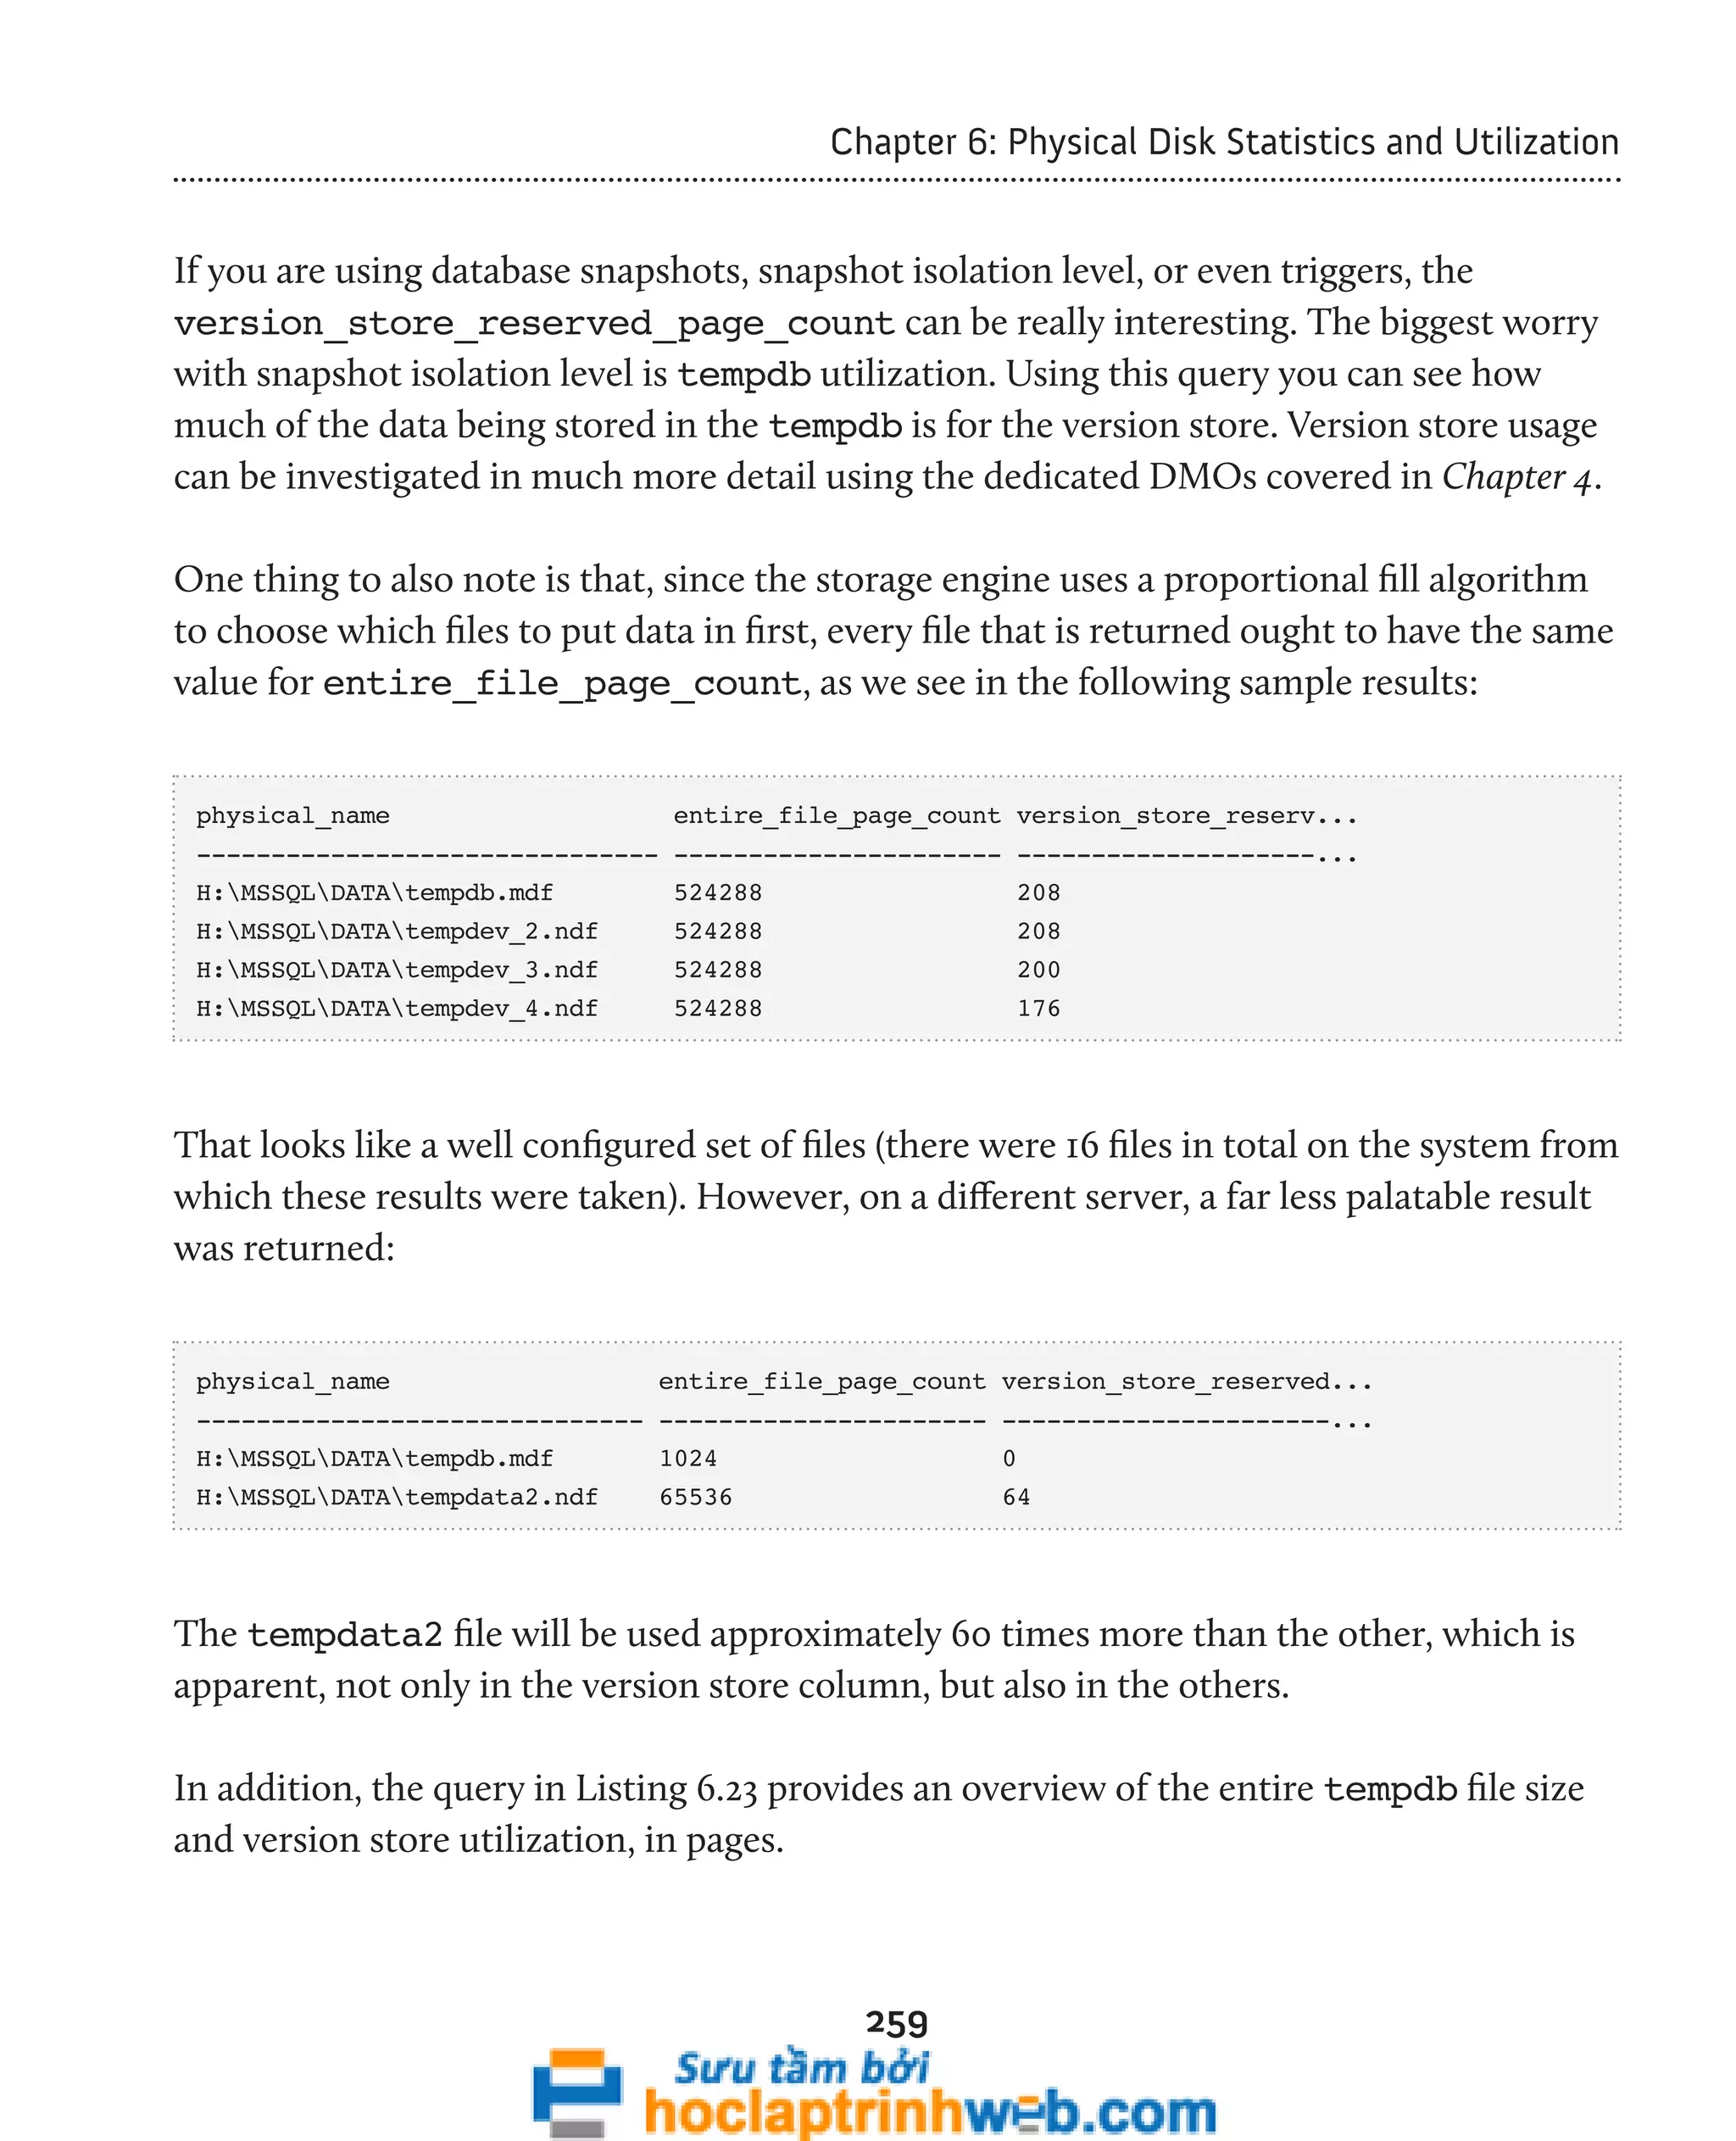
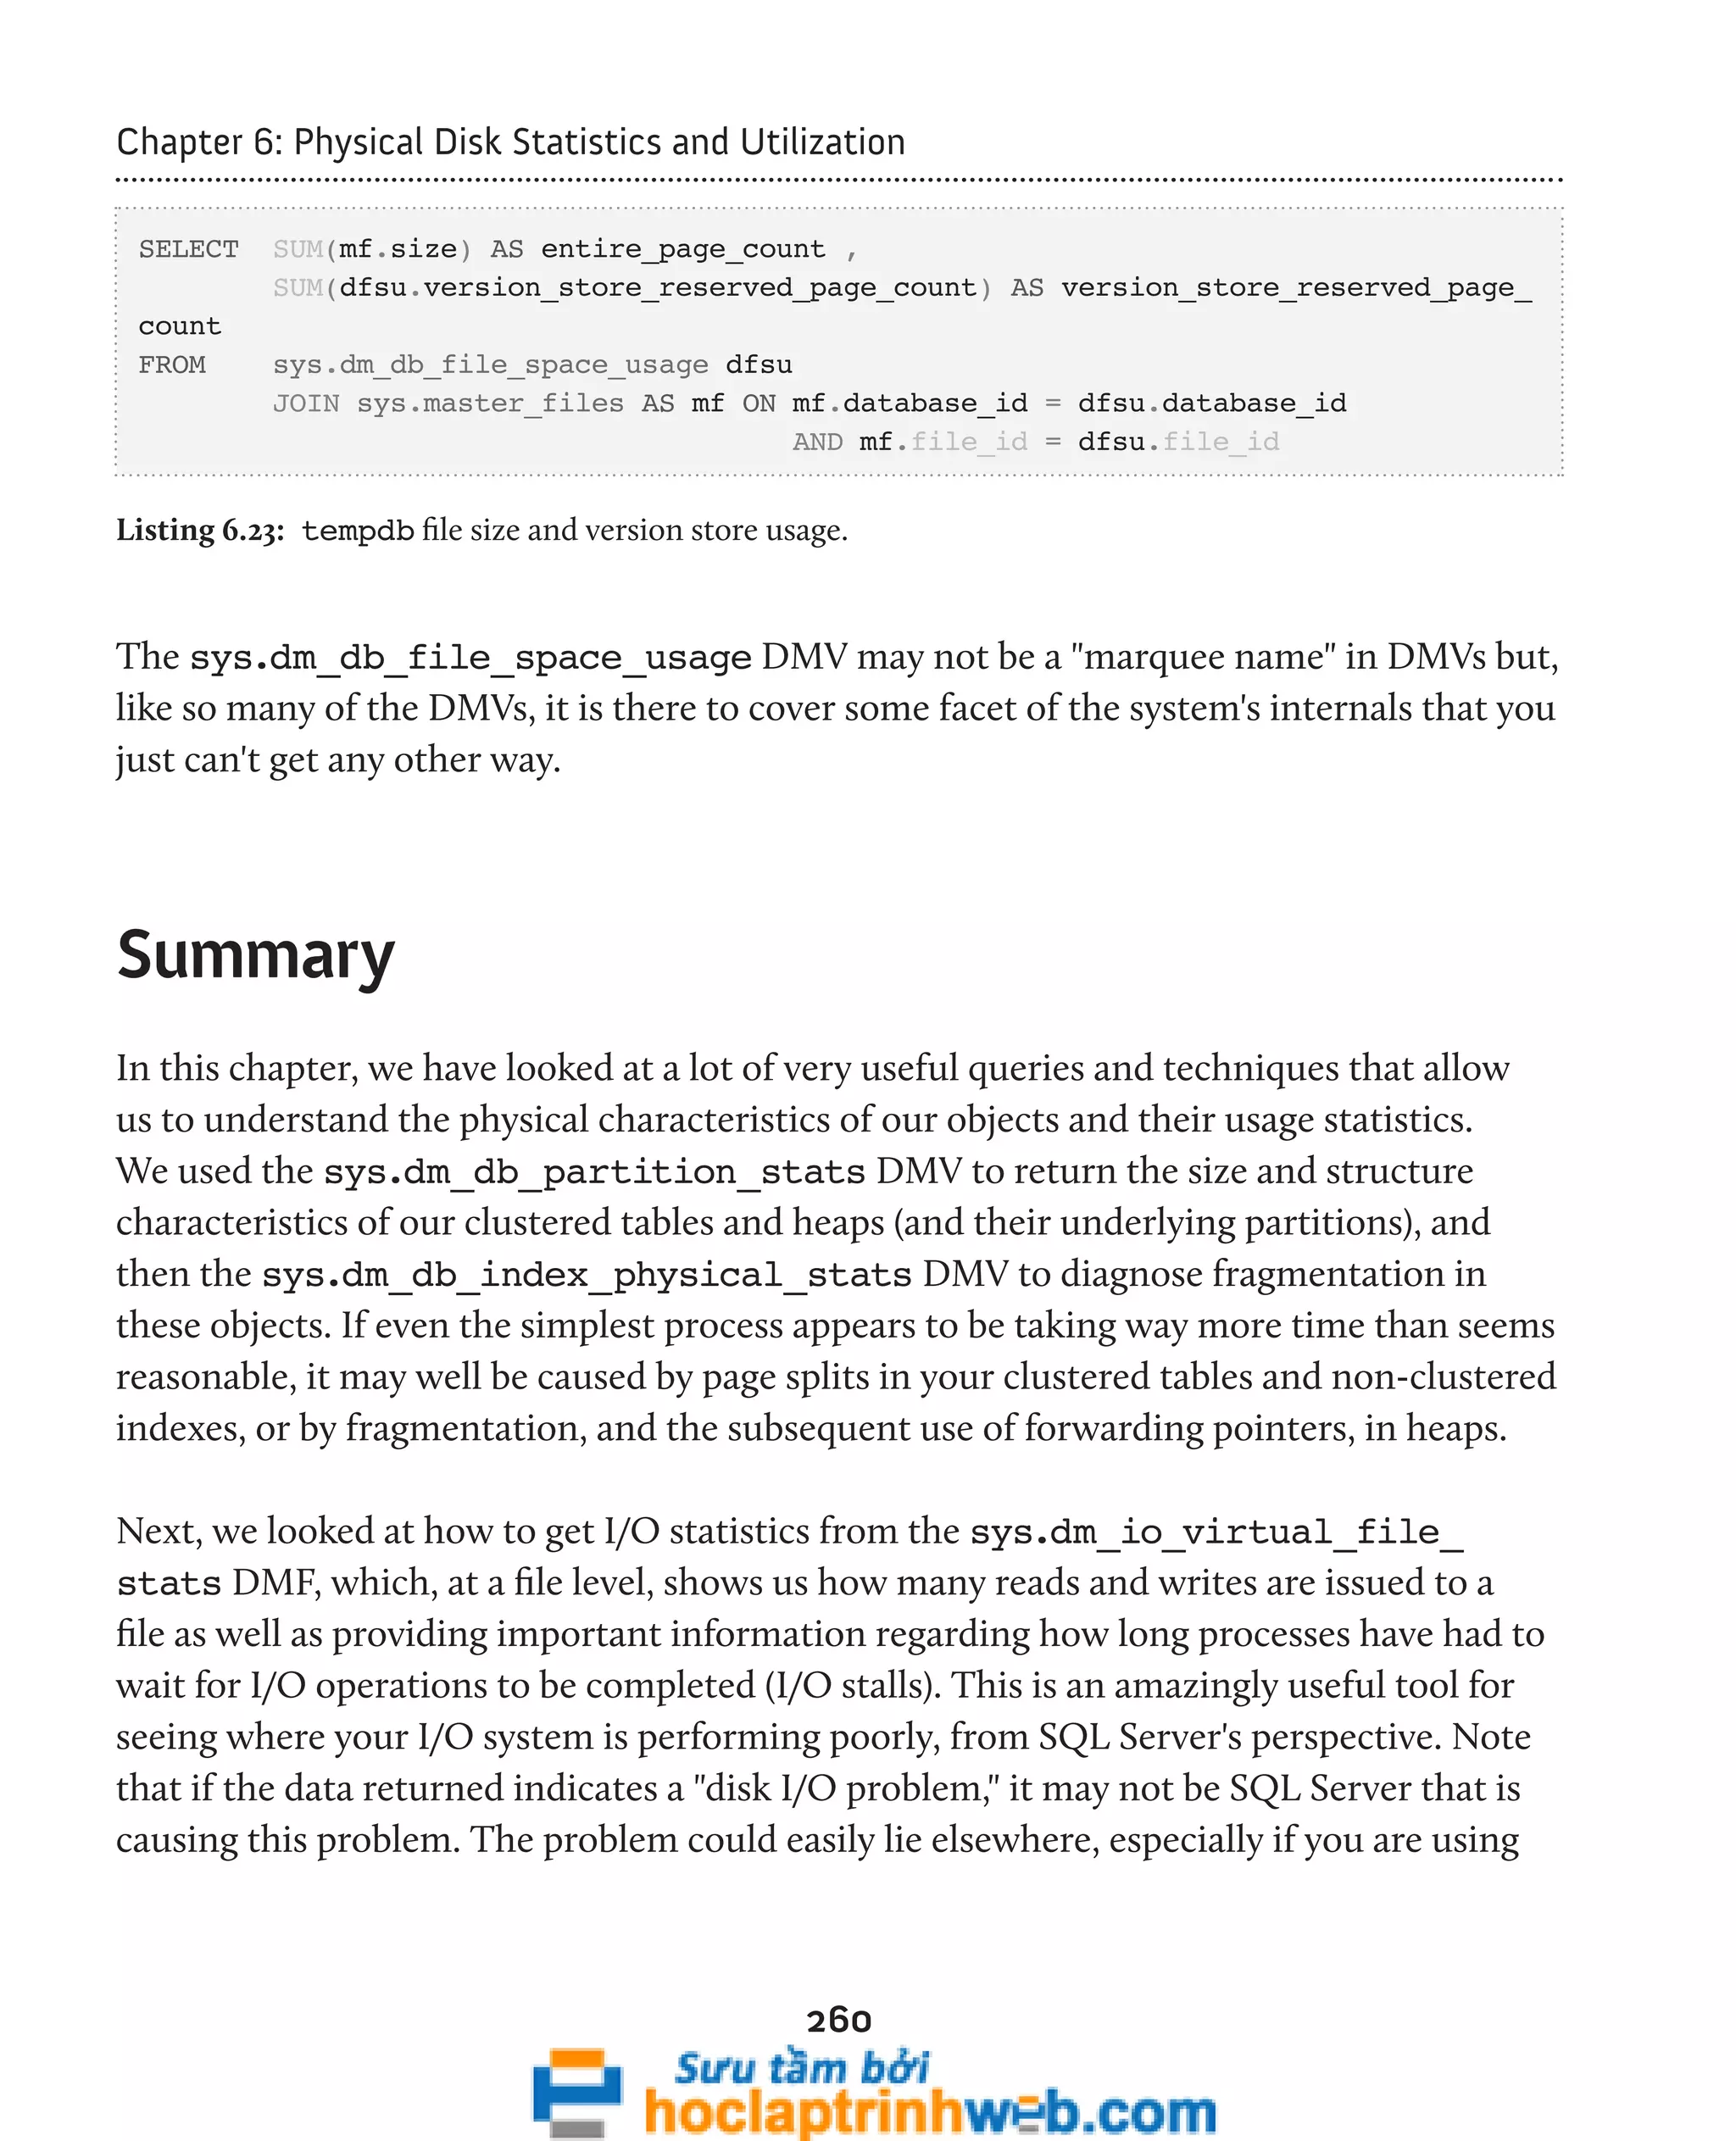
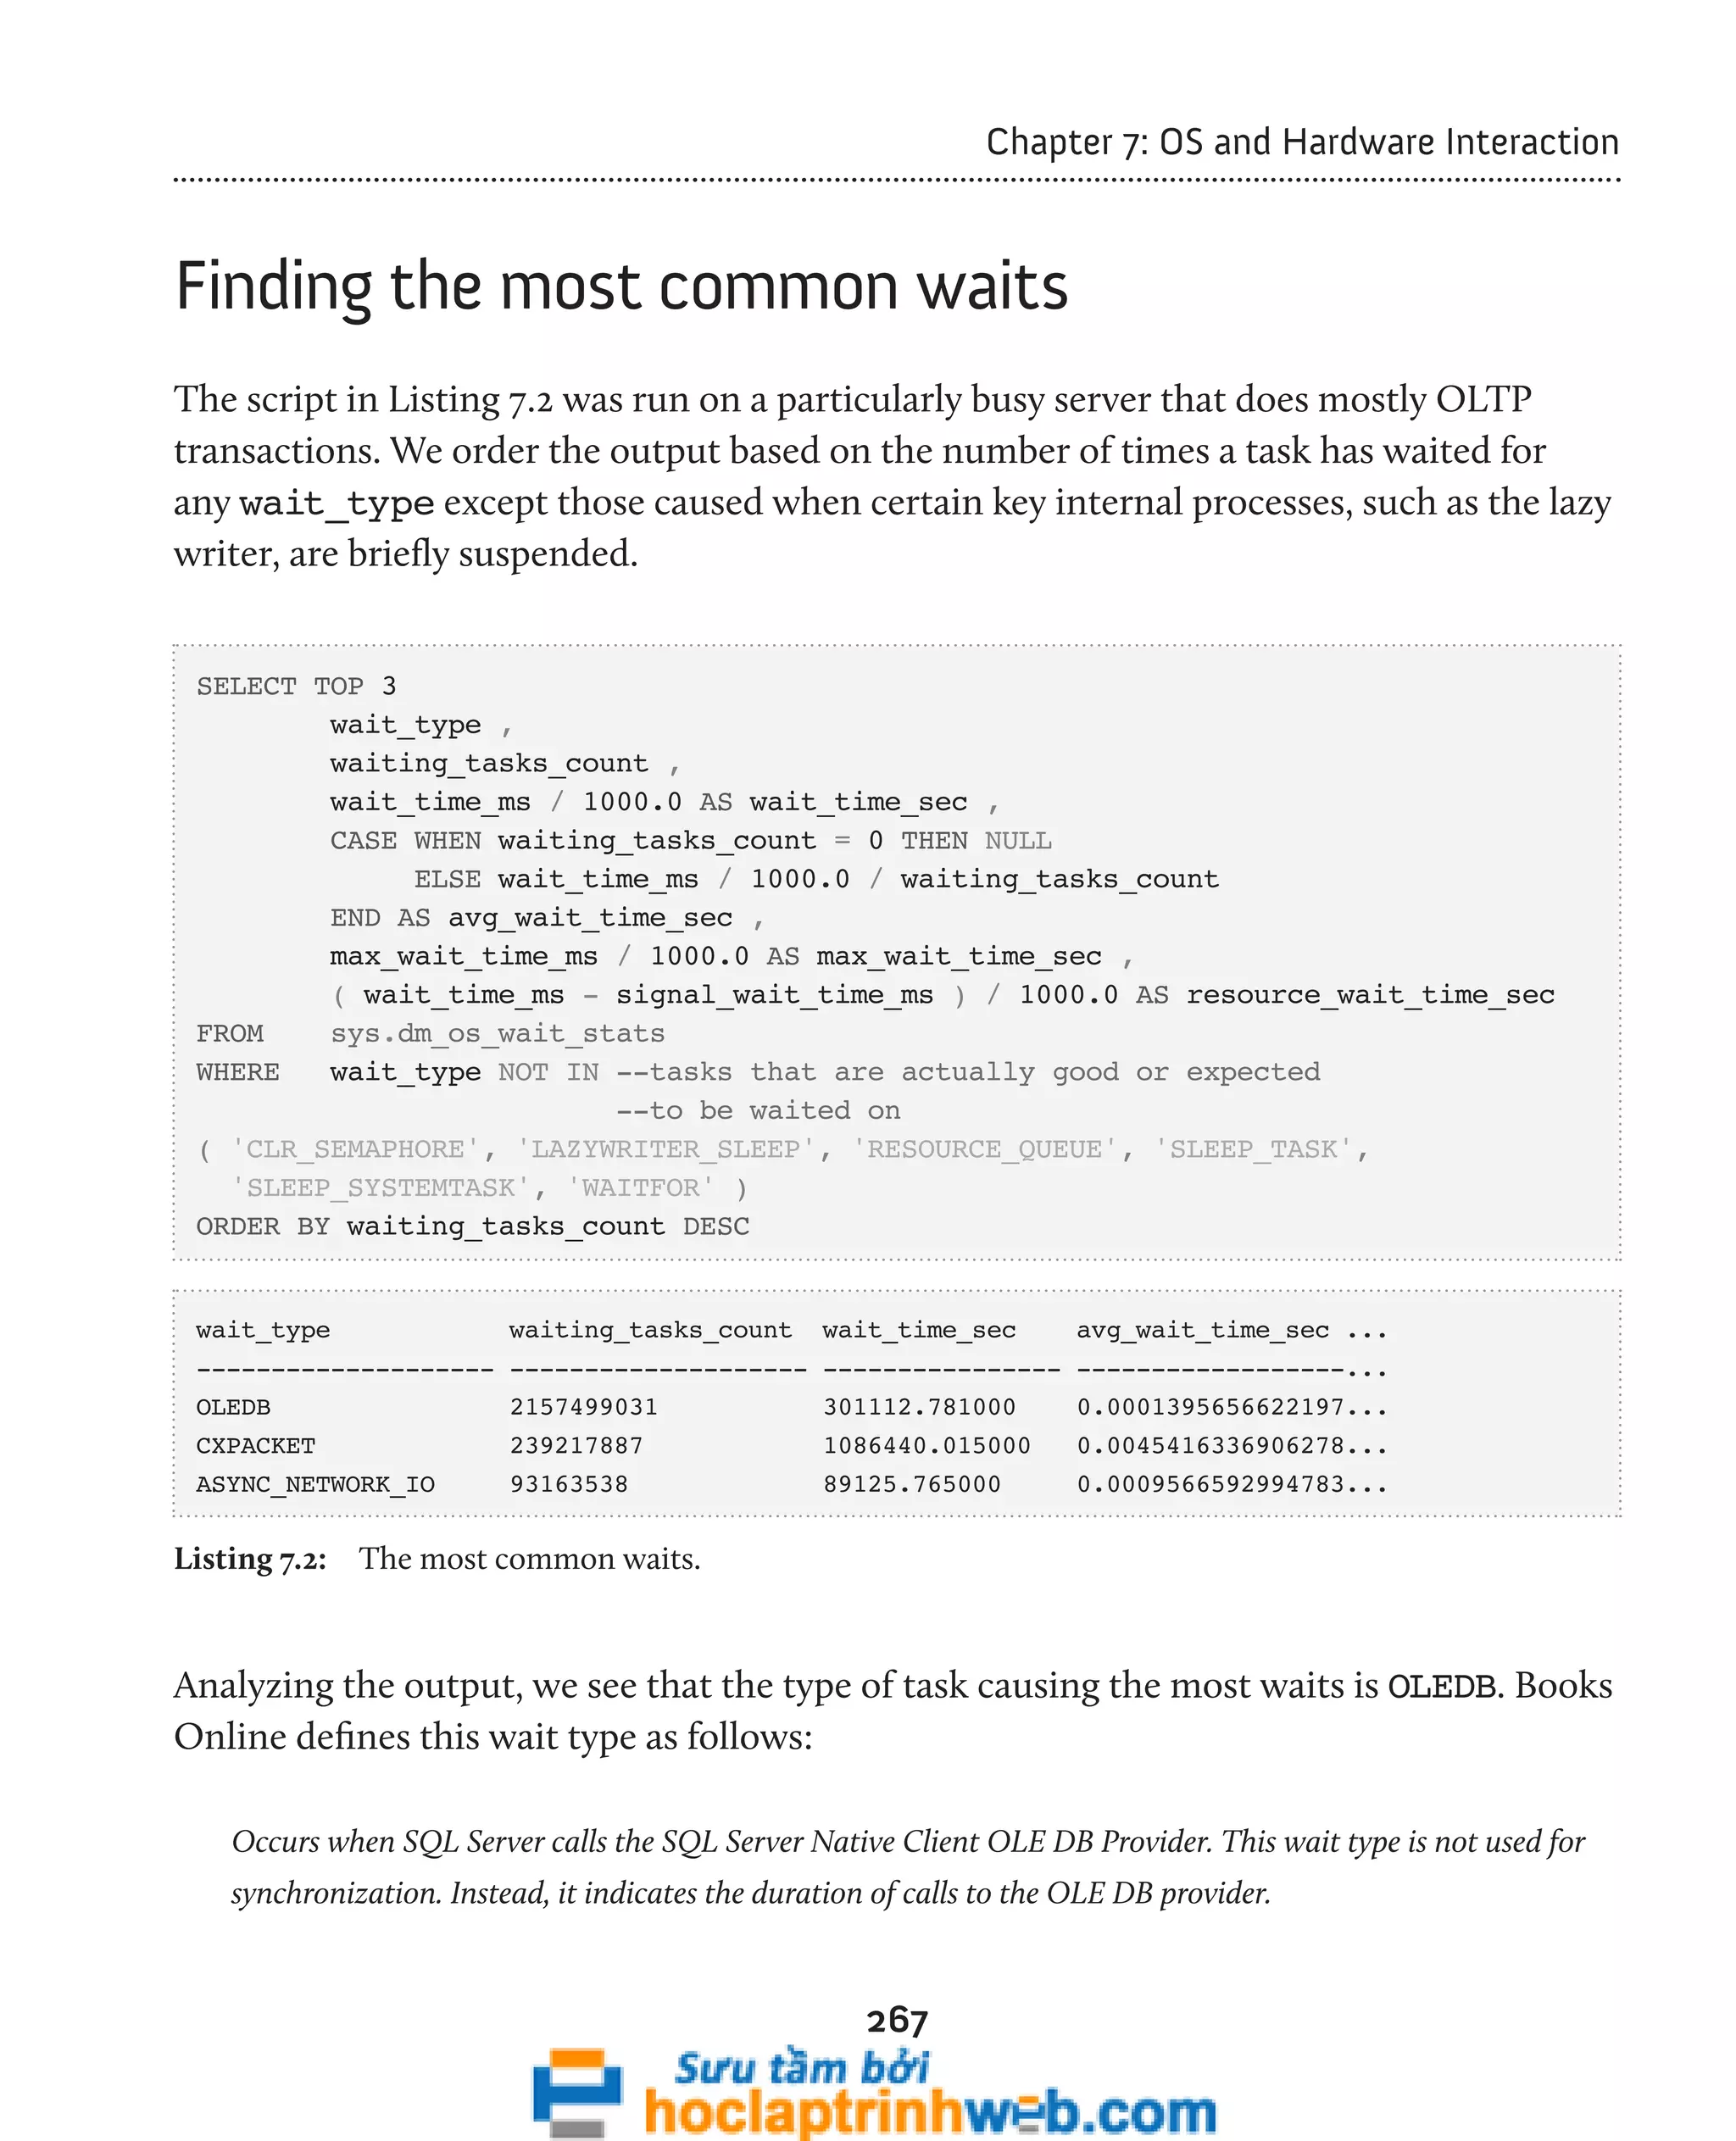
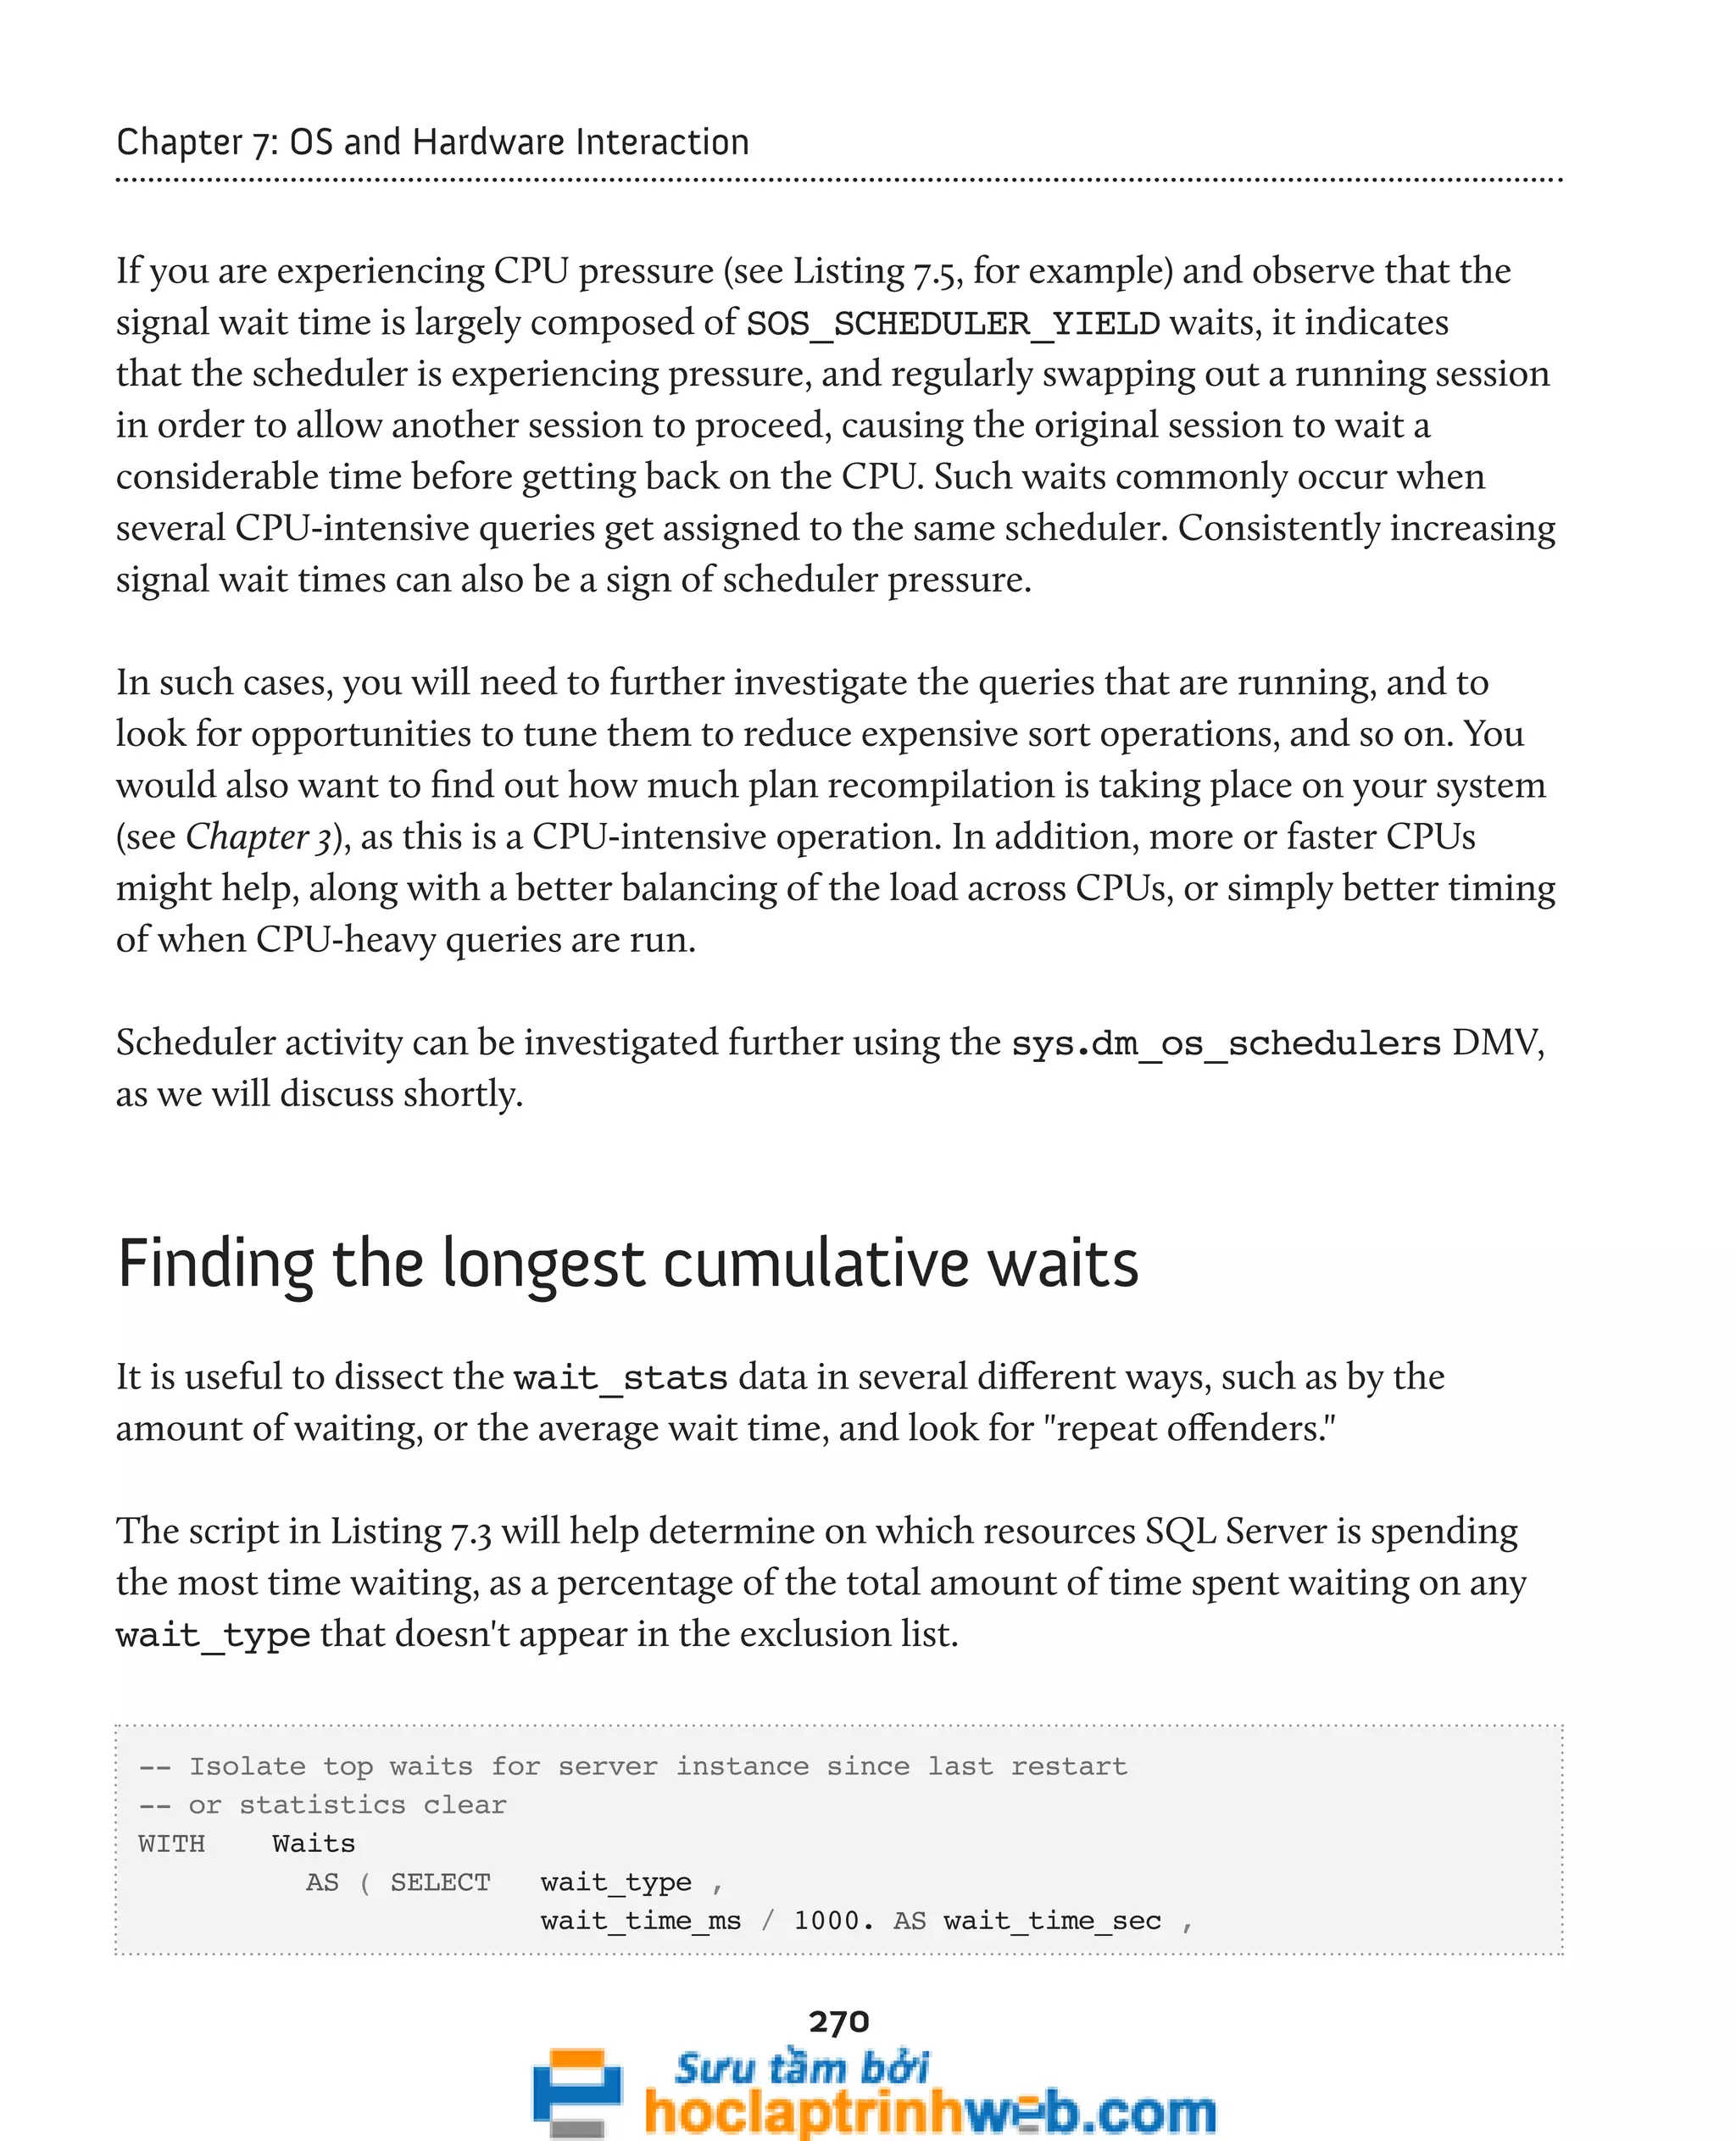
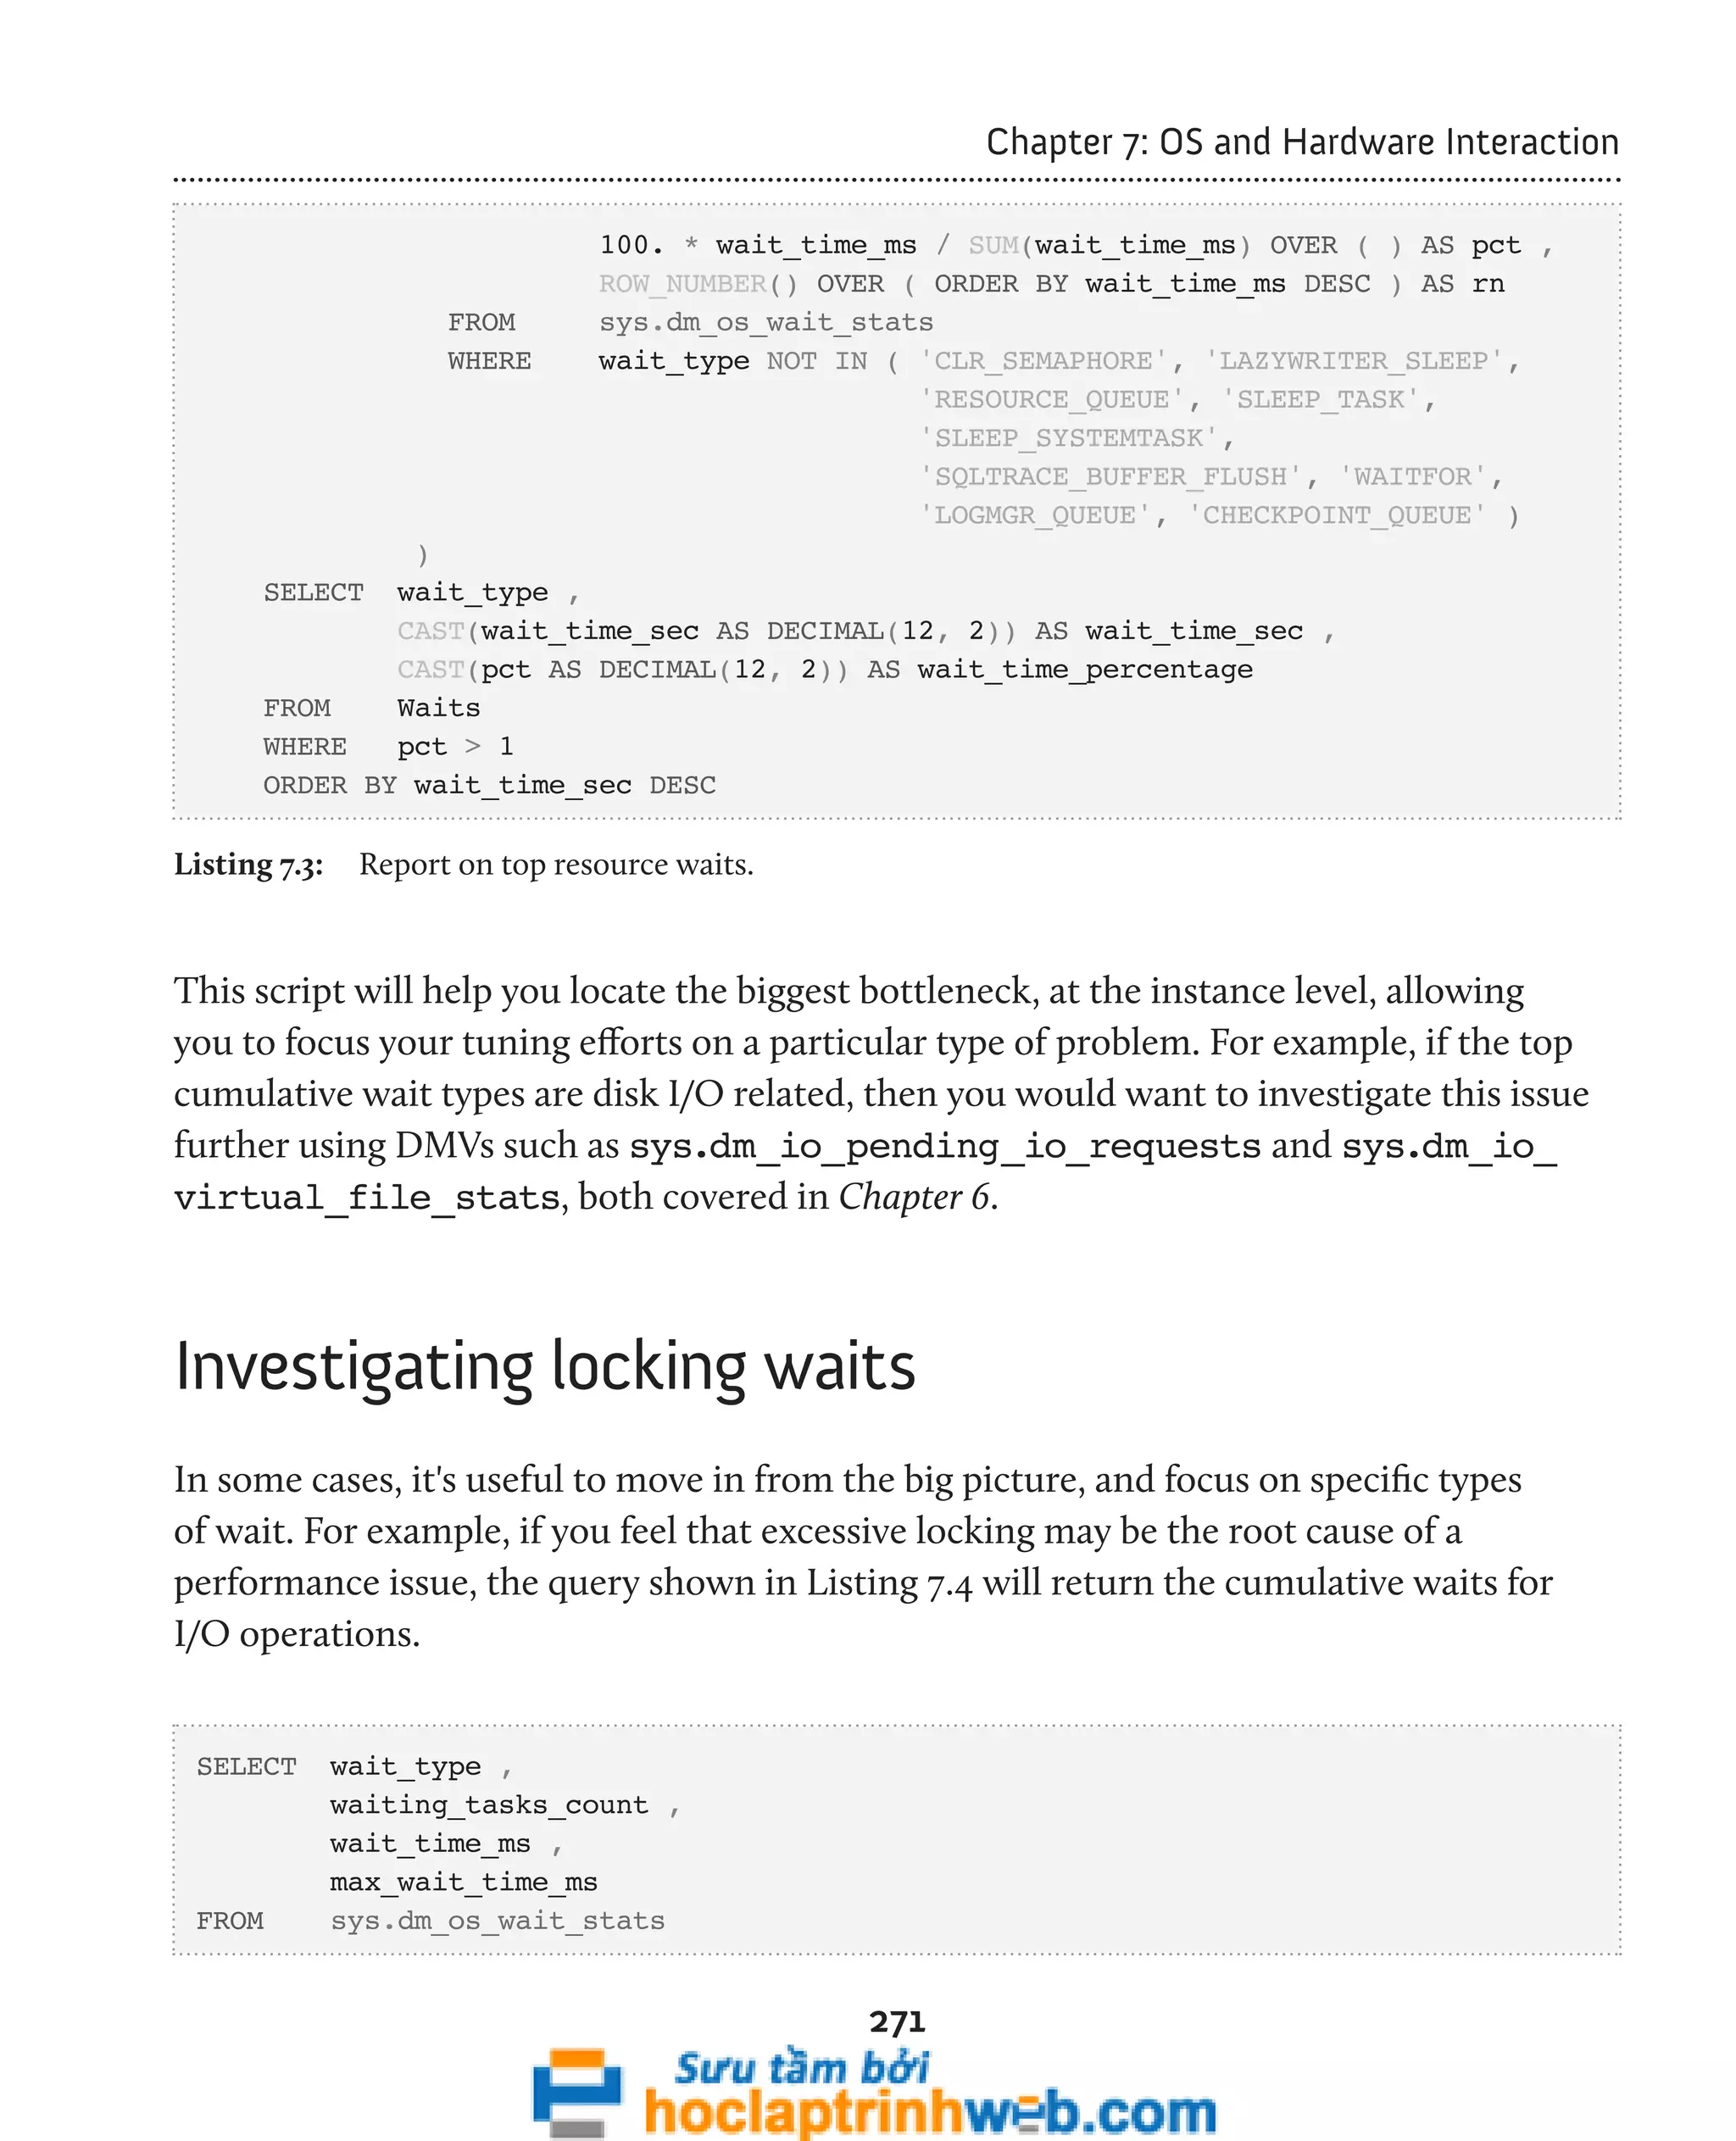
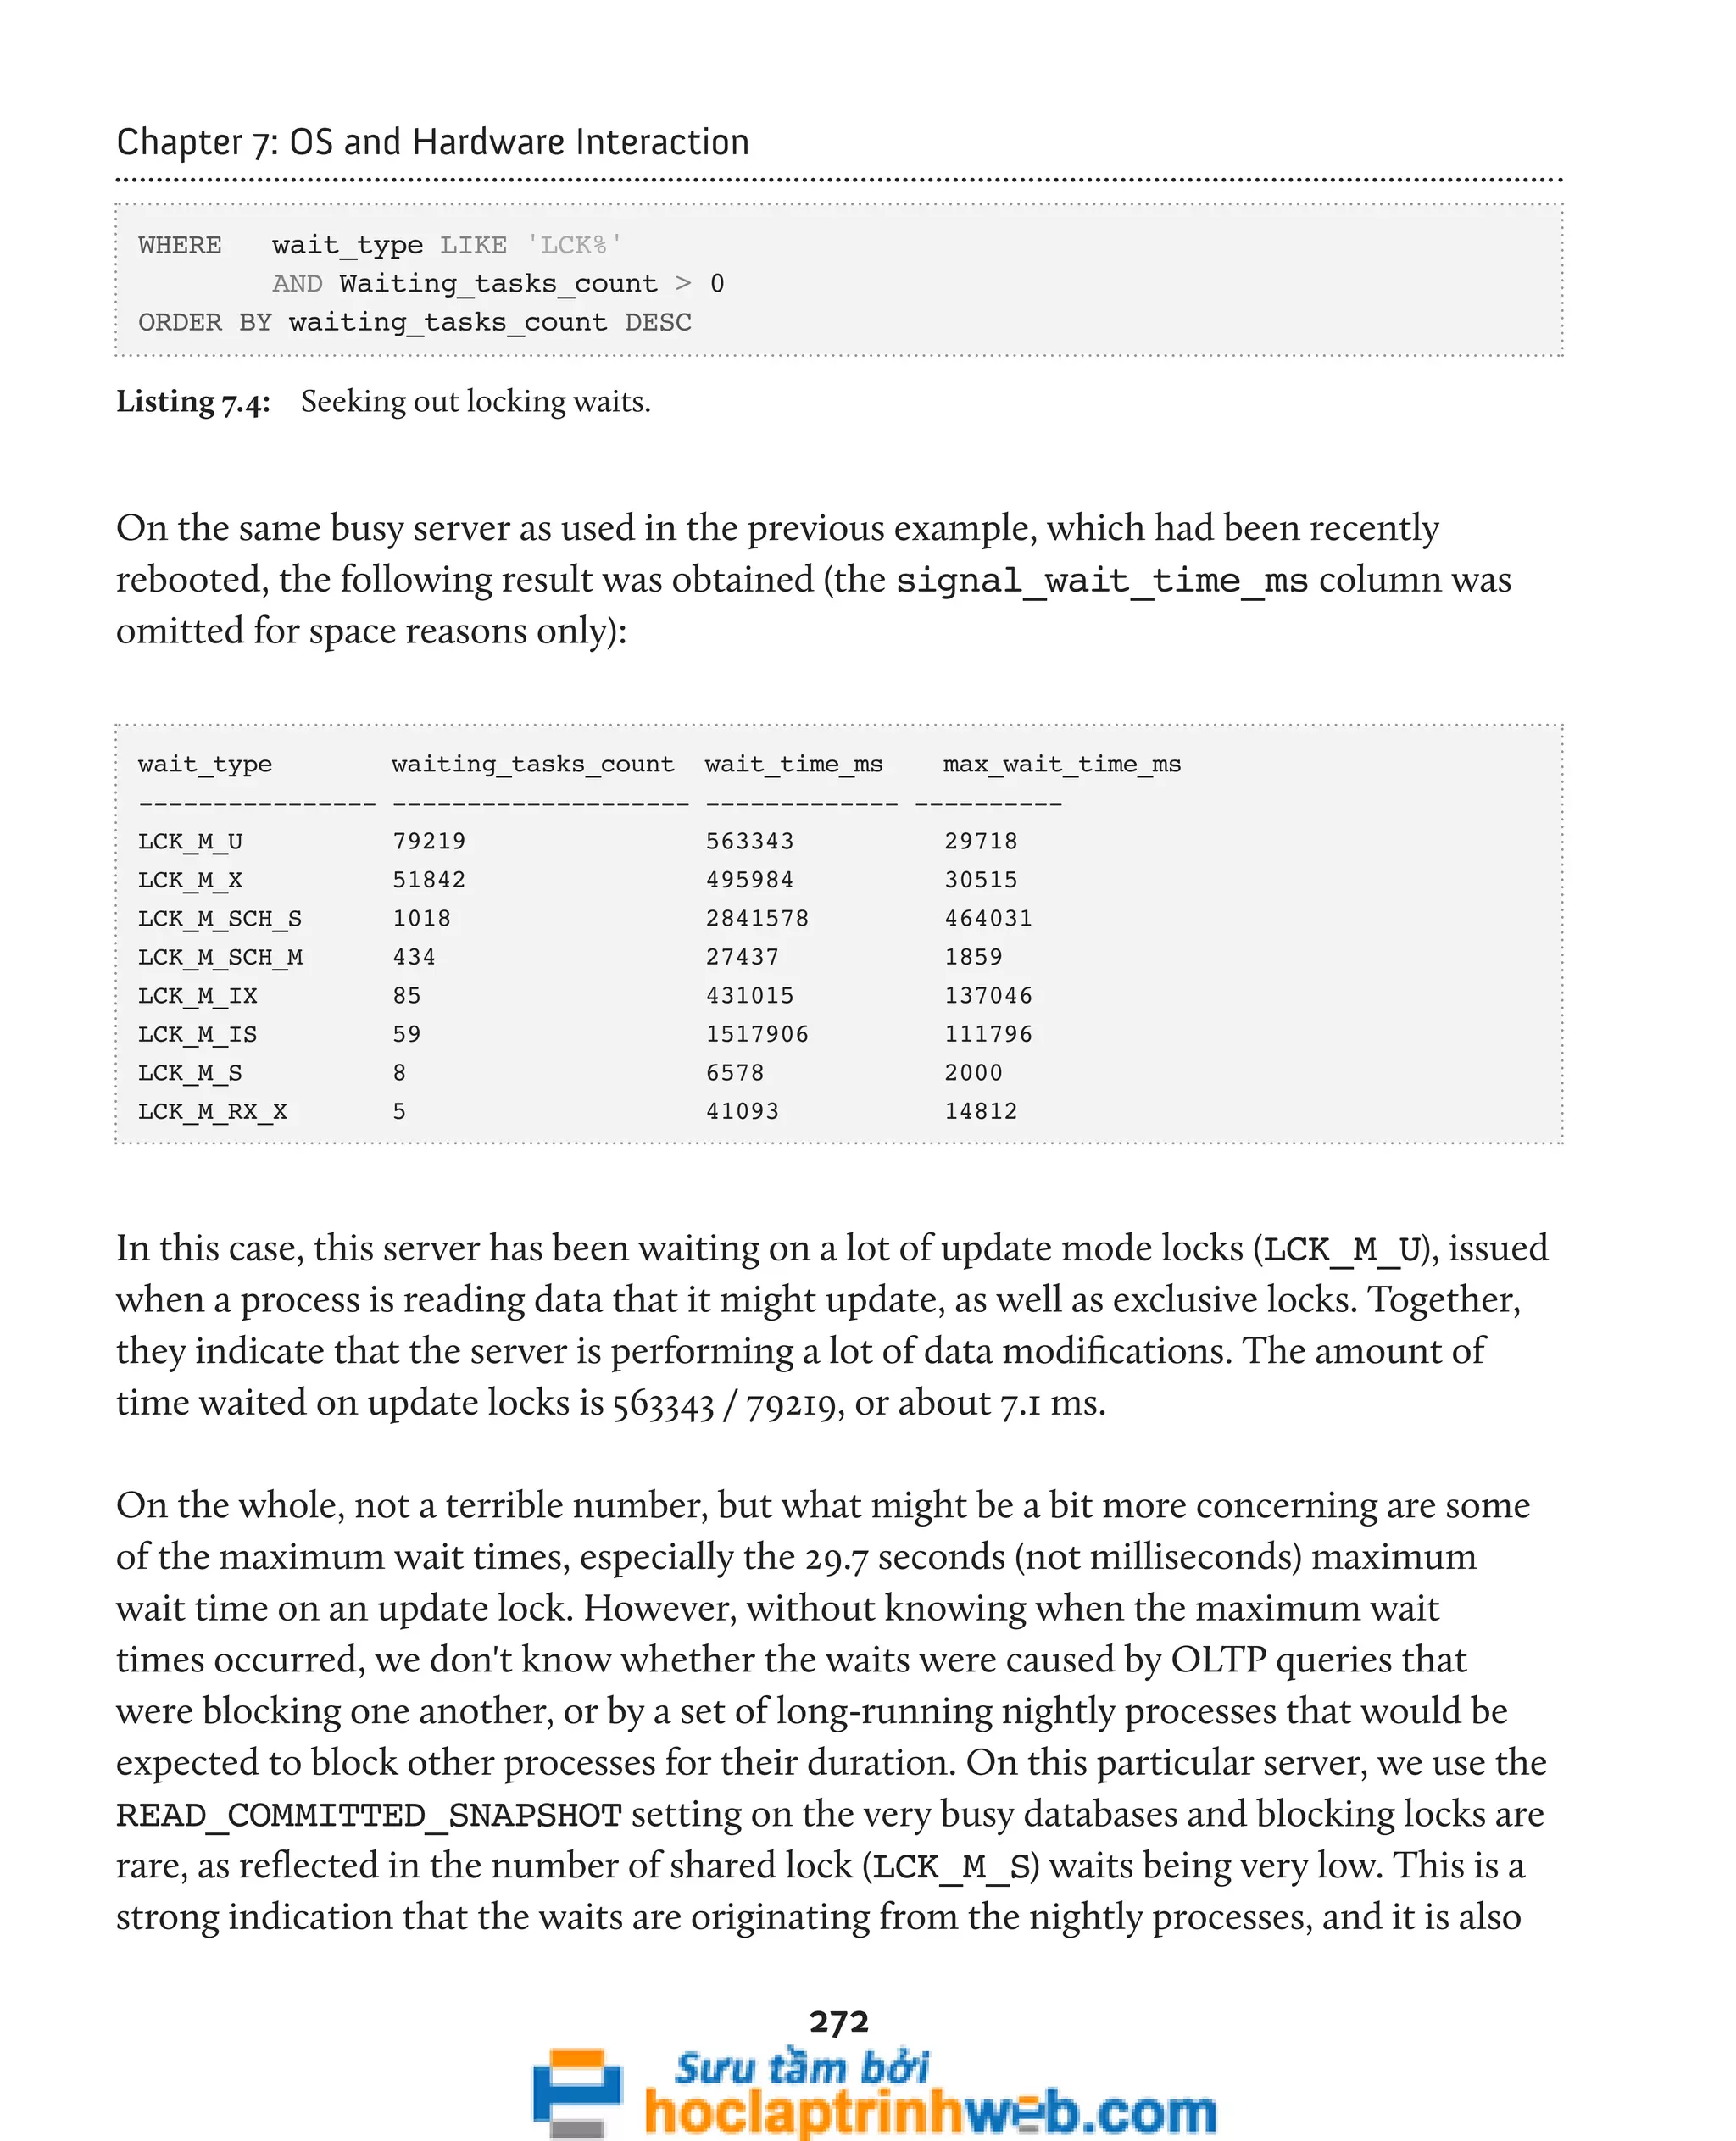
![273
Chapter 7: OS and Hardware Interaction
a good reminder that, like almost every reading we get from the DMVs, these wait times
must be taken in the context of the server configuration. The next step would be to run
traces on operations that last 20 seconds or more during those times when the longest
waits were happening, and start to find out whether or not there really is a problem.
Session-by-session wait times
The difficulty in pulling the fine detail out of a vast set of cumulative statistics, across all sessions,
highlights how useful it would be to be able to track wait times on a session-by-session basis. In this way,
we'd be able to see exactly what waits were occurring during normal OLTP operation, and exactly what
was happening while sessions running the nightly processes were under way. Hopefully, the pioneering
work in this regard by the likes of Mario Broodbakker (http://www.simple-talk.com/author/mario-broodbakker/)
will eventually make its way into SQL Server.
Ideally, we need to clear the statistics using the aforementioned DBCC SQLPERF
command, take a baseline reading and then take periodic snapshots of the data so that
we can accurately compare the data over a time period.
Investigating CPU pressure
The simple query shown in Listing 7.5 calculates signal waits and resource waits as a
percentage of the overall wait time, in order to diagnose potential CPU pressure.
-- Total waits are wait_time_ms (high signal waits indicates CPU pressure)
SELECT CAST(100.0 * SUM(signal_wait_time_ms) / SUM(wait_time_ms)
AS NUMERIC(20,2)) AS [%signal (cpu) waits] ,
CAST(100.0 * SUM(wait_time_ms - signal_wait_time_ms)
/ SUM(wait_time_ms) AS NUMERIC(20, 2)) AS [%resource waits]
FROM sys.dm_os_wait_stats ;
Listing 7.5: Is there any CPU pressure?](https://image.slidesharecdn.com/ebookperformancetuningdavidsonford-141014034404-conversion-gate02/75/c-273-2048.jpg)
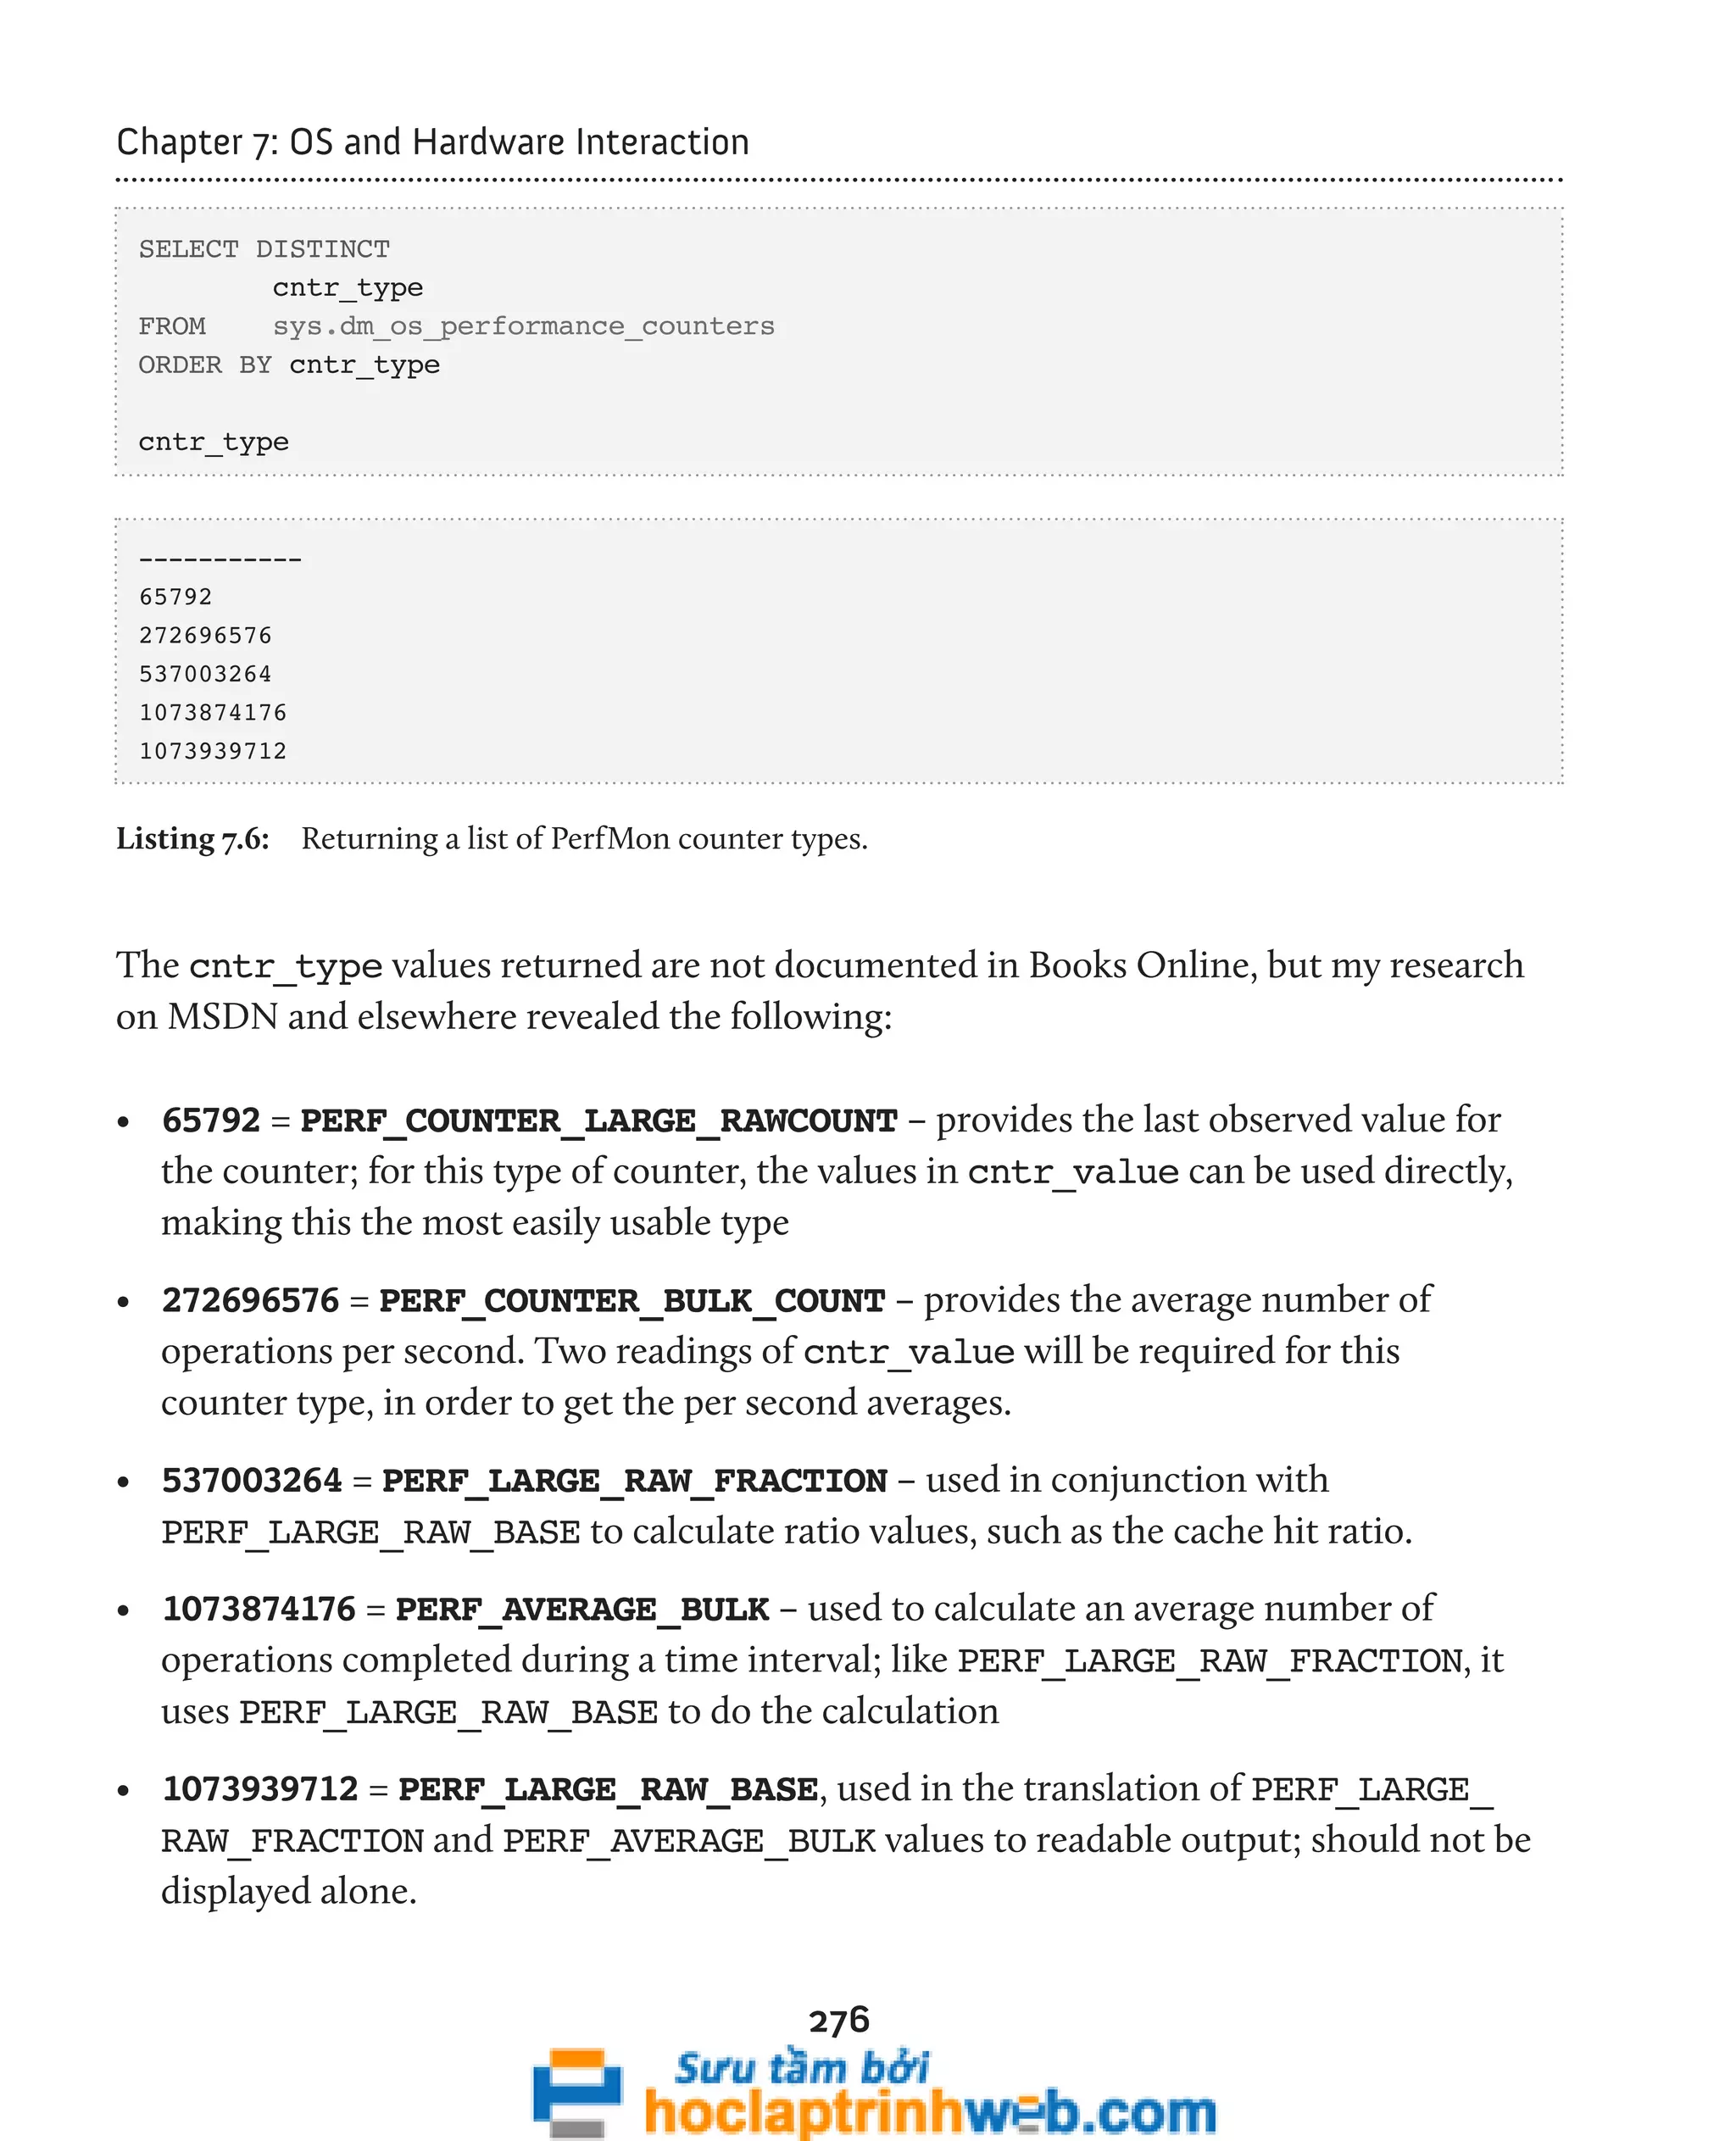
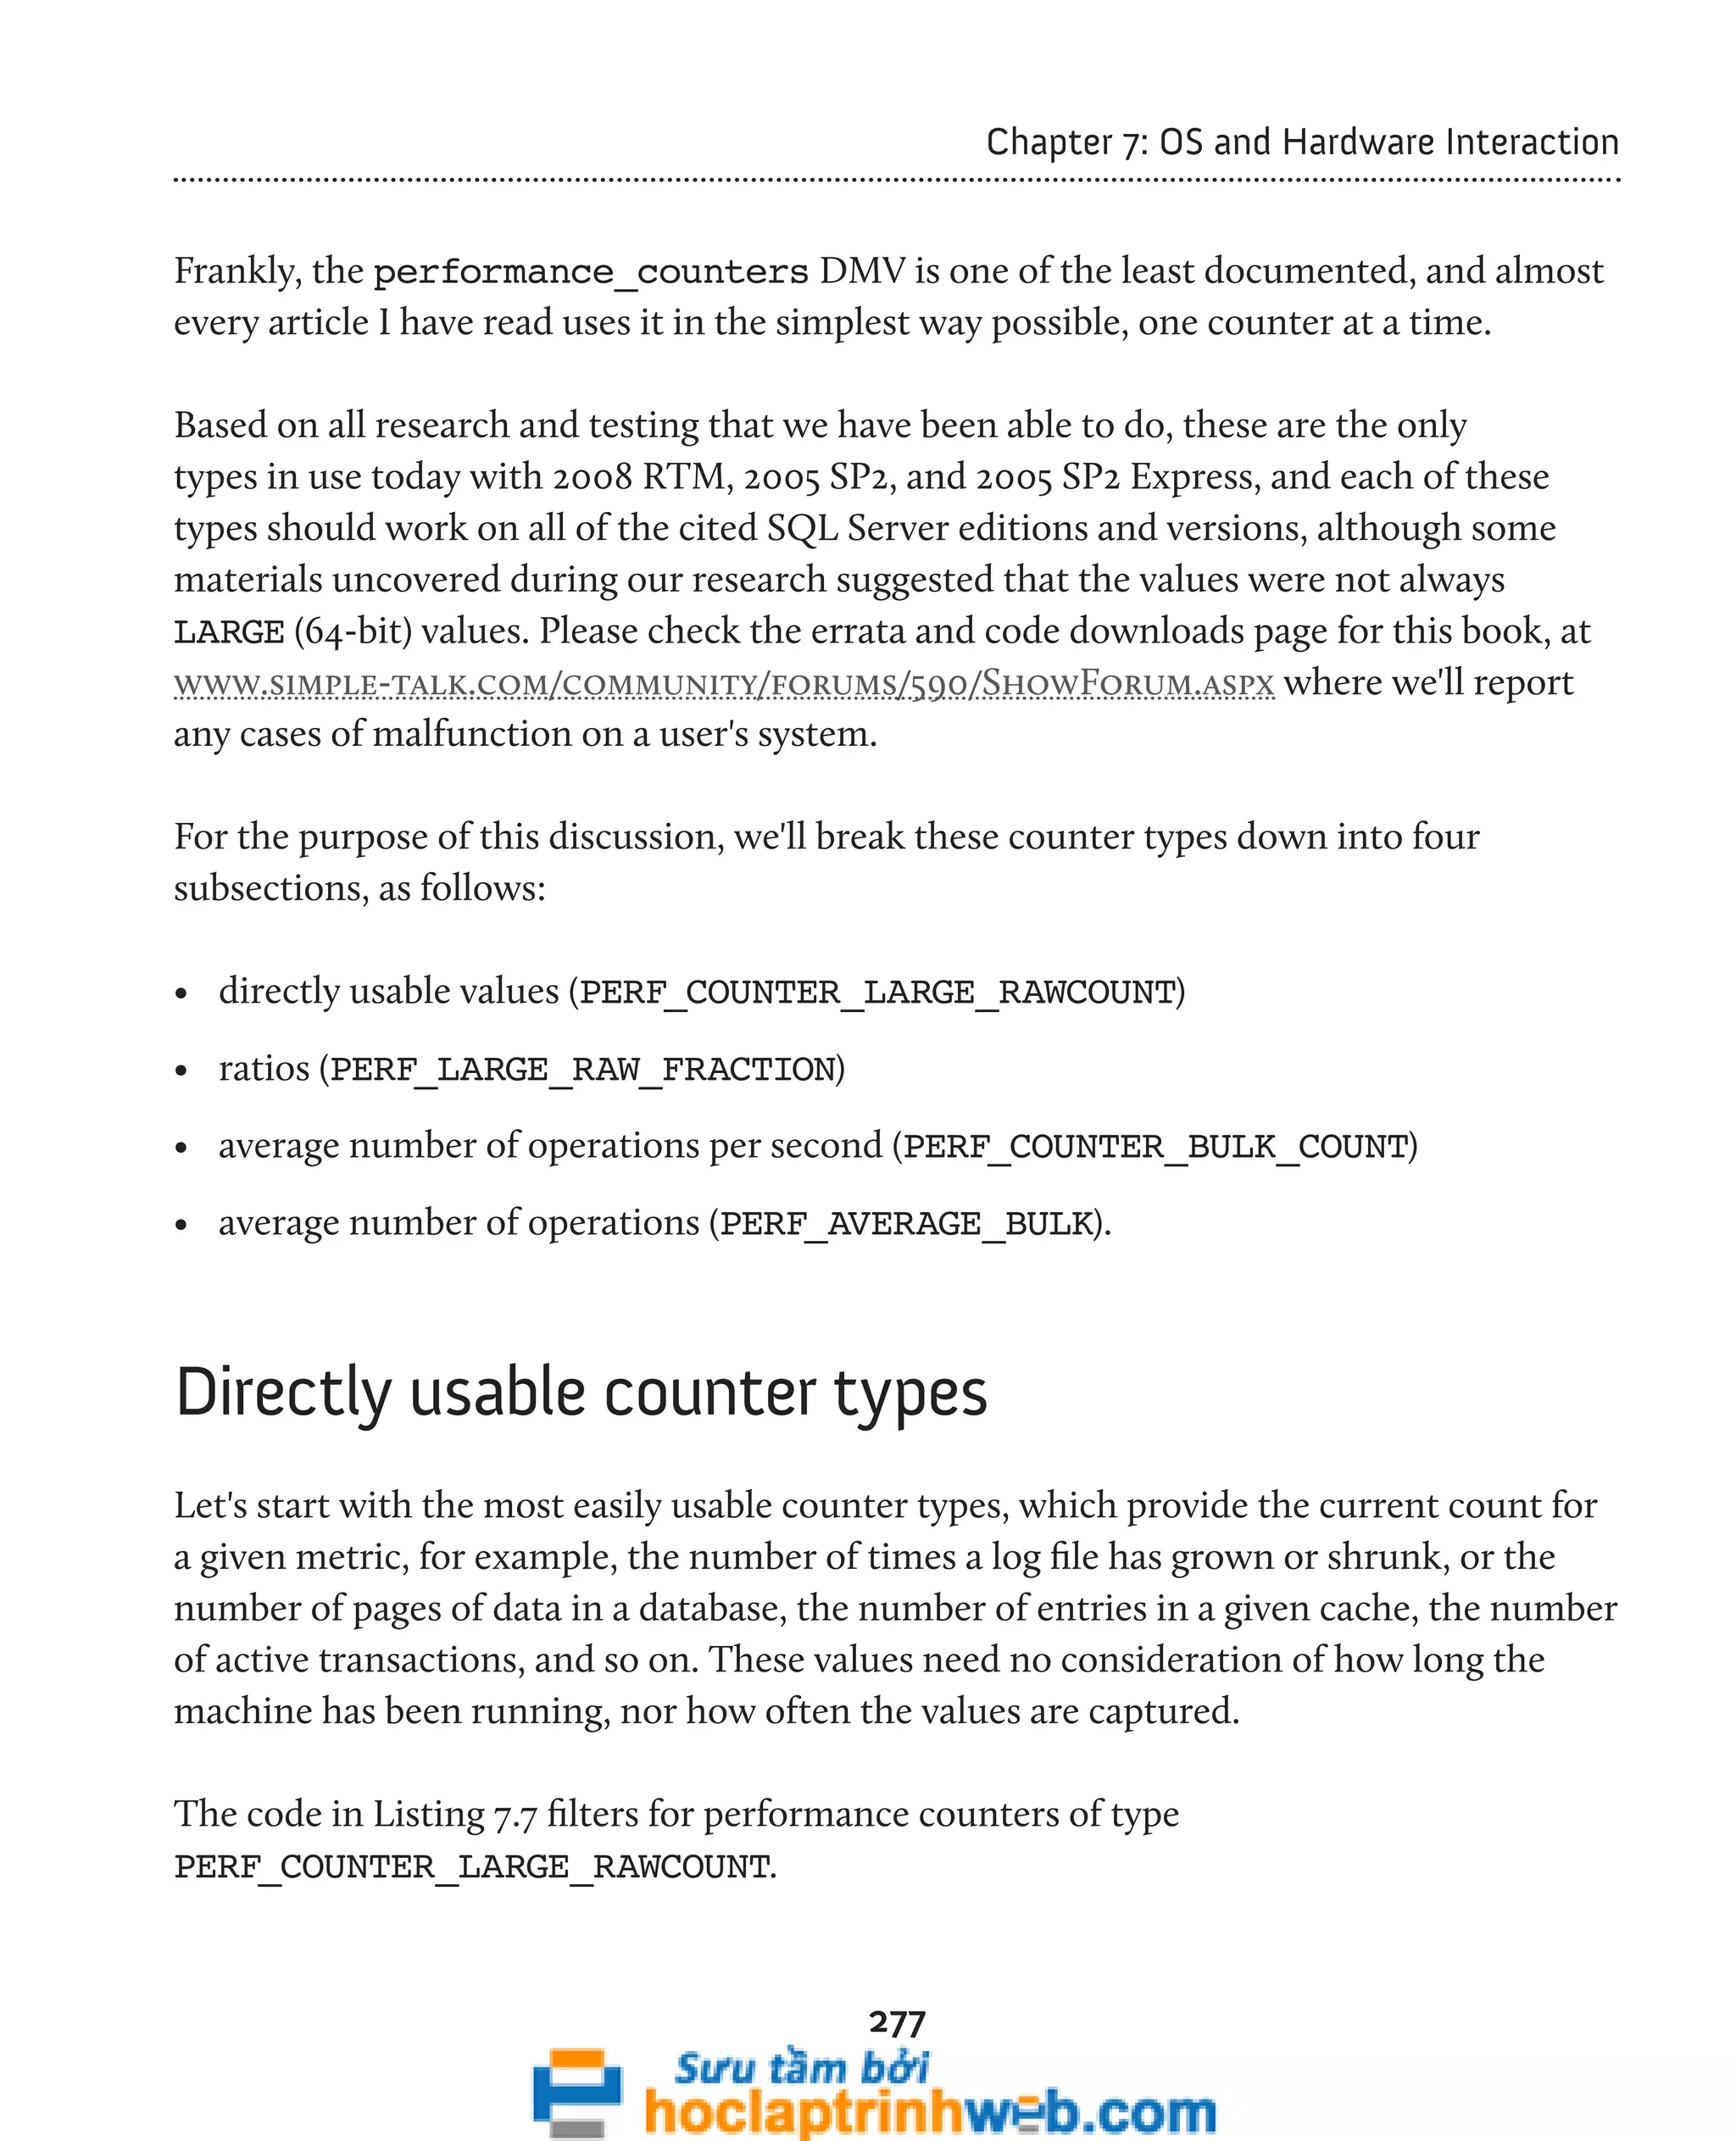
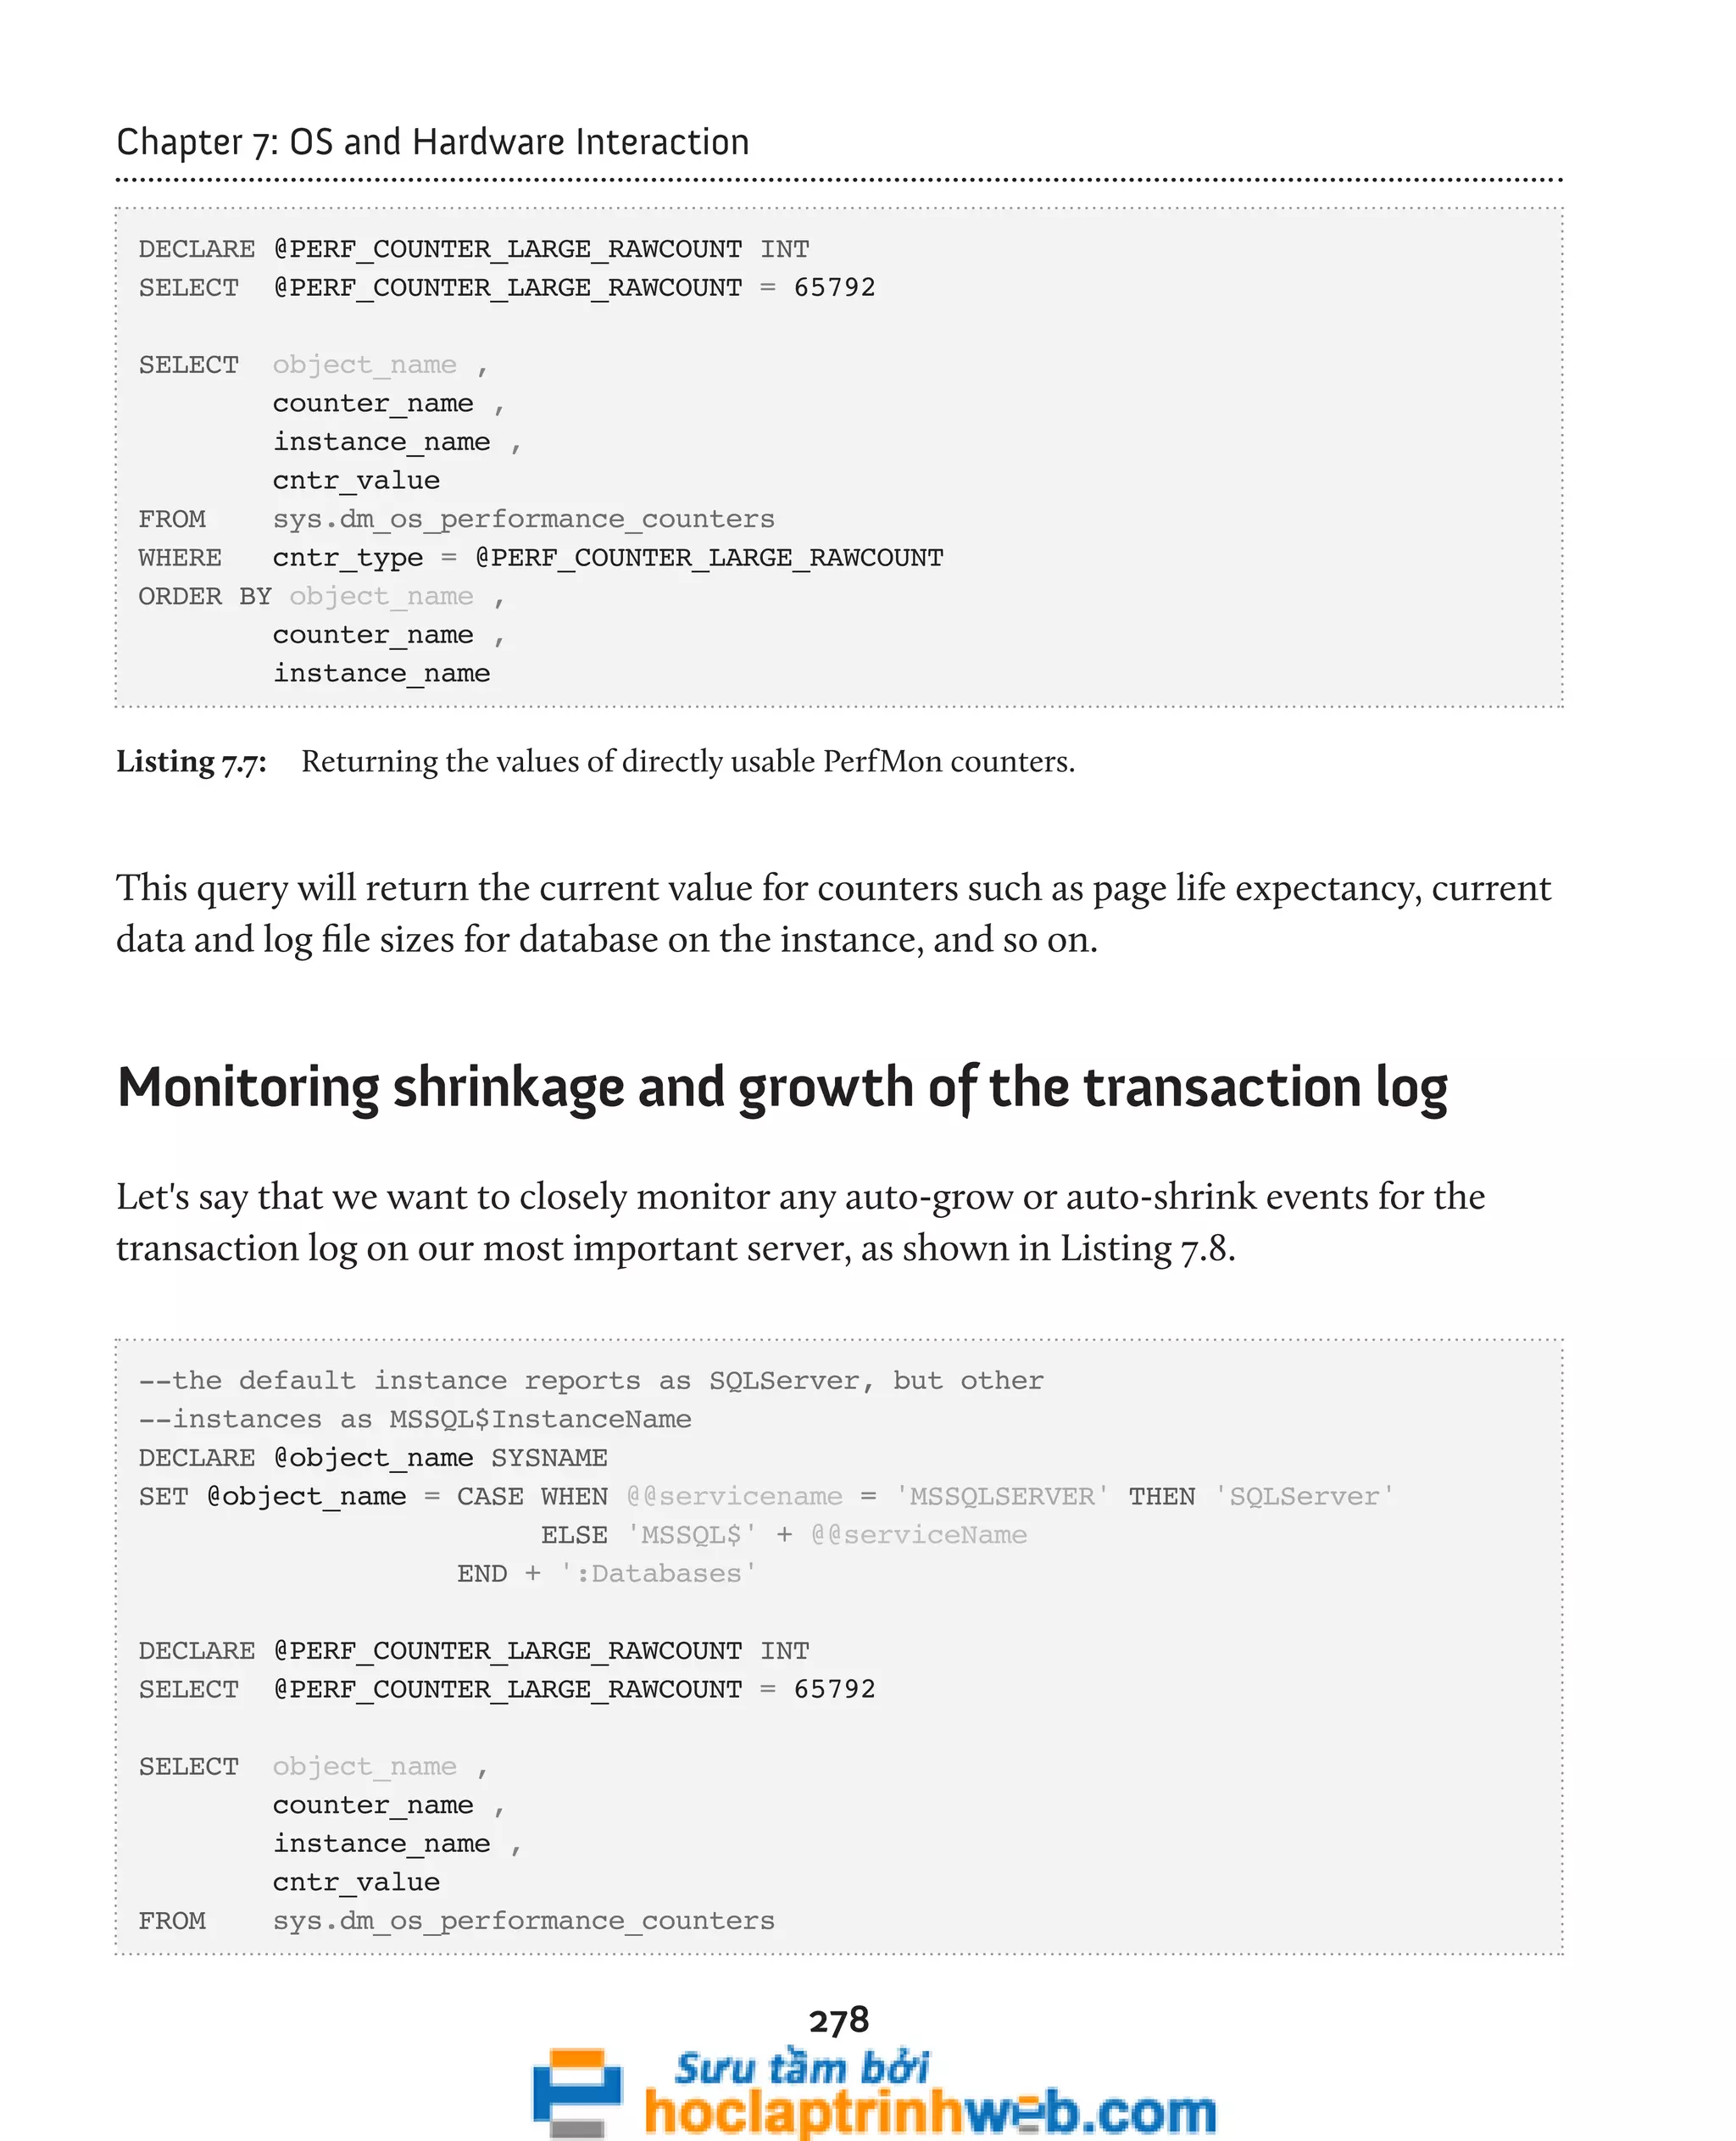
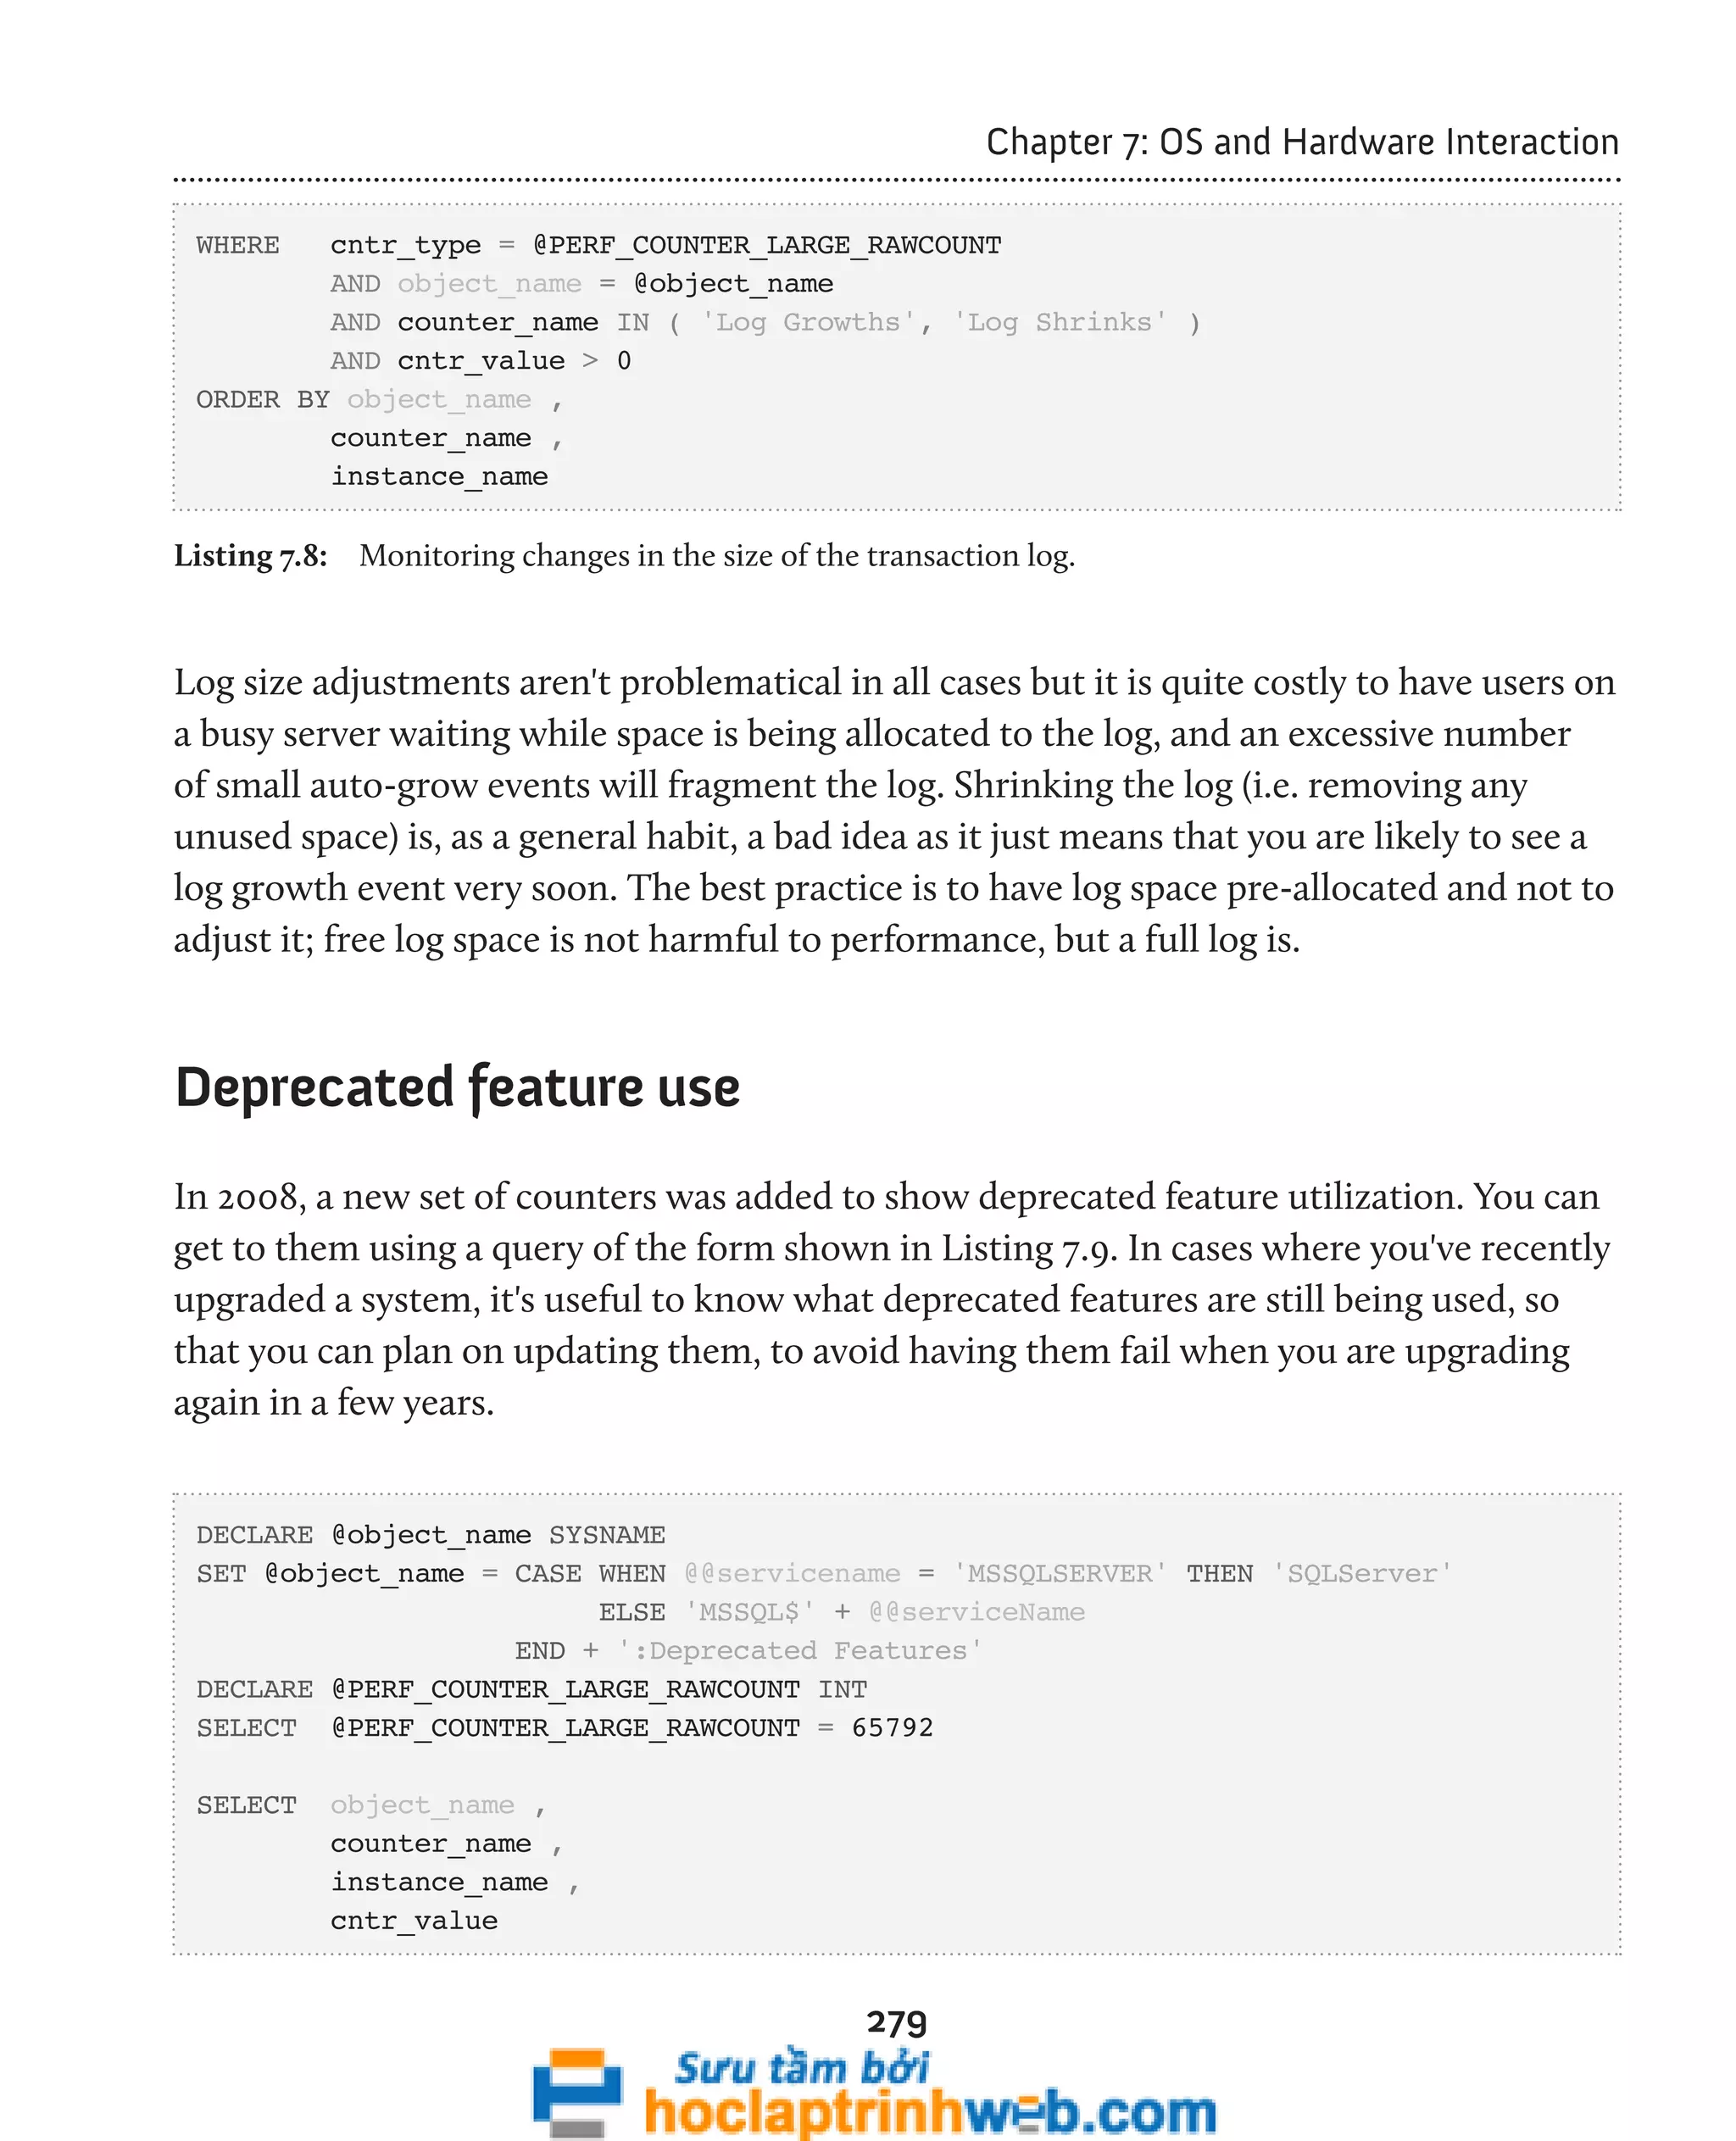
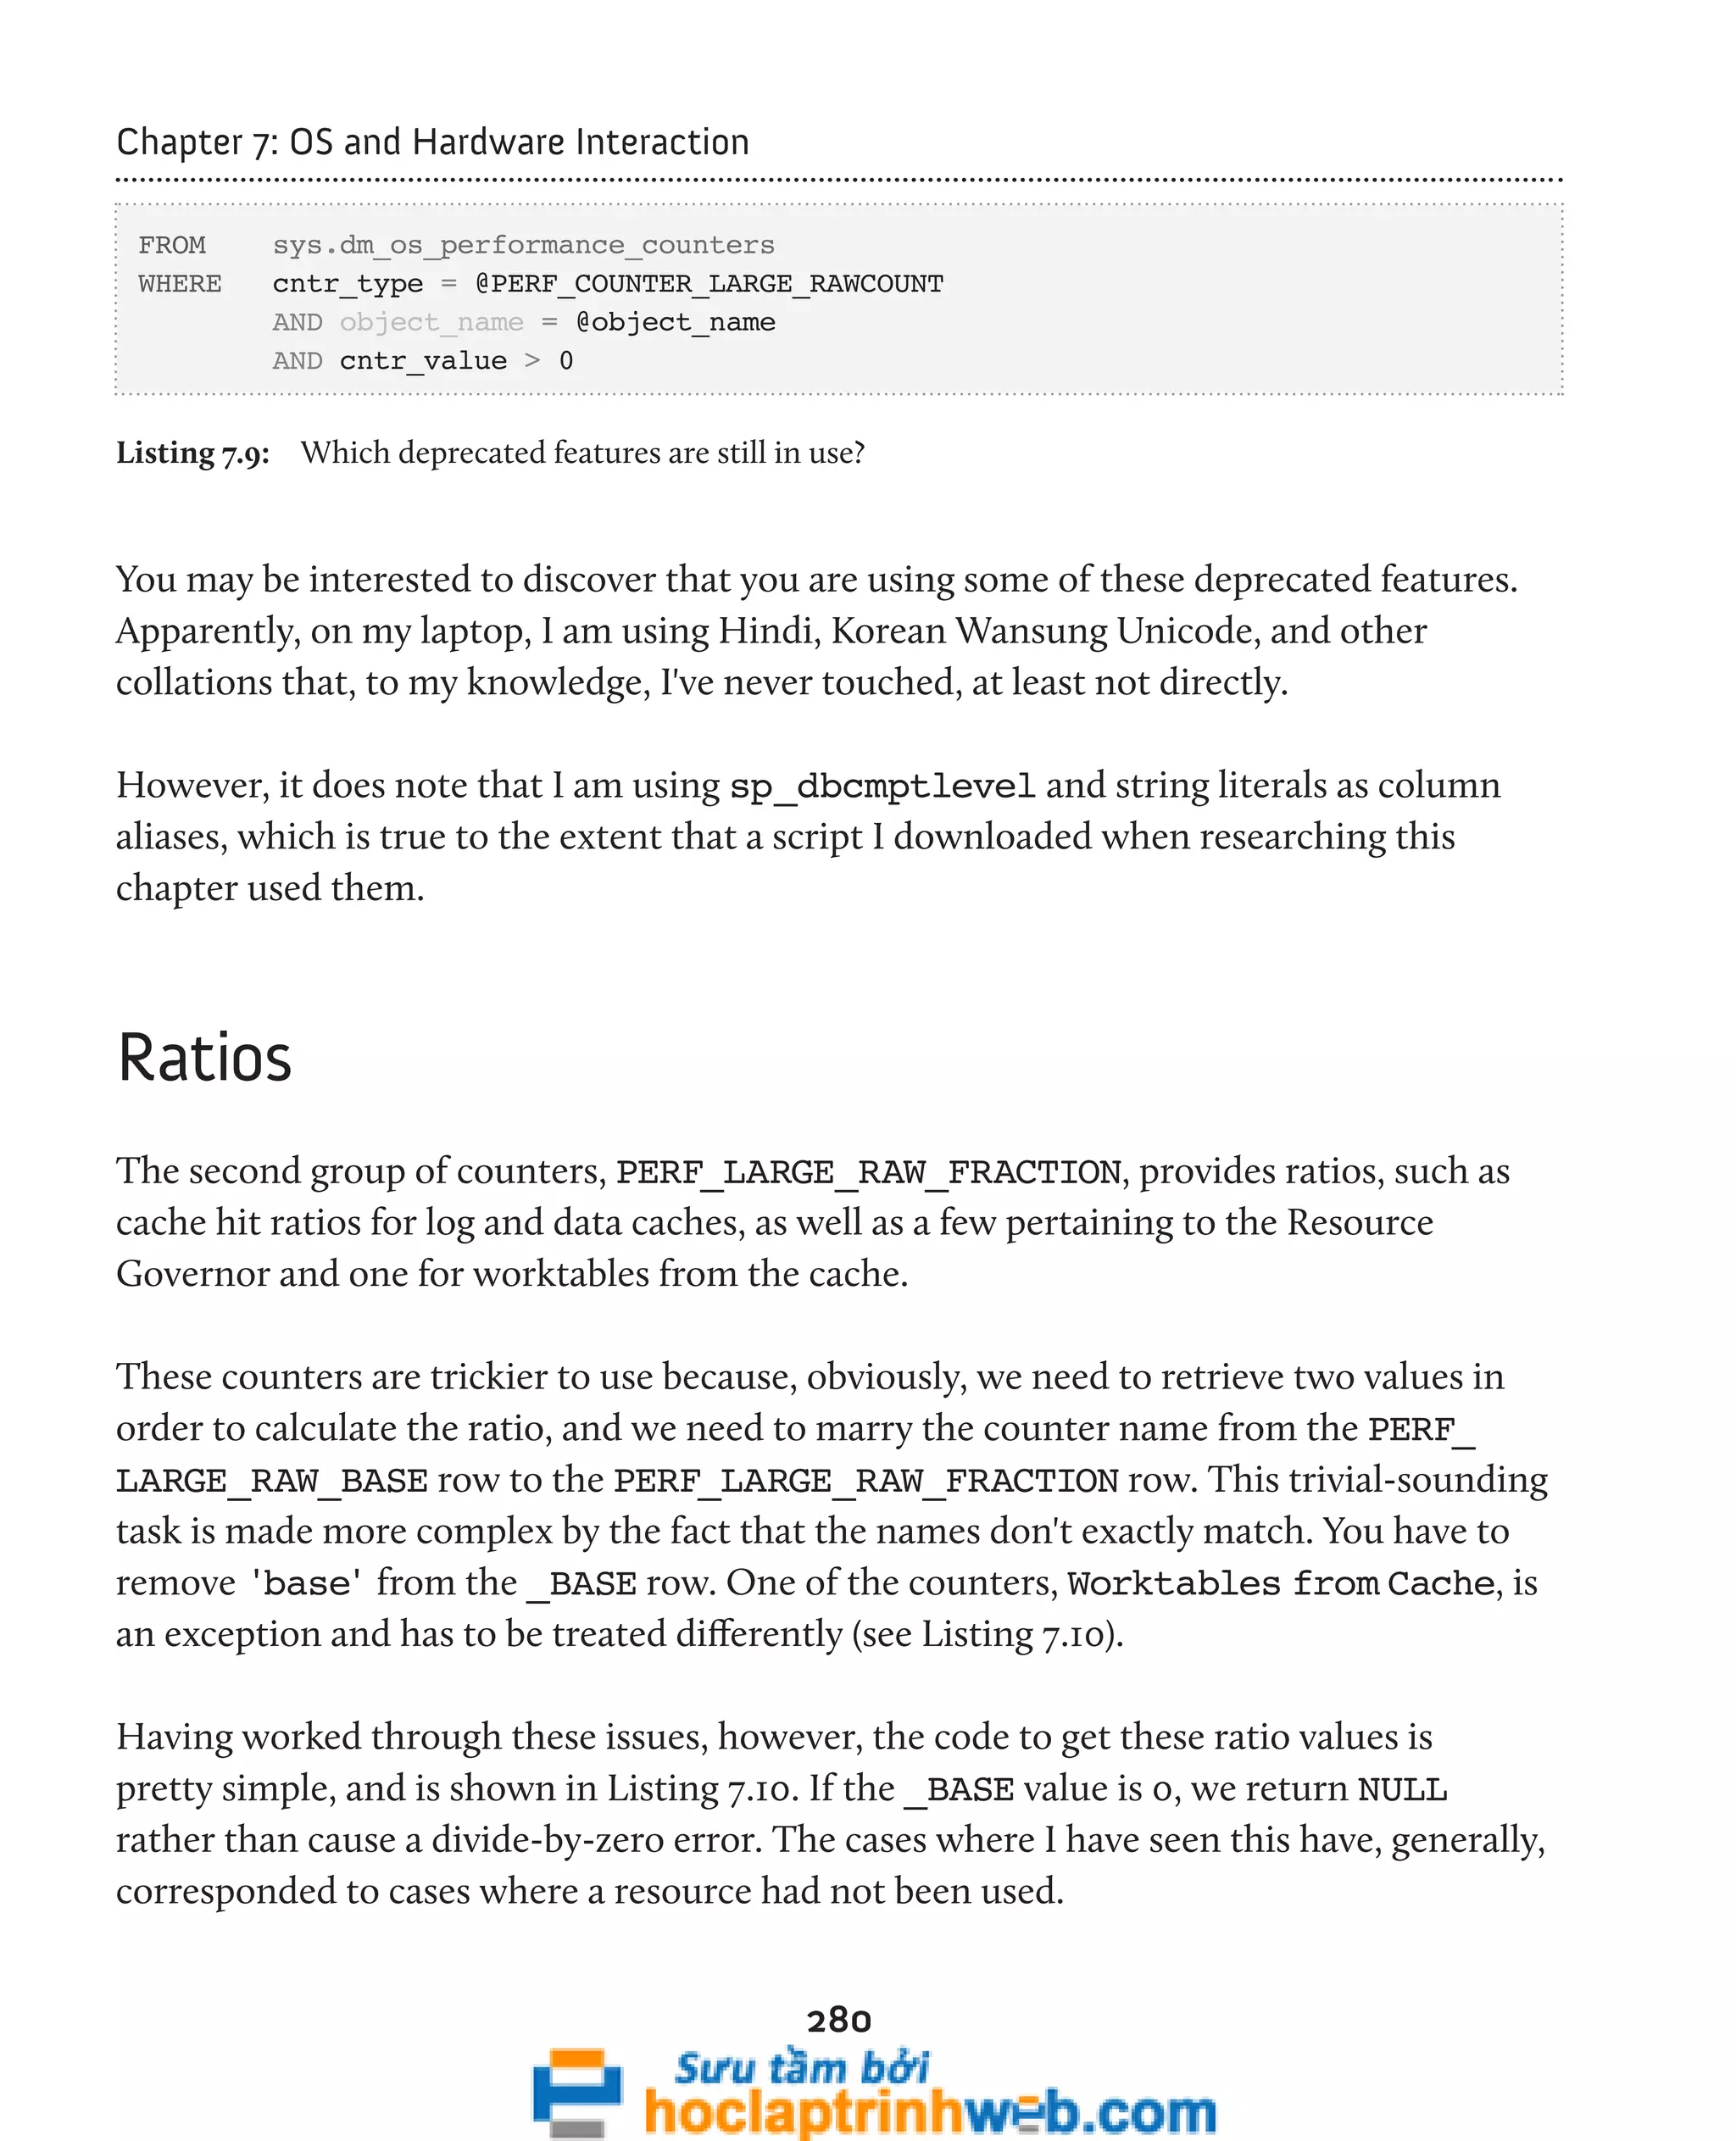
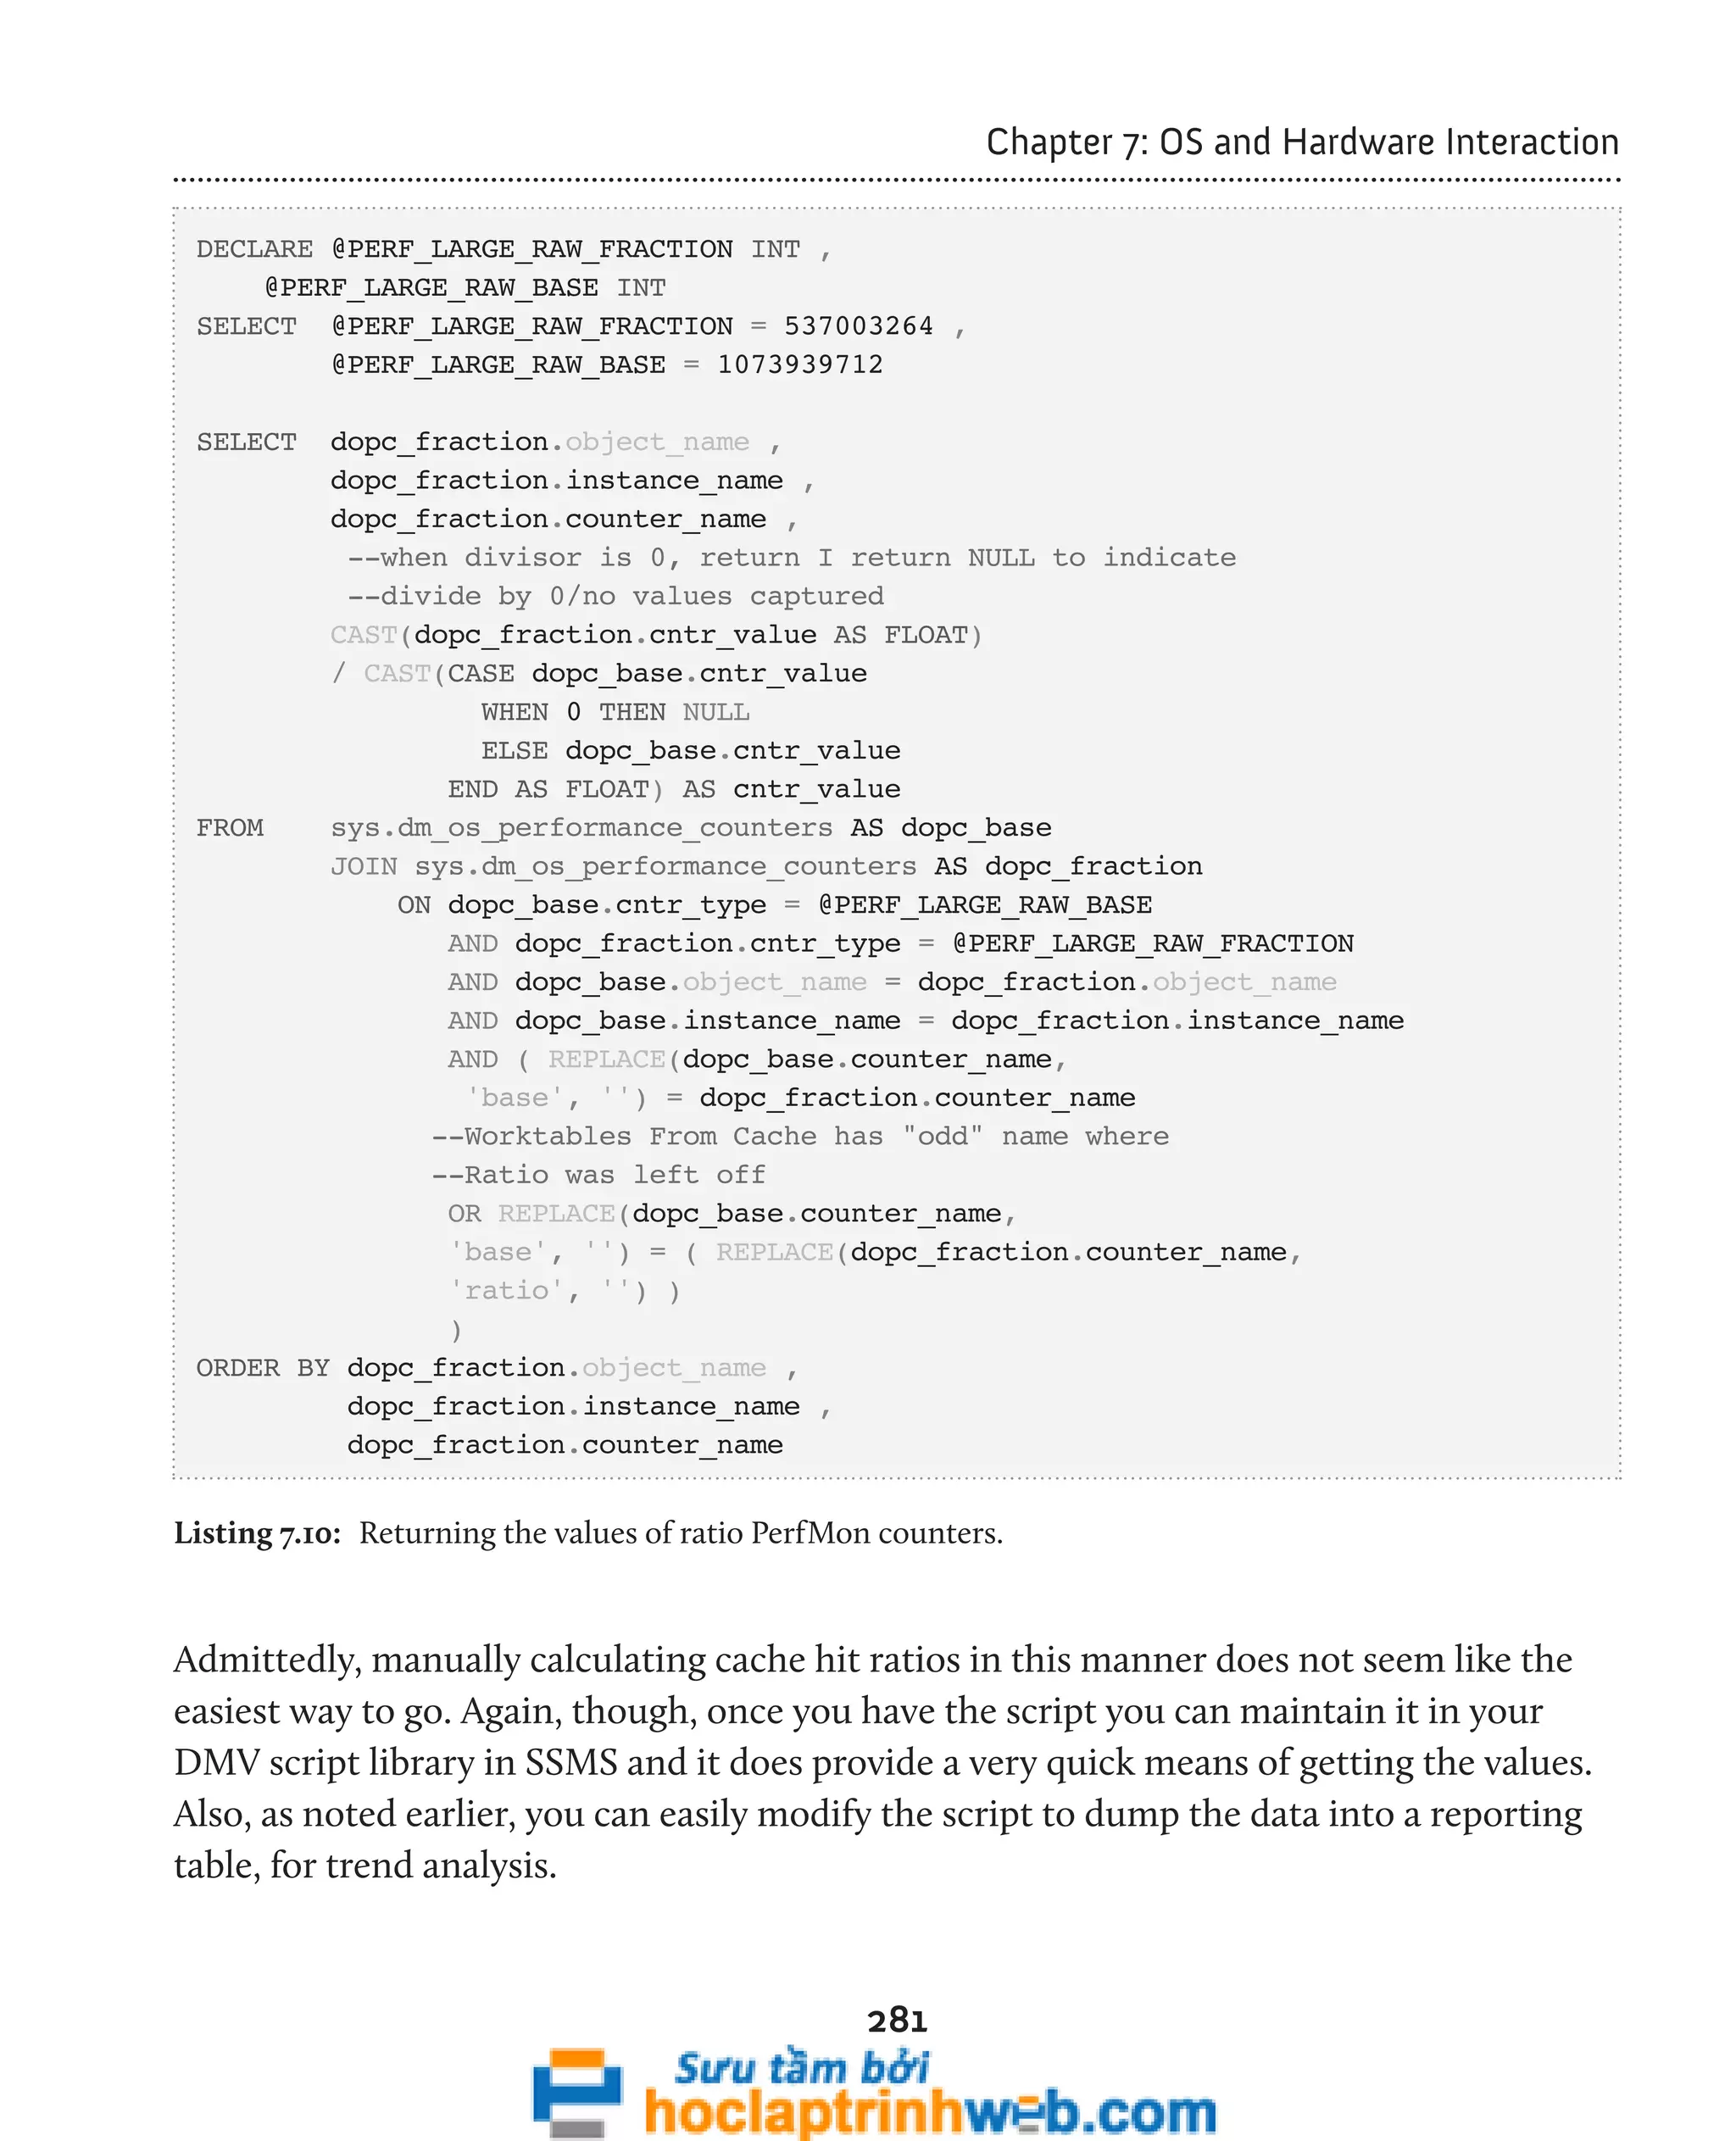
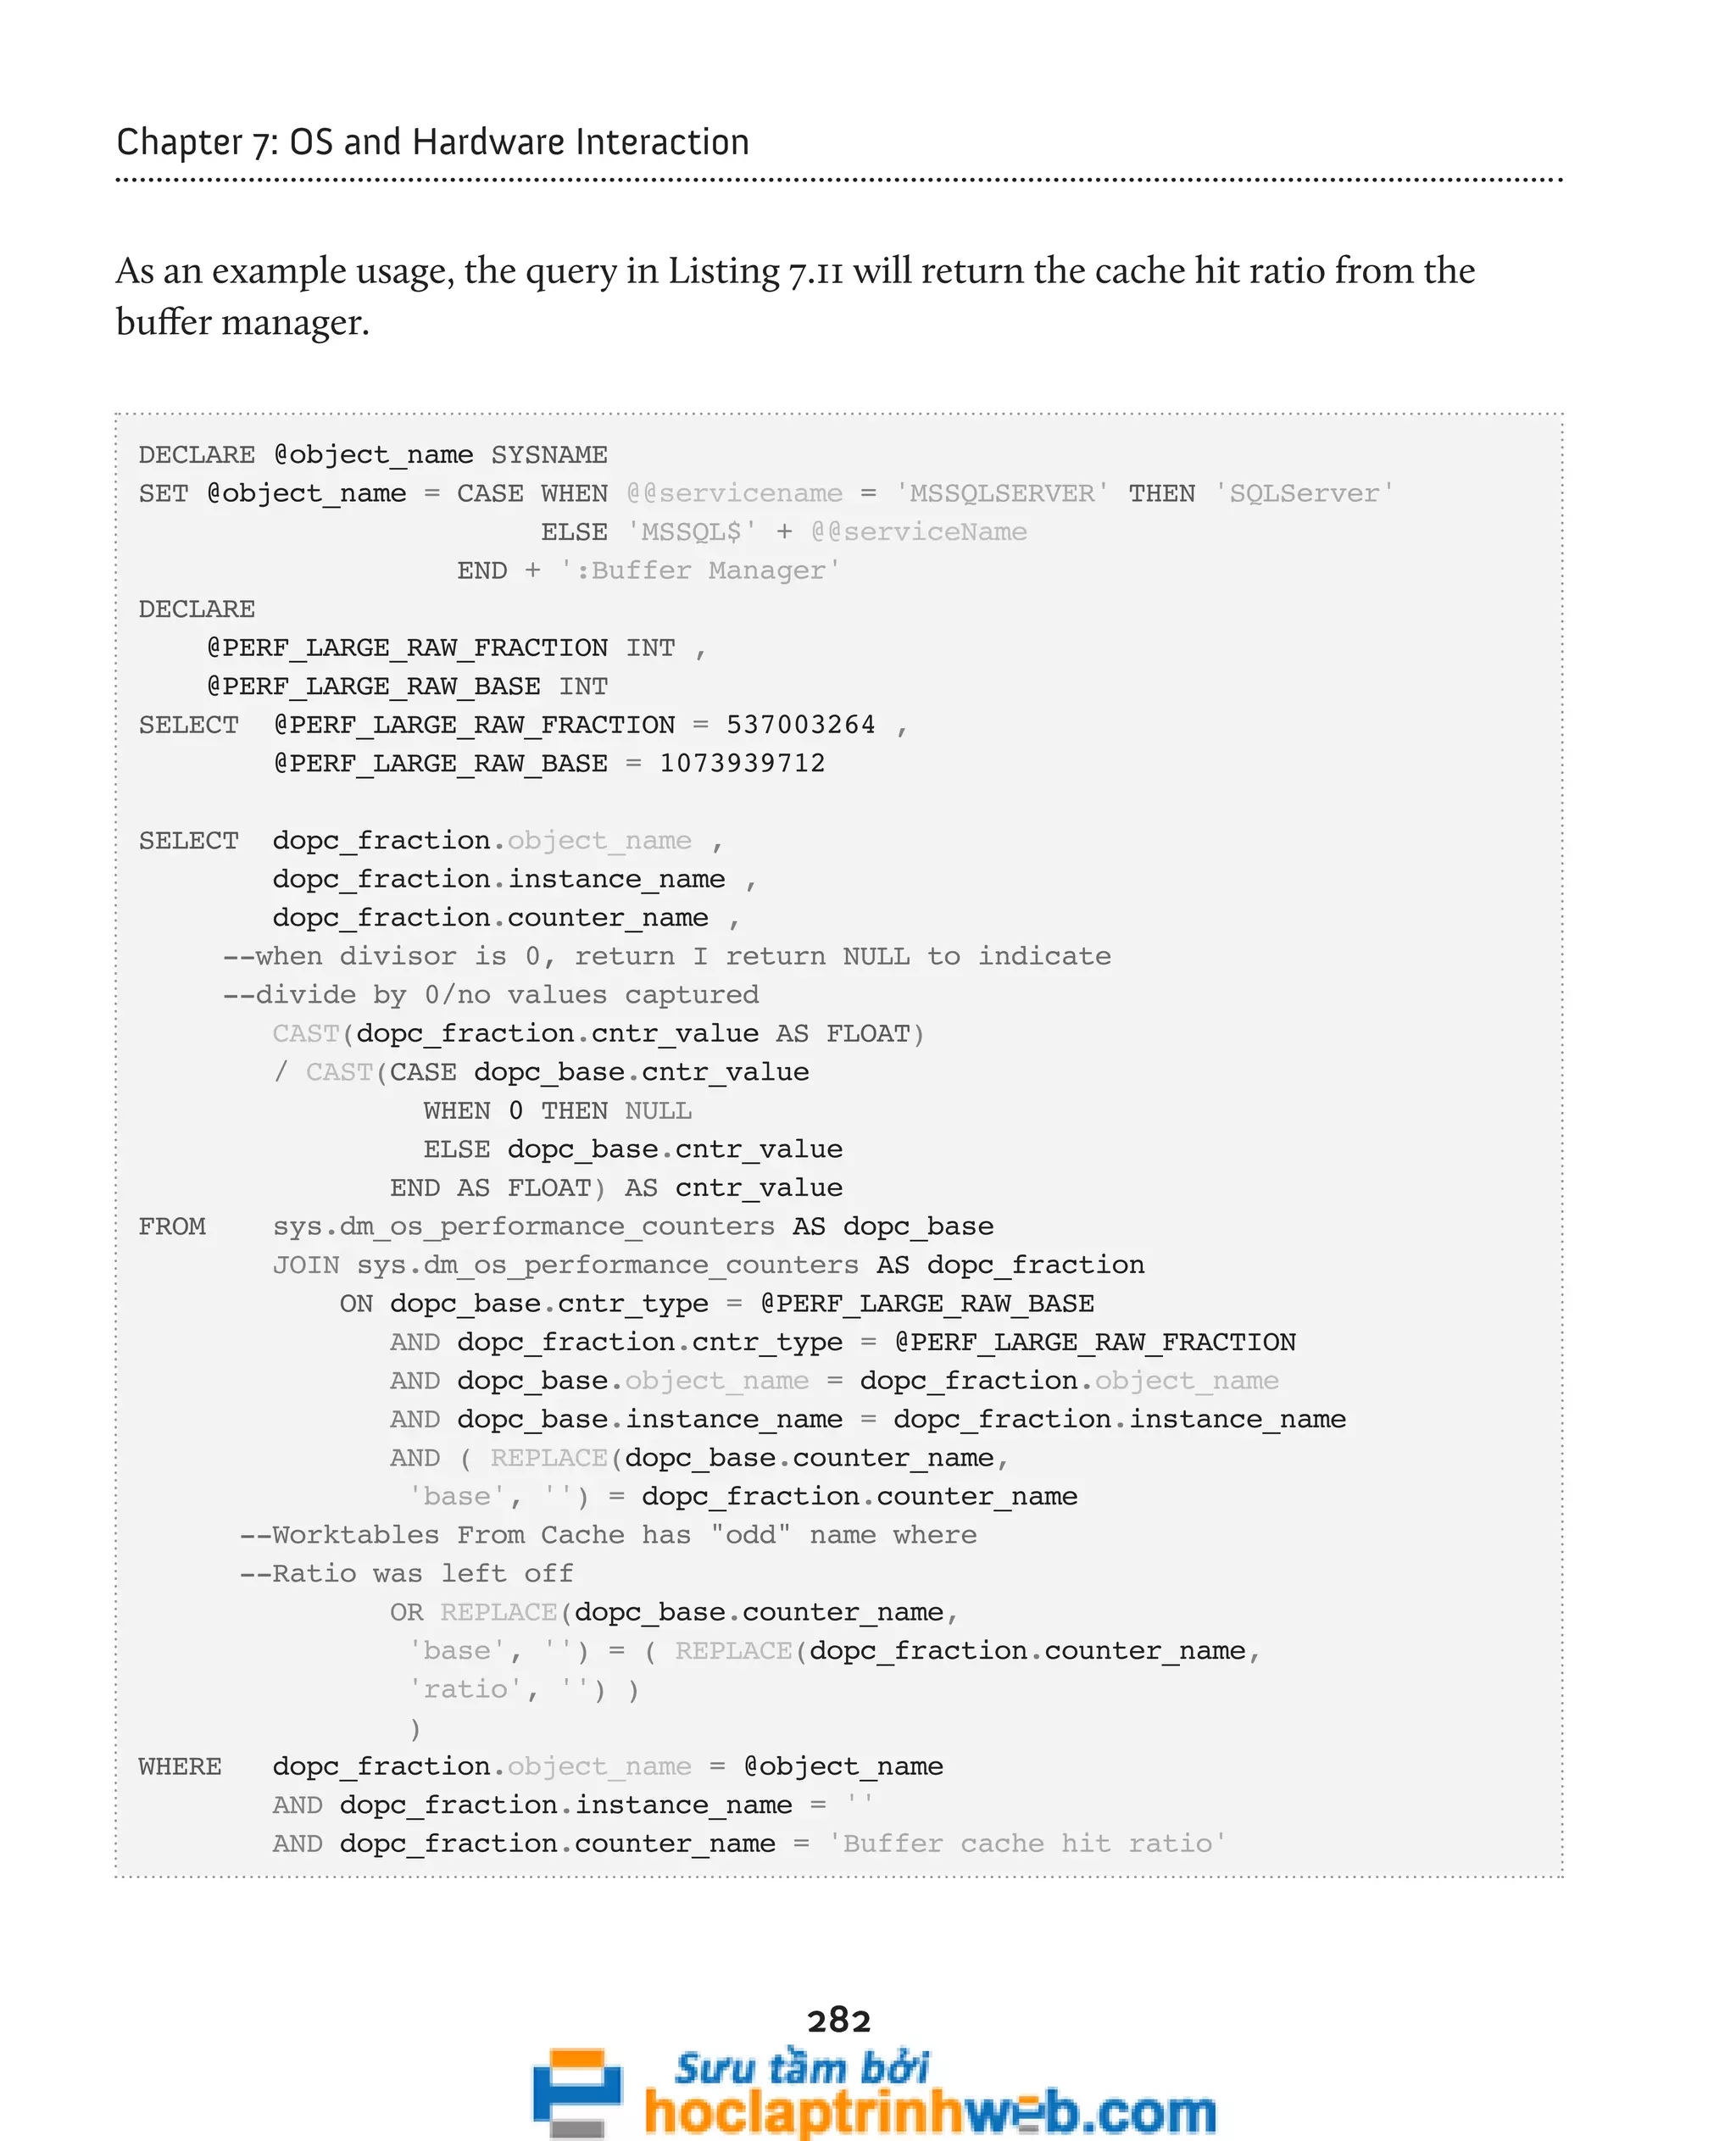
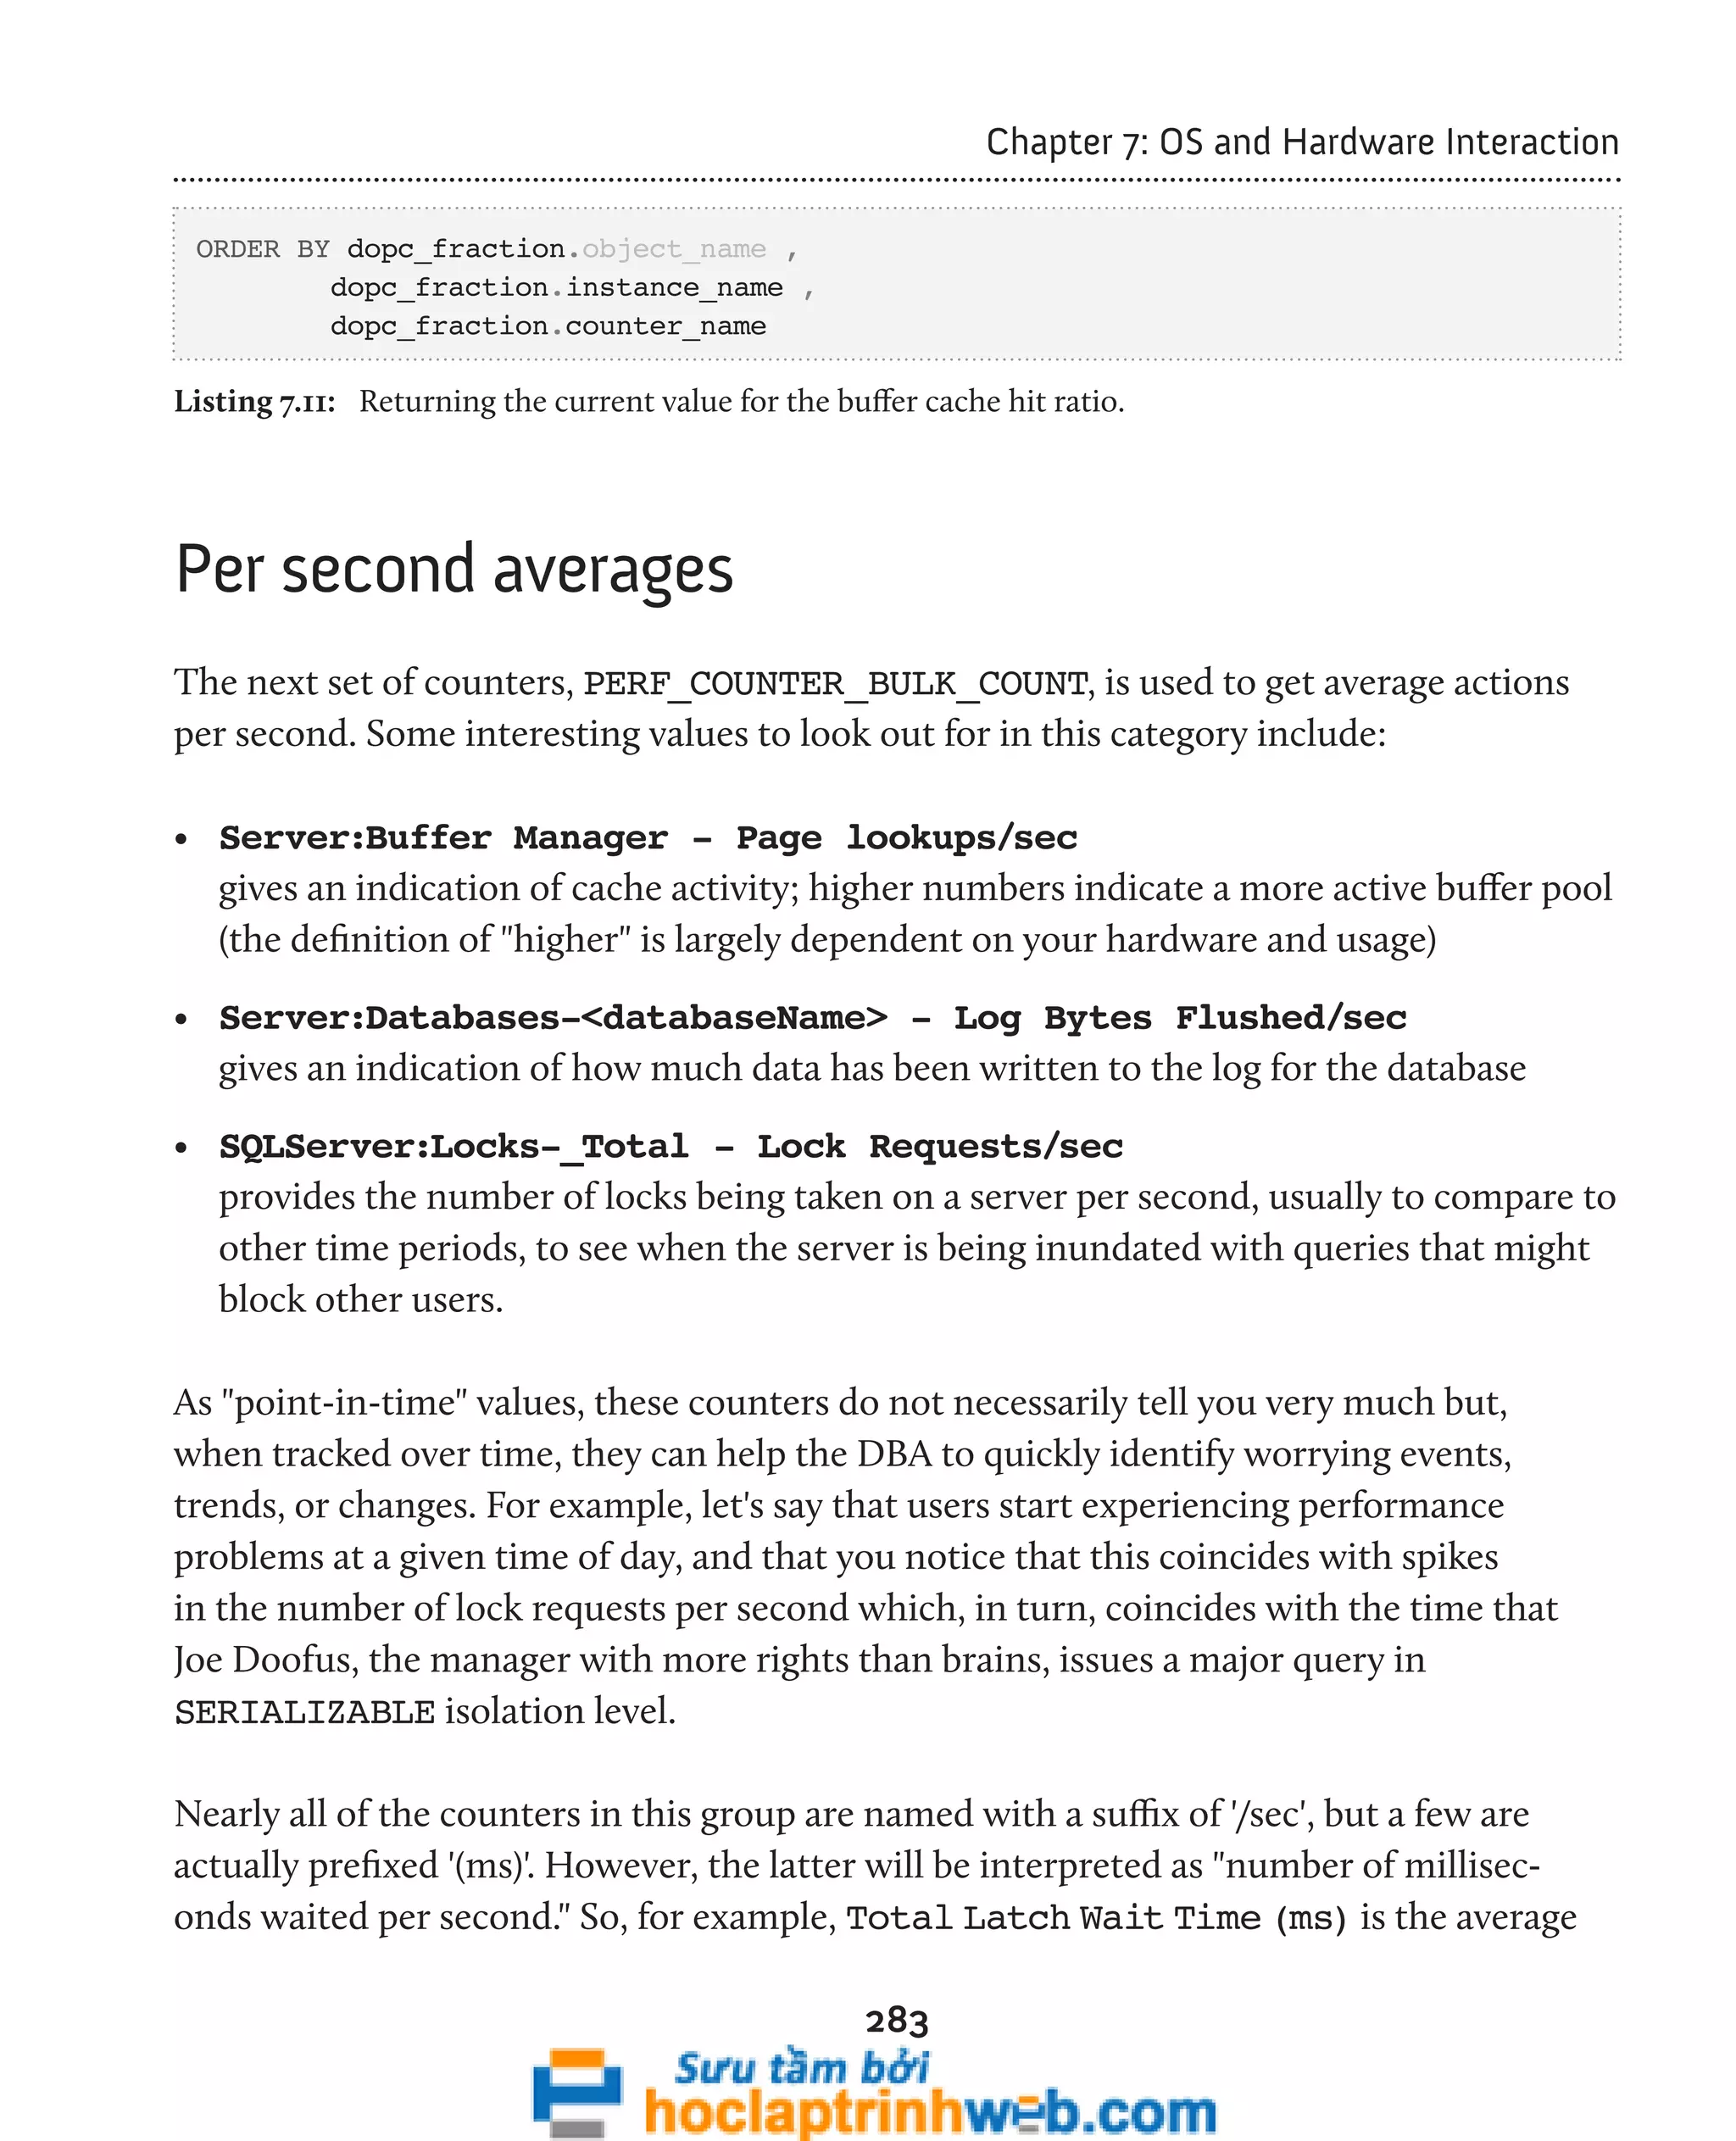
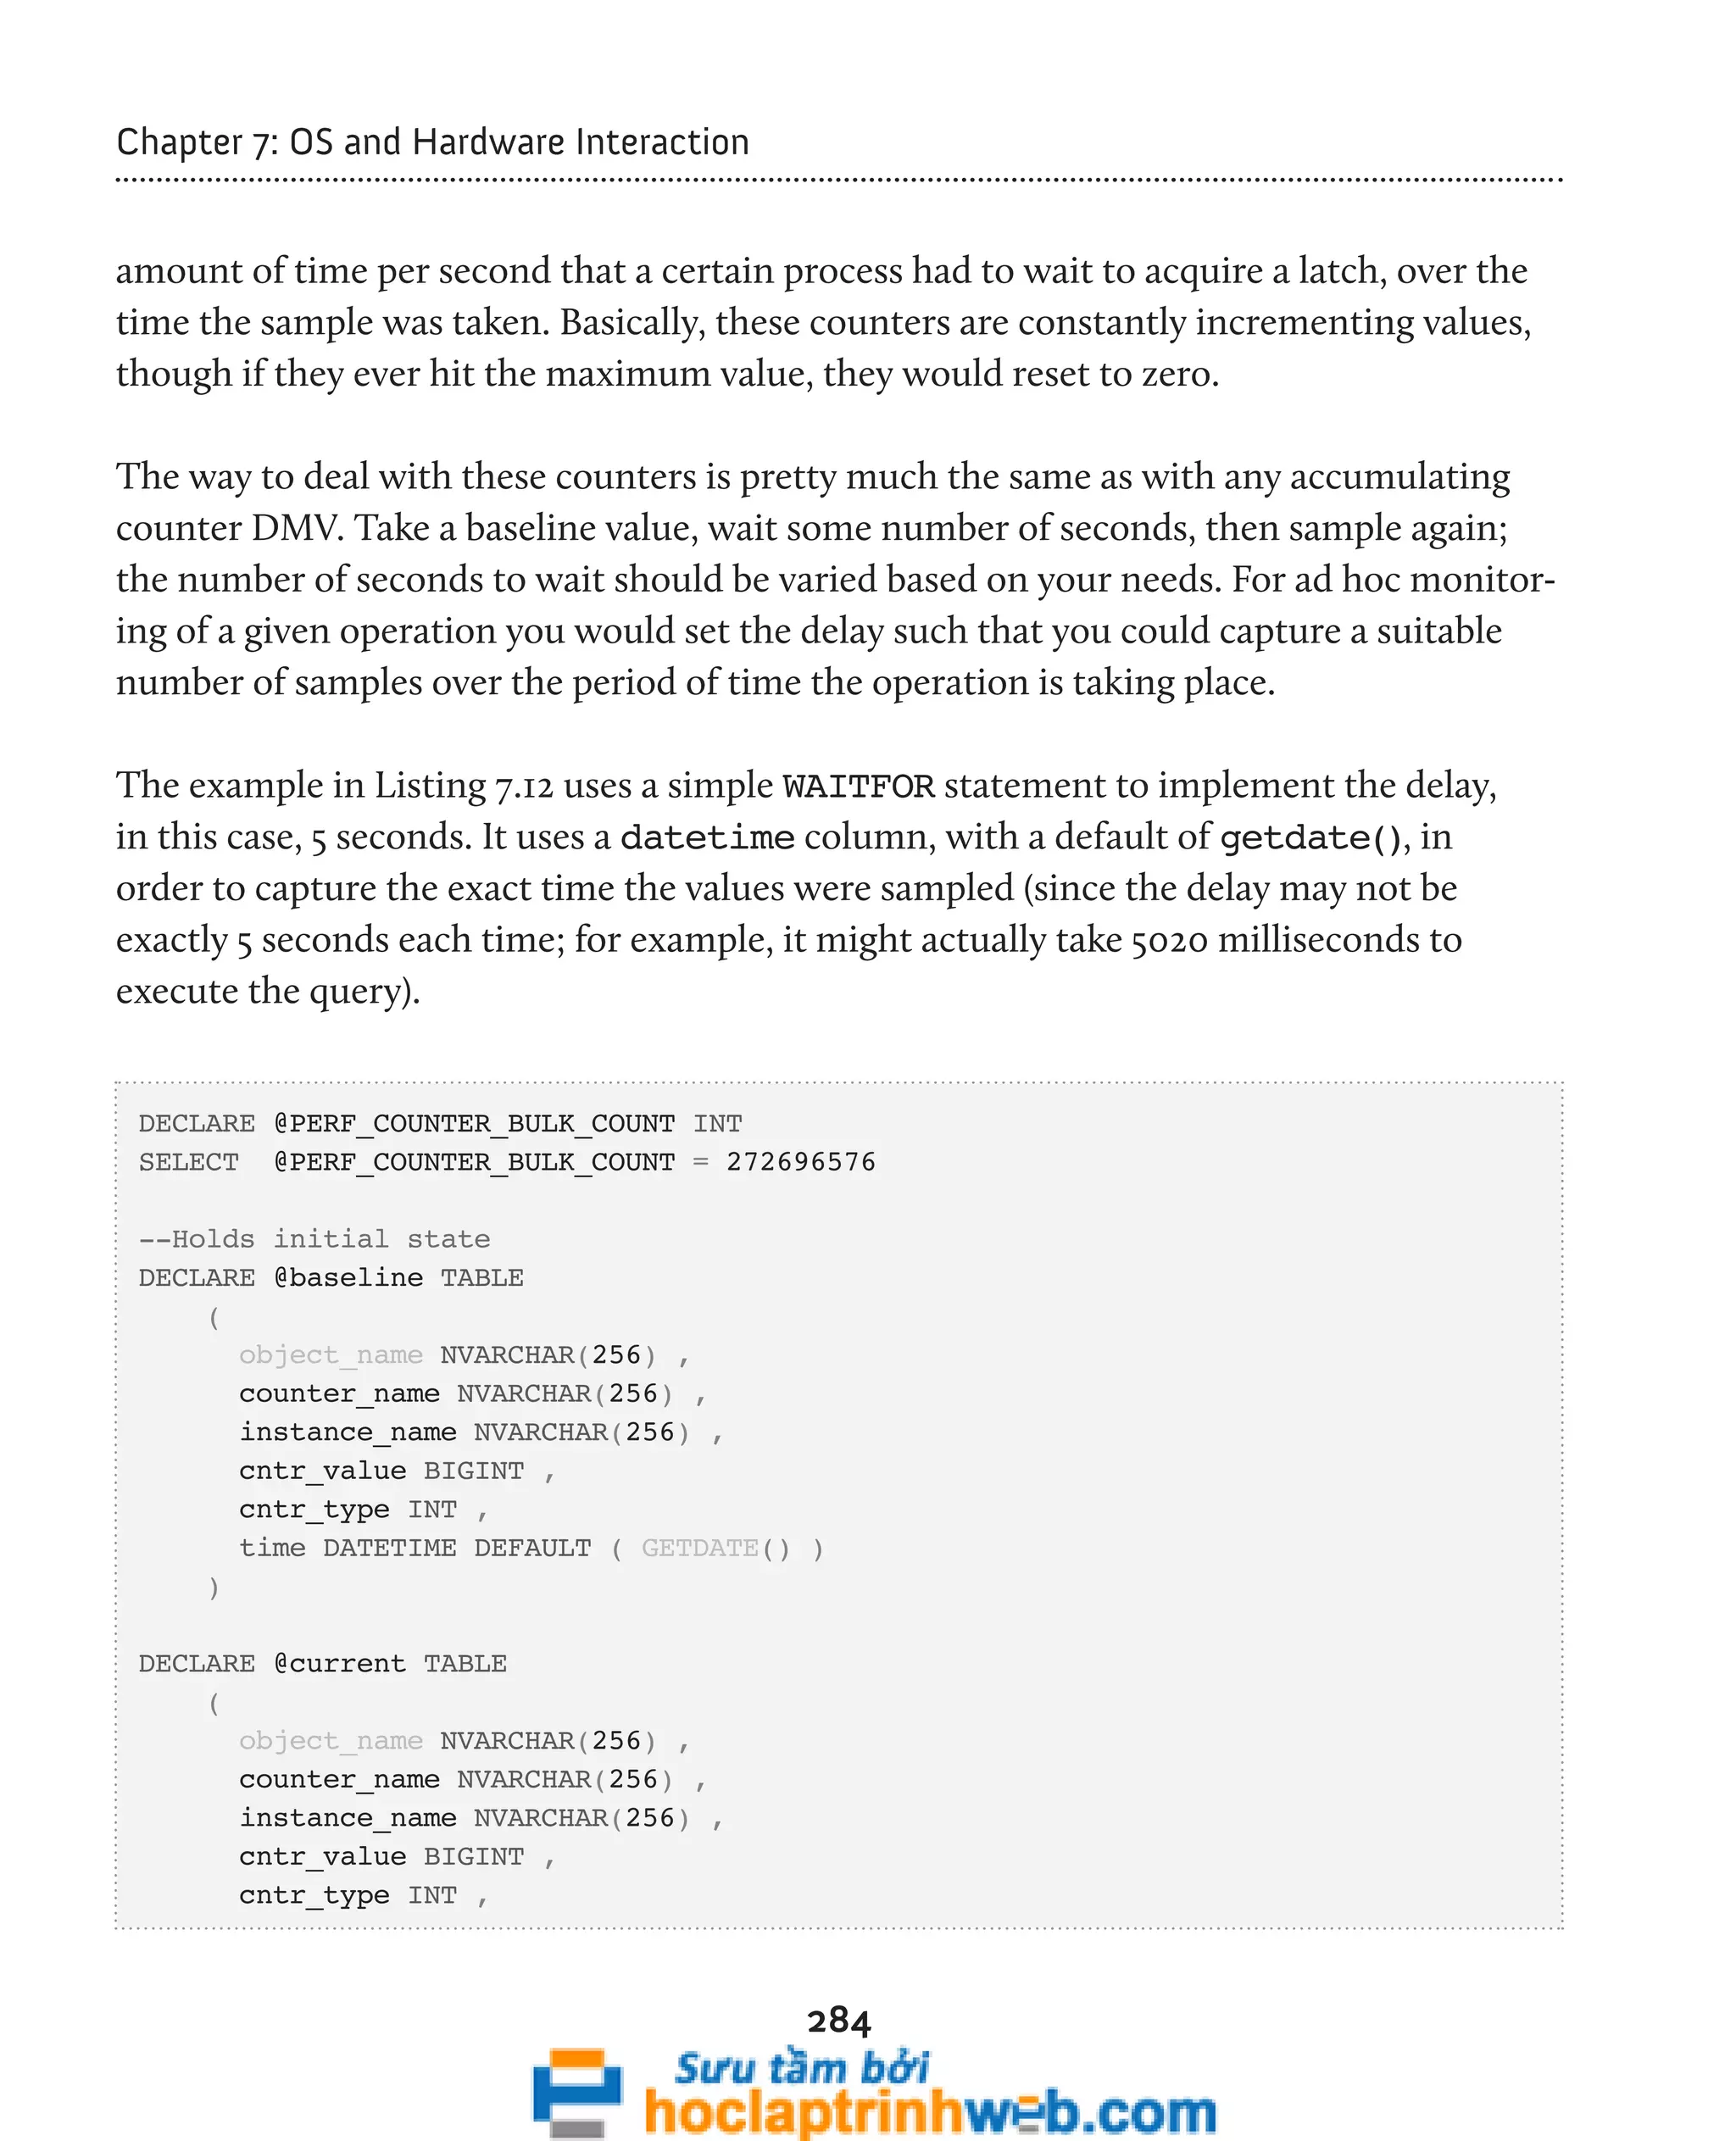
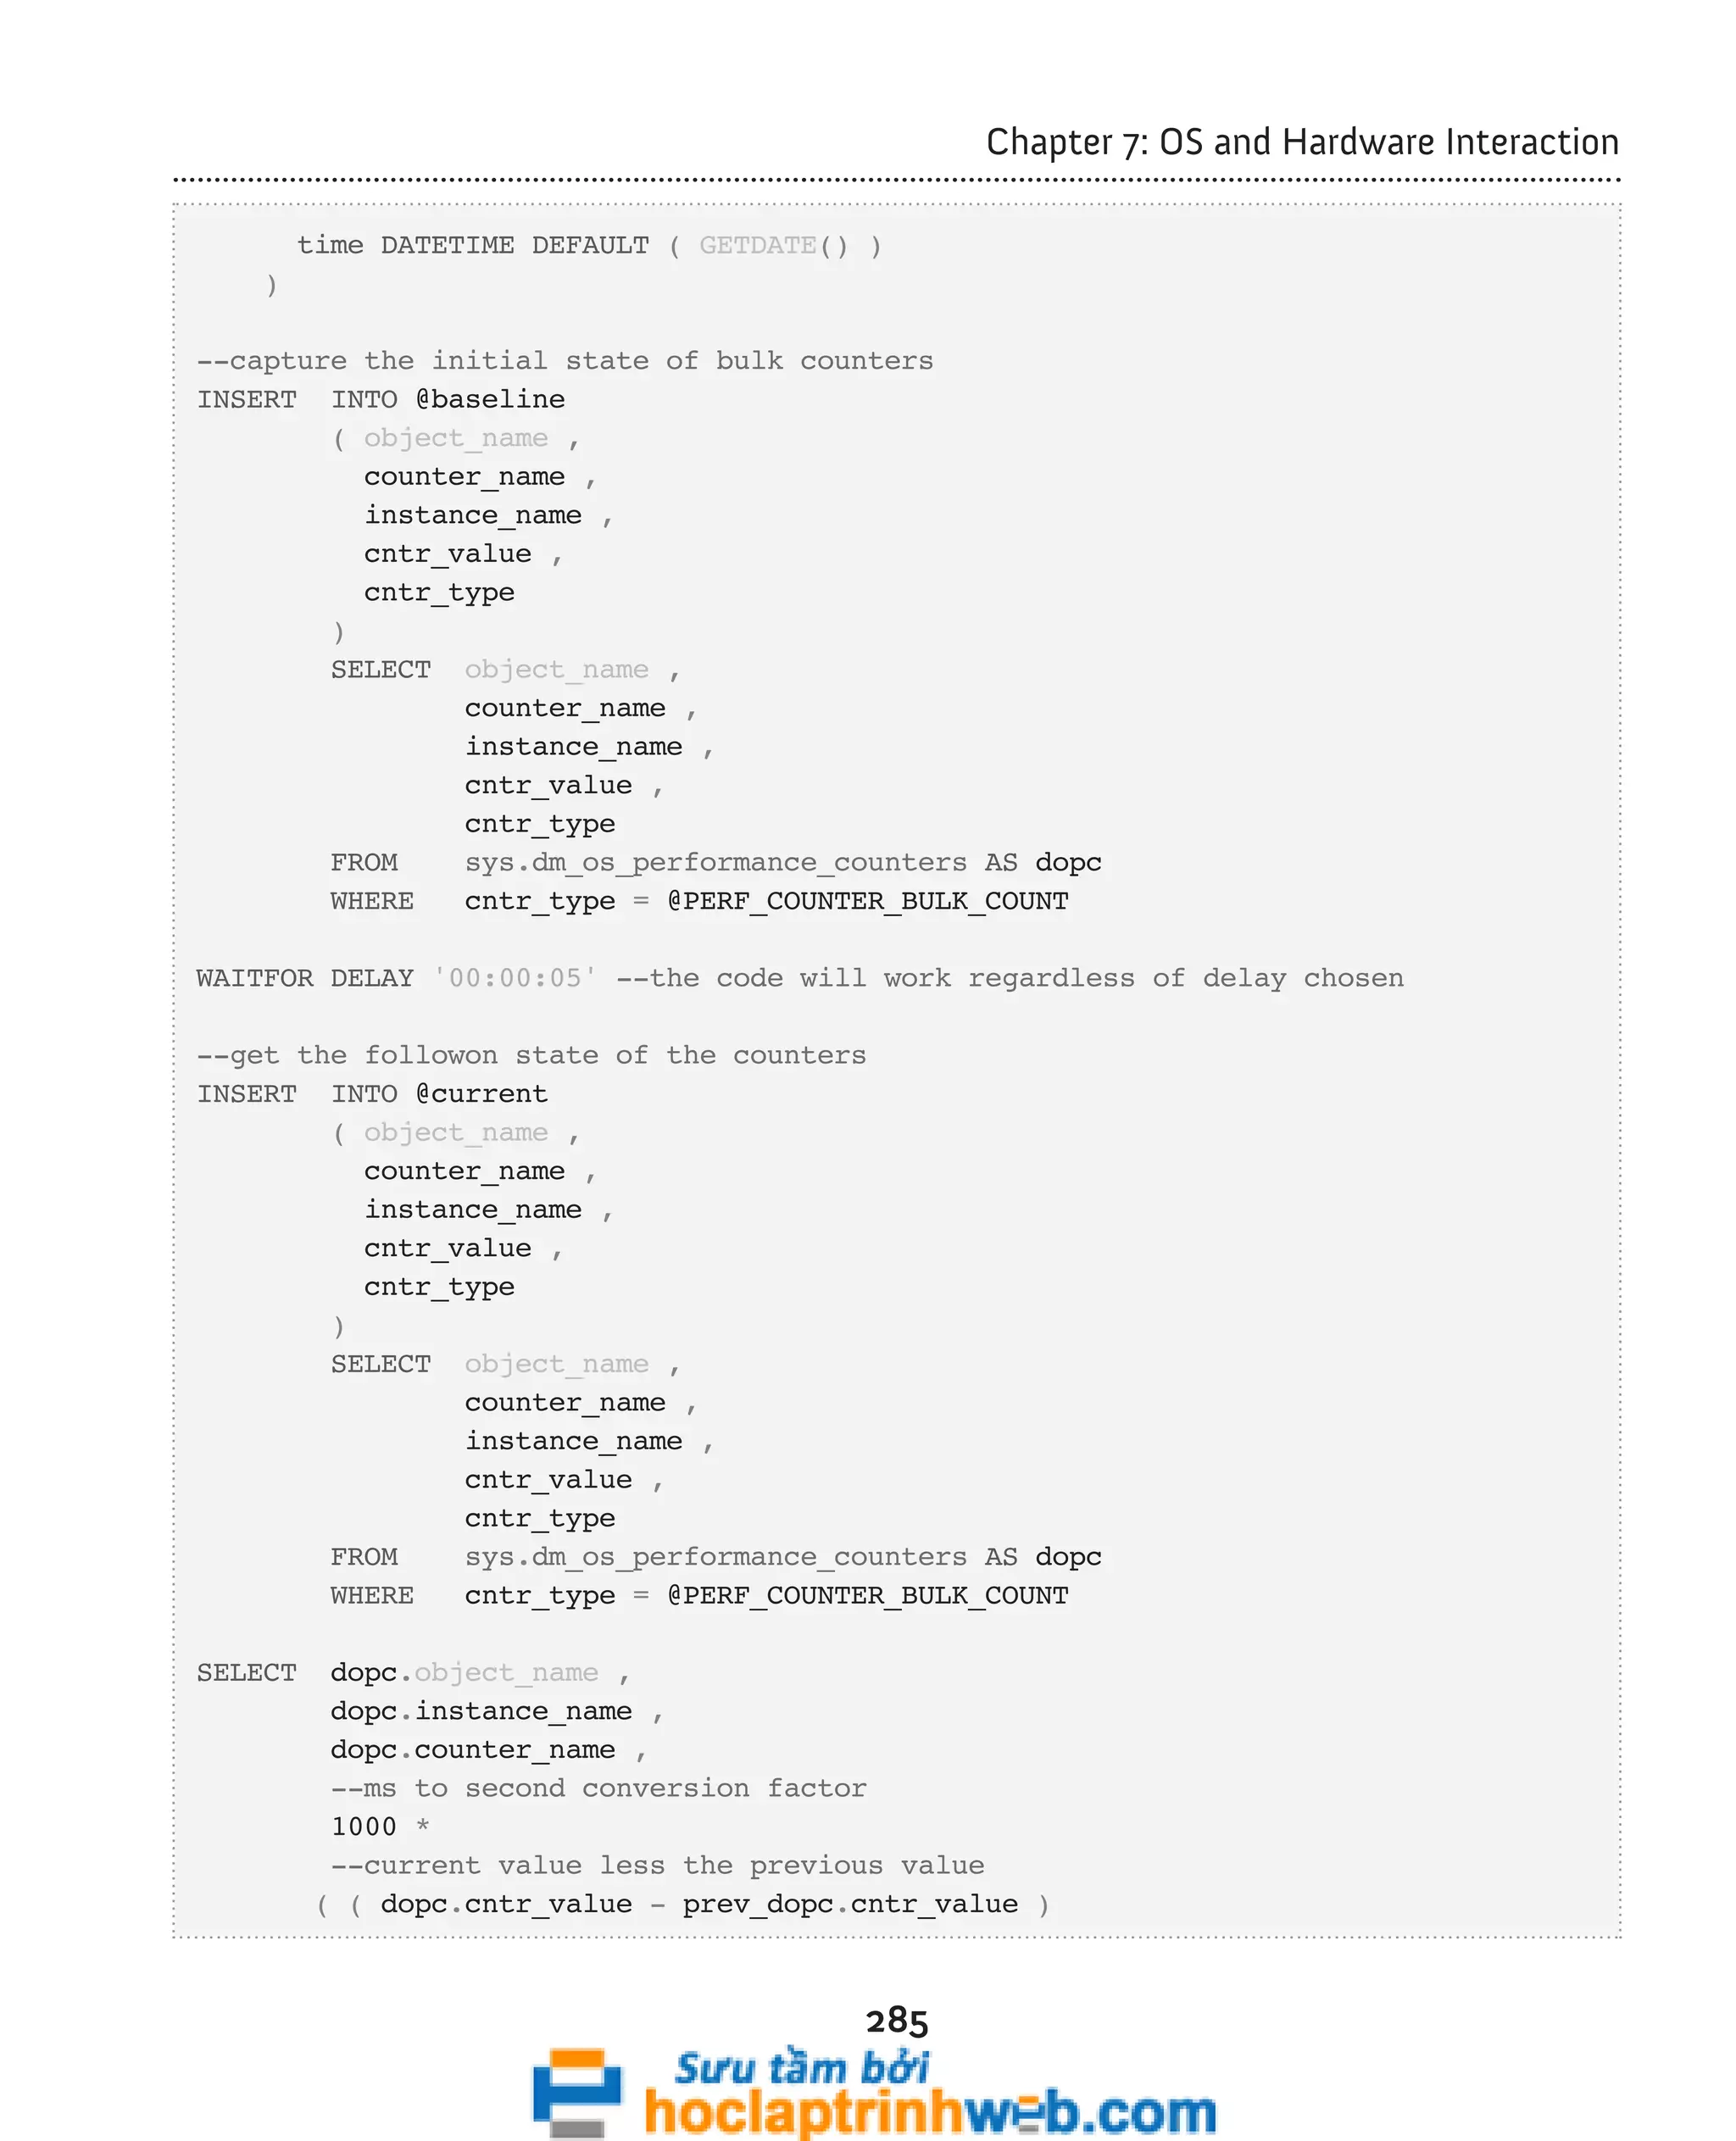
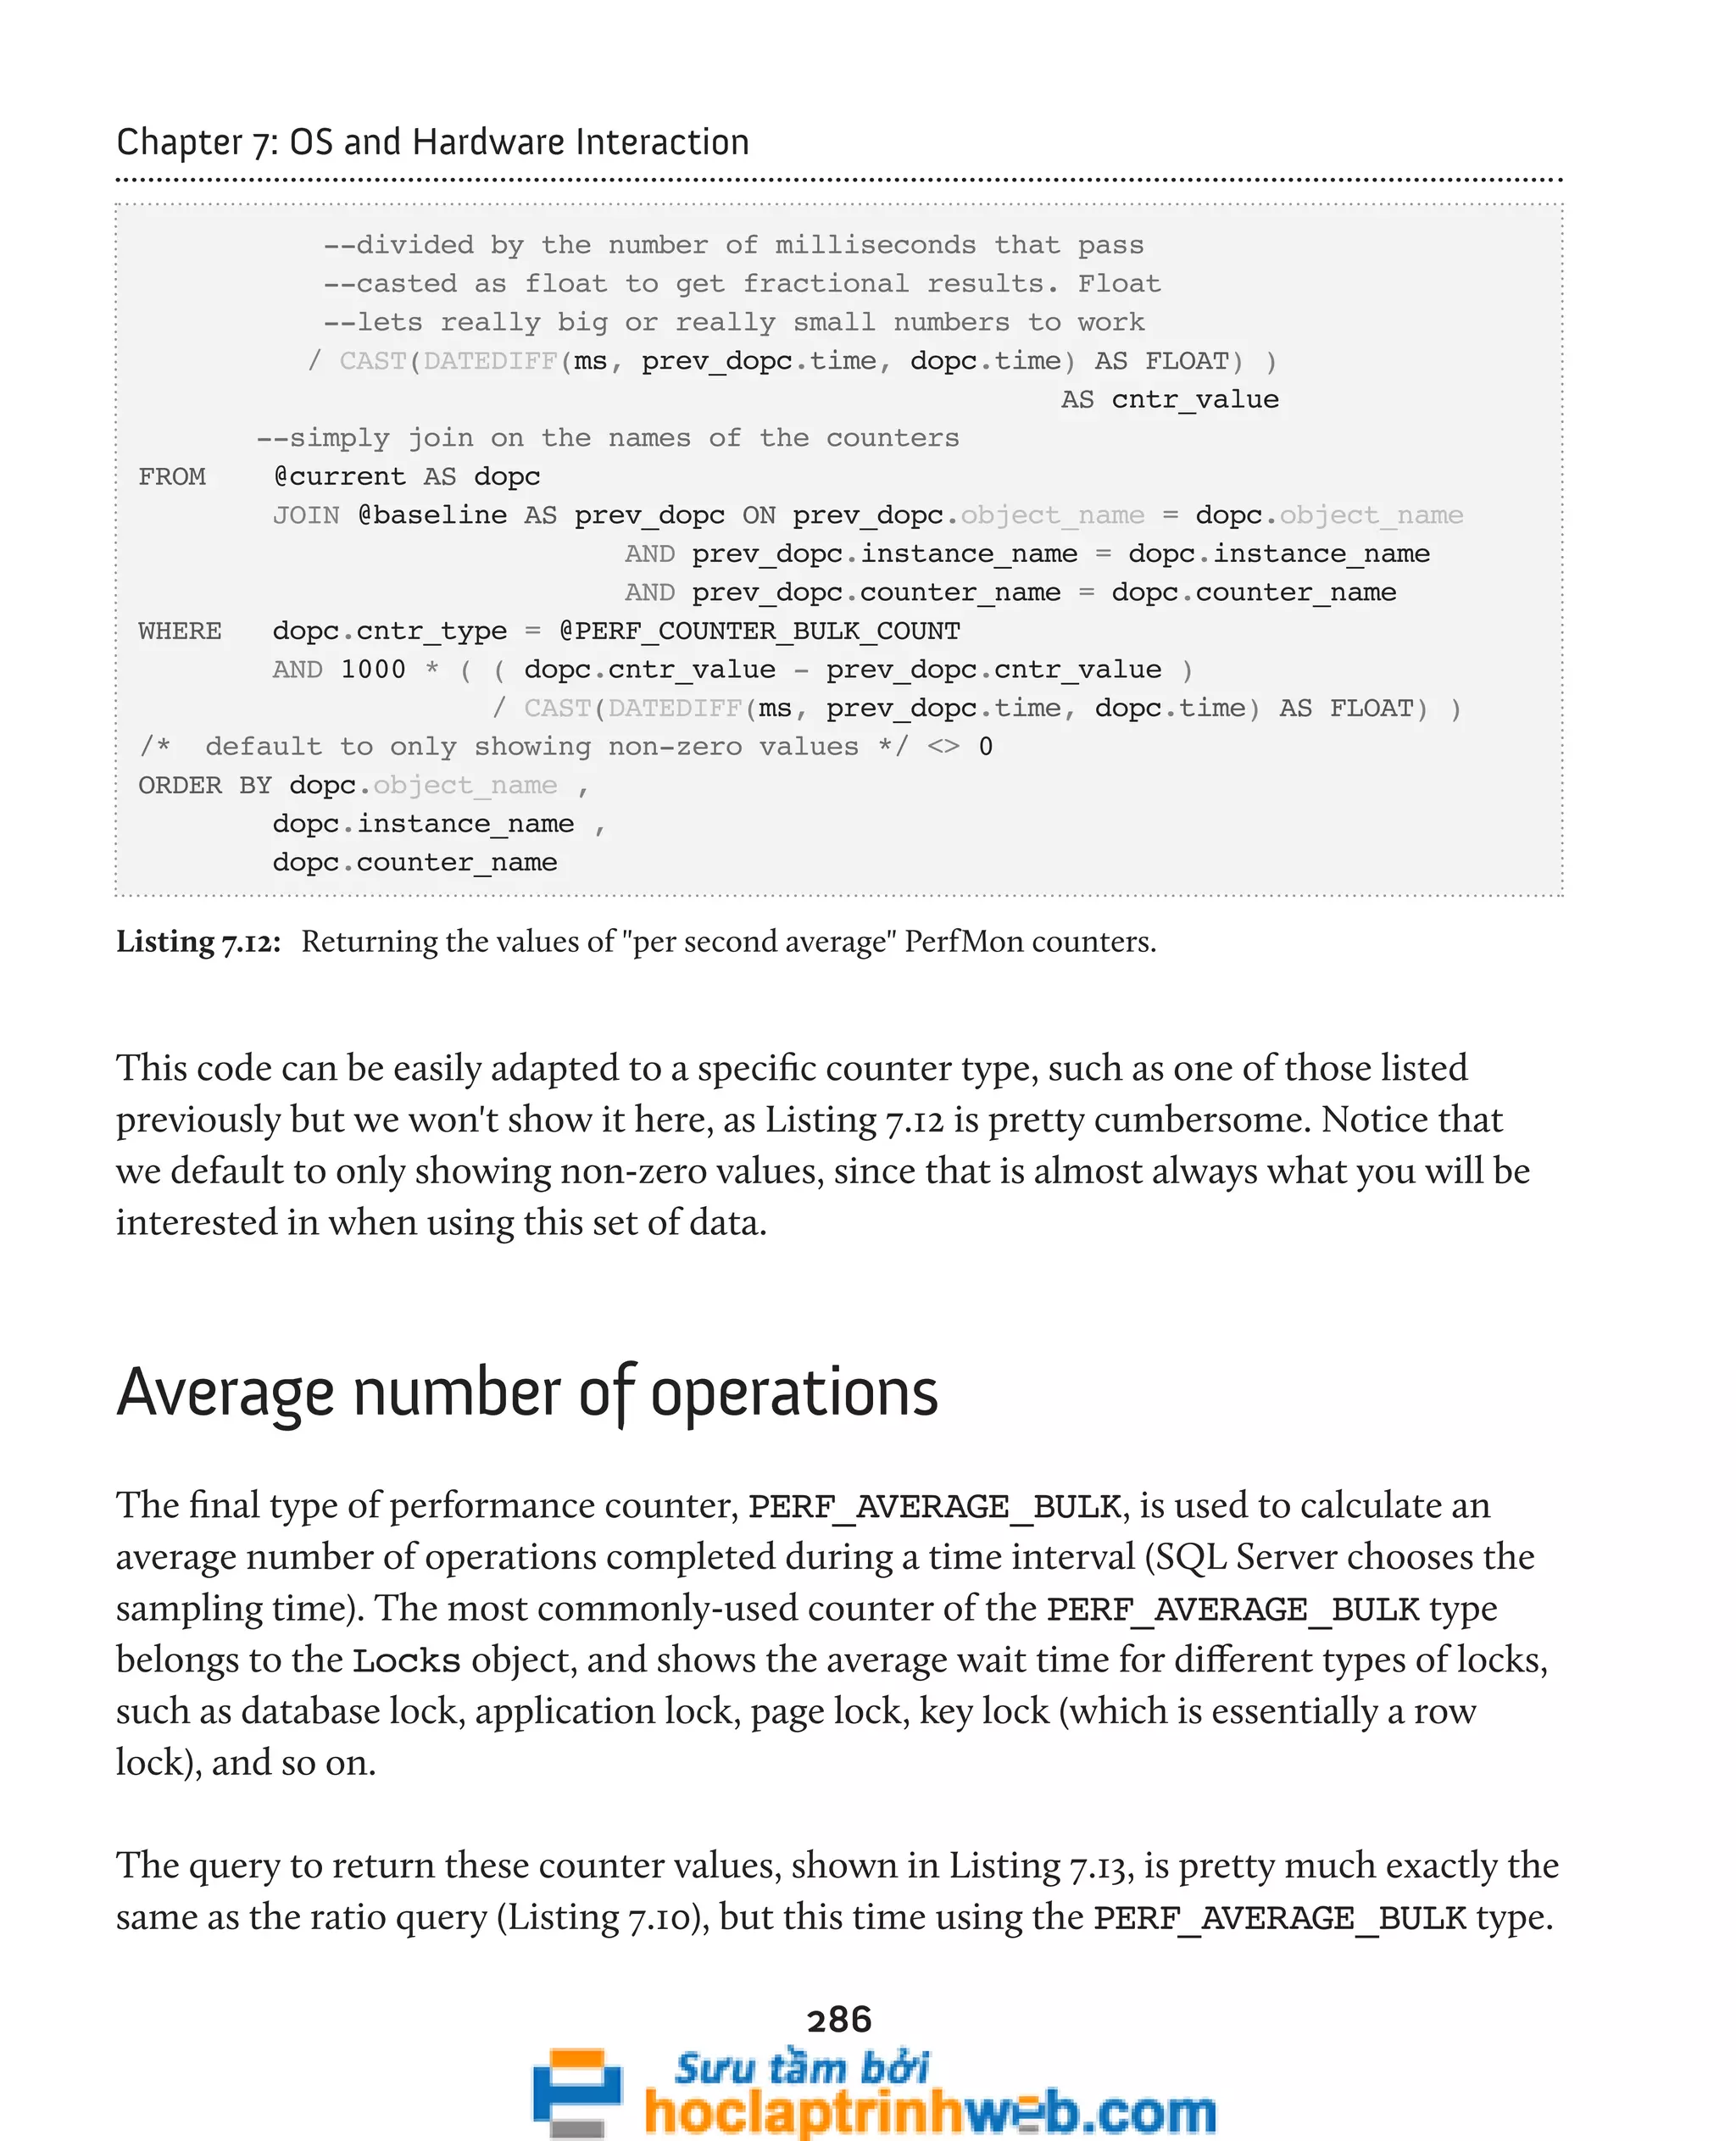
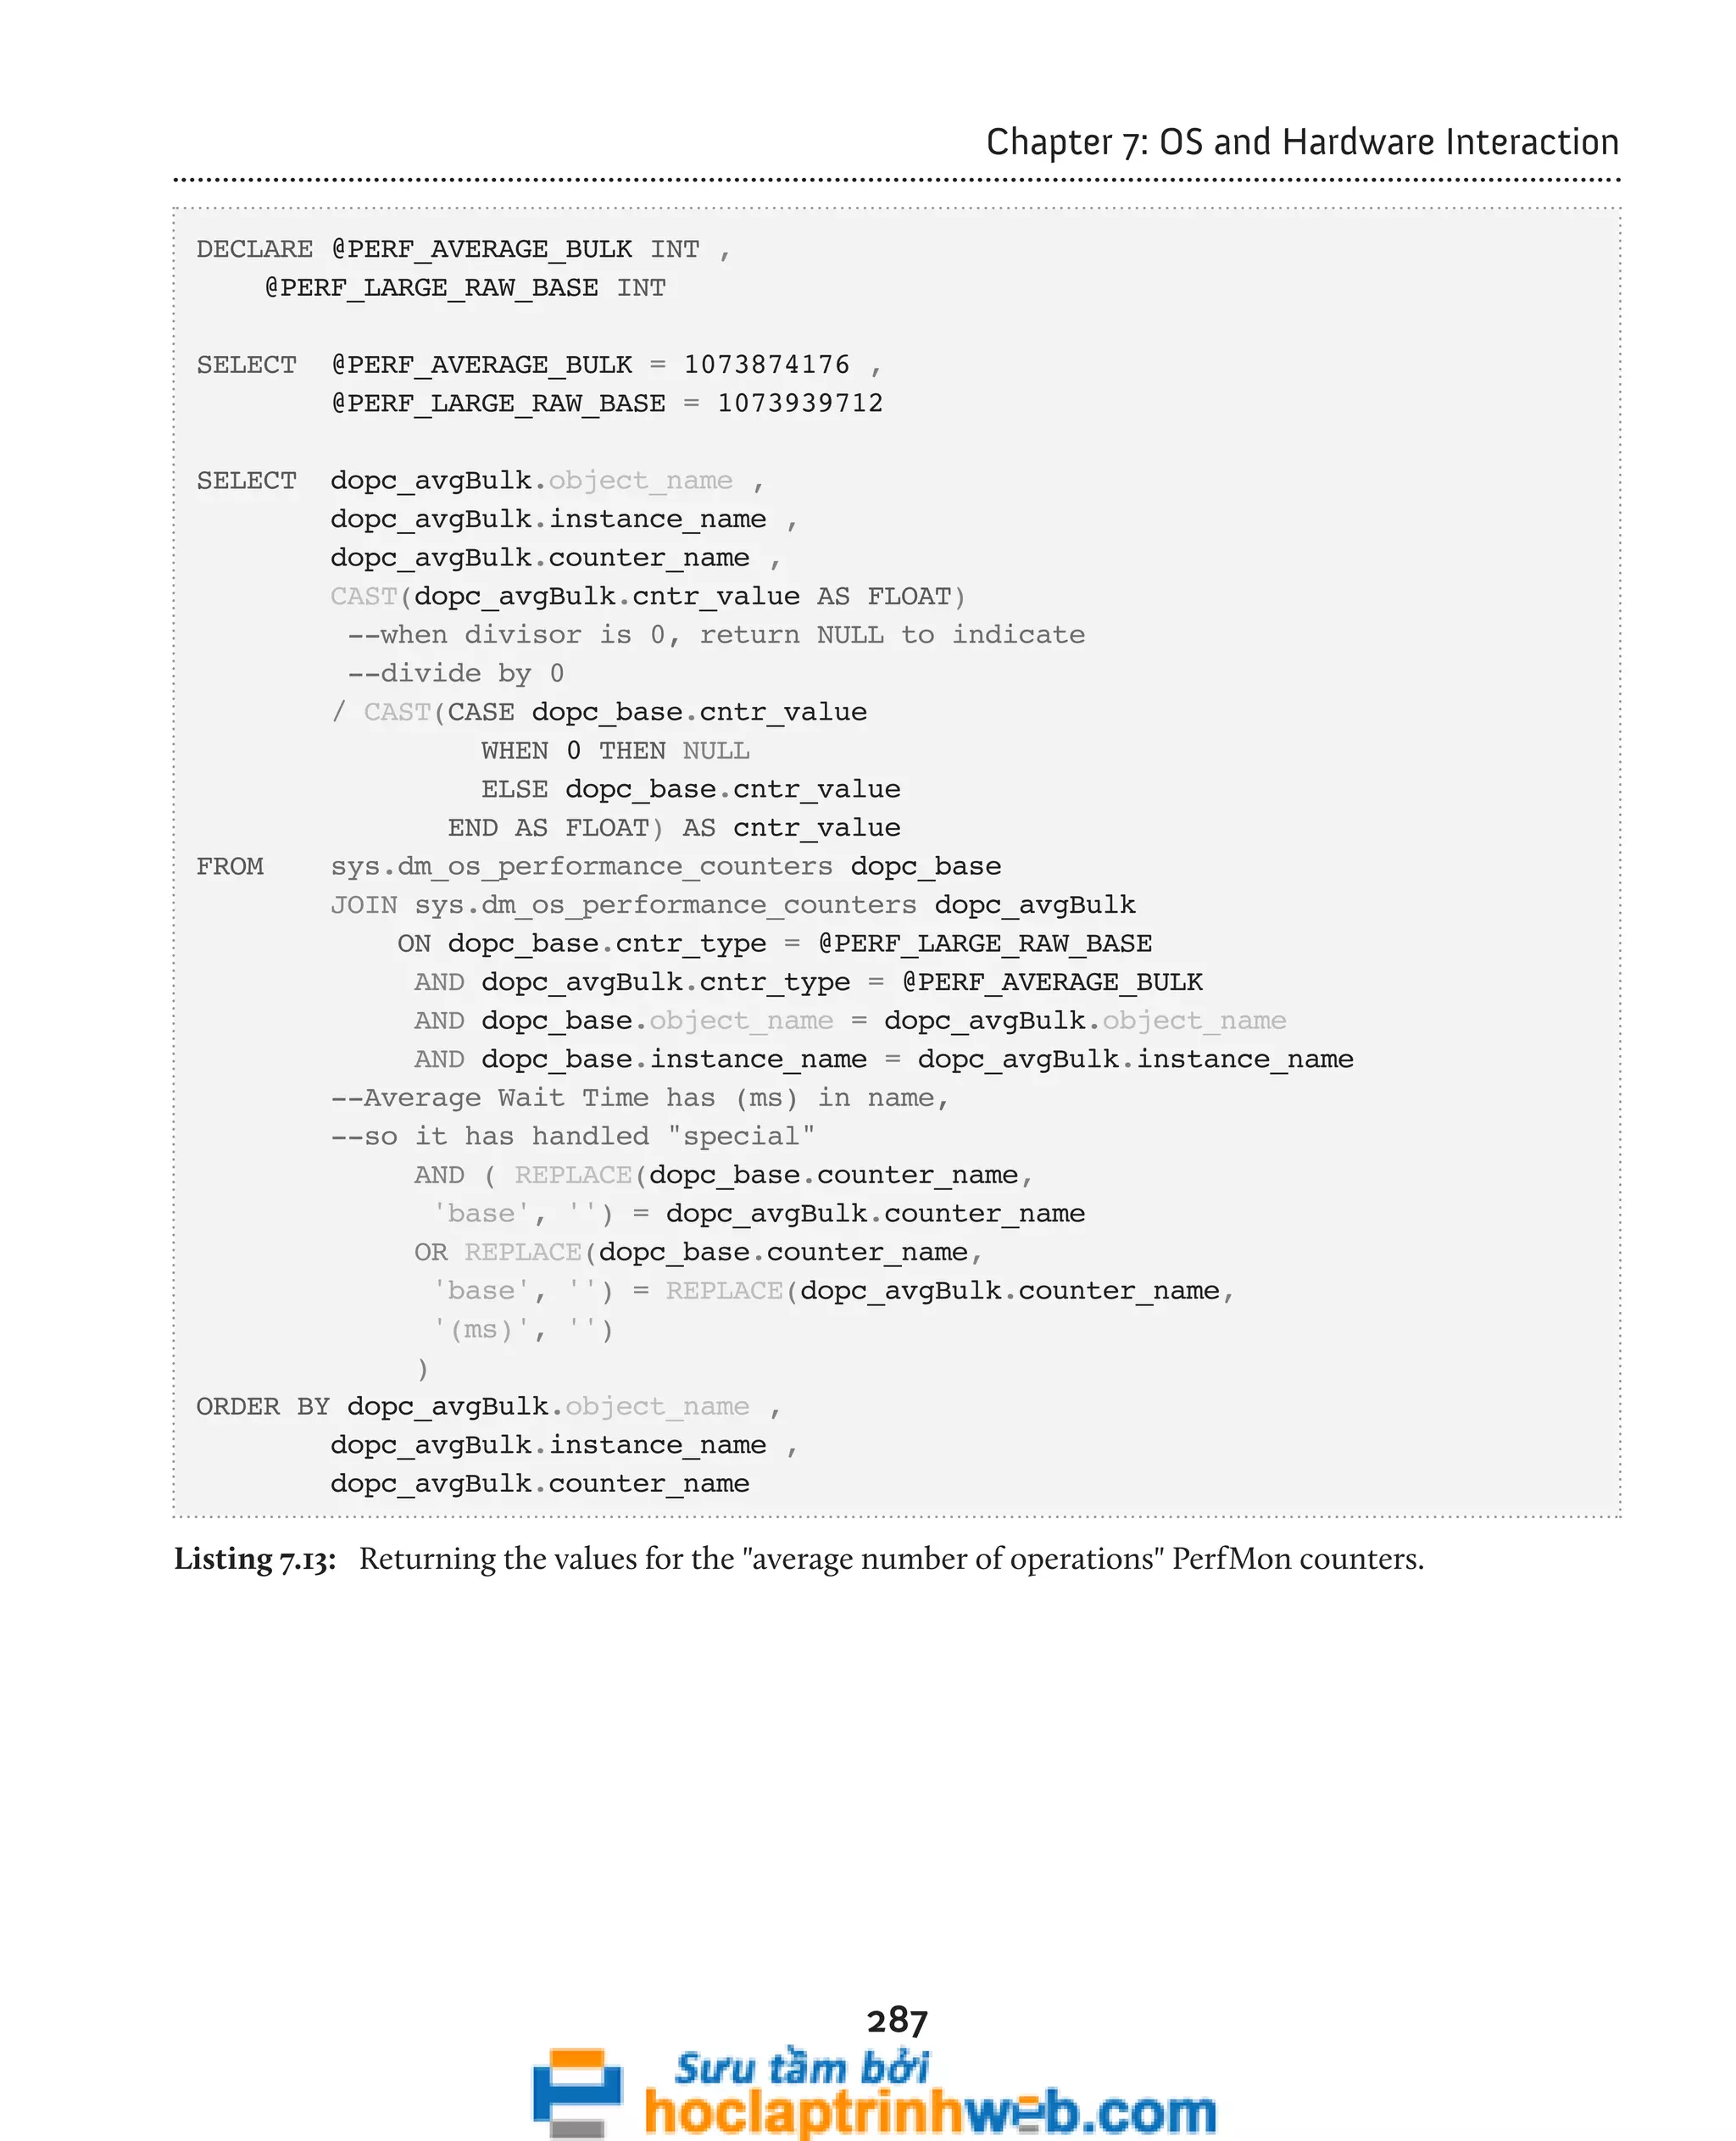
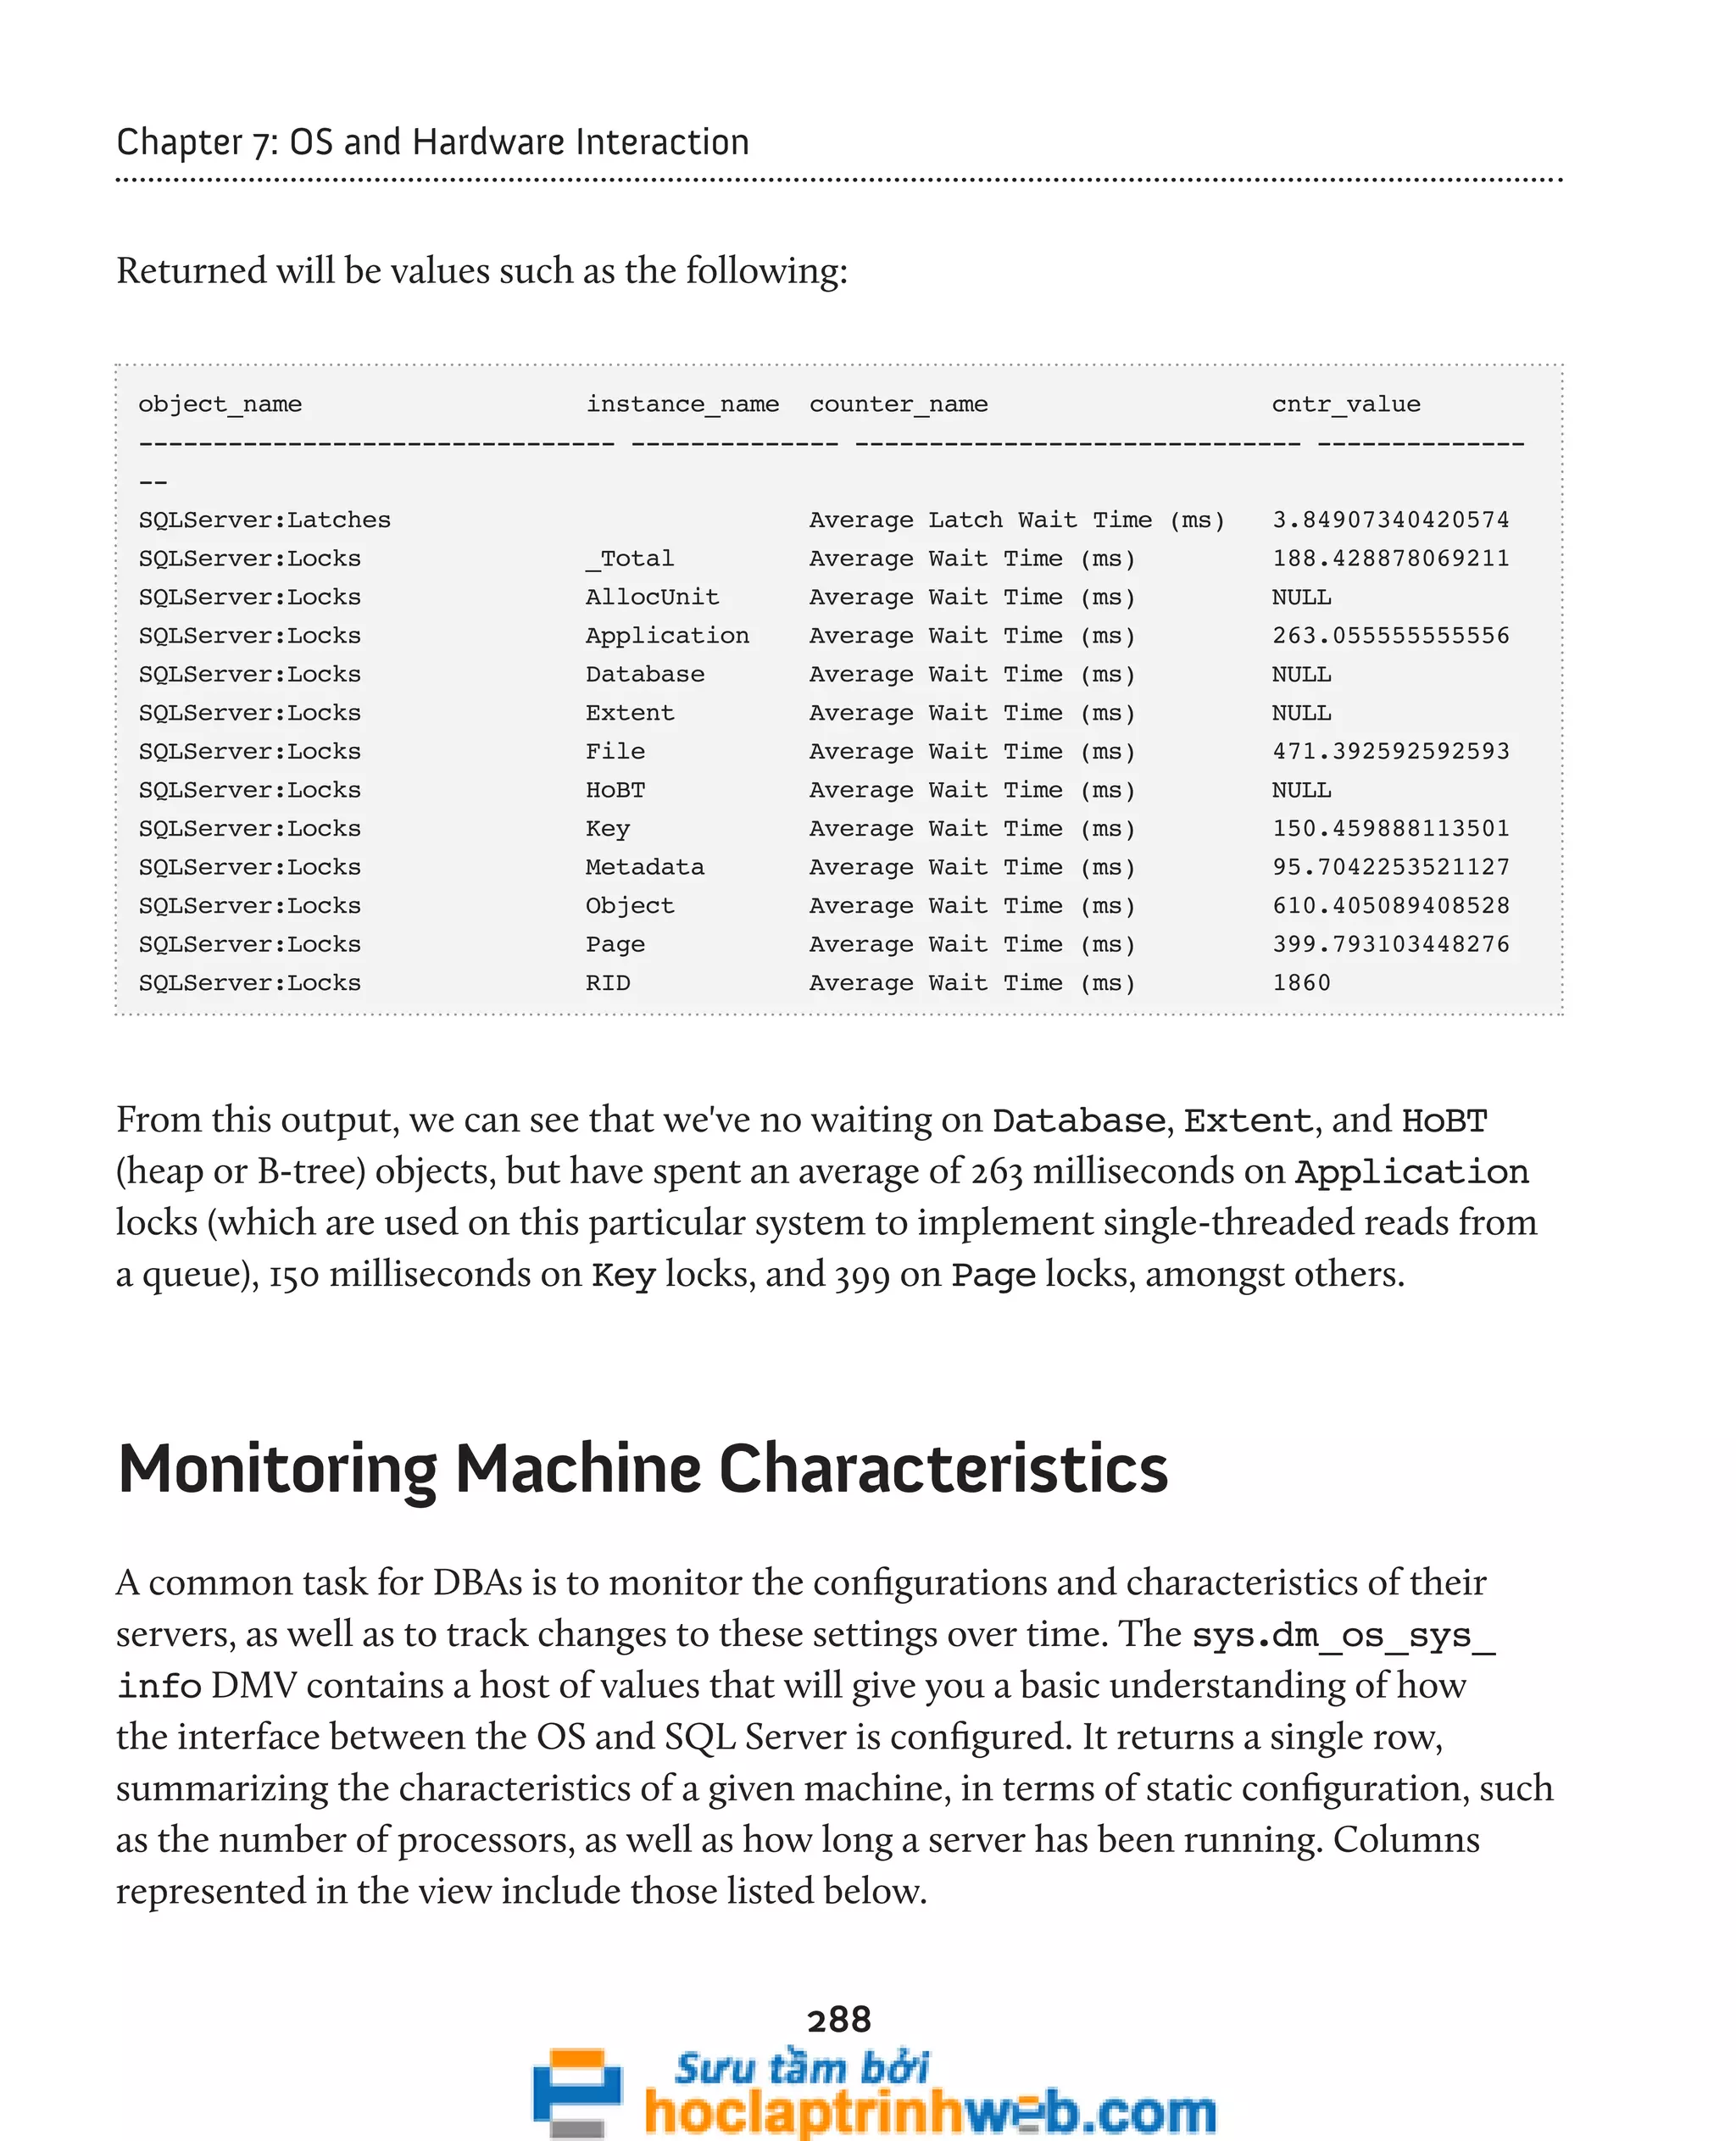

![291
Chapter 7: OS and Hardware Interaction
-- Hardware information from SQL Server 2008
-- (Cannot distinguish between HT and multi-core)
SELECT cpu_count AS [Logical CPU Count] ,
hyperthread_ratio AS [Hyperthread Ratio] ,
cpu_count / hyperthread_ratio AS [Physical CPU Count] ,
physical_memory_in_bytes / 1048576 AS [Physical Memory (MB)] ,
sqlserver_start_time
FROM sys.dm_os_sys_info ;
Listing 7.14: CPU configuration details.
The script in Listing 7.15 is useful when interrogating memory configuration.
--Determine if this is a 32- or 64-bit SQL Server edition
DECLARE @ServerAddressing AS TINYINT
SELECT @serverAddressing = CASE WHEN CHARINDEX('64',
CAST(SERVERPROPERTY('Edition')
AS VARCHAR(100))) > 0
THEN 64
ELSE 32
END ;
SELECT cpu_count / hyperthread_ratio AS SocketCount ,
physical_memory_in_bytes / 1024 / 1024 AS physical_memory_mb ,
virtual_memory_in_bytes / 1024 / 1024 AS sql_max_virtual_memory_mb ,
-- same with other bpool columns as they are page oriented.
-- Multiplying by 8 takes it to 8K, then / 1024 to convert to mb
bpool_committed * 8 / 1024 AS buffer_pool_committed_mb ,
--64 bit OS does not have limitations with addressing as 32 did
CASE WHEN @serverAddressing = 32
THEN CASE WHEN virtual_memory_in_bytes / 1024 /
( 2048 * 1024 ) < 1
THEN 'off'
ELSE 'on'
END
ELSE 'N/A on 64 bit'
END AS [/3GB switch]
FROM sys.dm_os_sys_info
Listing 7.15: Interrogating memory configuration.](https://image.slidesharecdn.com/ebookperformancetuningdavidsonford-141014034404-conversion-gate02/75/c-291-2048.jpg)
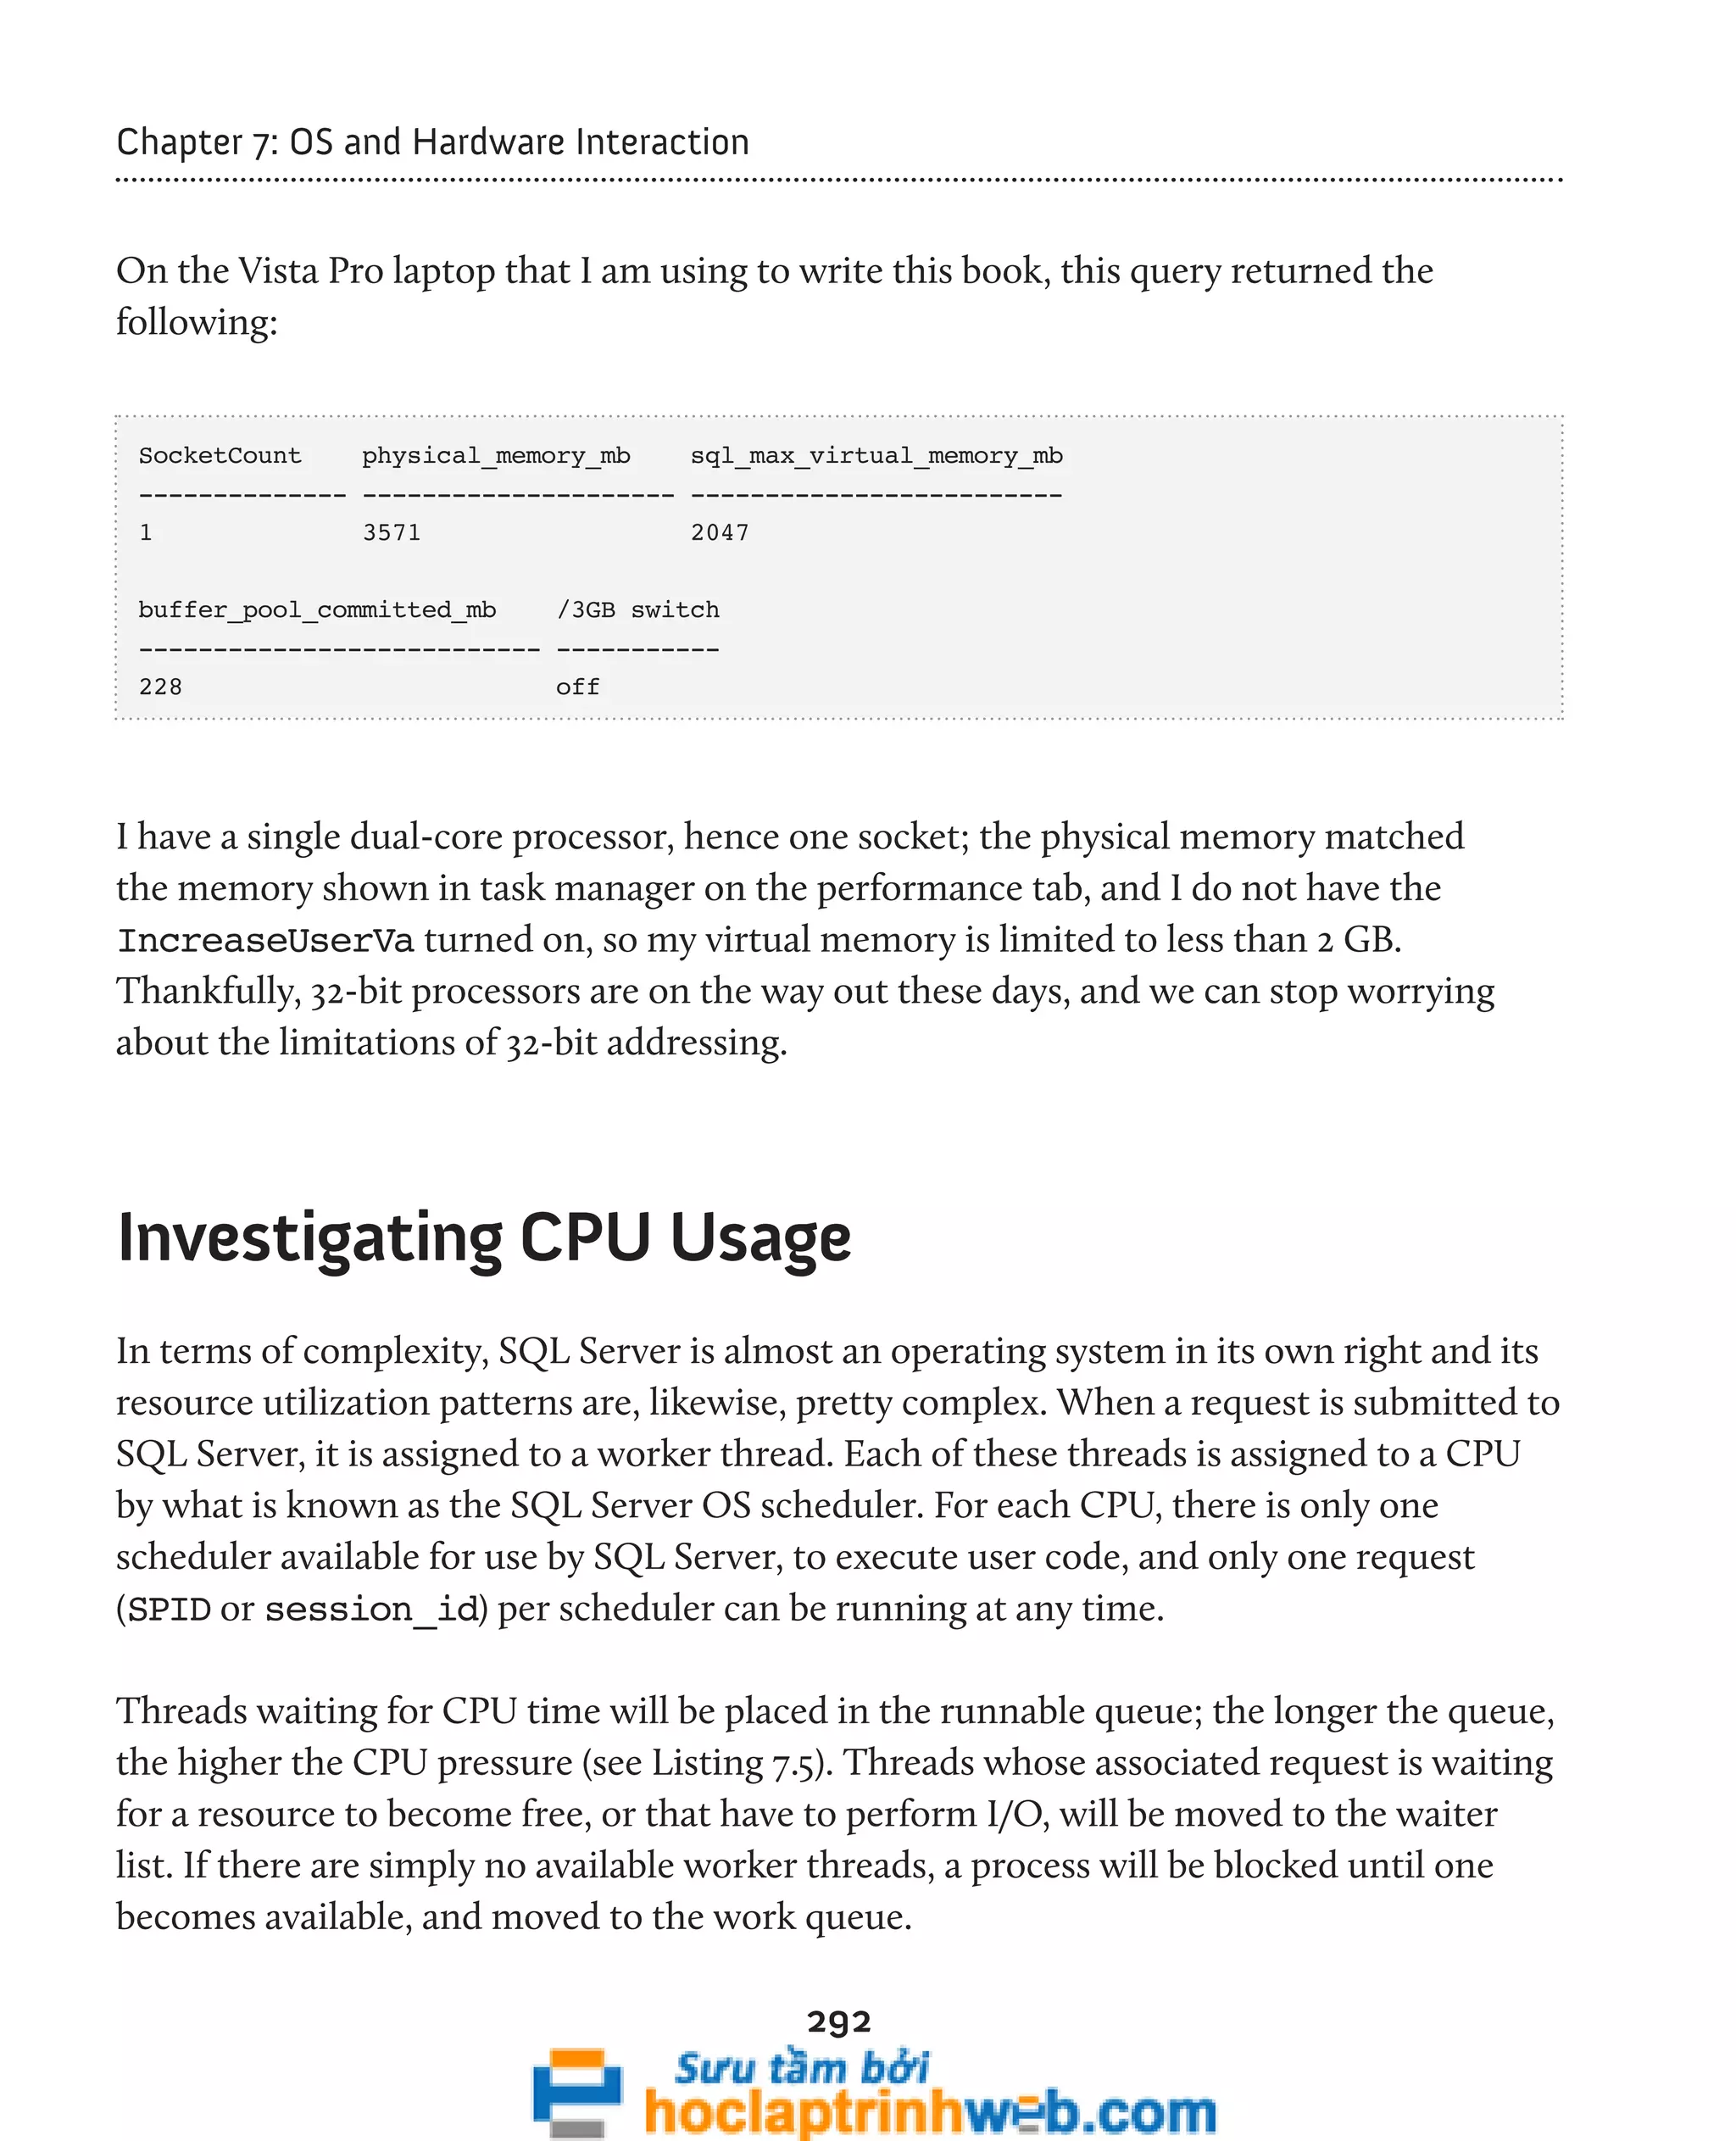
![296
Chapter 7: OS and Hardware Interaction
-- Get Avg task count and Avg runnable task count
SELECT AVG(current_tasks_count) AS [Avg Task Count] ,
AVG(runnable_tasks_count) AS [Avg Runnable Task Count]
FROM sys.dm_os_schedulers
WHERE scheduler_id < 255
AND [status] = 'VISIBLE ONLINE' ;
Listing 7.16: Investigating scheduler activity.
High, sustained values for the current_tasks_count column usually indicate a
blocking issue, and you can investigate this further using the DMOs described in
Chapter 4, Transactions. It can also be a secondary indicator of I/O pressure. High,
sustained values for the runnable_tasks_count column are usually a very good
indicator of CPU pressure, since this means that many tasks are waiting for CPU time.
The longer the queue, and the greater the number of schedulers with requests waiting,
the more stressed is the CPU subsystem. For most systems, a sustained runnable task
queue length of more than about 10–20 is a cause for concern.
For individual schedulers, we can employ the query shown in Listing 7.17, which uses
various status columns to investigate potential CPU pressure or, by a simple variation
of the WHERE clause, to indicate whether or not I/O pressure is the root cause of the
system slowdown.
SELECT scheduler_id ,
cpu_id ,
Status ,
is_online ,
is_idle ,
current_tasks_count ,
runnable_tasks_count ,
current_workers_count ,
active_workers_count ,
work_queue_count ,
pending_disk_io_count ,
load_factor
FROM sys.dm_os_schedulers](https://image.slidesharecdn.com/ebookperformancetuningdavidsonford-141014034404-conversion-gate02/75/c-296-2048.jpg)
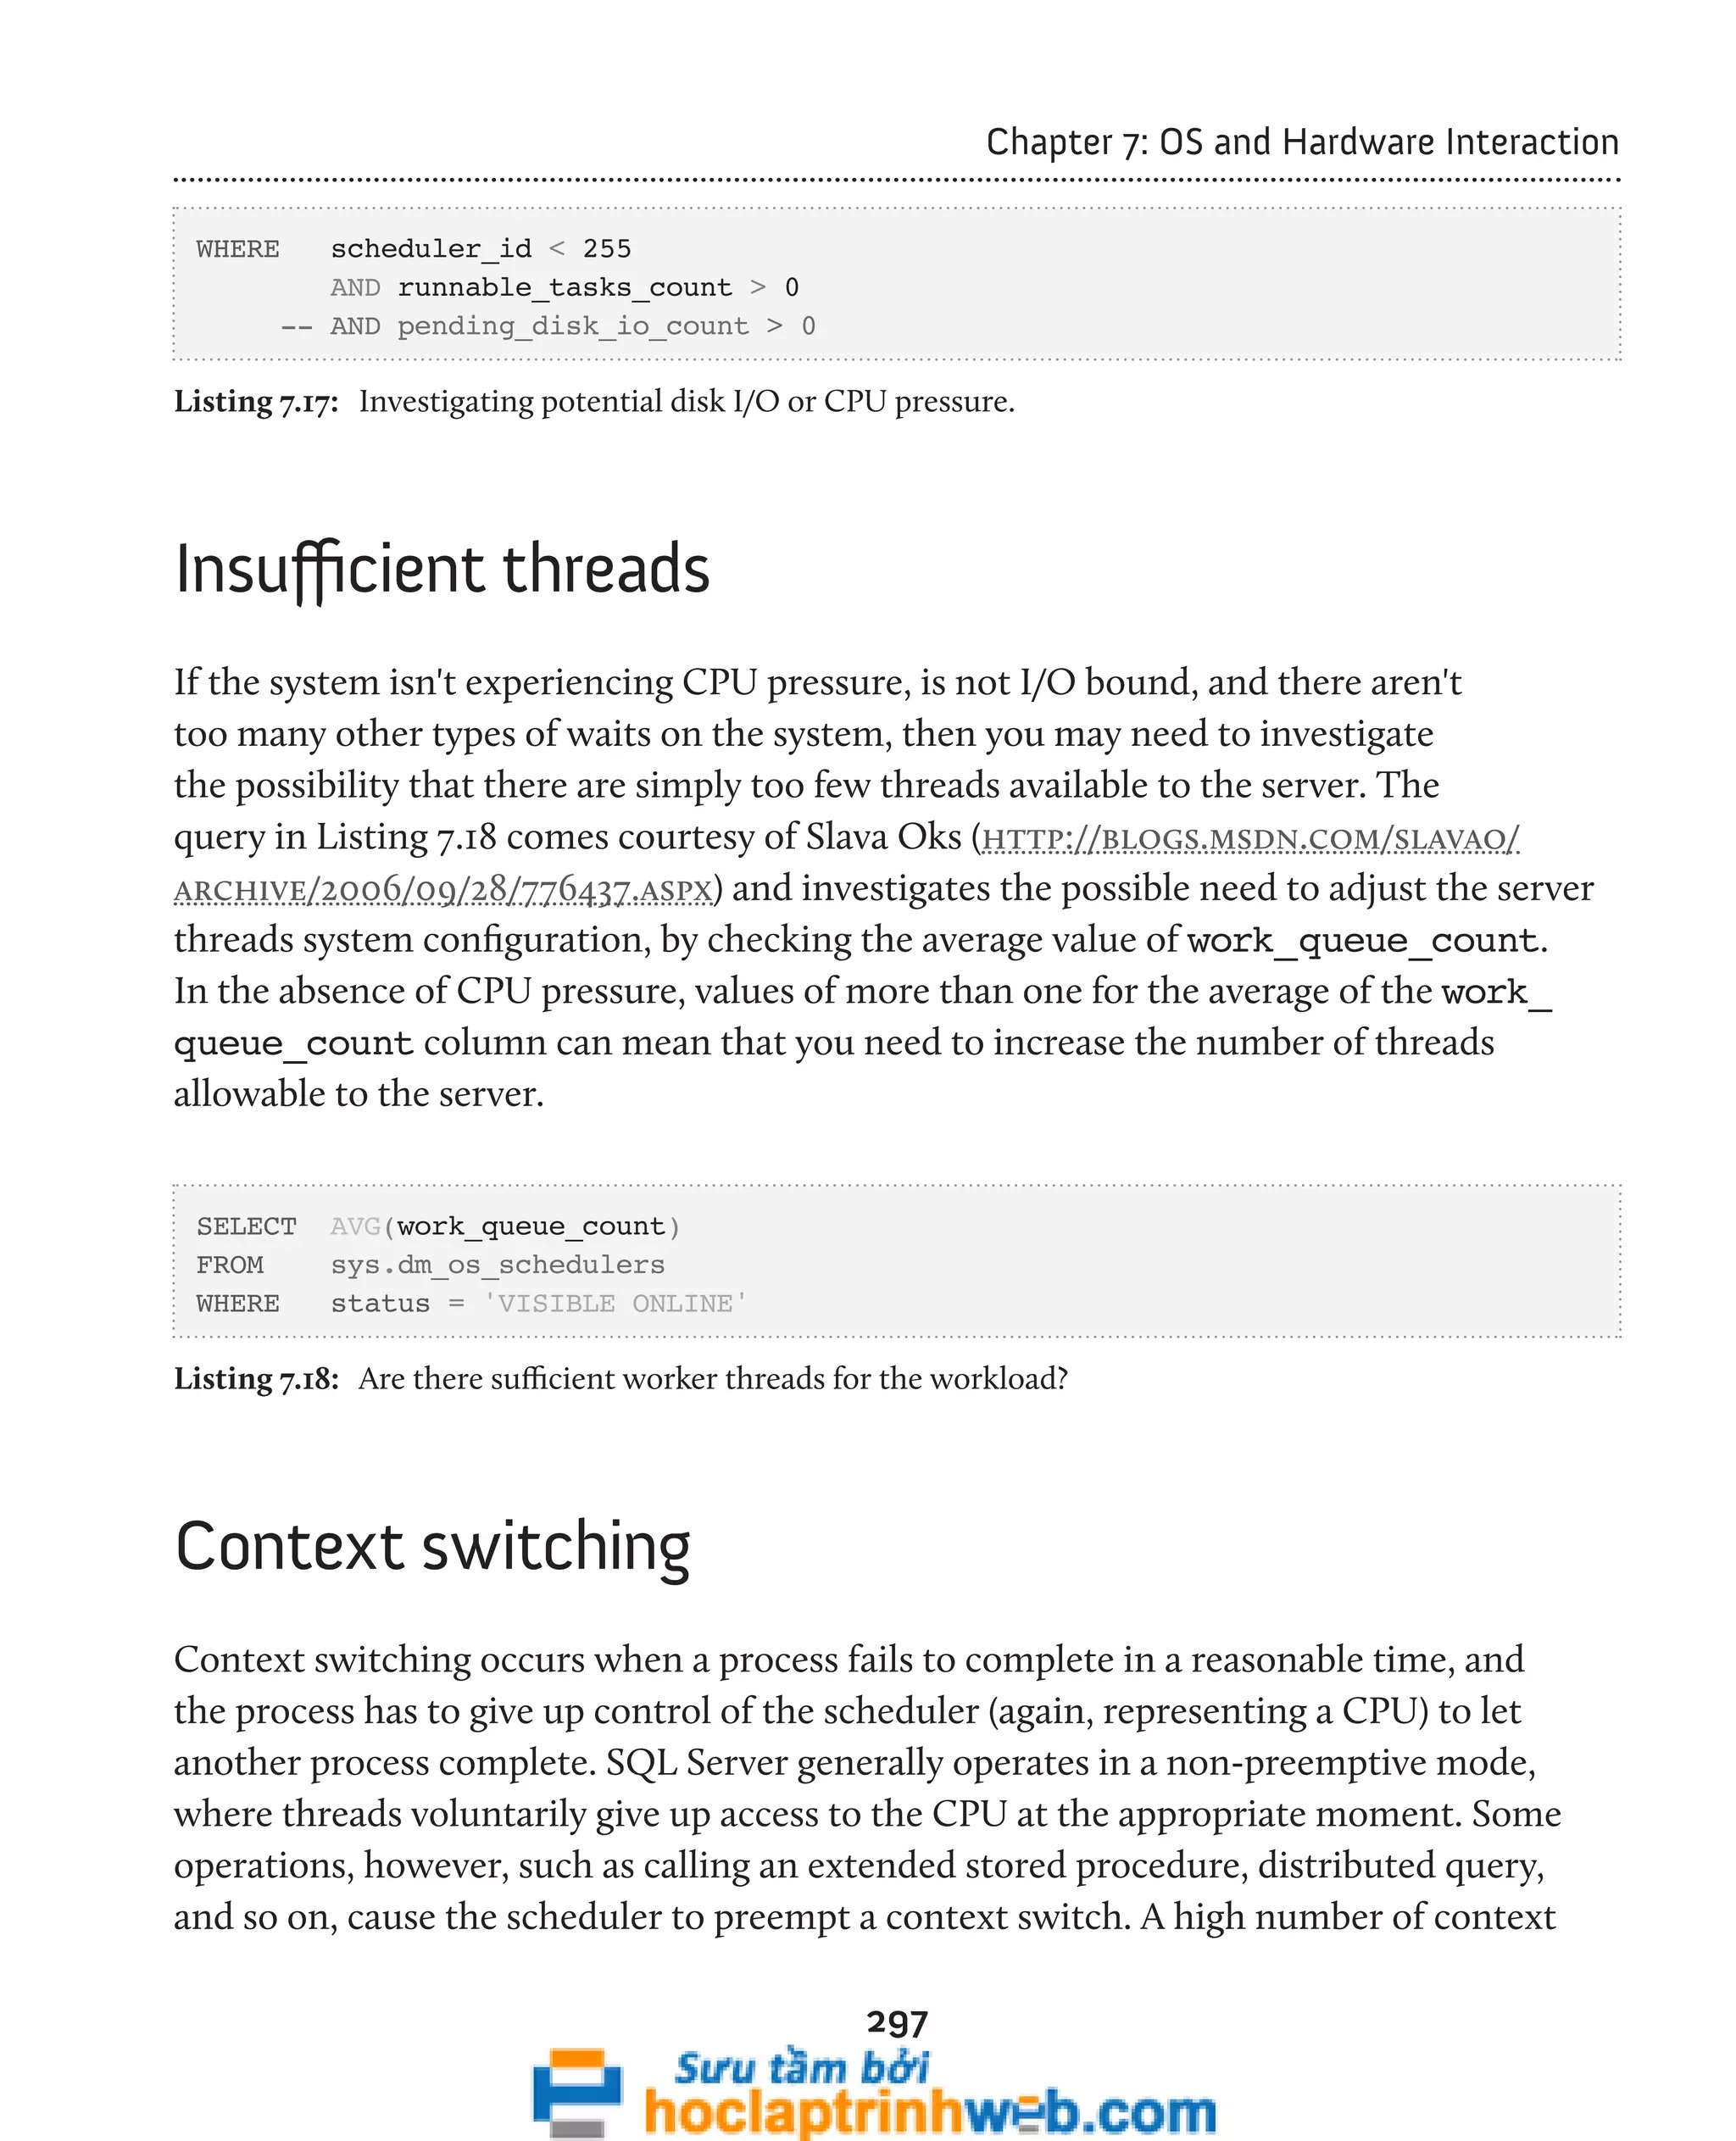
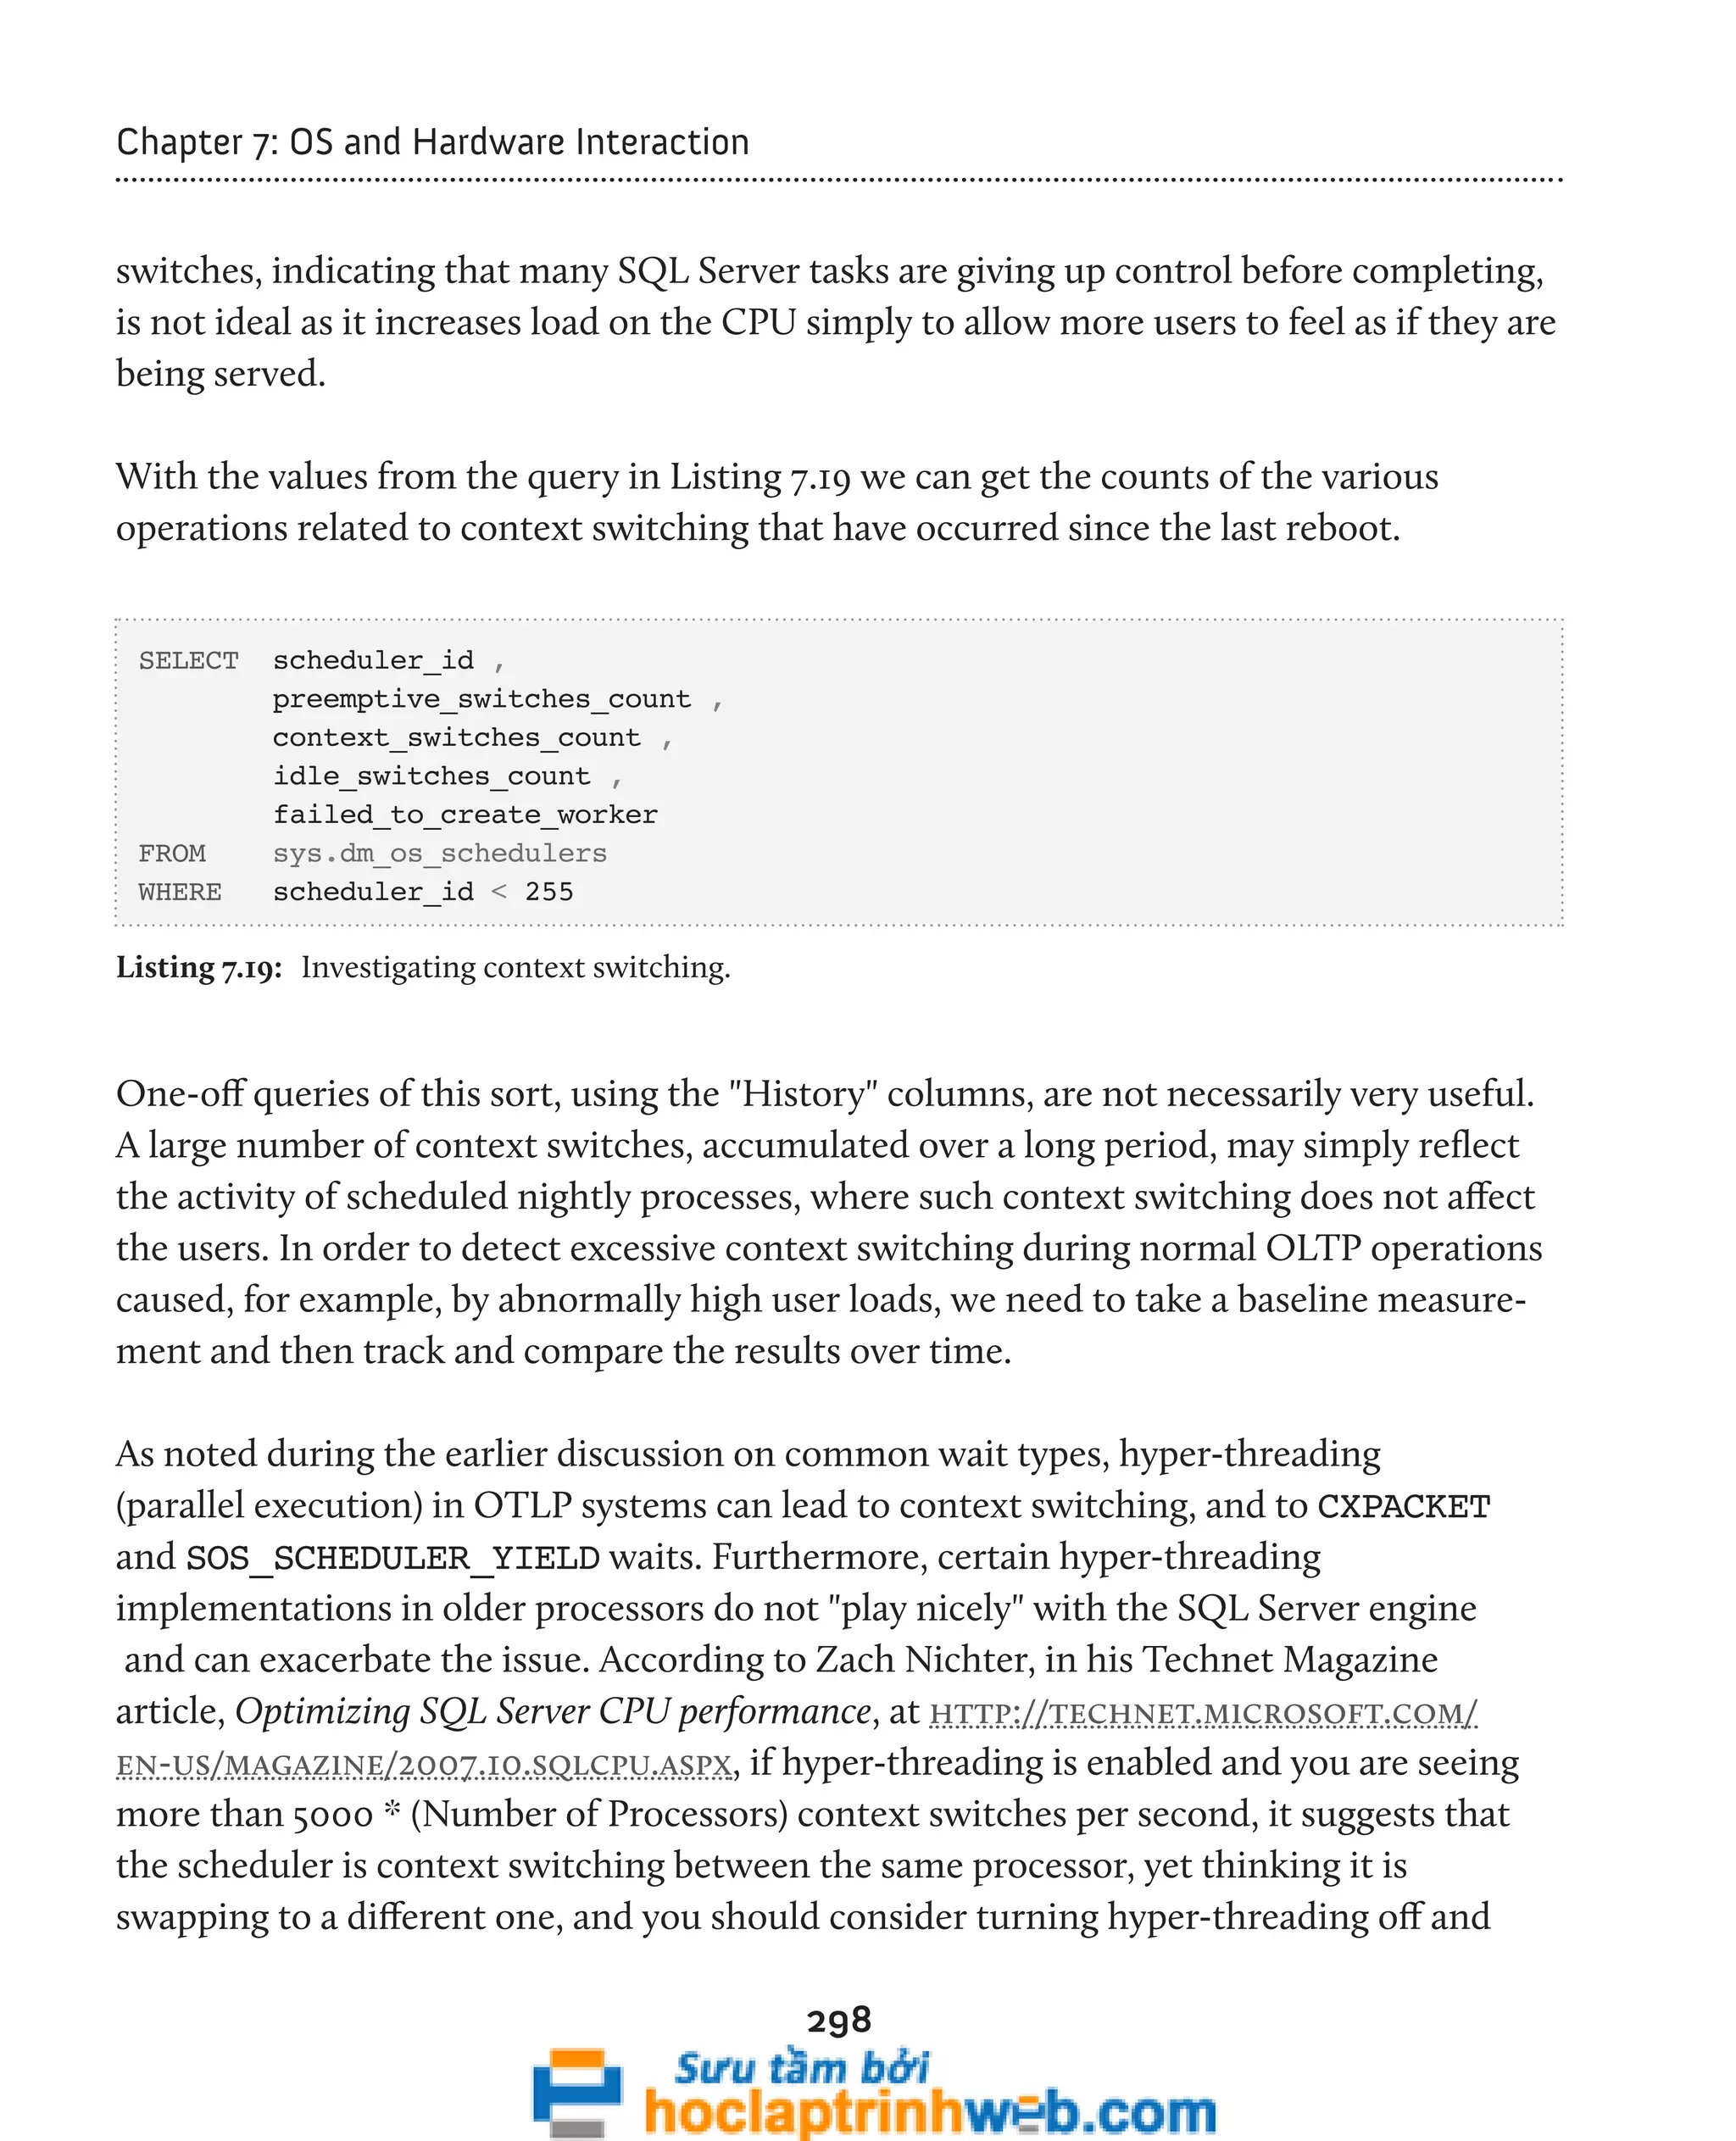
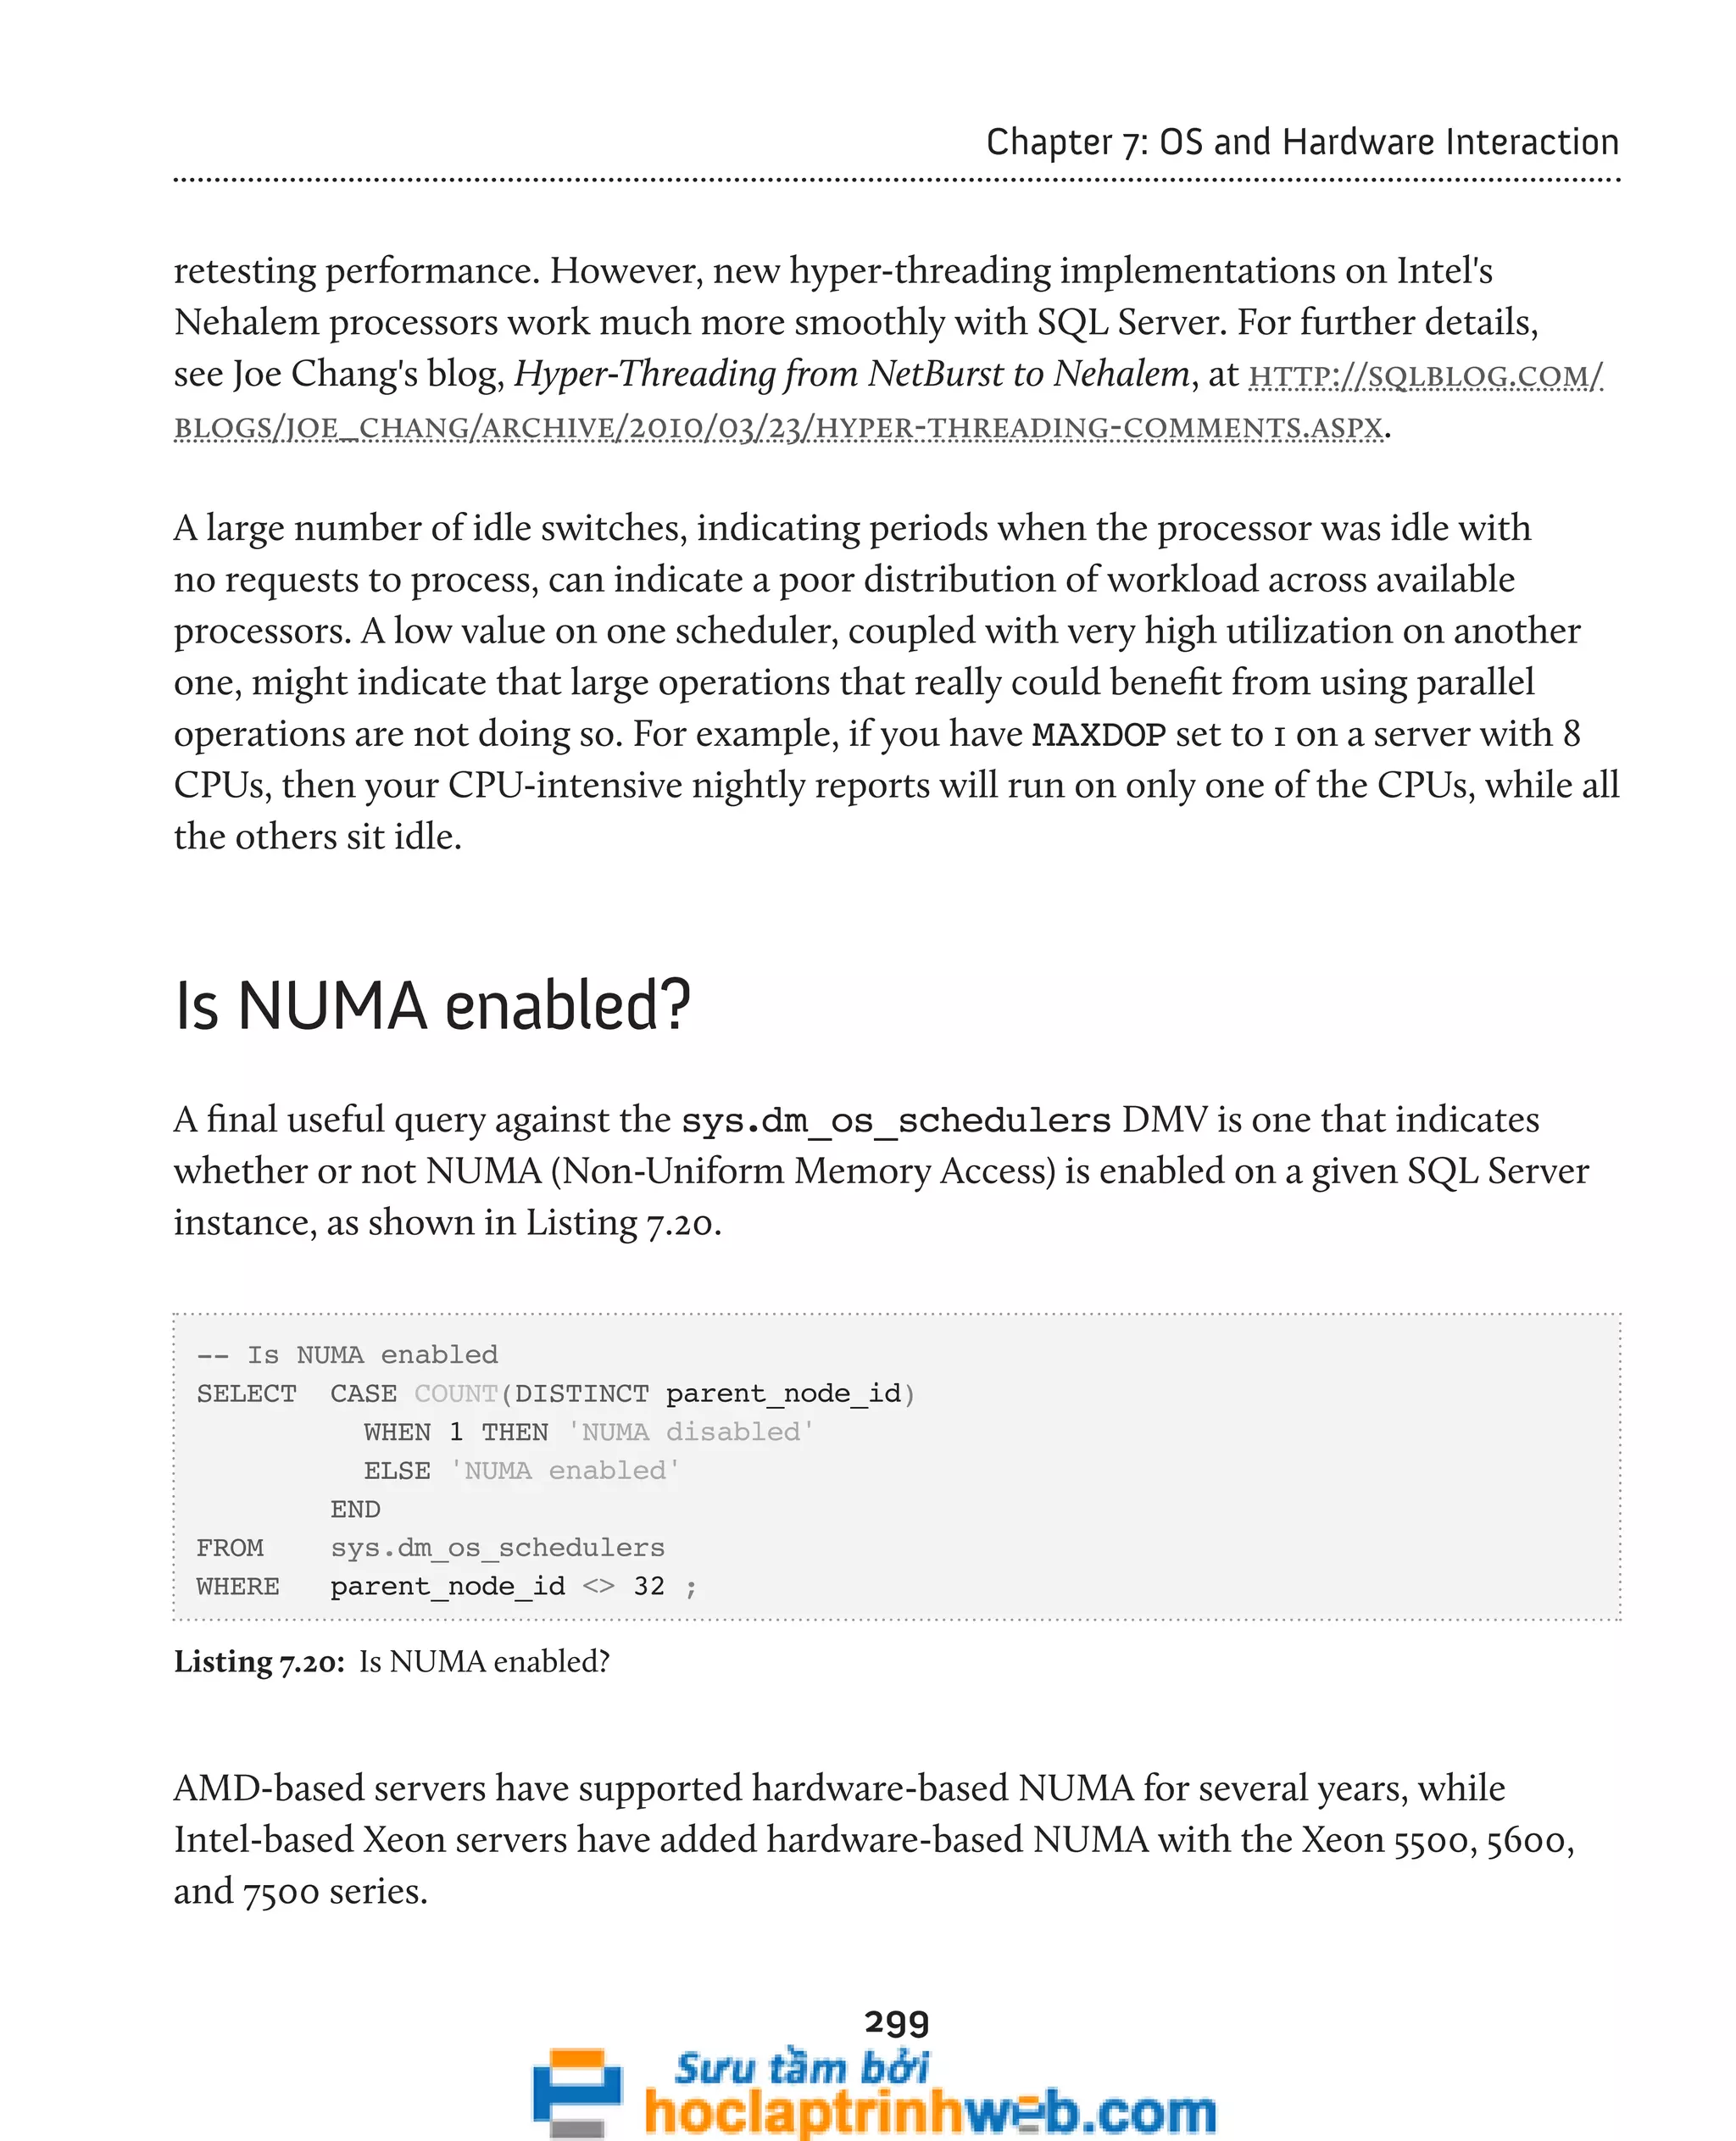
![300
Chapter 7: OS and Hardware Interaction
CPU utilization history
This script uses the sys.dm_os_ring_buffers DMV which, according to
Books Online, is:
Identified for informational purposes only. Not supported. Future compatibility is not guaranteed.
Ooh, that sounds scary! Well, despite the warning and lack of documentation in Books
Online, there are multiple blog posts from Microsoft employees that show examples of
using this DMV. The one shown in Listing 7.21 returns the CPU utilization history over
the last 30 minutes, both in terms of CPU usage by the SQL Server process and total
CPU usage by all other processes on your database server. This query only works on
SQL Server 2008 and SQL Server 2008 R2.
-- Get CPU Utilization History for last 30 minutes (in one minute intervals)
-- This version works with SQL Server 2008 and SQL Server 2008 R2 only
DECLARE @ts_now BIGINT = ( SELECT cpu_ticks / ( cpu_ticks / ms_ticks )
FROM sys.dm_os_sys_info
) ;
SELECT TOP ( 30 )
SQLProcessUtilization AS [SQL Server Process CPU Utilization] ,
SystemIdle AS [System Idle Process] ,
100 - SystemIdle – SQLProcessUtilization
AS [Other Process CPU Utilization] ,
DATEADD(ms, -1 * ( @ts_now - [timestamp] ), GETDATE())
AS [Event Time]
FROM ( SELECT record.value('(./Record/@id)[1]', 'int') AS record_id ,
record.value('(./Record/SchedulerMonitorEvent/
SystemHealth/SystemIdle)[1]', 'int')
AS [SystemIdle] ,
record.value('(./Record/SchedulerMonitorEvent/
SystemHealth/ProcessUtilization)[1]',
'int')
AS [SQLProcessUtilization] ,
[timestamp]
FROM ( SELECT [timestamp] ,](https://image.slidesharecdn.com/ebookperformancetuningdavidsonford-141014034404-conversion-gate02/75/c-300-2048.jpg)
![301
Chapter 7: OS and Hardware Interaction
CONVERT(XML, record) AS [record]
FROM sys.dm_os_ring_buffers
WHERE ring_buffer_type =
N'RING_BUFFER_SCHEDULER_MONITOR'
AND record LIKE N'%<SystemHealth>%'
) AS x
) AS y
ORDER BY record_id DESC ;
Listing 7.21: Recent CPU utilization.
The query subtracts the SystemIdle value and the SQL Server Process value from
100 to arrive at the value for all other processes on the server. The results provide a handy
way to see your recent CPU utilization history for the server as a whole, for SQL Server,
and for other processes that are running on your database server (such as management
software). Even though the granularity is only one minute, it's very useful to be able to
see this from T-SQL rather than having to look at PerfMon or use WMI to get CPU
utilization information. In our experimentation, it's only been possible to retrieve 256
minutes-worth of data from this query.
Investigating Memory Usage
In this section, we'll discuss the DMVs that allow us to investigate how SQL Server is
using memory, and provide useful indicators of possible memory pressure.
Memory pressure in SQL Server is often a little harder to spot and diagnose than CPU
pressure. High CPU usage will immediately make itself known via that fact that one or
more of the CPUs will be pegged at 90+ percent for long periods of time. However, in
basic terms, SQL Server will use as much memory as you give it. SQL Server uses a central
memory broker mechanism to efficiently distribute memory across all components that
need it. Any memory that is not currently required by another component remains in the
buffer pool (in the form of 8-KB pages), and is used to cache pages read from disk.](https://image.slidesharecdn.com/ebookperformancetuningdavidsonford-141014034404-conversion-gate02/75/c-301-2048.jpg)
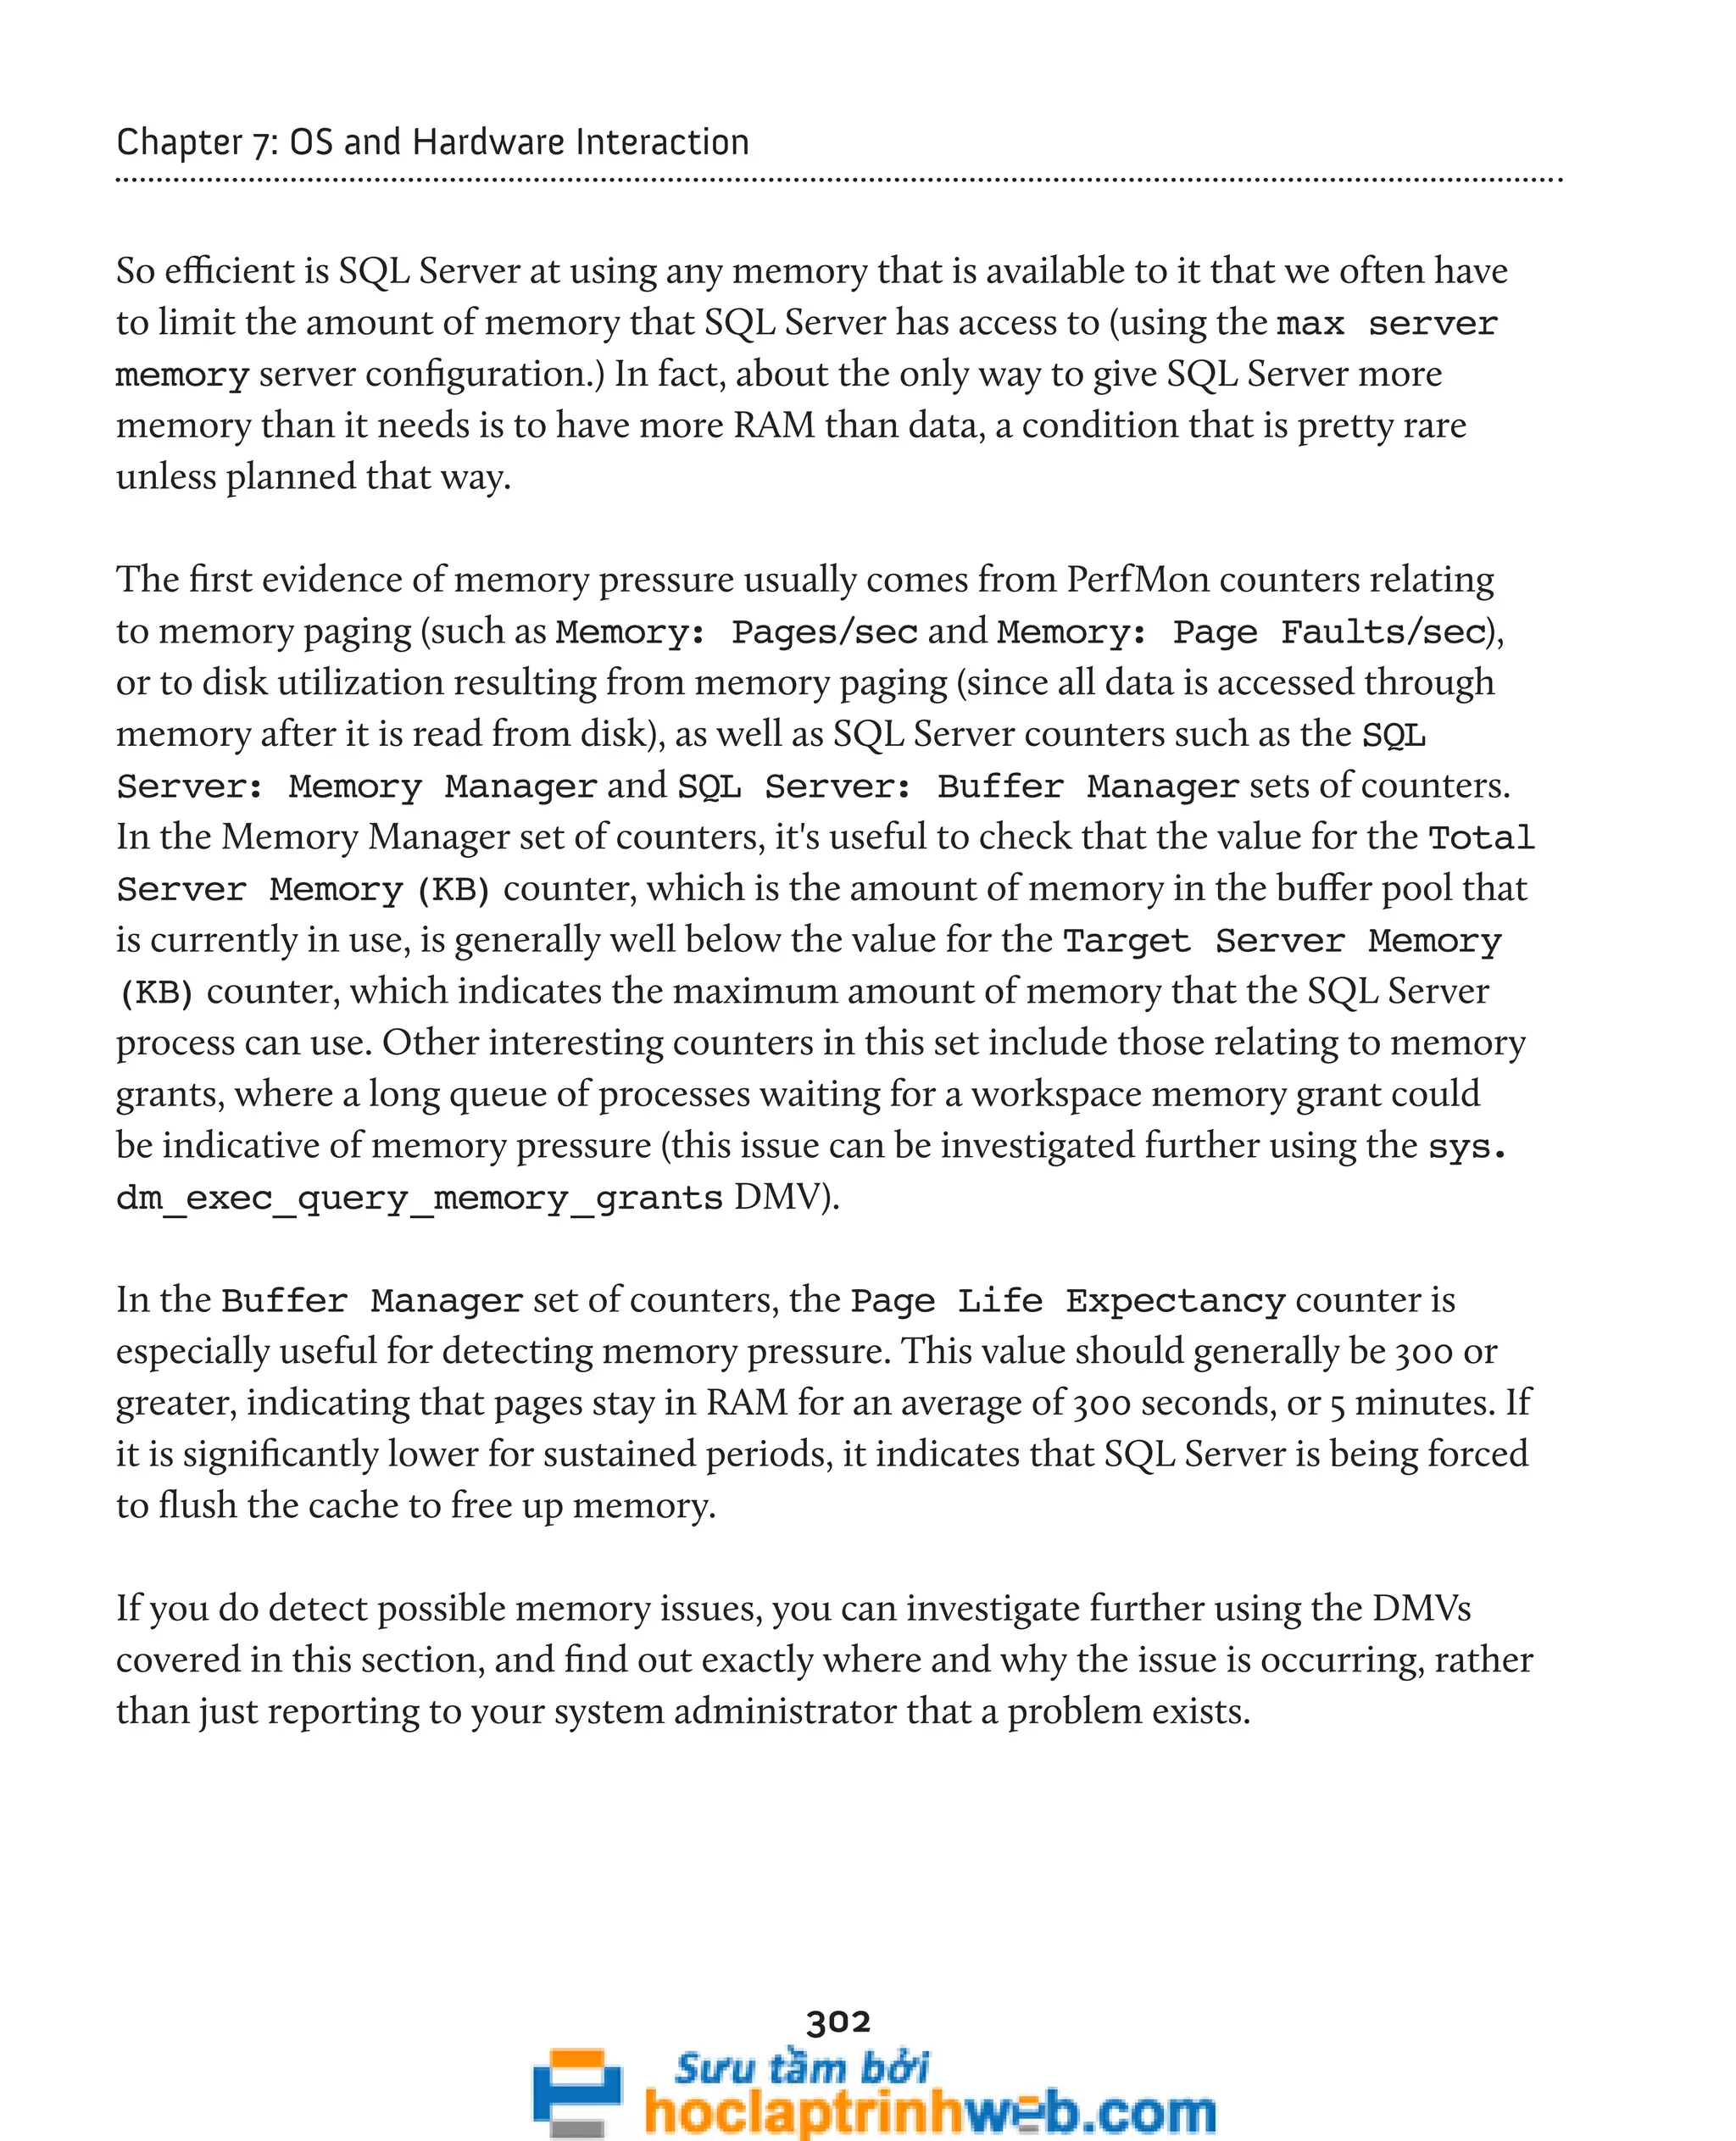
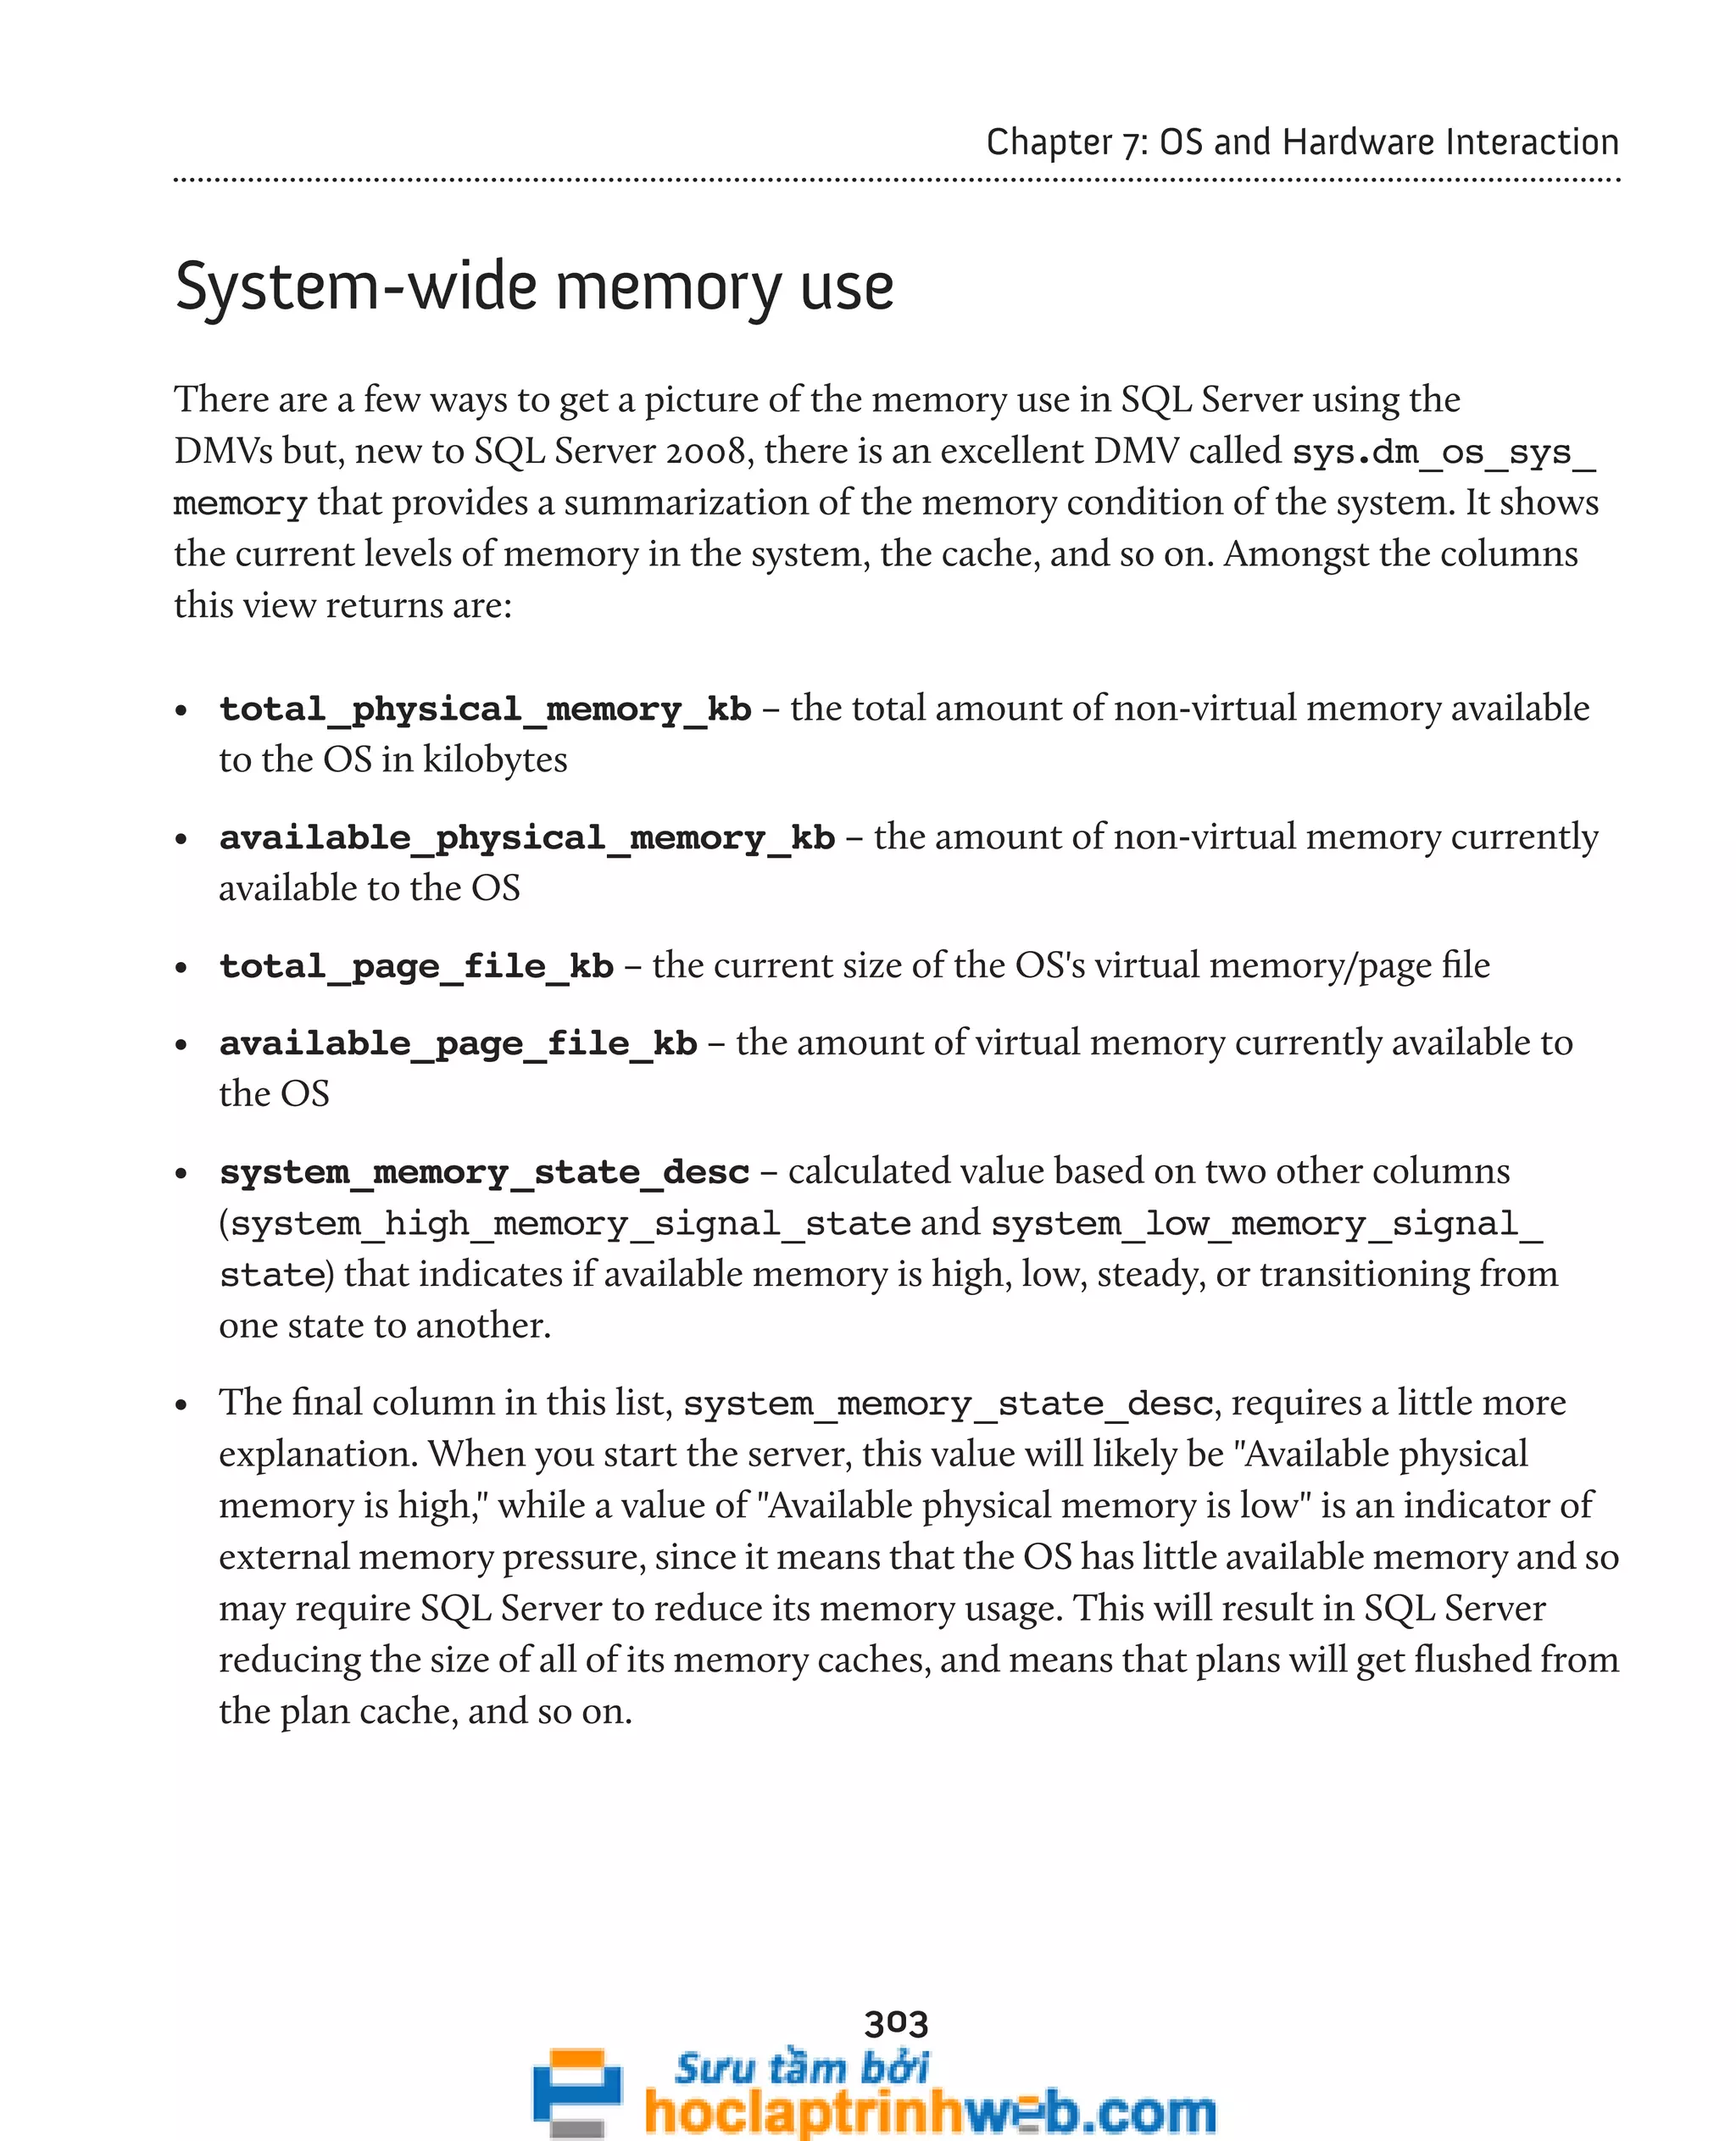
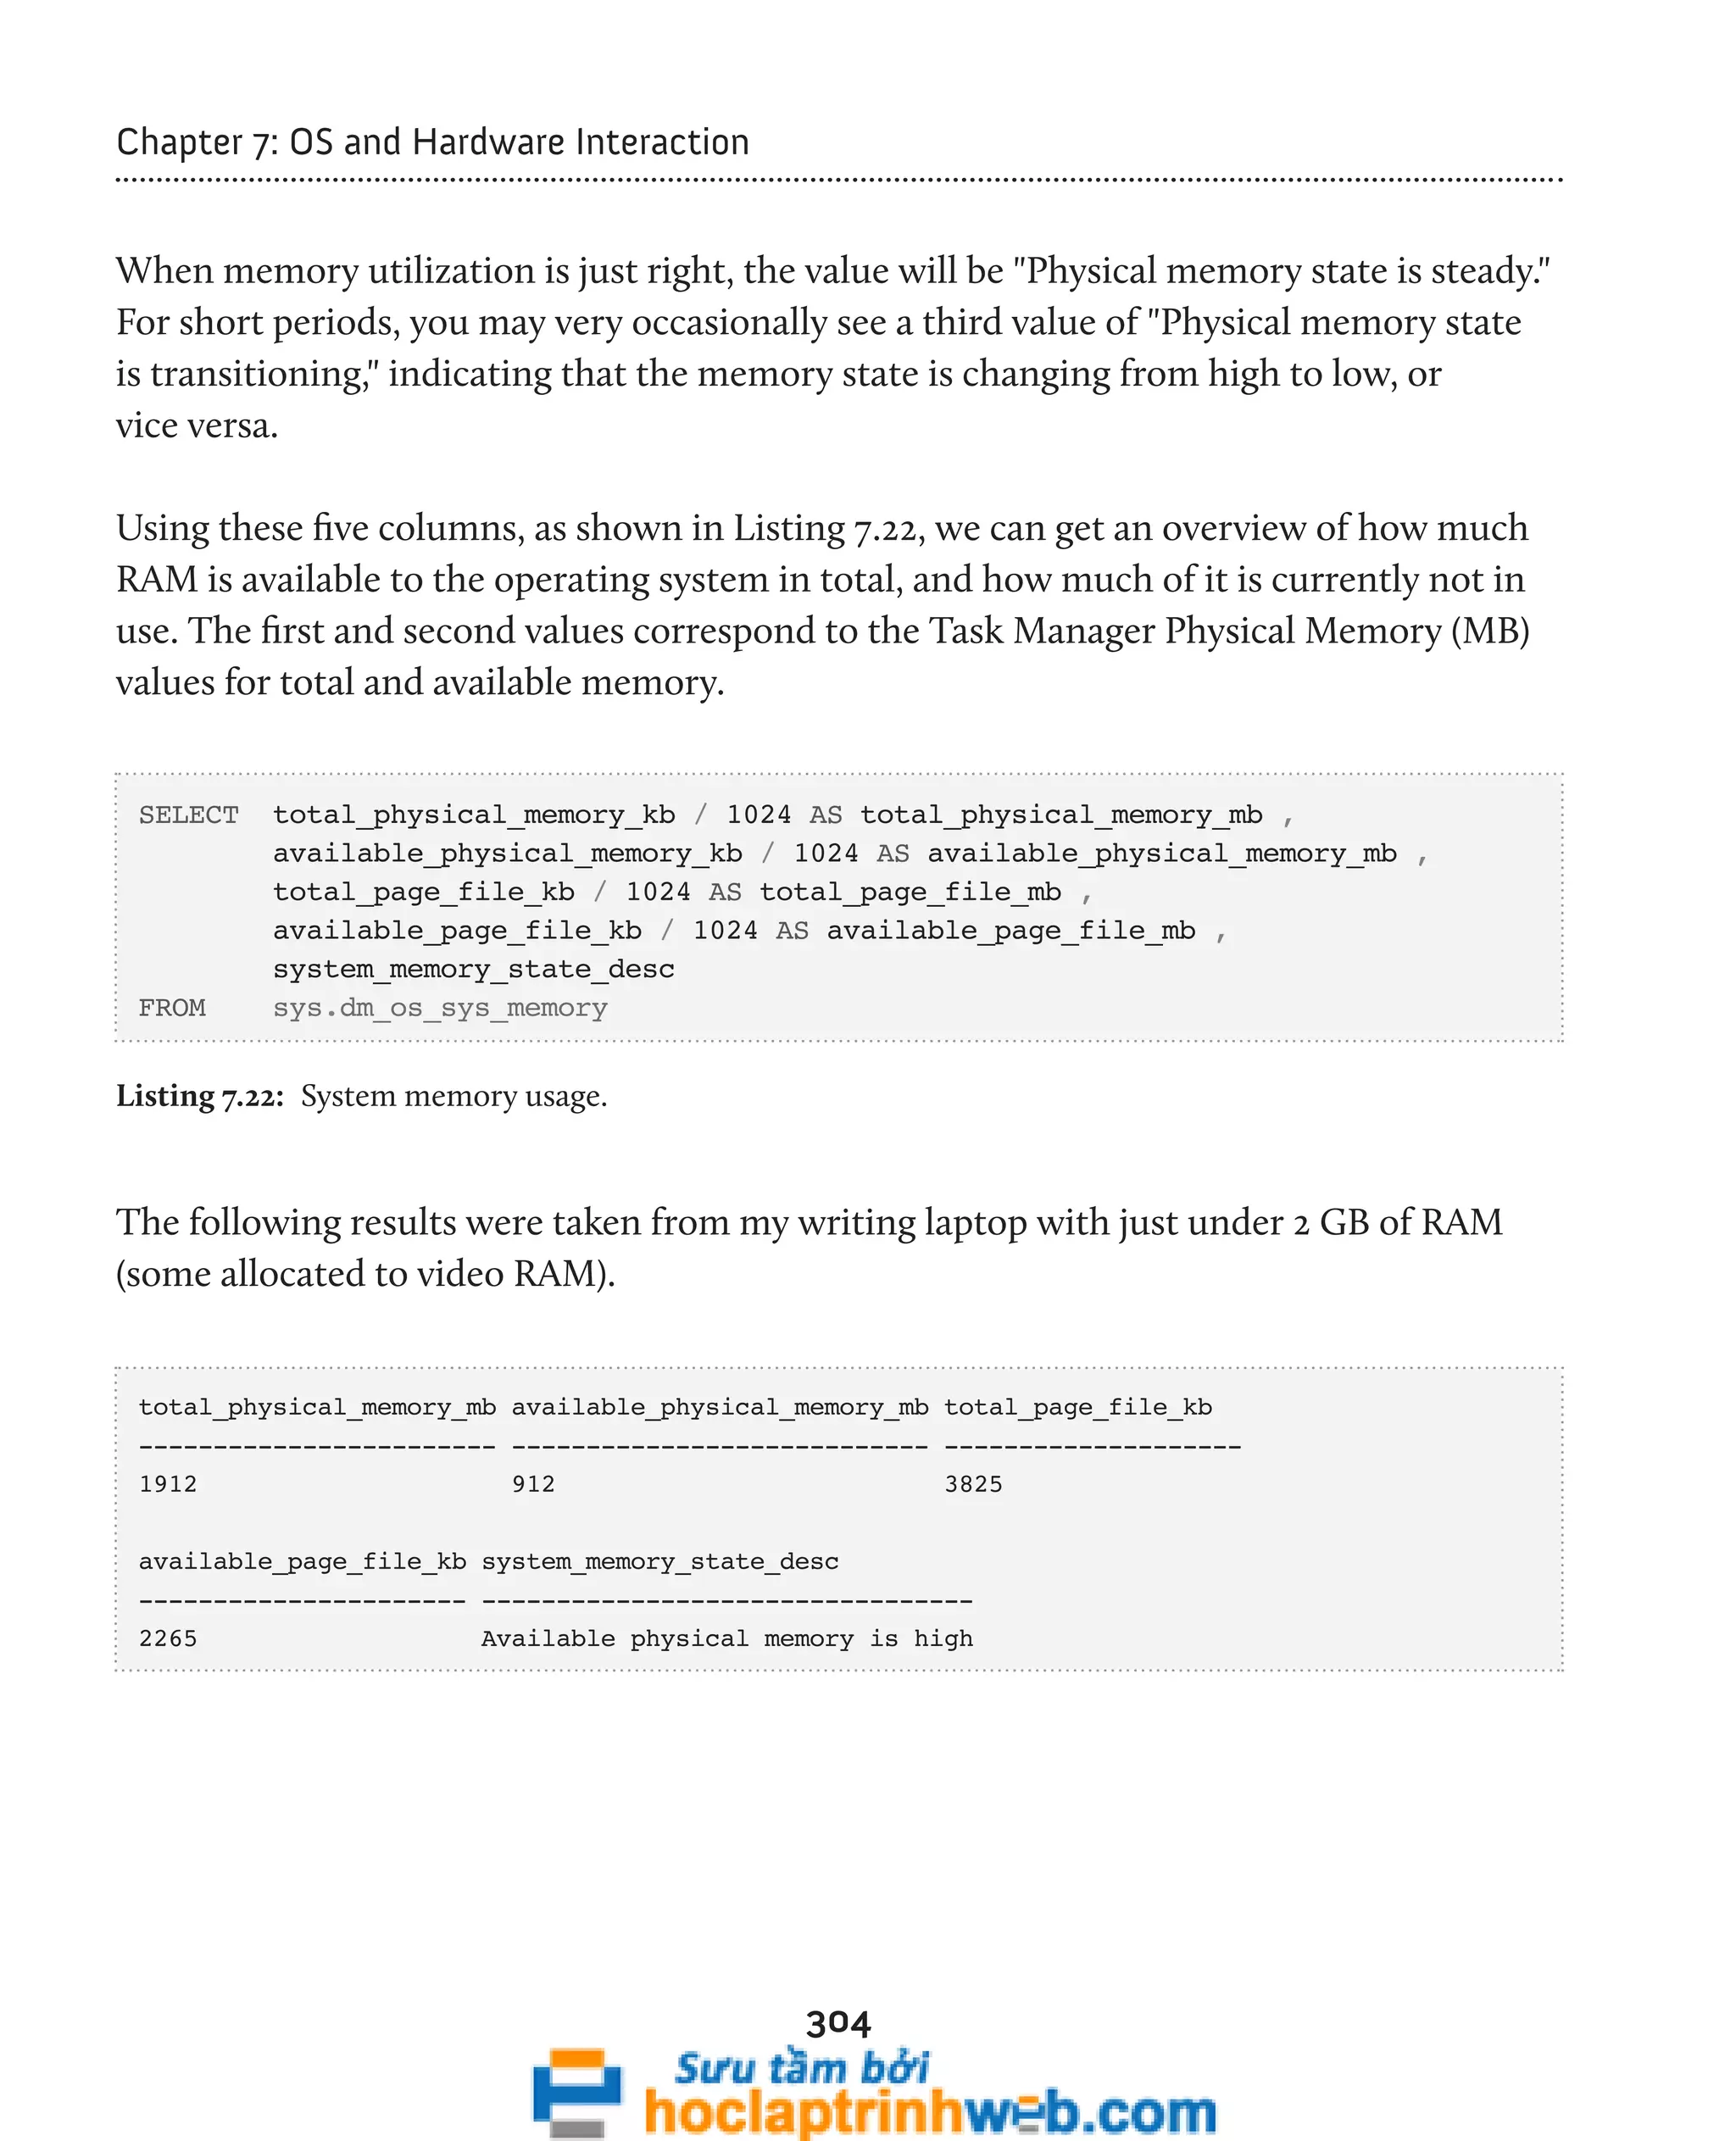
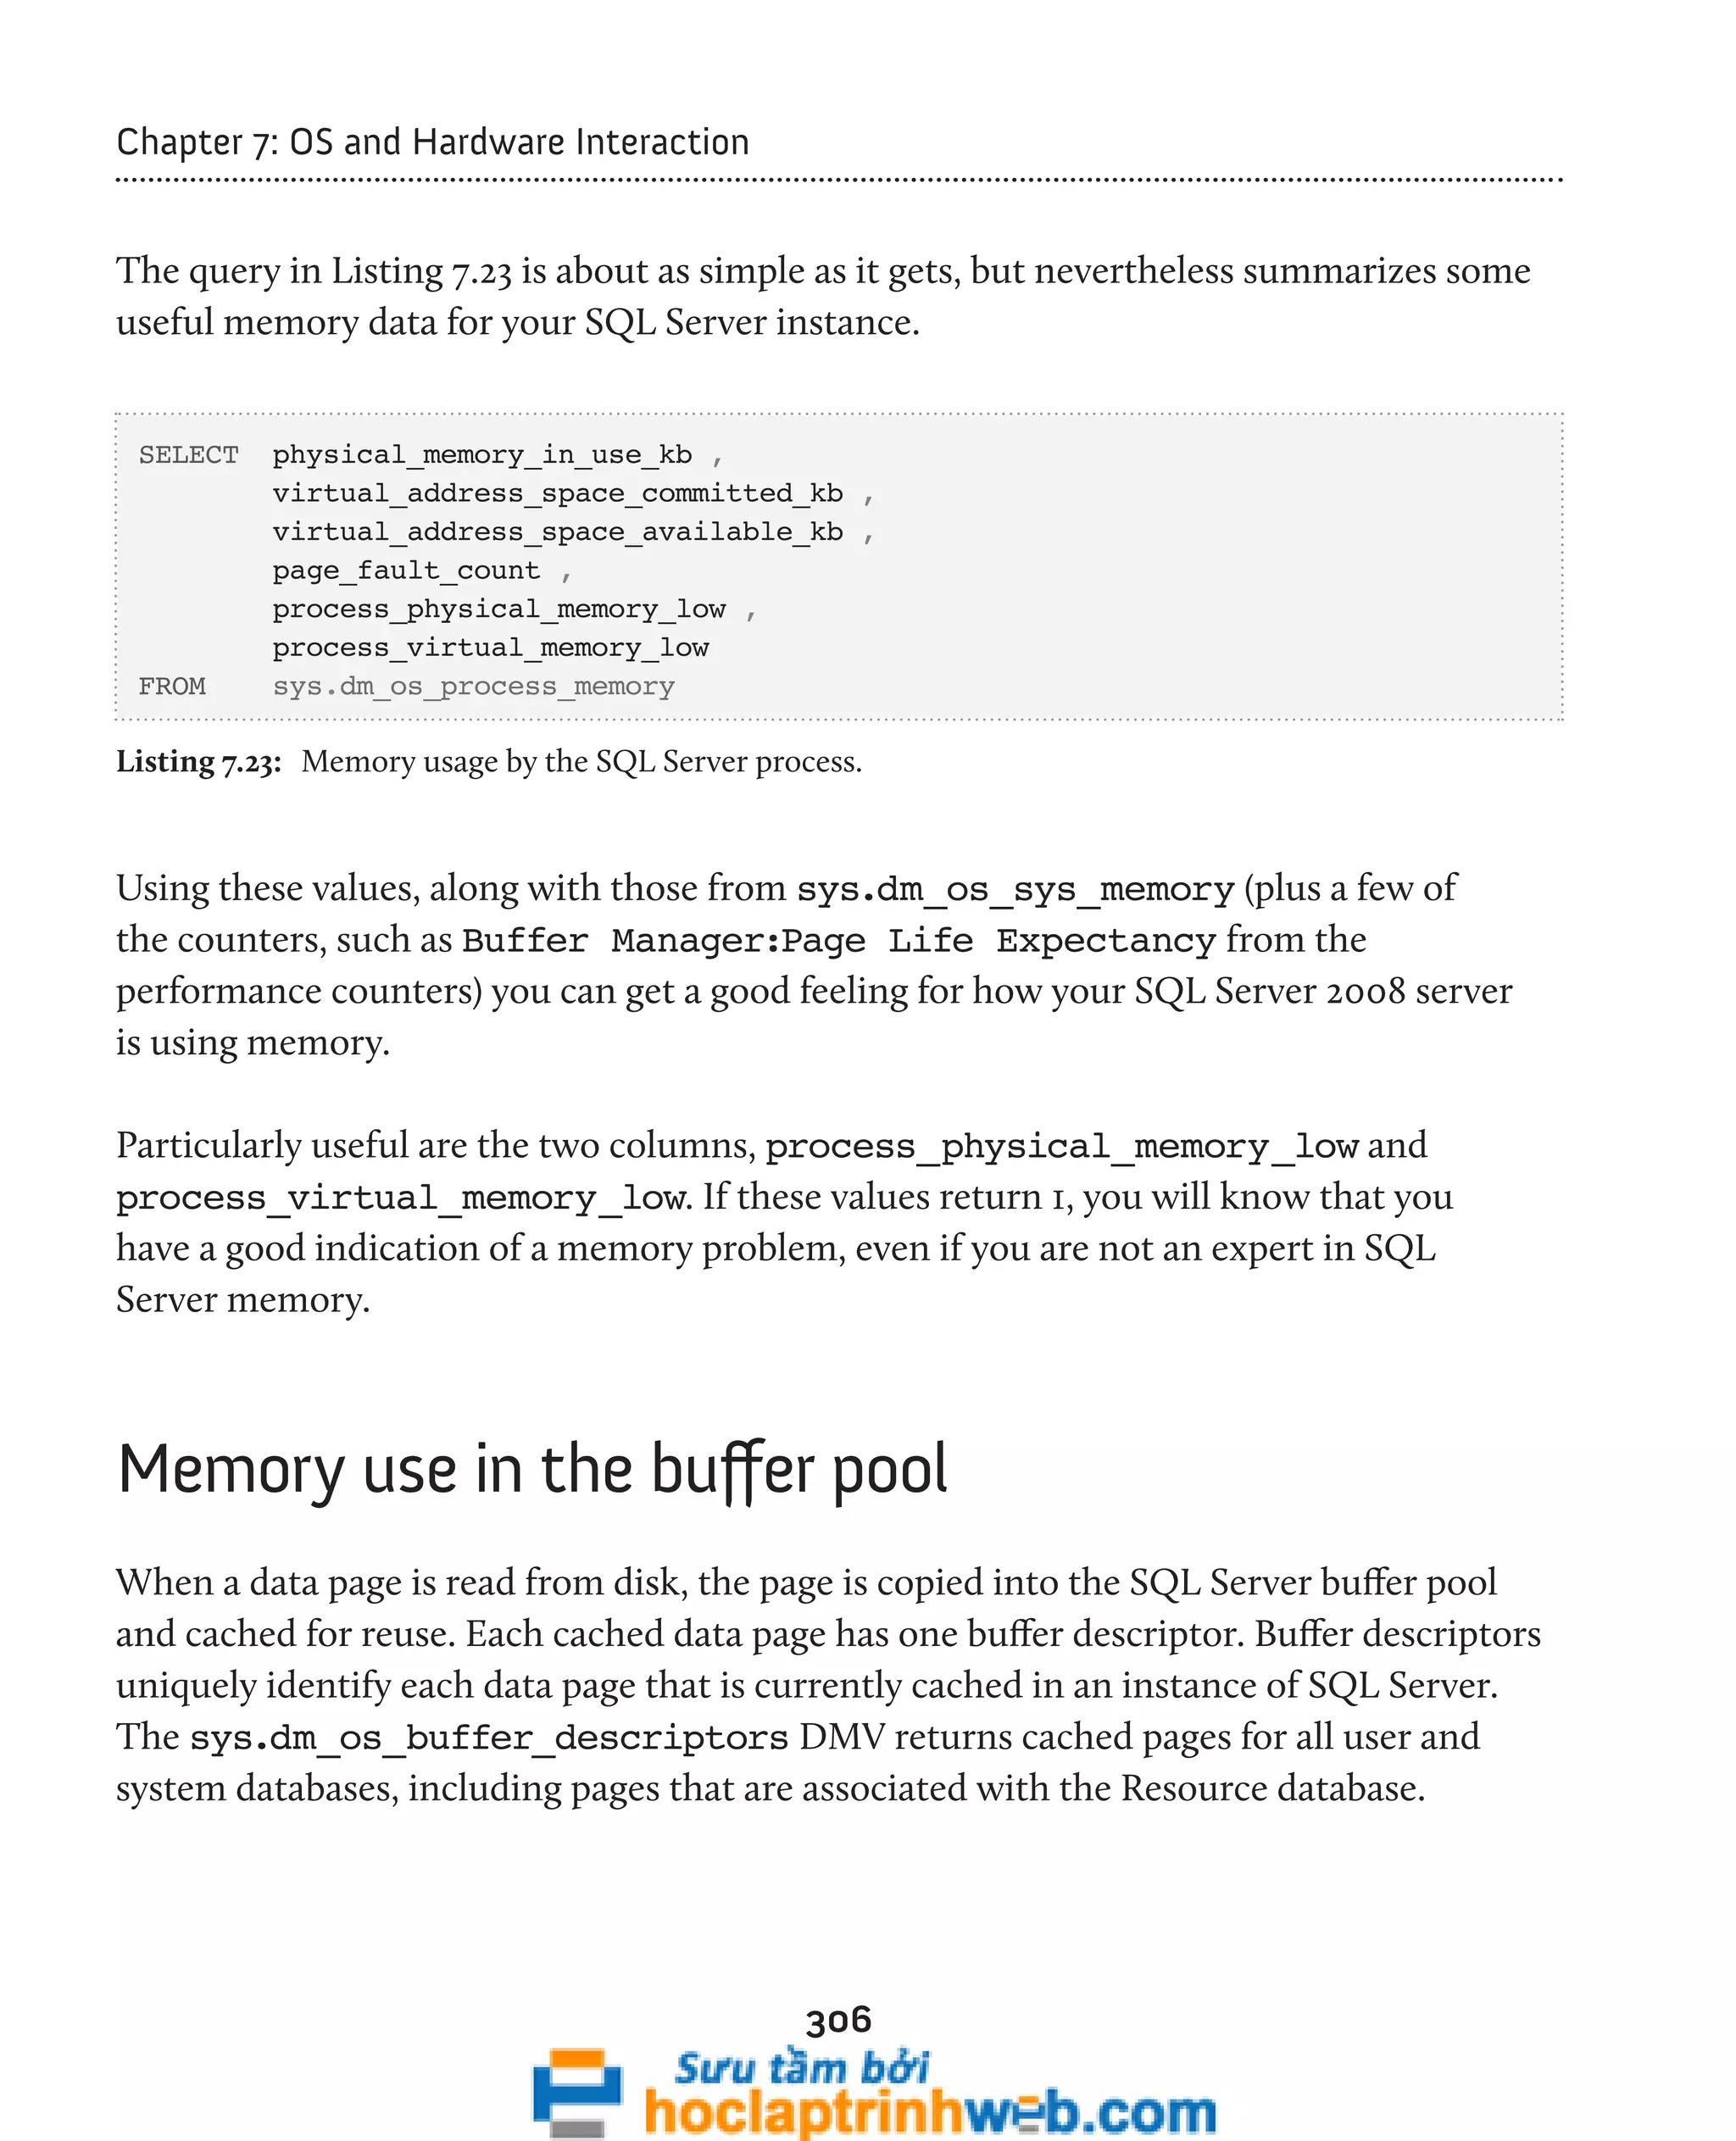
![307
Chapter 7: OS and Hardware Interaction
As stated by Books Online:
Returns information about all the data pages that are currently in the SQL Server buffer pool. The output of
this view can be used to determine the distribution of database pages in the buffer pool according to database,
object, or type.
Listing 7.24 shows that this DMV can tell how your buffer pool memory is being used, i.e.
which databases and which indexes are using the most memory in the buffer pool.
-- Get total buffer usage by database
SELECT DB_NAME(database_id) AS [Database Name] ,
COUNT(*) * 8 / 1024.0 AS [Cached Size (MB)]
FROM sys.dm_os_buffer_descriptors
WHERE database_id > 4 -- exclude system databases
AND database_id <> 32767 -- exclude ResourceDB
GROUP BY DB_NAME(database_id)
ORDER BY [Cached Size (MB)] DESC ;
-- Breaks down buffers by object (table, index) in the buffer pool
SELECT OBJECT_NAME(p.[object_id]) AS [ObjectName] ,
p.index_id ,
COUNT(*) / 128 AS [Buffer size(MB)] ,
COUNT(*) AS [Buffer_count]
FROM sys.allocation_units AS a
INNER JOIN sys.dm_os_buffer_descriptors
AS b ON a.allocation_unit_id = b.allocation_unit_id
INNER JOIN sys.partitions AS p ON a.container_id = p.hobt_id
WHERE b.database_id = DB_ID()
AND p.[object_id] > 100 -- exclude system objects
GROUP BY p.[object_id] ,
p.index_id
ORDER BY buffer_count DESC ;
Listing 7.24: Memory allocation in the buffer pool.](https://image.slidesharecdn.com/ebookperformancetuningdavidsonford-141014034404-conversion-gate02/75/c-307-2048.jpg)
![308
Chapter 7: OS and Hardware Interaction
The first query rolls up buffer pool usage by database. It allows you to determine how
much memory each database is using in the buffer pool. It could help you to decide how
to deploy databases in a consolidation or scale-out effort.
The second query tells you which objects are using the most memory in your buffer pool,
and is filtered by the current database. It shows the table or indexed view name, the index
ID (which will be zero for a heap table), and the amount of memory used in the buffer
pool for that object. It is also a good way to see the effectiveness of data compression in
SQL Server 2008 Enterprise Edition and SQL Server 2008 R2 Enterprise Edition.
Memory clerks and memory grants
Each of the various components in SQL Server has its own memory clerk, responsible for
allocating memory for that component. This DMV provides a high level, point-in-time
picture of the memory clerk processes that manage SQL Server memory. We won't cover
this DMV in detail but, as an example, Listing 7.25 will provide a useful, quick overview of
buffer pool usage for a given instance.
-- Buffer Pool Usage for instance
SELECT TOP(20) [type], SUM(single_pages_kb) AS [SPA Mem, Kb]
FROM sys.dm_os_memory_clerks
GROUP BY [type]
ORDER BY SUM(single_pages_kb) DESC;
Listing 7.25: Buffer pool usage.
Typically, you'll see most memory usage associated such memory clerk types as
CACHESTORE_SQLCP (the cached query plan store for ad hoc SQL) or CACHESTORE_
OBJCP (the store for objects such as triggers, stored procedures, functions, and so on).](https://image.slidesharecdn.com/ebookperformancetuningdavidsonford-141014034404-conversion-gate02/75/c-308-2048.jpg)
![309
Chapter 7: OS and Hardware Interaction
Some of the more obscure memory clerks are not well documented, but an
important one to watch out for when investigating memory issues is MEMORYCLERK_
SQLQERESERVATIONS, which indicates that there may be insufficient memory in the
buffer pool for certain queries to execute.
Such issues should be investigated further using an execution-related DMV, namely
sys.dm_exec_query_memory_grants, which:
Returns information about the queries that have acquired a memory grant or that still require a memory
grant to execute. Queries that do not have to wait on a memory grant will not appear in this view.
This DMV allows you to check for queries that are waiting (or have recently had to wait)
for a memory grant, as demonstrated in Listing 7.26. Although not used in this query,
note that SQL Server 2008 added some new columns to this DMV.
-- Shows the memory required by both running (non-null grant_time)
-- and waiting queries (null grant_time)
-- SQL Server 2008 version
SELECT DB_NAME(st.dbid) AS [DatabaseName] ,
mg.requested_memory_kb ,
mg.ideal_memory_kb ,
mg.request_time ,
mg.grant_time ,
mg.query_cost ,
mg.dop ,
st.[text]
FROM sys.dm_exec_query_memory_grants AS mg
CROSS APPLY sys.dm_exec_sql_text(plan_handle) AS st
WHERE mg.request_time < COALESCE(grant_time, '99991231')
ORDER BY mg.requested_memory_kb DESC ;
-- Shows the memory required by both running (non-null grant_time)
-- and waiting queries (null grant_time)
-- SQL Server 2005 version
SELECT DB_NAME(st.dbid) AS [DatabaseName] ,
mg.requested_memory_kb ,
mg.request_time ,](https://image.slidesharecdn.com/ebookperformancetuningdavidsonford-141014034404-conversion-gate02/75/c-309-2048.jpg)
![310
Chapter 7: OS and Hardware Interaction
mg.grant_time ,
mg.query_cost ,
mg.dop ,
st.[text]
FROM sys.dm_exec_query_memory_grants AS mg
CROSS APPLY sys.dm_exec_sql_text(plan_handle) AS st
WHERE mg.request_time < COALESCE(grant_time, '99991231')
ORDER BY mg.requested_memory_kb DESC ;
Listing 7.26: Which queries have requested, or have had to wait for, large memory grants?
You should periodically run this query multiple times in succession; ideally, you would
want to see few, if any, rows returned each time. If you do see a lot of rows returned each
time, this could be an indication of internal memory pressure.
This query would also help you identify queries that are requesting relatively large
memory grants, perhaps because they are poorly written or because there are missing
indexes that make the query more expensive.
Investigate memory using cache counters
In the previous section, we took a brief look at how memory is allocated to our system
via memory clerks. To get a bit deeper into the cache entries, we are going to look at
sys.dm_os_memory_cache_counters which will give some more detailed statistics
about how cache memory is currently being used by SQL Server across its various caches.
Essentially, this DMV provides a snapshot of cache-usage values, based on current reality.
The column single_pages_kb is the amount of memory allocated via the single-page
allocator. This refers to the 8-KB pages that are taken directly from the buffer pool, for the
cache in question. The column multi_pages_kb is the amount of memory allocated by
using the multiple-page allocator of the memory node. This memory is allocated outside
the buffer pool and takes advantage of the virtual allocator of the memory nodes.](https://image.slidesharecdn.com/ebookperformancetuningdavidsonford-141014034404-conversion-gate02/75/c-310-2048.jpg)

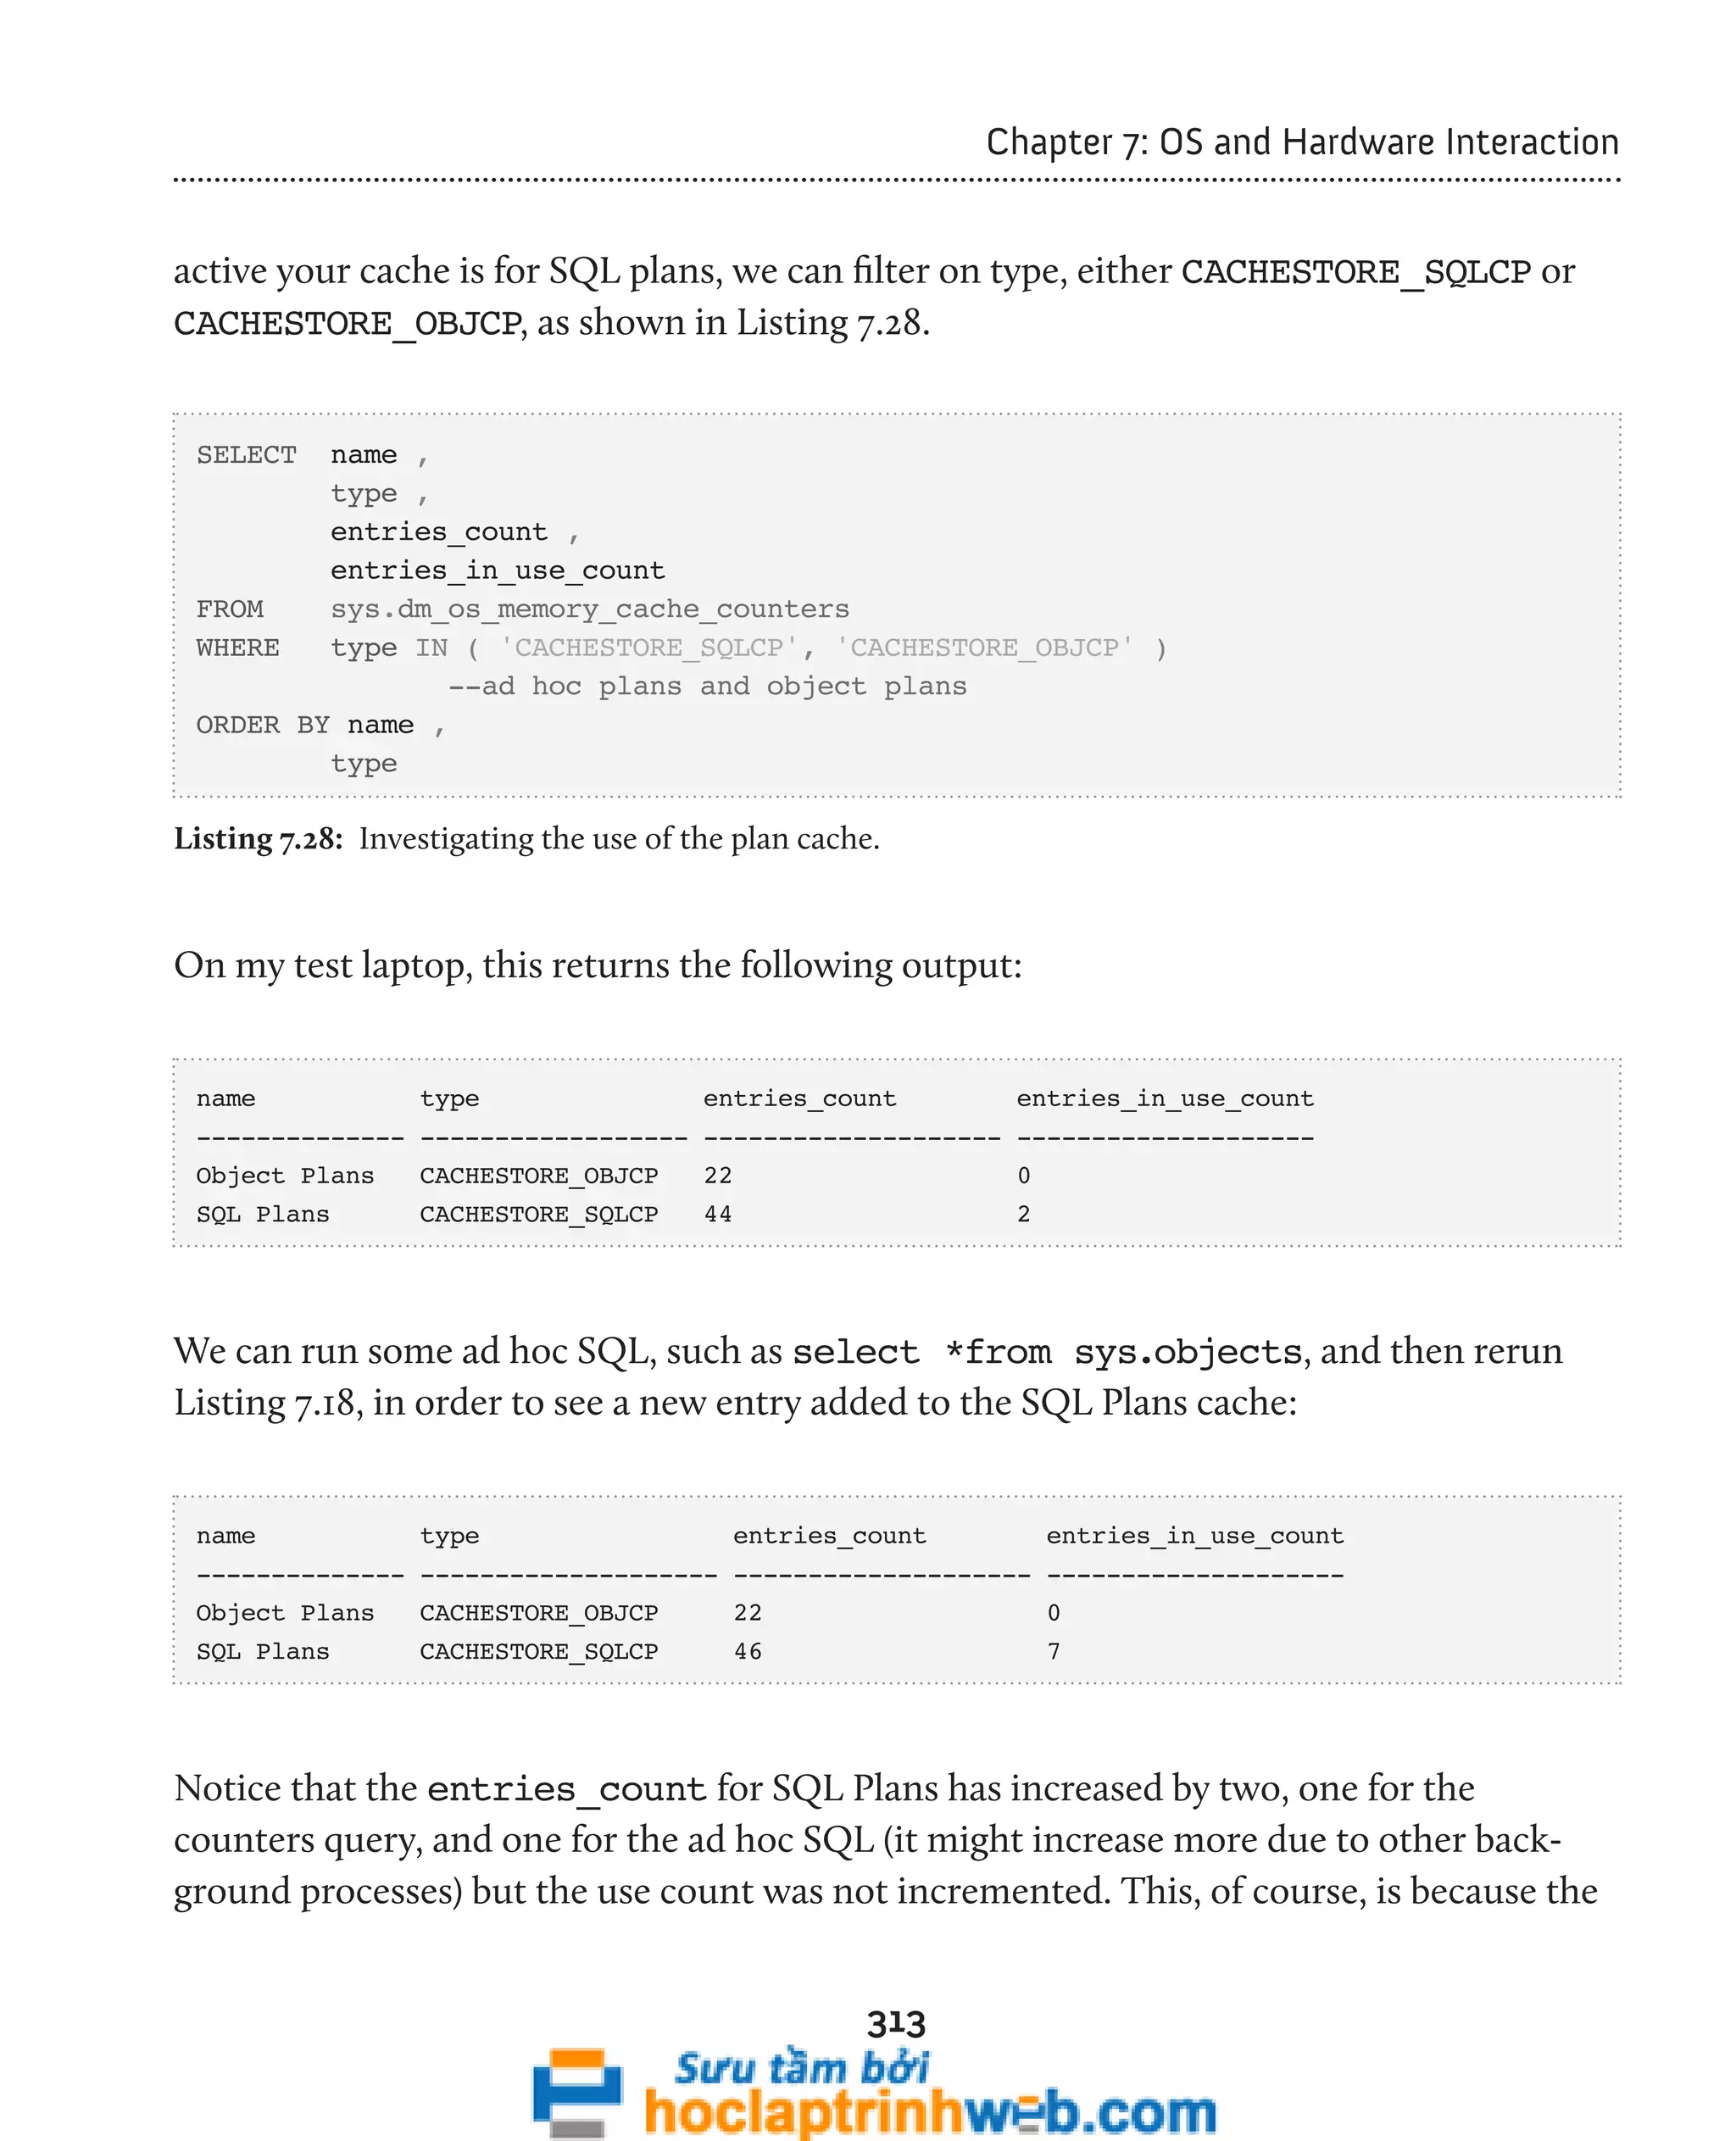
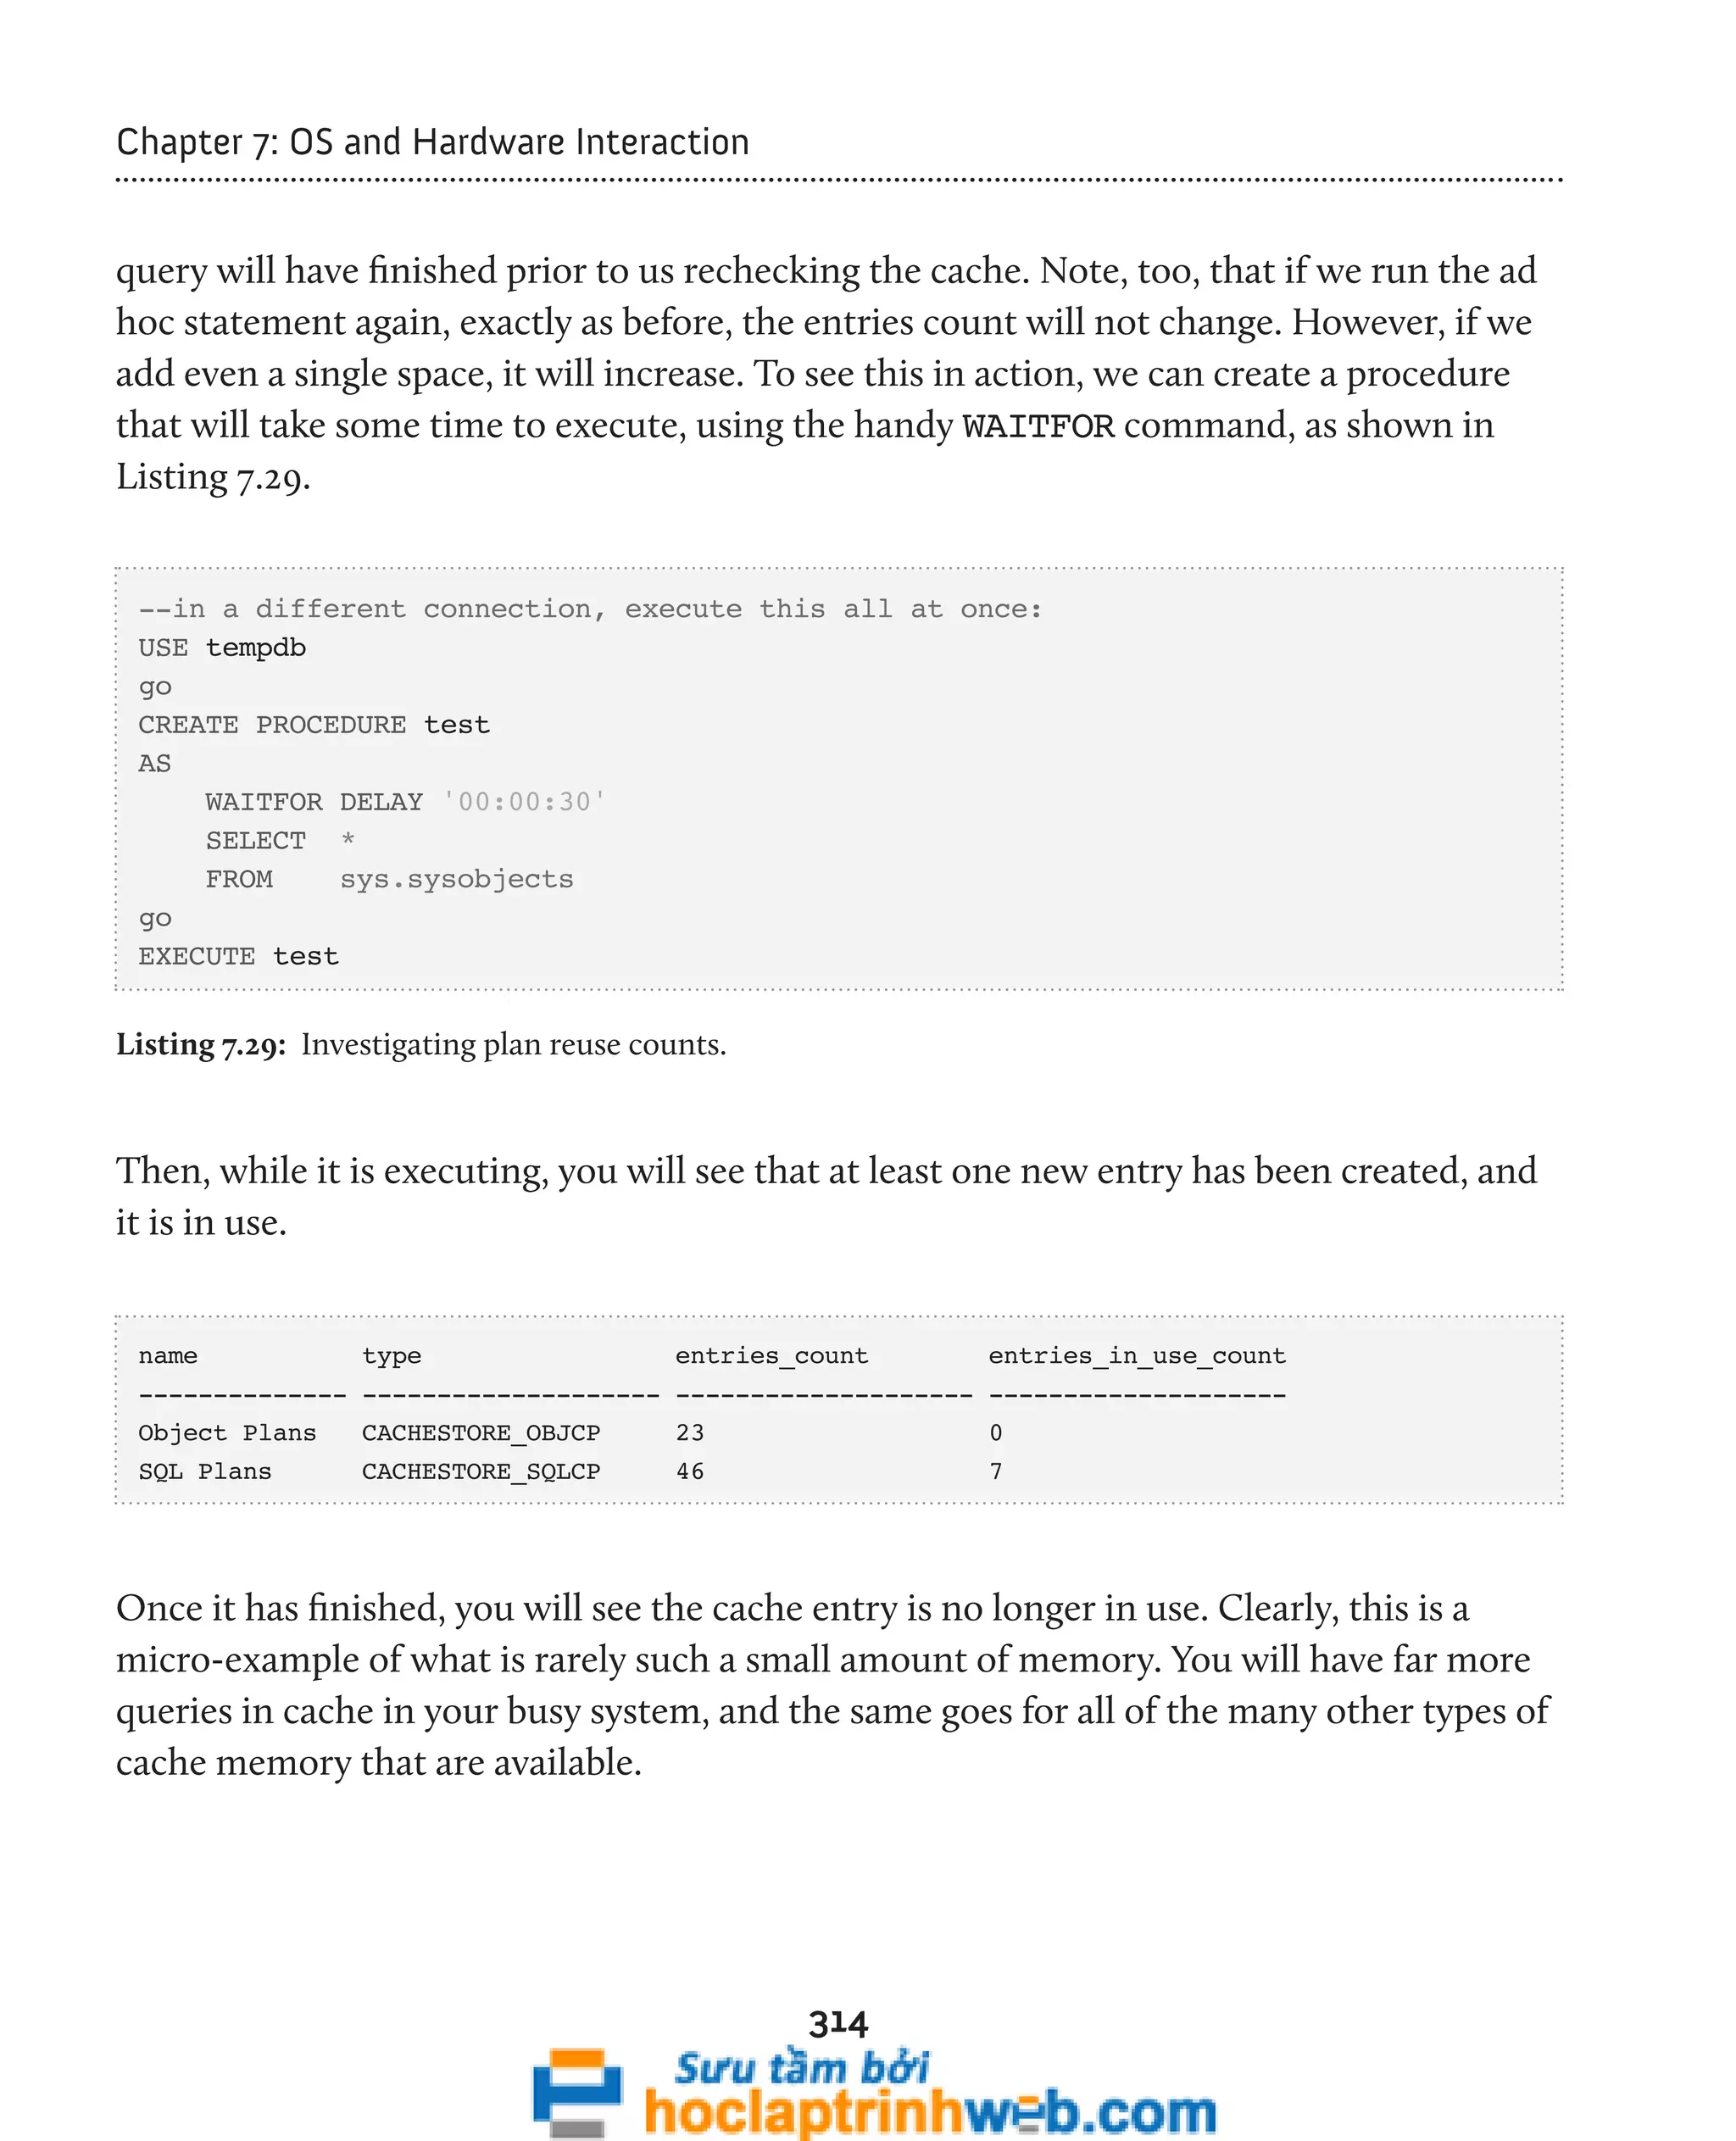
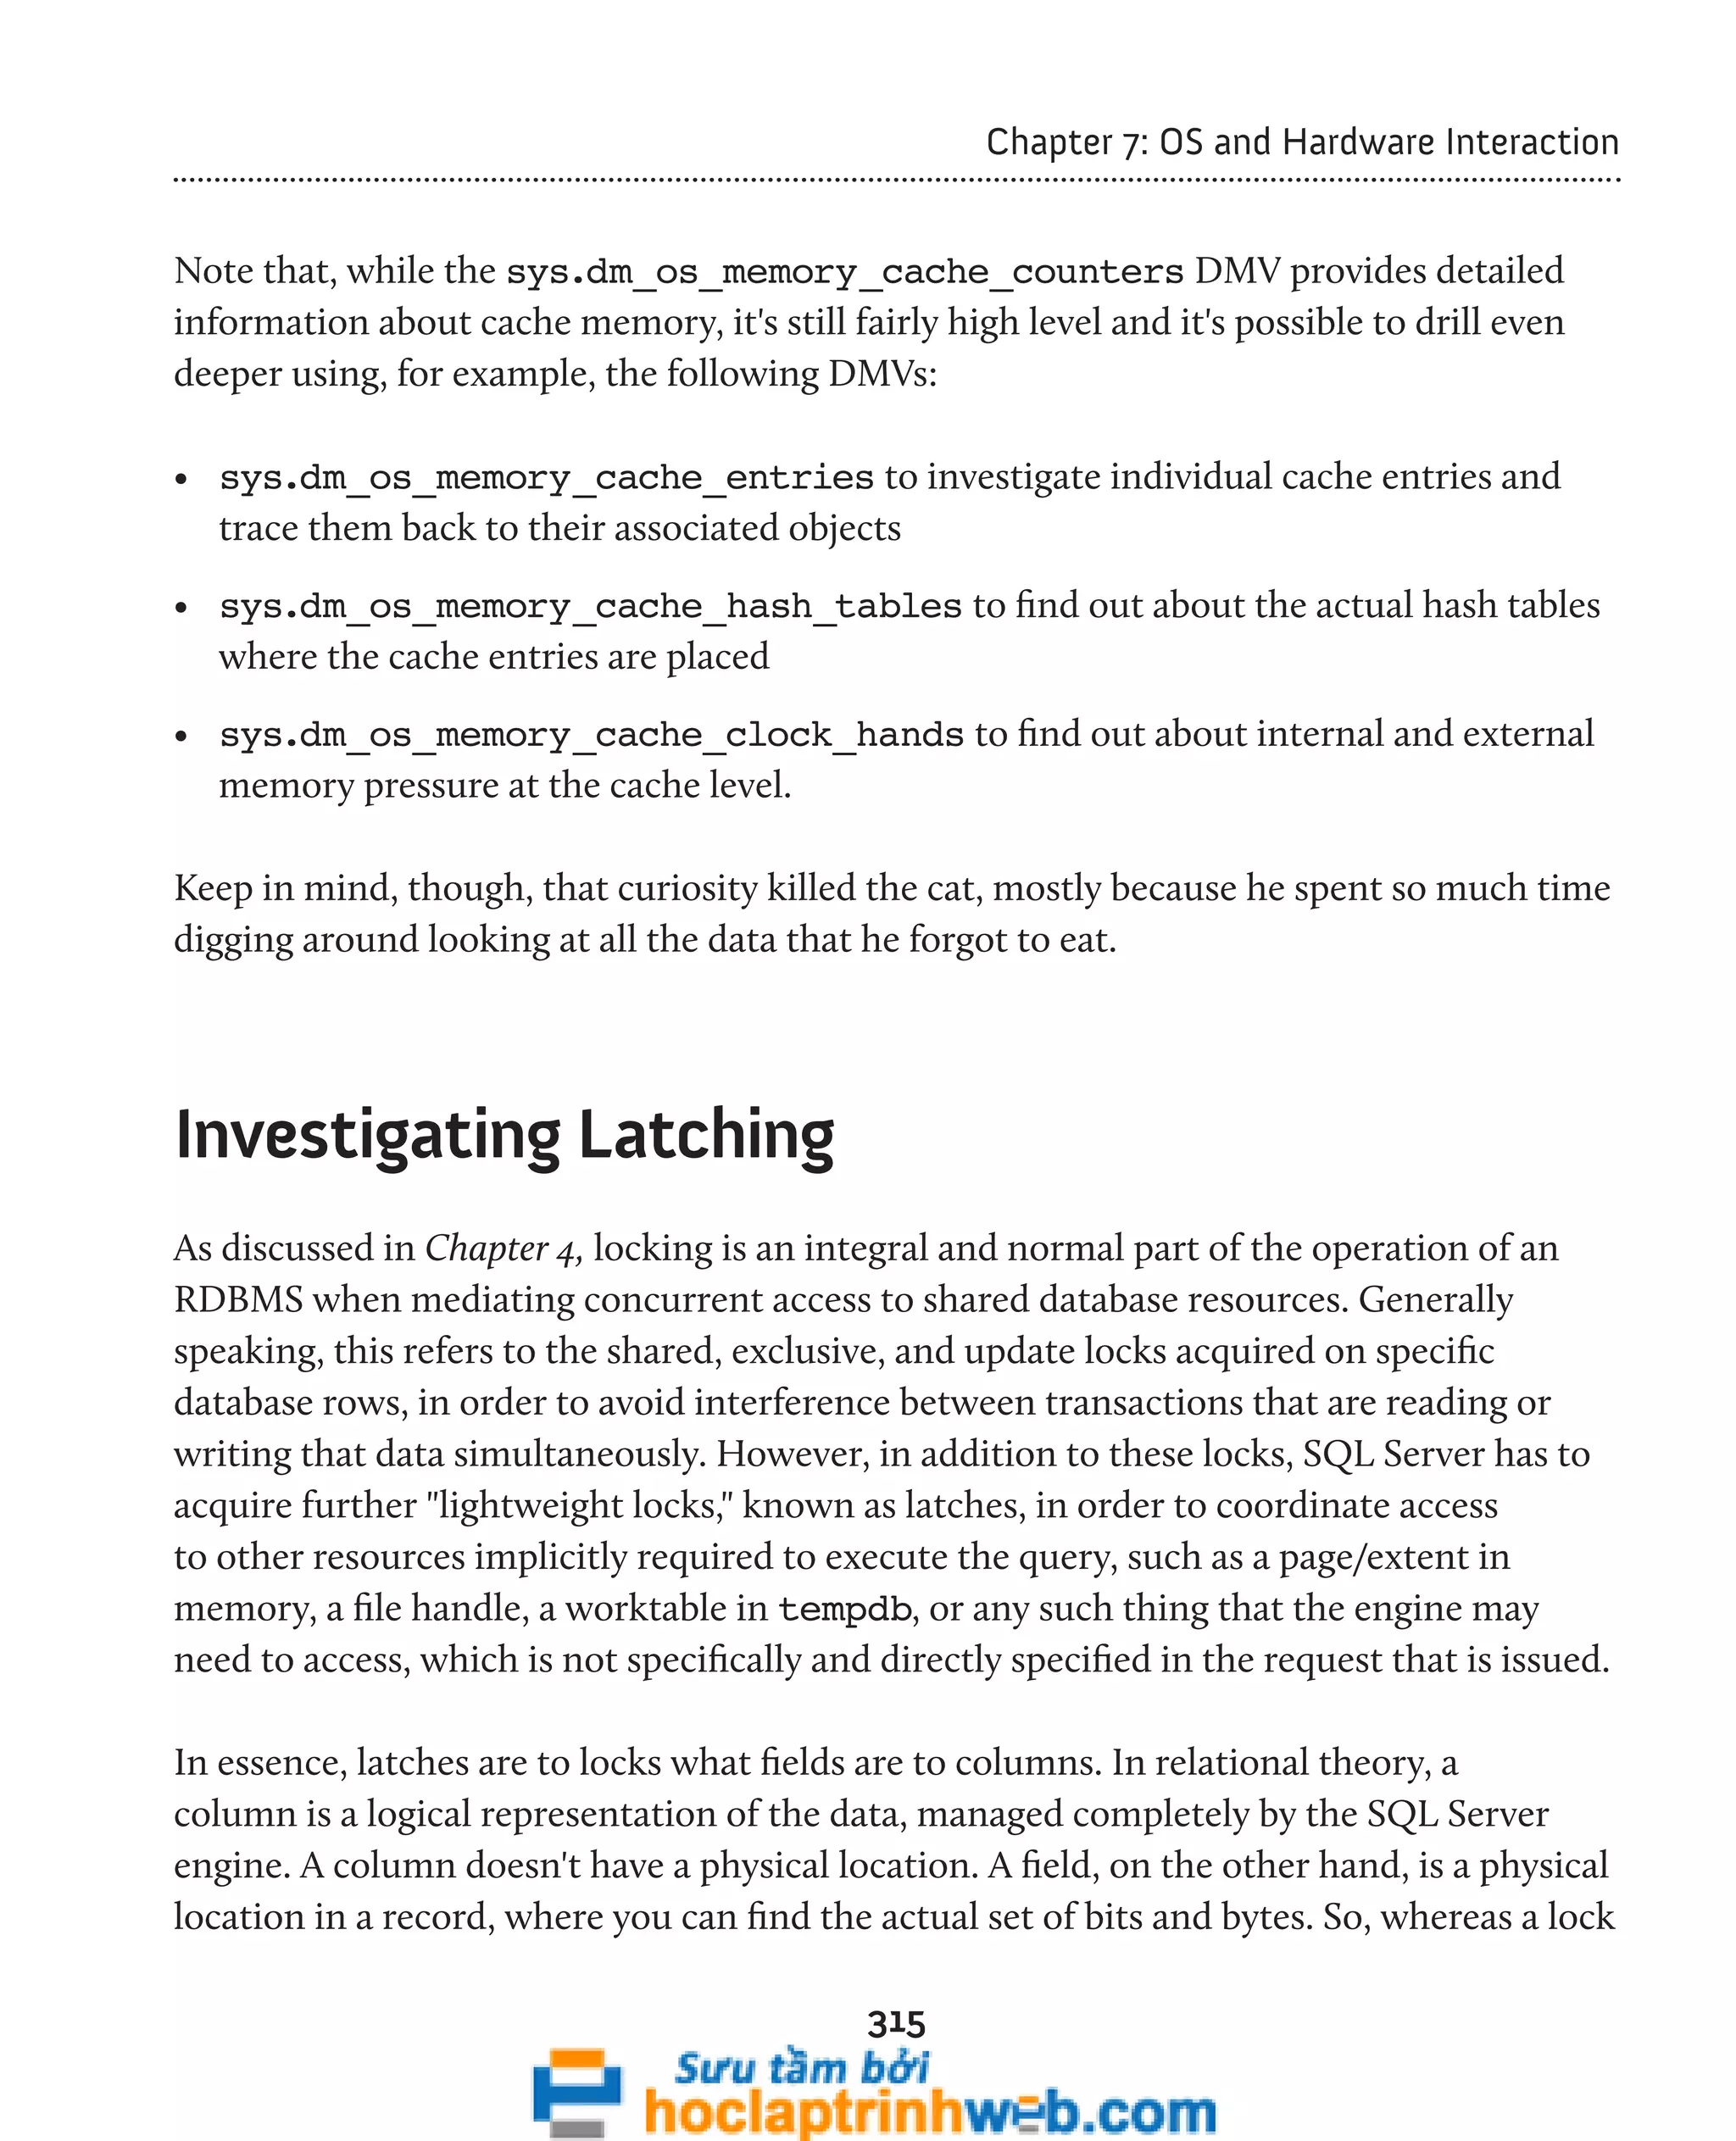
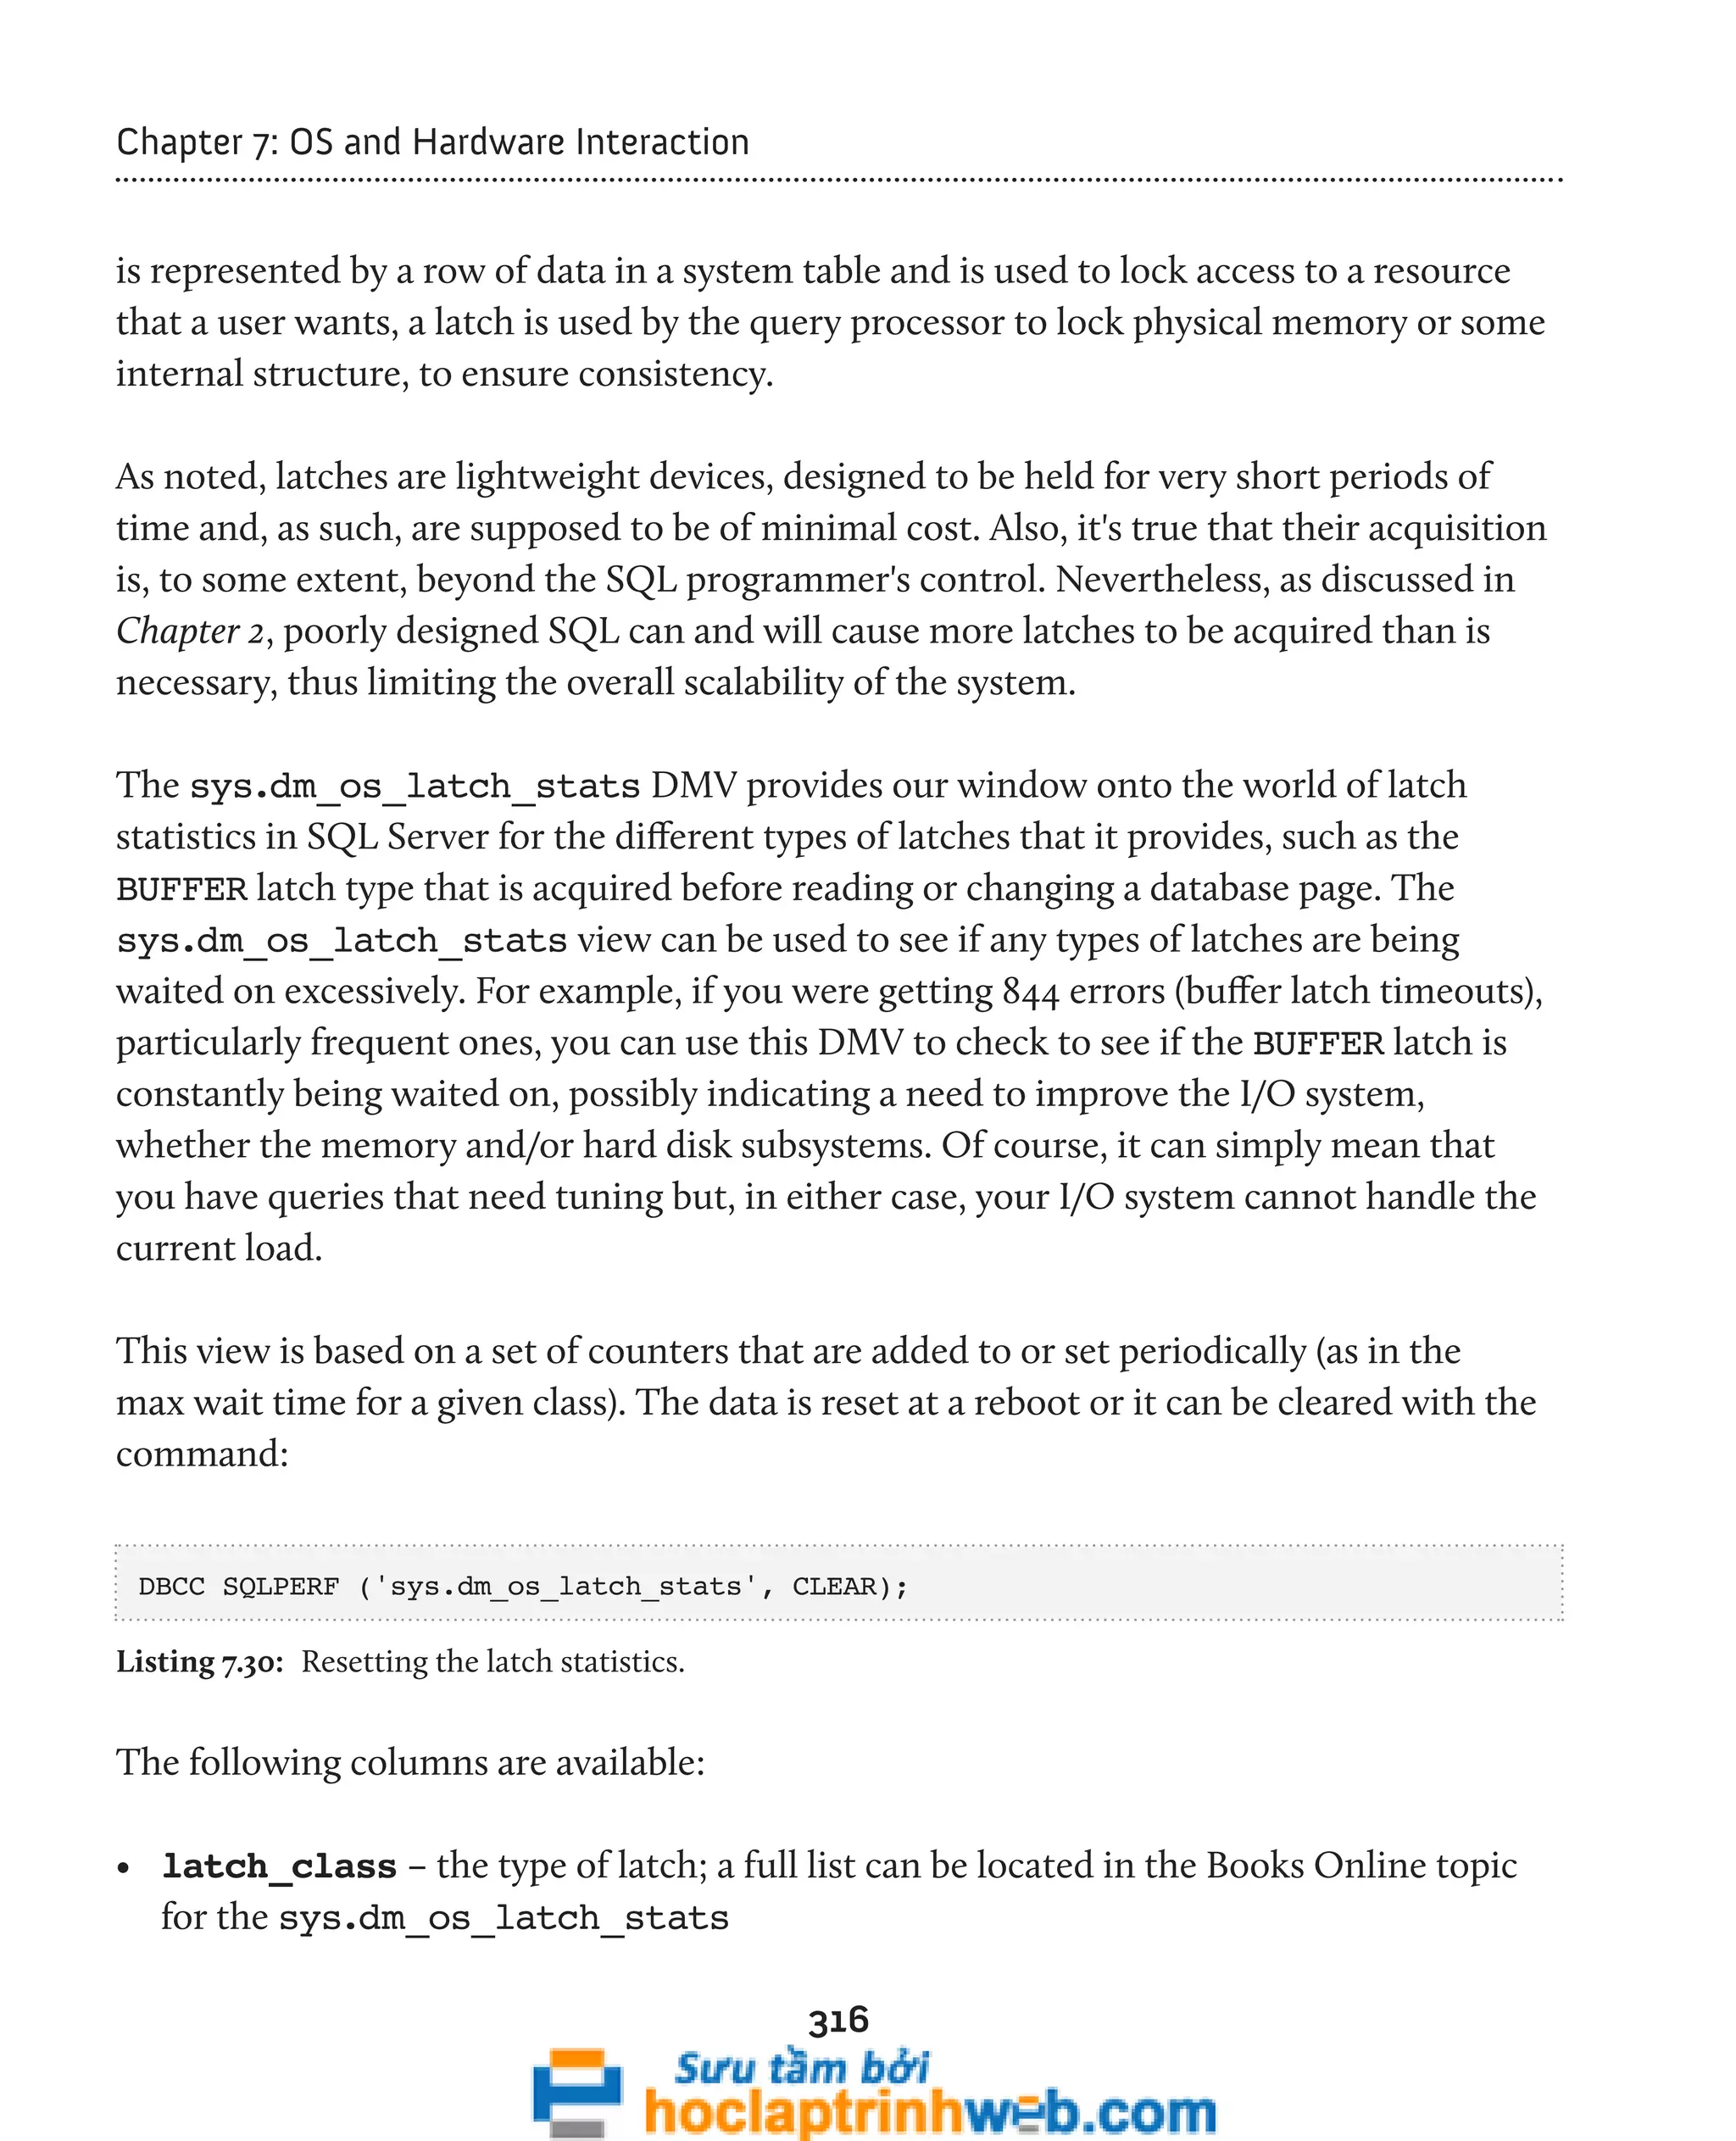
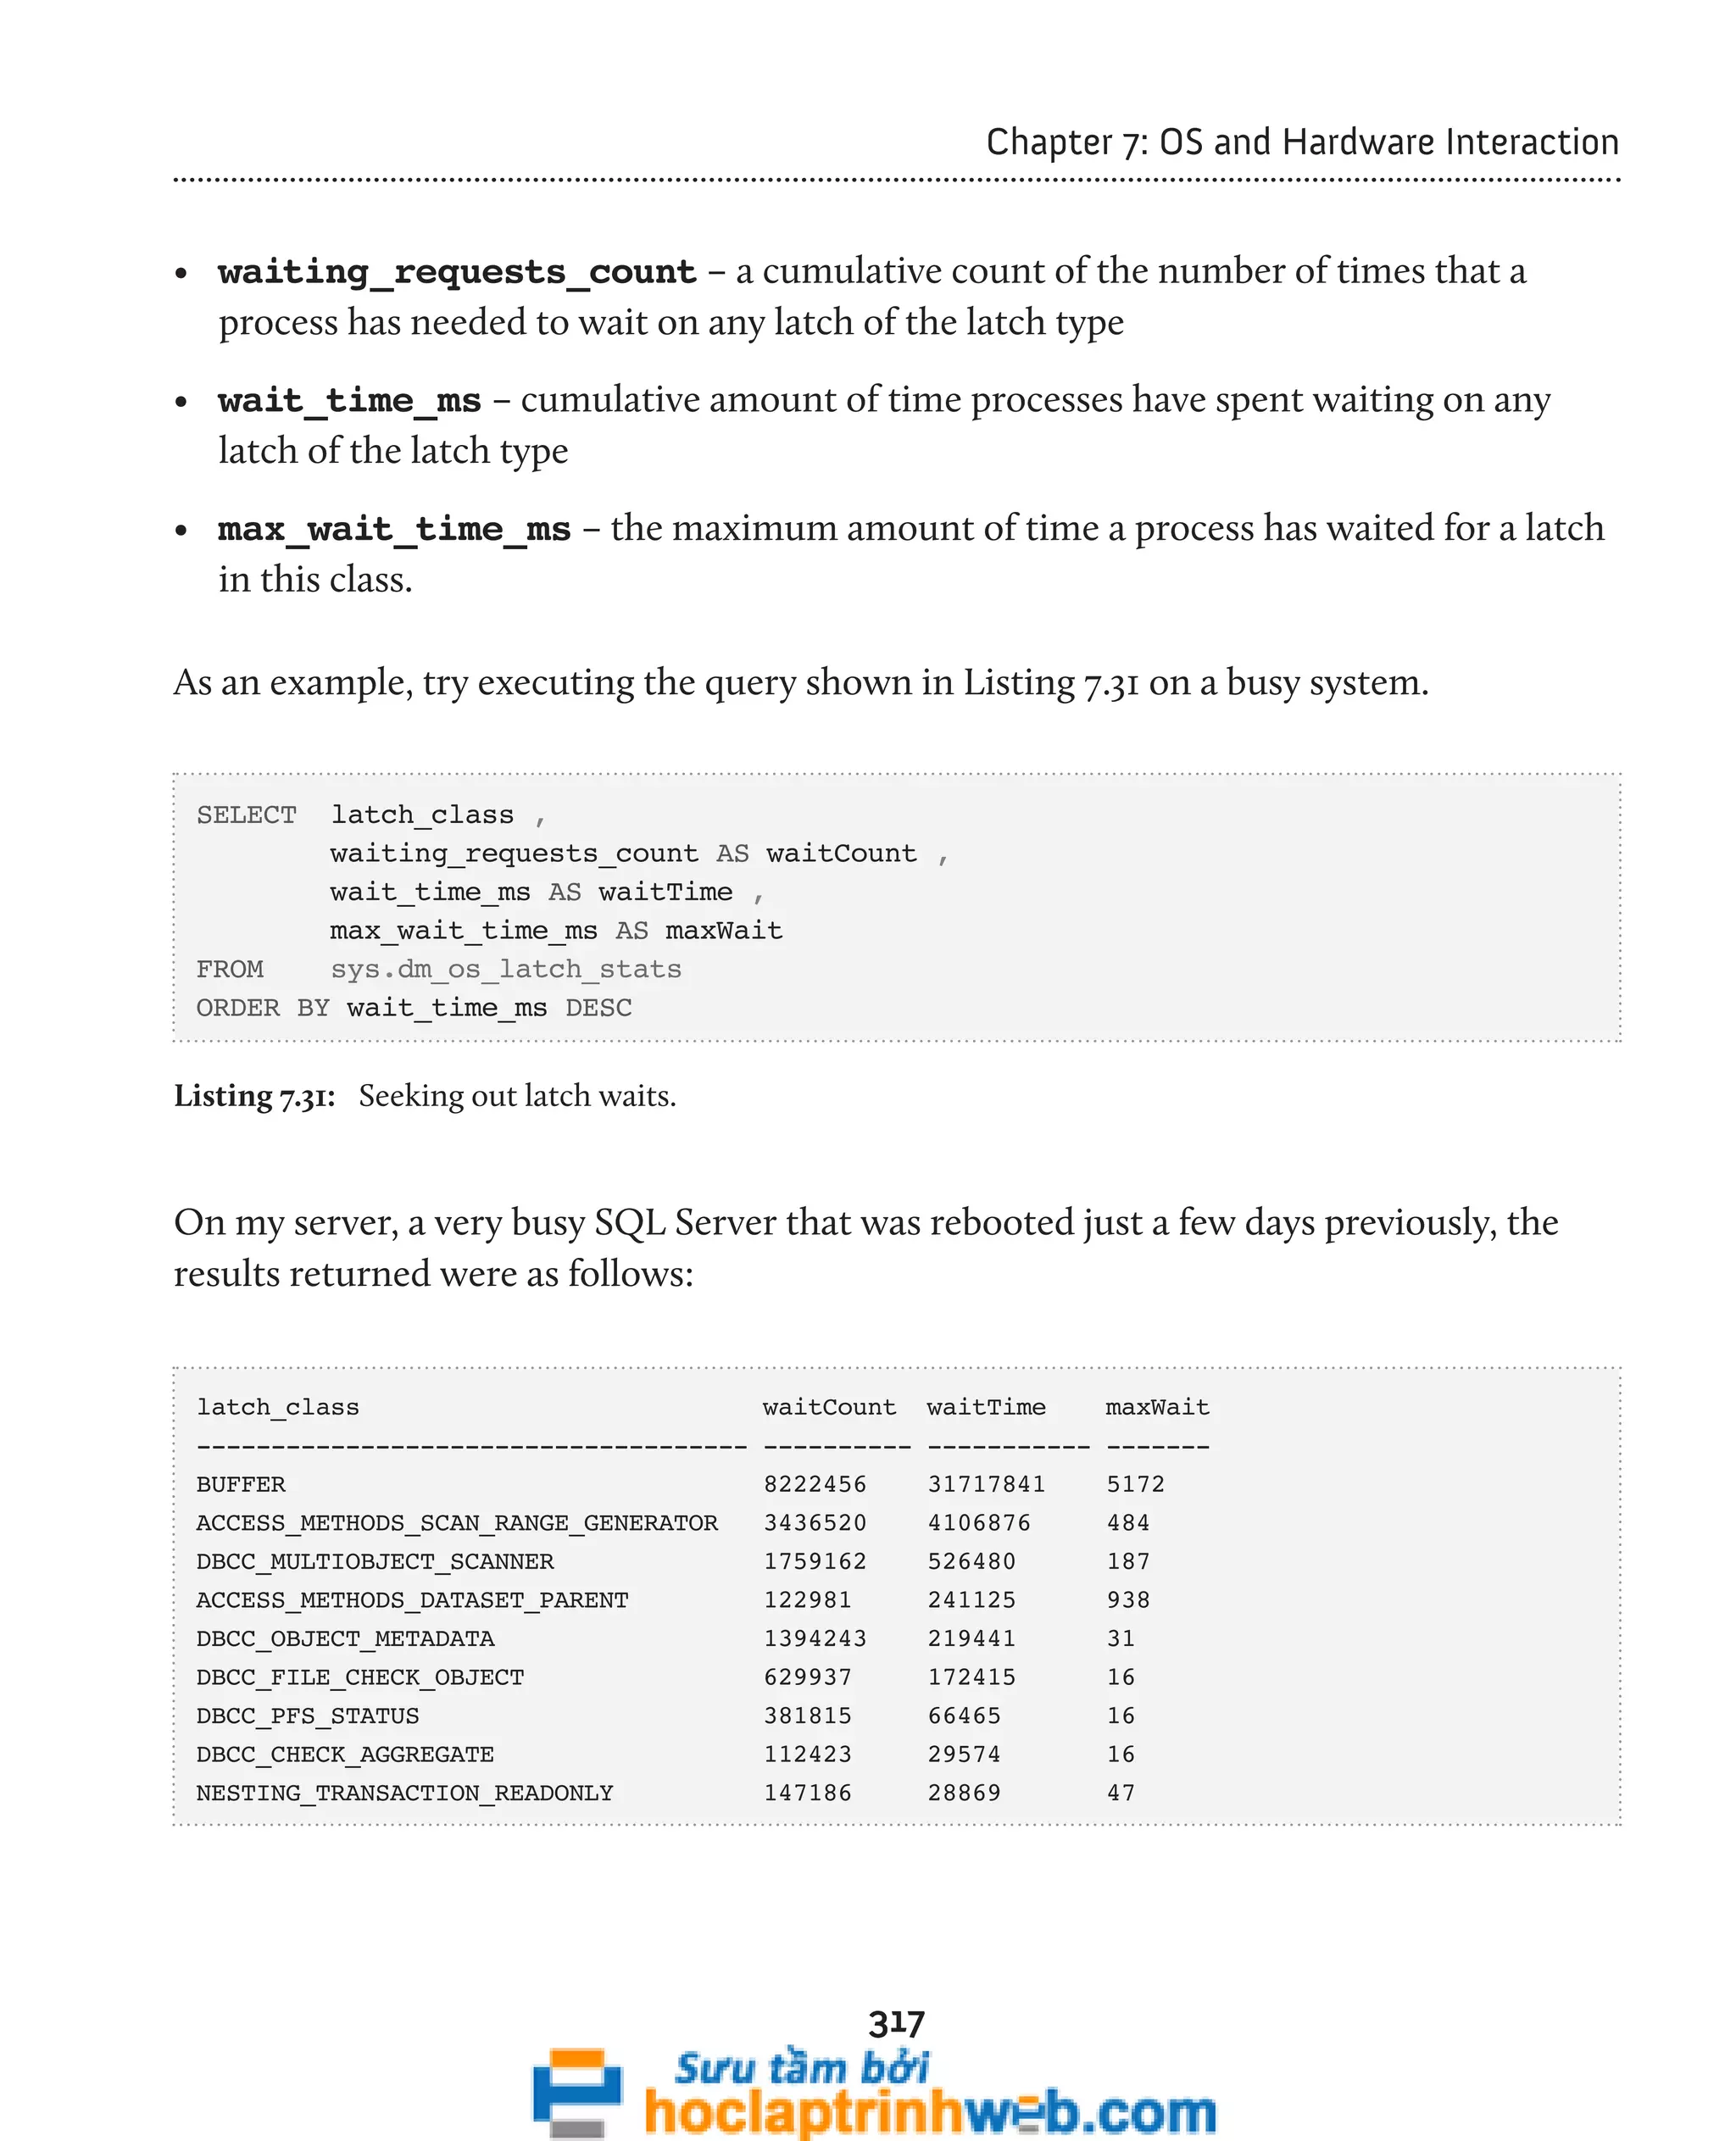

This document provides an introduction to the book "Performance Tuning with SQL Server Dynamic Management Views" which explores the use of Dynamic Management Views (DMVs) and Dynamic Management Functions (DMFs) in SQL Server for performance monitoring and troubleshooting. The book covers DMVs in six categories including execution related, transaction related, index related, database/I/O related, and SQL operating system related DMVs. It aims to describe important columns returned by DMVs and provide scripts for investigating areas such as user activity, query plans, indexing strategies, I/O usage, and OS/hardware resources.