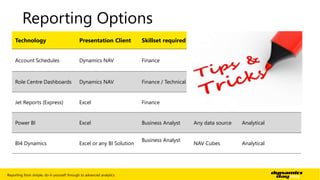
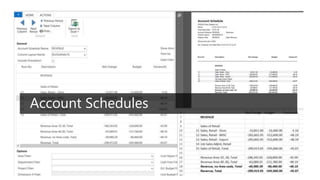
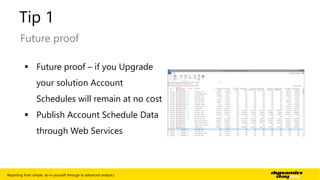
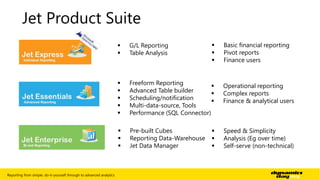
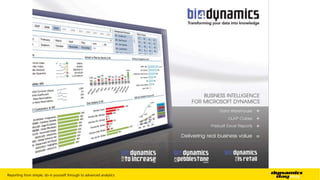
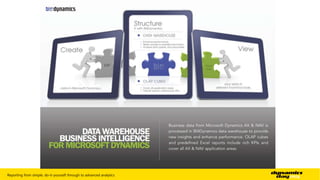
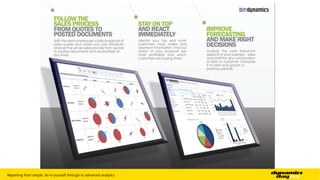
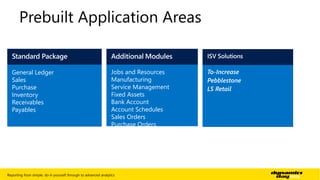
Dynamics NAV 
Business insight 
Reporting from simple, do-it-yourself through to advanced analytics 
Jaana Wichman, Derek Lamb 
23 October 2014
Your presenters 
Jaana Wichman 
Dynamics NAV Practice Lead 
 Over 14 years experience with 
Dynamics NAV 
 Five years with Intergen – as 
long as Dynamics Day exists 
 Involved in multiple ERP 
implementations in Germany as 
well as New Zealand 
 Wellington based 
Derek Lamb 
Solution Specialist 
 15 years ERP Experience with 
Microsoft, Tech one, Infor and 
Sage 
 Industry experience, 
Government, Not for Profit, 
Financials, Distribution, Utilities 
 BI experience 
 Project Manager Professional 
 Auckland based 
Reporting from simple, do-it-yourself through to advanced analytics | 2
Reporting Options 
Technology Presentation Client Skillset required Source Data Use 
Account Schedules Dynamics NAV Finance 
GL, Budgets, 
Analysis Views, 
Cash Flow 
Management Reports 
Role Centre Dashboards Dynamics NAV Finance / Technical Any NAV Data Operational Dashboard 
Jet Reports (Express) Excel Finance GL Management Reports 
Power BI Excel Business Analyst Any data source Analytical 
BI4 Dynamics Excel or any BI Solution 
Business Analyst 
NAV Cubes Analytical 
Reporting from simple, do-it-yourself through to advanced analytics | 3
Account Schedules 
Reporting from simple, do-it-yourself through to advanced analytics | 5
Tip 1 
Future proof 
 Future proof – if you Upgrade 
your solution Account 
Schedules will remain at no cost 
 Publish Account Schedule Data 
through Web Services 
Reporting from simple, do-it-yourself through to advanced analytics | 6
Tip 2 
Quick Insert G/L Accounts 
Reporting from simple, do-it-yourself through to advanced analytics | 7
Tip 3 
Period Formulas 
Reporting from simple, do-it-yourself through to advanced analytics | 8
Tip 4 
Dimensions on Columns 
Reporting from simple, do-it-yourself through to advanced analytics | 9
Tip 5 - 8 
DEMO 
 “Copy rows” for new row and column layouts 
 Dimensions on rows 
 Totals on row number 
 Formatting and presentation 
Reporting from simple, do-it-yourself through to advanced analytics | 10
Role Centre Dashboard 
Reporting from simple, do-it-yourself through to advanced analytics | 11
Tip 9 
Use Cue Data for reports 
Reporting from simple, do-it-yourself through to advanced analytics | 12
Tip 10 
Business Charts 
 KPI Charts 
 Cash Flow Charts 
 Sales Performance 
 Purchase Performance 
 Inventory Performance 
 Finance Performance 
Reporting from simple, do-it-yourself through to advanced analytics | 13
Tip 11 
Finance Performance Charts – Pre Configured 
Reporting from simple, do-it-yourself through to advanced analytics | 14
Tip 12 - 14 
DEMO 
 KPI Charts 
 Finance Performance Charts – Create your own 
 Generic Charts 
Reporting from simple, do-it-yourself through to advanced analytics | 15
Jet Express for Dynamics NAV 
Reporting from simple, do-it-yourself through to advanced analytics | 16
Jet Product Suite 
 G/L Reporting 
 Table Analysis 
 Basic financial reporting 
 Pivot reports 
 Finance users 
 Freeform Reporting 
 Advanced Table builder 
 Scheduling/notification 
 Multi-data-source, Tools 
 Performance (SQL Connector) 
 Operational reporting 
 Complex reports 
 Finance & analytical users 
 Pre-built Cubes 
 Reporting Data-Warehouse 
 Jet Data Manager 
 Speed & Simplicity 
 Analysis (Eg over time) 
 Self-serve (non-technical) 
Reporting from simple, do-it-yourself through to advanced analytics | 17
Tip 15 
Drilldown 
Reporting from simple, do-it-yourself through to advanced analytics | 18
Tip 16 
Table Builder 
Reporting from simple, do-it-yourself through to advanced analytics | 19
Tip 17-18 
DEMO 
 G/L Wizard 
 Out of the box reports 
Reporting from simple, do-it-yourself through to advanced analytics | 20
Power BI
What is Power BI? 
Power BI for is an umbrella name given for many technology and tools that 
blend well together. 
Excel is the “centre of the Power BI universe” 
Reporting from simple, do-it-yourself through to advanced analytics | 22
What is Power BI? 
Technology Availability 
Front End (Excel) O365 & Excel 
ETL and Data clean up (PowerQuery) 
O365 & Excel 
Data Model and Analysis (PowerPivot) 
O365 & Excel 
Reporting (PowerView) 
O365 & Excel 
Reporting (PowerMap) O365 
Publishing and Sharing (Power BI site) O365 
Data Mining and Predictive Analytics (Power BI Q&A + Forecasting) O365 
Reporting from simple, do-it-yourself through to advanced analytics | 23
Power Query 
Reporting from simple, do-it-yourself through to advanced analytics | 24
PowerPivot 
Reporting from simple, do-it-yourself through to advanced analytics | 25
PowerView 
Reporting from simple, do-it-yourself through to advanced analytics | 26
PowerMap 
Reporting from simple, do-it-yourself through to advanced analytics | 27
Power BI Site 
Q&A 
Reporting from simple, do-it-yourself through to advanced analytics | 28
Power BI Q&A 
Q&A 
Reporting from simple, do-it-yourself through to advanced analytics | 29
Power BI Mobile 
Q&A 
Reporting from simple, do-it-yourself through to advanced analytics | 30
What does PowerBI with Dynamics NAV provide? 
Reporting from simple, do-it-yourself through to advanced analytics | 31
BI4 Dynamics
Reporting from simple, do-it-yourself through to advanced analytics | 33
Reporting from simple, do-it-yourself through to advanced analytics | 34
Reporting from simple, do-it-yourself through to advanced analytics | 35
Prebuilt Application Areas 
Jobs and Resources 
Manufacturing 
Service Management 
Fixed Assets 
Bank Account 
Account Schedules 
Sales Orders 
Purchase Orders 
General Ledger 
Sales 
Purchase 
Inventory 
Receivables 
Payables 
Reporting from simple, do-it-yourself through to advanced analytics | 36
Receivables Area Dimensions 
Dimensions Receivables Analysis Customer Analysis 
Company X X 
Currency X X 
Date X X 
Dimensions 1-8 X X 
Document Customer X X 
Due Analysis X X 
Customer X X 
Salesperson- Purchaser X X 
Reporting from simple, do-it-yourself through to advanced analytics | 37
Receivables Area Measures 
 Receivables balance 
 Receivables balance PCY 
 Average receivables 
 Average due days receivables 
 Average open days receivables 
 Receivables coefficient 
 Receivables turnover (days) 
 Customer net change 
 Customer debit 
 Customer credit 
 Sales 
 Customer discount 
 Customer net change PCY 
 Customer debit PCY 
 Customer credit PCY 
Reporting from simple, do-it-yourself through to advanced analytics | 38
Demo Time! 
Reporting from simple, do-it-yourself through to advanced analytics | 39
Focus on Role 
centre within NAV 
Microsoft roadmap 
leading to Power BI 
& O365 
Centralise 
Business logic
Dynamics Day 2014: Microsoft Dynamics NAV - Business Insight (Reporting and Analytics)

Dynamics Day 2014: Microsoft Dynamics NAV - Business Insight (Reporting and Analytics)

  • 1.
    Dynamics NAV Businessinsight Reporting from simple, do-it-yourself through to advanced analytics Jaana Wichman, Derek Lamb 23 October 2014
  • 2.
    Your presenters JaanaWichman Dynamics NAV Practice Lead  Over 14 years experience with Dynamics NAV  Five years with Intergen – as long as Dynamics Day exists  Involved in multiple ERP implementations in Germany as well as New Zealand  Wellington based Derek Lamb Solution Specialist  15 years ERP Experience with Microsoft, Tech one, Infor and Sage  Industry experience, Government, Not for Profit, Financials, Distribution, Utilities  BI experience  Project Manager Professional  Auckland based Reporting from simple, do-it-yourself through to advanced analytics | 2
  • 3.
    Reporting Options TechnologyPresentation Client Skillset required Source Data Use Account Schedules Dynamics NAV Finance GL, Budgets, Analysis Views, Cash Flow Management Reports Role Centre Dashboards Dynamics NAV Finance / Technical Any NAV Data Operational Dashboard Jet Reports (Express) Excel Finance GL Management Reports Power BI Excel Business Analyst Any data source Analytical BI4 Dynamics Excel or any BI Solution Business Analyst NAV Cubes Analytical Reporting from simple, do-it-yourself through to advanced analytics | 3
  • 4.
    Account Schedules Reportingfrom simple, do-it-yourself through to advanced analytics | 5
  • 5.
    Tip 1 Futureproof  Future proof – if you Upgrade your solution Account Schedules will remain at no cost  Publish Account Schedule Data through Web Services Reporting from simple, do-it-yourself through to advanced analytics | 6
  • 6.
    Tip 2 QuickInsert G/L Accounts Reporting from simple, do-it-yourself through to advanced analytics | 7
  • 7.
    Tip 3 PeriodFormulas Reporting from simple, do-it-yourself through to advanced analytics | 8
  • 8.
    Tip 4 Dimensionson Columns Reporting from simple, do-it-yourself through to advanced analytics | 9
  • 9.
    Tip 5 -8 DEMO  “Copy rows” for new row and column layouts  Dimensions on rows  Totals on row number  Formatting and presentation Reporting from simple, do-it-yourself through to advanced analytics | 10
  • 10.
    Role Centre Dashboard Reporting from simple, do-it-yourself through to advanced analytics | 11
  • 11.
    Tip 9 UseCue Data for reports Reporting from simple, do-it-yourself through to advanced analytics | 12
  • 12.
    Tip 10 BusinessCharts  KPI Charts  Cash Flow Charts  Sales Performance  Purchase Performance  Inventory Performance  Finance Performance Reporting from simple, do-it-yourself through to advanced analytics | 13
  • 13.
    Tip 11 FinancePerformance Charts – Pre Configured Reporting from simple, do-it-yourself through to advanced analytics | 14
  • 14.
    Tip 12 -14 DEMO  KPI Charts  Finance Performance Charts – Create your own  Generic Charts Reporting from simple, do-it-yourself through to advanced analytics | 15
  • 15.
    Jet Express forDynamics NAV Reporting from simple, do-it-yourself through to advanced analytics | 16
  • 16.
    Jet Product Suite  G/L Reporting  Table Analysis  Basic financial reporting  Pivot reports  Finance users  Freeform Reporting  Advanced Table builder  Scheduling/notification  Multi-data-source, Tools  Performance (SQL Connector)  Operational reporting  Complex reports  Finance & analytical users  Pre-built Cubes  Reporting Data-Warehouse  Jet Data Manager  Speed & Simplicity  Analysis (Eg over time)  Self-serve (non-technical) Reporting from simple, do-it-yourself through to advanced analytics | 17
  • 17.
    Tip 15 Drilldown Reporting from simple, do-it-yourself through to advanced analytics | 18
  • 18.
    Tip 16 TableBuilder Reporting from simple, do-it-yourself through to advanced analytics | 19
  • 19.
    Tip 17-18 DEMO  G/L Wizard  Out of the box reports Reporting from simple, do-it-yourself through to advanced analytics | 20
  • 20.
  • 21.
    What is PowerBI? Power BI for is an umbrella name given for many technology and tools that blend well together. Excel is the “centre of the Power BI universe” Reporting from simple, do-it-yourself through to advanced analytics | 22
  • 22.
    What is PowerBI? Technology Availability Front End (Excel) O365 & Excel ETL and Data clean up (PowerQuery) O365 & Excel Data Model and Analysis (PowerPivot) O365 & Excel Reporting (PowerView) O365 & Excel Reporting (PowerMap) O365 Publishing and Sharing (Power BI site) O365 Data Mining and Predictive Analytics (Power BI Q&A + Forecasting) O365 Reporting from simple, do-it-yourself through to advanced analytics | 23
  • 23.
    Power Query Reportingfrom simple, do-it-yourself through to advanced analytics | 24
  • 24.
    PowerPivot Reporting fromsimple, do-it-yourself through to advanced analytics | 25
  • 25.
    PowerView Reporting fromsimple, do-it-yourself through to advanced analytics | 26
  • 26.
    PowerMap Reporting fromsimple, do-it-yourself through to advanced analytics | 27
  • 27.
    Power BI Site Q&A Reporting from simple, do-it-yourself through to advanced analytics | 28
  • 28.
    Power BI Q&A Q&A Reporting from simple, do-it-yourself through to advanced analytics | 29
  • 29.
    Power BI Mobile Q&A Reporting from simple, do-it-yourself through to advanced analytics | 30
  • 30.
    What does PowerBIwith Dynamics NAV provide? Reporting from simple, do-it-yourself through to advanced analytics | 31
  • 31.
  • 32.
    Reporting from simple,do-it-yourself through to advanced analytics | 33
  • 33.
    Reporting from simple,do-it-yourself through to advanced analytics | 34
  • 34.
    Reporting from simple,do-it-yourself through to advanced analytics | 35
  • 35.
    Prebuilt Application Areas Jobs and Resources Manufacturing Service Management Fixed Assets Bank Account Account Schedules Sales Orders Purchase Orders General Ledger Sales Purchase Inventory Receivables Payables Reporting from simple, do-it-yourself through to advanced analytics | 36
  • 36.
    Receivables Area Dimensions Dimensions Receivables Analysis Customer Analysis Company X X Currency X X Date X X Dimensions 1-8 X X Document Customer X X Due Analysis X X Customer X X Salesperson- Purchaser X X Reporting from simple, do-it-yourself through to advanced analytics | 37
  • 37.
    Receivables Area Measures  Receivables balance  Receivables balance PCY  Average receivables  Average due days receivables  Average open days receivables  Receivables coefficient  Receivables turnover (days)  Customer net change  Customer debit  Customer credit  Sales  Customer discount  Customer net change PCY  Customer debit PCY  Customer credit PCY Reporting from simple, do-it-yourself through to advanced analytics | 38
  • 38.
    Demo Time! Reportingfrom simple, do-it-yourself through to advanced analytics | 39
  • 39.
    Focus on Role centre within NAV Microsoft roadmap leading to Power BI & O365 Centralise Business logic

Editor's Notes

  • #8 Highlight the required Accounts and click OK
  • #9 Columns might be hidden and need to be added Good for fixed layouts (Tip for this tip: Use F1 for help to find out about date and period filters!) Example: Annual overview for all 12 periods in the fiscal year – independent of your date filter
  • #10 Example: Split FA by Department
  • #11 standard NAV feature This example is for Rows, but you can do the same on column layouts It works within a company either within an Account schedule or into another Acc. Schedule as well as across companies!
  • #12 Cue’s and Charts exist since NAV 2009 but they have been significantly improved and new Chart types have been added. Much more user friendly
  • #13 The only development done for this Demo!!! Report is using existing logic of Cue’s and displays this in a Dashboard style Demo
  • #14 A Variety of Charts for different roles in the business Based on analysis set up by you We will drill down into the Finance Performance as an example
  • #15 Based on Account schedule Data Can change definition and layout
  • #16 - Some Out of the box charts which are Finance related – there are many more but we’d like to show some a bit more in detail - Remember our example to show revenue per period for a fiscal year – I am going to use that to create a chart
  • #18 Express: Quick to install Free (available on CustomerSource) simple interface inside Excel with real time data from Dynamics NAV Pre-built Excel reports available to get you started
  • #19 Within JetReports or NAV (Setup)
  • #20 Add Tables from NAV Join them Use Flow Filters
  • #23 Power BI is a collection of tools that Microsoft has been working on for a few years now With Excel at the centre of it, if you love Excel and analyzing data you’ll love this if you don’t you won’t It is available on both on premise and O365 but O365 is Microsoft’s push and I think where you will see the focus
  • #24 You will need Office 2010 for some of the tools where it is free download, for office 2013 you need to be on the professional version For O365 you need to be on a specific plan to get the Power BI functionality
  • #32 If you use data sources and publish from NAV you ill be able to control security, which is one missing feature in Power BI Microsoft Dynamics NAV 2015 supports the OAuth authentication protocol for SOAP and OData web services. Previous Microsoft Dynamics NAV versions supported only the Basic and Windows authentication protocols for web services. PowerBI uses web services to extract data from NAV. Since PowerBI only runs on Office365 and uses OAuth to authenticate it meant users had to log on twice if they wanted to user PowerBI or integrate with cloud based integrations.
  • #34  Difference between this and PowerBI is that this is using SQL as the datawarehouse as opposed to Excel, this has prebuilt business logic for you and is using cube technology and is designed for larger data sets.
  • #35 Data is created in NAV The data warehouse provides the structure and business logic, this means that any user connecting to it will beusing the same logic, so average days to pay is the same regardless of who is using it. The relationships have been denormalised and flattened so easier for users to understand Viewing the data can be done from any front end tool but Excel is arguably the cheapest for this
  • #37 Application Areas General Ledger Account Schedules Sales Sales Orders Purchase Purchase Orders Inventory Receivables Payables Jobs and Resources Manufacturing Service Management Fixed Assets Bank Account
  • #38 Dimensions are