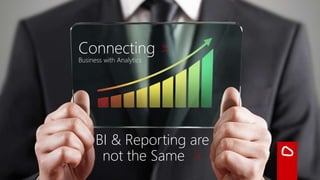
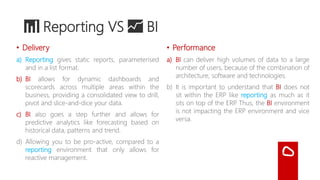
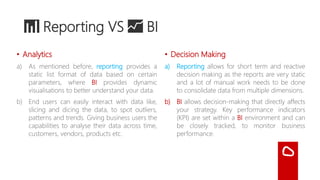
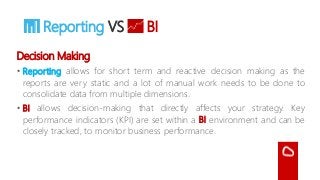
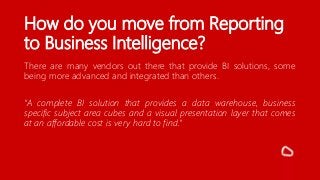
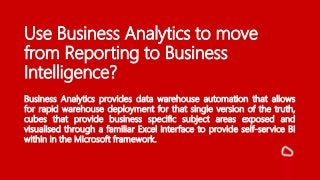
Many customer I have come across, immediately get the concept of Business Intelligence (BI). They understand that if they keep on reporting the way they have, i.e. straight from their ERP system that they are missing the bigger picture.
There are a variety of tools used to collect, organize and analyze business data for intelligence purposes. These include spreadsheets for visual data management, reporting and querying software to extract and summarize data, online analytical processing to quickly answer multi-dimensional queries, data mining to uncover patterns, data warehousing for comprehensive reporting, process mining to determine business processes from event logs, digital dashboards for real-time overviews, and performance management tools. Understanding these business intelligence tools is essential for companies to utilize data analytics and make better decisions.
- Business intelligence (BI) is the set of techniques and tools for transforming raw data into meaningful and useful information for business analysis, and involves a combination of data warehousing and decision support systems.
- The key components of a BI system include user query and reporting, OLAP, data mining, analytics, business performance management, and enterprise management.
- BI solutions help organizations store and analyze data, understand strengths and weaknesses, reduce decision-making time, measure key performance indicators, and avoid guesswork to improve performance.
- Common BI tools include Oracle BI, SAP BusinessObjects, Microsoft BI, Oracle Hyperion, IBM Cognos, and SAS Enterprise BI server. However, Oracle BI Foundation Suite is
Business intelligence (BI) refers to transforming raw company data into usable information through specialized computer programs. Raw data from transaction systems can be aggregated and manipulated in BI applications to generate information like sales trend graphs. This helps address challenges where companies have large amounts of raw data but lack tools to exploit it. BI applications read data from transaction systems, transform and present it to decision makers in reports, charts, queries and alerts. For BI projects to succeed, management must be committed, users involved in planning, and systems made easy to use and flexible.
Business intelligence (BI) involves collecting data from various sources, analyzing it to gain insights, and presenting the findings to help make better business decisions. It aims to provide the right information to decision-makers at the right time. The document outlines the five stages of BI - collecting data, extracting and transforming it, loading it into a data warehouse, analyzing it, and presenting insights through dashboards, reports and alerts. It also provides examples of how a retail company uses BI tools to gain insights from customer and sales data to improve performance.
This publication seeks to explain what business intelligence is, its history, usage in modern business operations and prospects into the future of BI.
The publication also mentions relevant software tool that help deliver business intelligence solutions.
What is BI,Definition, examples, BI industry, Solutions, Evolution, Catogeries, Key Stages of BI, BI significance, BI technologies, tools, future of BI
Big data analytics is used to extract meaningful insights from data through identifying hidden patterns, correlations, trends, and customer preferences. It provides advantages like better decision making and preventing fraud. Business intelligence encompasses technologies, applications, and practices for collecting, integrating, analyzing, and presenting business information and is data-driven to support decision making. Business intelligence tools allow users to identify actionable information from raw data to facilitate data-driven decision making.
The document discusses business intelligence and analytics programs and careers. It provides information on topics like data mining, dashboards, enterprise resource planning systems, online analytical processing, and multidimensional data models. It also lists relevant course descriptions and curriculum from technical schools and colleges to prepare for careers in fields like business intelligence specialist, business intelligence developer, and business intelligence report developer.
1) Business intelligence (BI) systems help organizations analyze large amounts of operational data and gain useful insights to make more informed decisions.
2) BI involves collecting, analyzing and organizing critical information from across an organization to focus on important strategic and operational issues. It allows data to be organized and analyzed in a better way to convert it into useful knowledge.
3) The primary goals of BI are to avoid surprises, identify threats and opportunities, understand vulnerabilities, decrease reaction time, outthink competition, and protect intellectual capital.
This document provides an overview of business intelligence. It discusses how more than 35% of top global companies regularly fail to make insightful decisions. It then describes how business intelligence tools can help by gathering and storing enterprise data systematically to transform it into knowledge through reports and graphs. This helps users make better business decisions. An example is given of a large US retail shop that used business intelligence to discover a connection between diaper and beer sales, allowing them to increase both products' sales by placing them closer together on shelves. The document concludes that business intelligence has great potential to find unexpected insights and can help organizations stand out from competitors by supporting more reliable decision-making.
Top 15 Business Intelligence (BI) SoftwareMopinion
In this slideshare, we will provide you with a rundown of the top 15 best Business Intelligence tools. Keep in mind: these all vary in robustness, integration capabilities, ease-of-use (from a technical perspective) and pricing.
Business Intelligence 3.0 aims to revolutionize BI by making it social, relevant, and self-service. Traditional BI tools are too complicated for most business users and require heavy IT support. BI 3.0 solutions allow users to collaborate socially within the BI system, receive automatically relevant insights without searching, and personalize their own self-service analytics without training. Panorama Necto is presented as one such BI 3.0 tool that connects data, insights, and people in a way that drives social intelligence for businesses.
Advanced Topics In Business Intelligenceguest1a9ef2
The blurring of the line between decision support systems and operational systems because of real-time warehousing, the use of Enterprise Information Integration (EII), and closed- loop business processes
The document discusses the evolution of business intelligence from traditional to real-time and closed-loop systems. It describes moving from batch-based transactional data warehousing to analytical applications with real-time feeds and embedded business intelligence, enabled by technologies like BPM, EAI and decision rules. This creates a more intelligent and flexible solution.
Download at http://DavidHubbard.net/powerpoint - This Introduction to Business Intelligence gives an overview of how Business Intelligence fits into business strategy in general. It does not go into the specific technologies of Business Intelligence. It is meant to be used to explain Business Intelligence to those not already familiar with Business Intelligence.
Business intelligence in the real time economyJohan Blomme
1. Business intelligence is evolving from reactive, historical reporting to real-time decision making embedded in business processes. This allows for more proactive responses to changing market conditions.
2. There is a shift towards self-service business intelligence where all employees can access, analyze, and share real-time data to improve decision making. Technologies like in-memory analytics enable faster, interactive analysis.
3. Collaboration and sharing of insights is facilitated by new interactive dashboard and visualization tools with Web 2.0 features. Business intelligence is becoming more user-centric and accessible for all employees.
This document provides an overview of business intelligence (BI). It defines BI as collaborating people and technology to enhance decision making by delivering the right insights at the right time. Companies deploy BI to gain faster customer segmentation, understand customer behavior, reduce question response time, and make even simple decisions using integrated data. The document outlines the evolution of BI from basic reporting to predicting and operationalizing insights. It also shows how reports have evolved over time and presents the Gartner BI matrix and typical BI system architecture. Finally, it provides a real-world example of a lifetime segmentation report generated using BI tools and processes.
Business intelligence (BI) provides tools for exploring, analyzing, and modeling large amounts of complex data. It consists of statistical modeling, data mining, and multidimensional data exploration technologies. BI is built on well-defined data marts and models customer data to provide customer intelligence. It uses several technologies to support decision making, CRM, customer loyalty, campaign management, and marketing. BI requires integrating data from various sources into a data warehouse where advanced analytics can be performed to generate insights.
The document discusses elements of developing a business intelligence strategy, including understanding an organization's BI maturity level, aligning metrics and goals across different business units, establishing a Business Intelligence Competency Center, and determining whether to build a BI solution from scratch or purchase pre-built BI applications. It provides an overview of various components that should be considered when creating a comprehensive BI strategy.
- Corporate data is growing rapidly at 100% every year and data generated in the past 3 years is equivalent to the previous 30 years.
- With increasing data, organizations need tools to manage data and turn it into useful information for strategic decision making.
- Business intelligence provides interactive tools for analyzing large amounts of data from different sources and transforming it into insightful reports and dashboards to help organizations make better business decisions.
An basic ideas about needs and concepts of business intelligence.
Presented on DotNetters Tech Summit - 2015 RUET
Presenter: Maksud Saifullah Pulak
Event Url: https://www.facebook.com/events/512834685530439/
AI and Marketing: Robot-proofing Your JobCall Sumo
Artificial Intelligence (AI) provides marketers with deep knowledge of consumer, clients and delivers the right message to the right person at the right time. Here are more depth information how AC affects on Marketing.
The document discusses the need for business intelligence due to the complex business environment companies operate in today. It outlines several key challenges companies face related to data, processes, tracking analytics, people, and geography that make it difficult to obtain reliable and timely information for effective decision making. This can lead to uninformed decisions, inefficient processes, high costs, and data quality issues. The document argues that a business intelligence solution is needed to provide consistent metrics and insights, optimize data management and distribution, and increase sales and marketing effectiveness through real-time reporting, analytics, and visibility into performance and trends.
This document provides an overview of business intelligence and its key components. It defines business intelligence as processes, technologies, and tools that help transform data into knowledge and plans to guide business decisions. The key components discussed include data mining, data warehousing, and data analysis. Data mining involves extracting patterns from large databases, data warehousing focuses on data storage, and data analysis is the process of inspecting, cleaning, transforming, and modeling data to support decision making.
Ethical issues of business intelligence (bi)BouDii Oo
Reda's Co. is a national import/export company established in 1985 that expanded into contracting in 2011. As the business grew, they implemented a business intelligence (BI) system to help organize and control operations. However, problems arose as staff were not used to the new system. Some common issues faced with any new BI system include privacy concerns over monitoring employee internet usage and potential security risks from spyware.
Panorama comparatif des outils de reporting et Dashboarding Microsoft : Excel, SSRS et Power View. Les plus de chacun de ces outils de reporting pour répondre à tous vos besoins.
Speakers : Stéphane Vivien (GFI Informatique), Michael Nokhamzon (GFI Informatique), Laurent Miltgen-Delinchamp (Cumulos)
The document discusses global warming and greenhouse gas emissions. It identifies the primary greenhouse gases as carbon dioxide, methane, and nitrous oxide which are emitted through activities like burning fossil fuels and decomposition of waste. It notes that atmospheric concentrations of these gases have increased significantly since the industrial era due to human activity. The document also examines the role of energy and emissions by sector in contributing to climate change. Finally, it outlines some of the potential effects of global warming and solutions to address rising greenhouse gas levels.
This document provides biographical information about Miss DePorter. It details her education history from 1993 to 2014, including attending St. Anne's Catholic grade school, UTHS High school, Black Hawk College, and Western Illinois University. It also lists her hobbies and interests such as travel, exercise, family, reading, and photography. Additionally, it provides details about her family including her parents and sister, as well as her favorite quotes.
This document provides step-by-step instructions for replacing the glass on an iPhone 3G. It outlines 17 steps involving removing screws and ribbon cables, using tools like a spudger and heat gun to separate the glass, and installing a new front panel assembly. Safety tips are included to protect from glass shards and avoid damaging internal components. Pictures supplement the text to illustrate cable locations and the order they should be reconnected in during reassembly.
Este documento discute as tecnologias para aplicações web em tempo real, incluindo chat, feeds e chamadas API. Ele explica como essas abordagens evoluíram de soluções como multipart/x-mixed-replace e iframes para AJAX, JavaApplet, FlashSocket e WebSocket. Também discute como implementar aplicações em tempo real com Rails usando Faye e Sync para publicação e assinatura de eventos.
Mars is the fourth planet from the Sun and named after the Roman god of war. It has an average distance from the Sun of 230 million km and takes 687 days to complete its orbit. A day on Mars is only slightly longer than an Earth day at 24 hours, 39 minutes, and 35.244 seconds, while a Martian year equals 1.8809 Earth years or 1 year, 320 days, and 18.2 hours.
The document discusses engineering and industrial topics such as efficiency, effectiveness, productivity, and urban development. It includes images related to ideas, outsourcing, consumers, Maslow's hierarchy of needs, added value, feedback, implementation, training, family businesses, flags, and leadership.
The document calculates the horizontal and vertical reaction forces on a solar collector panel based on its specifications and an equilibrium analysis. It lists the masses and forces on the panel, including a 106 kg panel mass and 25 kg additional mass. An equilibrium analysis is done assuming no wind, snow, or flexion to solve for the horizontal and vertical reaction forces on the front and back of the panel, which are 384.6N and 368.5N horizontally and 376.6N vertically at both the front and back.
1. The document discusses resistance to adopting new technologies like 3D scanning and discusses overcoming barriers to change.
2. It notes that change is inherent but that concern and fear of new opportunities are natural, and the greatest barrier is often resistance to change from within ourselves, our peers, and management.
3. The document advocates starting with realistic small attempts to learn new technologies, avoiding mission critical uses at first, and persevering through limits and setbacks to gain experience over time.
Santoshi is a senior system engineer with over 3 years of experience developing insurance software using technologies like Java, Struts, Hibernate, and Oracle. She currently works for IBEXI developing and implementing the IDIT insurance system for a new P&C insurer in Singapore. Previously, she worked for TCS developing insurance applications for clients in Oman and Mauritius using the IDIT and TCS BANCs platforms. She has extensive experience in modules like policies, claims, contacts, and web services.
Business intelligence (BI) systems allow companies to gather, store, access, and analyze corporate data to aid in decision-making. These systems illustrate intelligence in areas like customer profiling, market research, and product profitability. A hotel franchise uses BI to compile statistics on metrics like occupancy and room rates to analyze performance and competitive position. Banks also use BI to determine their most profitable customers and which customers to target for new products.
Business intelligence (BI) provides timely, accurate insights and actions to support decision-making. It involves processes, technologies, and tools to gather, store, analyze and provide access to data. This helps users change data into information, information into knowledge, and knowledge into plans. BI technologies analyze raw data and make it comprehensible to support better-informed decisions. Dashboards, KPIs, reporting and analysis tools are commonly used for data sourcing, analysis, awareness, decision support, and understanding trends to help companies adapt quickly to changing demands and competitor actions.
Business Intelligence and Business Analyticssnehal_152
Business intelligence (BI) involves gathering, storing, and analyzing data to help organizations make better business decisions. It provides a single point of access to timely information to answer business questions. BI tools like dashboards, key performance indicators, graphical reporting, and forecasting help companies adapt quickly to changing customer preferences and market conditions. Implementing an effective BI system removes guesswork from decision making and allows for fact-based decisions through accurate, real-time data.
Business intelligence (BI) refers to technologies and applications used to analyze data and present information to help make business decisions. BI evolved from systems in the 1970s and 1980s that provided executives with key performance data. It grew to include data mining, querying, reporting, analytics and more. BI helps businesses make more informed decisions through competitive analysis, customer behavior analysis, targeted strategies, scenario planning, and optimization. Real-time BI that provides constantly updated information is an emerging trend to meet the needs of businesses that want timely data. However, integrating disparate data sources and accounting for constantly changing business structures makes true real-time BI challenging to achieve.
BI A Practical Perspective - By Team ComputersDhiren Gala
Business intelligence (BI) includes tools and techniques used to analyze business data and present actionable information to help executives, managers and other corporate users make informed business decisions. BI tools include reporting, data mining, analytics, business performance management and more. Effective BI requires integrating multiple data sources and providing different types of users with reports, dashboards, analytics and predictive modeling tailored to their roles in the organization. The goal is to help users monitor key performance indicators, gain insights and make better strategic and tactical decisions.
Business intelligence (BI) includes tools and techniques used to analyze business data and present actionable information to help executives, managers and other corporate users make informed business decisions. BI tools allow users to query databases, analyze data, and view results in reports, dashboards and visualizations. The document discusses various BI tools, technologies and concepts, and how BI can help businesses address challenges by providing accurate, timely data to support strategic decision making and improve performance.
The document provides an overview of business intelligence (BI) and business analytics (BA). It defines BI as a variety of software applications used to analyze organizational data to make strategic, tactical, and operational decisions. BA is described as using data, analytics, and business models to gain insights and make better decisions. The key components of BI are data warehousing, business analytics, business performance management, and user interfaces. Descriptive, predictive, and prescriptive analytics are also discussed as types of analyses used in BA.
This Presentation covers the basic concept of Business Intelligence, BI Technologies, BI Tools, Future of BI, Real time BI, Key Stages of BI, BI Industry & Decision Support Applications.
Business intelligence (BI) refers to technologies and applications used to analyze data and present information to help corporate executives, managers, and other business users make informed decisions. Examples of how BI is used include hotels analyzing occupancy rates and revenue, banks determining profitable customers, and telecom companies providing targeted data access. BI provides insights into customer behavior, market trends, internal operations, and more to support strategic decision-making. The future of BI includes greater use of real-time analysis to provide up-to-date insights for time-sensitive business decisions.
The document discusses business intelligence (BI), including what it is, key points, examples of BI tools, why it is important and how it works, real-world applications, and benefits and disadvantages. Specifically:
- BI is a set of processes and technologies that analyzes raw data and converts it into meaningful and useful information to help businesses make better decisions.
- It combines analytics, data mining, visualization, and infrastructure to transform data into intelligence. Common BI tools include Qliksense, Zoho Analytics, and Clear Analytics.
- BI is important because it allows companies to better understand operations, customers, competitors and market trends to improve performance and increase profits.
- However, BI also has disadvantages
BI allows organizations to analyze large amounts of data from multiple sources to better understand their business and make informed decisions. It provides predictive analytics capabilities through tools like dashboards, reports, and data visualization. Implementing a successful BI system requires integrating data from across an organization's various databases and systems, defining important KPIs, and providing users with self-service analytics tools to track metrics and receive alerts. BI has been shown to increase financial performance, speed of decision making, and ability to execute decisions as intended.
Business intelligence- Components, Tools, Need and Applicationsraj
As part of the research project for the course Technical Foundations of Information Systems at the University of Illinois, our team worked on the topic, Business Intelligence. The presentation focuses on what is Business Intelligence, its various components, latest tools, the need of BI as well as applications of this technology. This project deals with the latest development of BI technologies (hardware or software) and includes comprehensive literature survey from Journals, and the Internet.
Business intelligence (BI) refers to technologies and applications used to analyze data and provide access to information about company operations. It involves collecting data from across the organization, storing it in data warehouses or data marts, and providing tools to access and analyze the data. The goal of BI is to help business users make more informed decisions by providing insights from large amounts of internal and external data. Key aspects of BI include data warehousing, online analytical processing, reporting, dashboards, scorecards, and data mining.
The document provides an overview of business intelligence (BI). It discusses how BI software ingests business data and presents it in user-friendly formats like reports and dashboards to enable analysis. The history of BI is then outlined, from its first use in 1865 to the development of data management and decision support systems in the 1960s-70s. More recent BI has focused on self-service applications and cloud-based platforms that can handle big data and real-time processing. Examples are given of how BI could be used to analyze aviation and healthcare data. Key expectations of BI solutions and IBM Cognos tools are also summarized.
Enterprize and departmental BusinessIintelligence.pptxHemaSenthil5
Enterprise business intelligence involves collecting, storing, and analyzing business data from across an entire large organization to provide strategic insights. It uses robust, scalable tools to handle large volumes of data from different sources. The goals are to give management a comprehensive view of the business and foster a data-driven culture. Departmental BI focuses more narrowly on specific department needs, empowering teams with custom reports and self-service tools integrated with the overall enterprise strategy.
This document discusses how business intelligence can help organizations by transforming data into knowledge and insights. It provides examples of how BI technologies can help companies access timely information, make better decisions, and adapt to changing customer demands and market trends. The document also describes business analytics services that are offered, including dashboards, predictive analysis, reporting, and forecasting to improve planning.
This document provides information on business intelligence solutions from eLuminous Technologies. It discusses common business challenges that BI tools can address such as real-time reporting, data analysis and decision making. The presentation then outlines the BI process, key benefits of BI for companies, and facts about the business value of BI. It includes two case studies showing how eLuminous implemented BI solutions for clients to gain insights from data. The case studies demonstrate how the solutions provided reporting, dashboarding, data integration and other capabilities to help the clients with business management and decision making.
The document provides an overview of business intelligence (BI), including definitions, objectives, components, history, needs/benefits, features, uses, and examples. Some key points:
- BI is an umbrella term for architectures, tools, databases, and methods to improve business decision-making through analysis of facts and data-driven systems.
- The goal of BI is to transform raw data into meaningful and useful information through analytics that provides insights and knowledge for impactful decisions.
- Major BI components include data warehousing, extraction/transformation/loading tools, data marts, metrics/key performance indicators, dashboards, and online analytical processing reporting.
- BI has evolved from static reporting systems in
Similar to Business Intelligence & Reporting are Not the Same (20)
TimeXtender is the leading Data Warehouse Automation on Microsoft SQL platform. The enclosed presentation provides you with a list of the features and functionality available.
A Masterclass on Data Warehouse Automation Heath Turner
The document discusses a master class presentation on data warehouse automation using TimeXtender software. It introduces data warehouse automation as a new technology that can speed up the data warehouse development lifecycle through automation. TimeXtender claims to automate extract, transform, load processes and improve quality while reducing costs. Case studies and customer testimonials are presented to demonstrate how TimeXtender has delivered faster, better, and cheaper results for clients.
Using CRM and ERP data to manage a sales team effectivelyHeath Turner
A sales team is a dynamic and essential part of any successful business. In order to build and maintain a highly successful sales team you must use all available tools at your disposal to ensure sales and business goals are met. Your business needs to know who is managing which customer account, what sales are due to come in, what prospects are in the system and how are you managing the potential order that need to be filled. Your CRM system will provide you with most of this information.
Essential steps to rolling out Jet Essentials Heath Turner
1. Jet Reports is a database querying tool built into Excel that allows users to directly query databases from within Excel worksheets to extract real-time data without manually copying and pasting.
2. The document discusses challenges organizations face with limited or no reporting functionality within their ERP systems, forcing reliance on manual report creation in Excel which is time-consuming and error-prone.
3. It introduces Jet Essentials as a solution that connects users to all their business data systems from within Excel, allowing automated report creation, data sharing and collaboration to help organizations make faster, more informed decisions.
The 7 Habits to becoming an Effective Decision MakerHeath Turner
My presentation from the Tech4Africa event conducted in Johannesburg. Presentation focuses on 2 aspects, primarily the opportunity for us Africans on our continent and then how Data and Information for Effective Decision making can enable Leadership on our continent to compete.
Sales Performance for Microsoft Dynamics CRMHeath Turner
Sales Performance is pre-packaged functionality for Dynamics CRM that will reduce project delivery time and improve customer acquisition and retention processes within your sales environment.
Certified for Microsoft Dynamics CRM
Driving Business Innovation: Latest Generative AI Advancements & Success StorySafe Software
Are you ready to revolutionize how you handle data? Join us for a webinar where we’ll bring you up to speed with the latest advancements in Generative AI technology and discover how leveraging FME with tools from giants like Google Gemini, Amazon, and Microsoft OpenAI can supercharge your workflow efficiency.
During the hour, we’ll take you through:
Guest Speaker Segment with Hannah Barrington: Dive into the world of dynamic real estate marketing with Hannah, the Marketing Manager at Workspace Group. Hear firsthand how their team generates engaging descriptions for thousands of office units by integrating diverse data sources—from PDF floorplans to web pages—using FME transformers, like OpenAIVisionConnector and AnthropicVisionConnector. This use case will show you how GenAI can streamline content creation for marketing across the board.
Ollama Use Case: Learn how Scenario Specialist Dmitri Bagh has utilized Ollama within FME to input data, create custom models, and enhance security protocols. This segment will include demos to illustrate the full capabilities of FME in AI-driven processes.
Custom AI Models: Discover how to leverage FME to build personalized AI models using your data. Whether it’s populating a model with local data for added security or integrating public AI tools, find out how FME facilitates a versatile and secure approach to AI.
We’ll wrap up with a live Q&A session where you can engage with our experts on your specific use cases, and learn more about optimizing your data workflows with AI.
This webinar is ideal for professionals seeking to harness the power of AI within their data management systems while ensuring high levels of customization and security. Whether you're a novice or an expert, gain actionable insights and strategies to elevate your data processes. Join us to see how FME and AI can revolutionize how you work with data!
Introduction of Cybersecurity with OSS at Code Europe 2024Hiroshi SHIBATA
I develop the Ruby programming language, RubyGems, and Bundler, which are package managers for Ruby. Today, I will introduce how to enhance the security of your application using open-source software (OSS) examples from Ruby and RubyGems.
The first topic is CVE (Common Vulnerabilities and Exposures). I have published CVEs many times. But what exactly is a CVE? I'll provide a basic understanding of CVEs and explain how to detect and handle vulnerabilities in OSS.
Next, let's discuss package managers. Package managers play a critical role in the OSS ecosystem. I'll explain how to manage library dependencies in your application.
I'll share insights into how the Ruby and RubyGems core team works to keep our ecosystem safe. By the end of this talk, you'll have a better understanding of how to safeguard your code.
AppSec PNW: Android and iOS Application Security with MobSFAjin Abraham
Mobile Security Framework - MobSF is a free and open source automated mobile application security testing environment designed to help security engineers, researchers, developers, and penetration testers to identify security vulnerabilities, malicious behaviours and privacy concerns in mobile applications using static and dynamic analysis. It supports all the popular mobile application binaries and source code formats built for Android and iOS devices. In addition to automated security assessment, it also offers an interactive testing environment to build and execute scenario based test/fuzz cases against the application.
This talk covers:
Using MobSF for static analysis of mobile applications.
Interactive dynamic security assessment of Android and iOS applications.
Solving Mobile app CTF challenges.
Reverse engineering and runtime analysis of Mobile malware.
How to shift left and integrate MobSF/mobsfscan SAST and DAST in your build pipeline.
What is an RPA CoE? Session 1 – CoE VisionDianaGray10
In the first session, we will review the organization's vision and how this has an impact on the COE Structure.
Topics covered:
• The role of a steering committee
• How do the organization’s priorities determine CoE Structure?
Speaker:
Chris Bolin, Senior Intelligent Automation Architect Anika Systems
Discover top-tier mobile app development services, offering innovative solutions for iOS and Android. Enhance your business with custom, user-friendly mobile applications.
Have you ever been confused by the myriad of choices offered by AWS for hosting a website or an API?
Lambda, Elastic Beanstalk, Lightsail, Amplify, S3 (and more!) can each host websites + APIs. But which one should we choose?
Which one is cheapest? Which one is fastest? Which one will scale to meet our needs?
Join me in this session as we dive into each AWS hosting service to determine which one is best for your scenario and explain why!
Programming Foundation Models with DSPy - Meetup SlidesZilliz
Prompting language models is hard, while programming language models is easy. In this talk, I will discuss the state-of-the-art framework DSPy for programming foundation models with its powerful optimizers and runtime constraint system.
Skybuffer SAM4U tool for SAP license adoptionTatiana Kojar
Manage and optimize your license adoption and consumption with SAM4U, an SAP free customer software asset management tool.
SAM4U, an SAP complimentary software asset management tool for customers, delivers a detailed and well-structured overview of license inventory and usage with a user-friendly interface. We offer a hosted, cost-effective, and performance-optimized SAM4U setup in the Skybuffer Cloud environment. You retain ownership of the system and data, while we manage the ABAP 7.58 infrastructure, ensuring fixed Total Cost of Ownership (TCO) and exceptional services through the SAP Fiori interface.
HCL Notes und Domino Lizenzkostenreduzierung in der Welt von DLAUpanagenda
Webinar Recording: https://www.panagenda.com/webinars/hcl-notes-und-domino-lizenzkostenreduzierung-in-der-welt-von-dlau/
DLAU und die Lizenzen nach dem CCB- und CCX-Modell sind für viele in der HCL-Community seit letztem Jahr ein heißes Thema. Als Notes- oder Domino-Kunde haben Sie vielleicht mit unerwartet hohen Benutzerzahlen und Lizenzgebühren zu kämpfen. Sie fragen sich vielleicht, wie diese neue Art der Lizenzierung funktioniert und welchen Nutzen sie Ihnen bringt. Vor allem wollen Sie sicherlich Ihr Budget einhalten und Kosten sparen, wo immer möglich. Das verstehen wir und wir möchten Ihnen dabei helfen!
Wir erklären Ihnen, wie Sie häufige Konfigurationsprobleme lösen können, die dazu führen können, dass mehr Benutzer gezählt werden als nötig, und wie Sie überflüssige oder ungenutzte Konten identifizieren und entfernen können, um Geld zu sparen. Es gibt auch einige Ansätze, die zu unnötigen Ausgaben führen können, z. B. wenn ein Personendokument anstelle eines Mail-Ins für geteilte Mailboxen verwendet wird. Wir zeigen Ihnen solche Fälle und deren Lösungen. Und natürlich erklären wir Ihnen das neue Lizenzmodell.
Nehmen Sie an diesem Webinar teil, bei dem HCL-Ambassador Marc Thomas und Gastredner Franz Walder Ihnen diese neue Welt näherbringen. Es vermittelt Ihnen die Tools und das Know-how, um den Überblick zu bewahren. Sie werden in der Lage sein, Ihre Kosten durch eine optimierte Domino-Konfiguration zu reduzieren und auch in Zukunft gering zu halten.
Diese Themen werden behandelt
- Reduzierung der Lizenzkosten durch Auffinden und Beheben von Fehlkonfigurationen und überflüssigen Konten
- Wie funktionieren CCB- und CCX-Lizenzen wirklich?
- Verstehen des DLAU-Tools und wie man es am besten nutzt
- Tipps für häufige Problembereiche, wie z. B. Team-Postfächer, Funktions-/Testbenutzer usw.
- Praxisbeispiele und Best Practices zum sofortigen Umsetzen
Your One-Stop Shop for Python Success: Top 10 US Python Development Providersakankshawande
Simplify your search for a reliable Python development partner! This list presents the top 10 trusted US providers offering comprehensive Python development services, ensuring your project's success from conception to completion.
Generating privacy-protected synthetic data using Secludy and MilvusZilliz
During this demo, the founders of Secludy will demonstrate how their system utilizes Milvus to store and manipulate embeddings for generating privacy-protected synthetic data. Their approach not only maintains the confidentiality of the original data but also enhances the utility and scalability of LLMs under privacy constraints. Attendees, including machine learning engineers, data scientists, and data managers, will witness first-hand how Secludy's integration with Milvus empowers organizations to harness the power of LLMs securely and efficiently.
zkStudyClub - LatticeFold: A Lattice-based Folding Scheme and its Application...Alex Pruden
Folding is a recent technique for building efficient recursive SNARKs. Several elegant folding protocols have been proposed, such as Nova, Supernova, Hypernova, Protostar, and others. However, all of them rely on an additively homomorphic commitment scheme based on discrete log, and are therefore not post-quantum secure. In this work we present LatticeFold, the first lattice-based folding protocol based on the Module SIS problem. This folding protocol naturally leads to an efficient recursive lattice-based SNARK and an efficient PCD scheme. LatticeFold supports folding low-degree relations, such as R1CS, as well as high-degree relations, such as CCS. The key challenge is to construct a secure folding protocol that works with the Ajtai commitment scheme. The difficulty, is ensuring that extracted witnesses are low norm through many rounds of folding. We present a novel technique using the sumcheck protocol to ensure that extracted witnesses are always low norm no matter how many rounds of folding are used. Our evaluation of the final proof system suggests that it is as performant as Hypernova, while providing post-quantum security.
Paper Link: https://eprint.iacr.org/2024/257
How information systems are built or acquired puts information, which is what they should be about, in a secondary place. Our language adapted accordingly, and we no longer talk about information systems but applications. Applications evolved in a way to break data into diverse fragments, tightly coupled with applications and expensive to integrate. The result is technical debt, which is re-paid by taking even bigger "loans", resulting in an ever-increasing technical debt. Software engineering and procurement practices work in sync with market forces to maintain this trend. This talk demonstrates how natural this situation is. The question is: can something be done to reverse the trend?
Freshworks Rethinks NoSQL for Rapid Scaling & Cost-EfficiencyScyllaDB
Freshworks creates AI-boosted business software that helps employees work more efficiently and effectively. Managing data across multiple RDBMS and NoSQL databases was already a challenge at their current scale. To prepare for 10X growth, they knew it was time to rethink their database strategy. Learn how they architected a solution that would simplify scaling while keeping costs under control.
Fueling AI with Great Data with Airbyte WebinarZilliz
This talk will focus on how to collect data from a variety of sources, leveraging this data for RAG and other GenAI use cases, and finally charting your course to productionalization.
2. 📊 Reporting & 📈 Business Intelligence are
Not the Same…
“Many customer I have come across,
immediately get the concept of
Business Intelligence (BI). They
understand that if they keep on
reporting the way they have, i.e.
straight from their ERP system that
they are just like this cartoon.
Struggling to see the bigger picture
and battling with the day to day
delivery of information, they are
dragging a wheelbarrow with a square
wheel. “
Izak Bester, Product Manager, Karabina Software
3. 📊 Reporting
Reporting is seen as static information being retrieved from a source
system like an ERP. Most ERP systems have these static reports as part
of the package as an out-of-the-box (OOTB) offering. Most of these
reports cover areas like purchase orders, invoices, goods received,
debtors balances, inventory on hand, financial statements, vendor
and customer lists, resourcing, planning, etc.
4. 📊 These Reports are mainly in List Format…
These reports are mainly in a list format with multiple lines containing
additional details. Each of these reports is run by supplying additional
parameters to limit the reports in terms of number of rows being
returned from the ERP system.
The main reason for limiting the number of rows is that any ERP has
been architected to get data in very quickly. An ERP’s sole purpose is
to capture information into a database by providing the end-user
with predefined fields to control the input.
5. 📊 Reports are Executed Against the ERP
System Affecting Performance….
The execution of these reports is also directly against the ERP’s
database, impacting the performance of the system when large
reports are run.
You will also find that any ERP system consists of hundreds, some
thousands, of tables within the database to store the data. The data
model is usually referred to as a relational model seeing the way the
tables are related to one-another.
6. 📊 Static Reports are Sufficient if you run your
Business Day-to-Day….
Now these reports are sufficient if you run your business on a day to
day principle, as they are very much historical and transactional in
nature
“Frankly, none of the customers I have met run their business in this
manner.”
7. 📈 Business Intelligence
What is business intelligence (BI)? Business Intelligence allows the
end-user to have an aggregated view of the data by different
dimensions. Each subject area within the business, like sales, debtors,
creditors, finance, inventory, hr, payroll, procurement and marketing
have their measures and dimensions. Allowing these units to have a
360-degree view of the business.
8. 📈 Business Intelligence is a Combination of
Software and Technologies…
BI is a combination of software and technologies that helps you
understand your business from all of these different dimensions. BI
gives you that single version of the truth, by consolidating data
across multiple systems within your business. A BI system is
architected to get information out very quickly. This architecture has
proven to deliver high performance across large data volumes as well
as high number of users.
9. 📈 Business Intelligence uses Technologies to
deliver Reports, Dashboards & Scorecards
BI also uses some technologies like in-memory and On-line Analytical
Processing (OLAP), to deliver reports, dashboards and scorecards to
end users much quicker. Allowing for ad-hoc analysis, for end users
that understands the business as well as the data and would like to
drill, slice and dice and pivot their data, referred to as self-service BI.
11. 📊 Reporting VS 📈 BI
Delivery
• Reporting gives static reports, parameterised and in a list format.
• BI allows for dynamic dashboards and scorecards across multiple areas
within the business, providing a consolidated view to drill, pivot and slice-
and-dice your data.
• BI also goes a step further and allows for predictive analytics like
forecasting based on historical data, patterns and trend.
• Allowing you to be pro-active, compared to a reporting environment that
only allows for reactive management.
12. 📊 Reporting VS 📈 BI
Performance
• BI can deliver high volumes of data to a large number of users, because
of the combination of architecture, software and technologies.
• It is important to understand that BI does not sit within the ERP like
reporting as much as it sits on top of the ERP. Thus, the BI environment is
not impacting the ERP environment and vice versa.
13. 📊 Reporting VS 📈 BI
Analytics
• As mentioned before, reporting provides a static list format of data
based on certain parameters, where BI provides dynamic visualisations
to better understand your data.
• End users can easily interact with data like, slicing and dicing the data, to
spot outliers, patterns and trends. Giving business users the capabilities
to analyse their data across time, customers, vendors, products etc.
14. 📊 Reporting VS 📈 BI
Decision Making
• Reporting allows for short term and reactive decision making as the
reports are very static and a lot of manual work needs to be done to
consolidate data from multiple dimensions.
• BI allows decision-making that directly affects your strategy. Key
performance indicators (KPI) are set within a BI environment and can be
closely tracked, to monitor business performance.
15. How do you move from Reporting
to Business Intelligence?
There are many vendors out there that provide BI solutions, some
being more advanced and integrated than others.
“A complete BI solution that provides a data warehouse, business
specific subject area cubes and a visual presentation layer that comes
at an affordable cost is very hard to find.”
16. Use Business Analytics to move
from Reporting to Business
Intelligence?
Business Analytics provides data warehouse automation that allows
for rapid warehouse deployment for that single version of the truth,
cubes that provide business specific subject areas exposed and
visualised through a familiar Excel interface to provide self-service BI
within in the Microsoft framework.
17. Chat to us About Leveraging your
Business Data… Our Customers Did!