1. MohdArif et al. Int. Journal of Engineering Research and Applications www.ijera.com
ISSN : 2248-9622, Vol. 5, Issue 5, ( Part -5) May 2015, pp.78-83
www.ijera.com 78 | P a g e
Universal Engineering Model for Cooling Towers
MohdArif*, Md Nazeem khan**, Mohd Parvez**
(*Department of Mechanical Engineering, Al-Falah University, Faridabad, India)
(**Department of Mechanical Engineering, Al-Falah University, Faridabad, India)
(***Department of Mechanical Engineering, Al-Falah University, Faridabad, India)
ABSTRACT
This paper presents a universal engineering model, which can be used to formulates both counter-flow and
cross-flow cooling towers. By using fundamental laws of mass and energy balance, the effectiveness of heat
exchange is approximated by a second order polynomial equation. Gauss -Newton and Levenberg-Marquardt
methods are then used to determine the coefficients from manufactures data. Compared with the existing
models, the new model has two main advantages: (1) As the engineering model is derived from engineering
perspective, it involves fewer input variables and has better description of the cooling tower operation; (2) There
is no iterative computation required, this feature is very important for online optimization of cooling tower
performance. Although the model is simple, the results are very accurate. Application examples are given to
compare the proposed model with commonly used models.
Keywords: Counter-flow, Cooling Tower, Effectiveness, HVAC
I. INTRODUCTION
Cooling towers are commonly used to dissipate
heat from heat sources to heat sink (ambient
environment). Their applications are typically in
Heating Ventilation and Air Conditioning (HVAC)
systems and power generators, etc. Heat rejection of
cooling towers is accomplished by heat and mass
transfer between hot water droplets and ambient air.
Although cooling towers are relatively inexpensive
and normally consume around ten percent of the
whole system energy, their operation has significant
effect to the energy consumption of other related
subsystems (RMIRA 1995; Michel 1995). Therefore,
optimizing cooling tower performance will not only
increase the tower efficiencies but also has direct
effect to other subsystems. As such, there has been
some research interest in this area. Austin (1997)
recommended regression methods to create the
models of each component in air conditioning
systems for predicting and optimizing the system
performance. Flake (1997) utilized a different
regression technique to determine parameters of the
cooling tower model developed by Braun (1989) and
to build a predictive model for optimal supervisory
control strategies. However, due to the lacking of an
effective and precise model for cooling towers, which
is essential to estimate and verify the energy savings
by different optimization strategies, the research on
optimization of cooling tower performance is still in
the primary stage Attempts to develop the cooling
tower models have a relative long history, the first
such work may trace back to 1925, when Merkel
developed a practical model for cooling tower
operation, which has been the basis for most modern
cooling tower analyses. In his model, the water loss
of evaporation is neglected and the Lewis number is
assumed to be one in order to simplify the analysis.
However, as evaporate water cannot be neglected in
cooling tower operation, Merkel’s model is not
accurate enough and not suitable for real
applications. A more rigorous analysis of a cooling
tower model that relaxed Merkel’s restriction was
given by Sutherland (1983). In 1989, Braun
developed “effectiveness models” for cooling towers,
which utilized the assumption of a linearized air
saturation enthalpy and the modified definition of
number of transfer units. The models were useful for
both design and system simulation and has been
adopted by the simulation software TRNSYS (SEL
2000). However, Braun’s model needs iterative
computation to obtain the output results and is not
suitable for online optimization. Bernier (1994)
reviewed the heat and mass transfer process in
cooling towers at water droplet level and analyzed an
idealized spray-type tower in one-dimension, which
is useful for cooling tower designers, but no much
information is provided to plant operators. Soylemez
(1999) presented a quick method for estimating the
size and performance of forced draft countercurrent
cooling towers and experimental results were used to
validate the prediction formulation. Unfortunately,
this model also need iterative computation and not
suitable for online optimization.
In this paper, a universal engineering model, which
can be used to formulate both counterflow and
crossflow cooling towers, is proposed. Extending the
methods provided by Merkel and Braun and using
fundamental laws of mass and energy balance, the
RESEARCH ARTICLE OPEN ACCESS
2. MohdArif et al. Int. Journal of Engineering Research and Applications www.ijera.com
ISSN : 2248-9622, Vol. 5, Issue 5, ( Part -5) May 2015, pp.78-83
www.ijera.com 79 | P a g e
effectiveness of heat exchange is approximated by a
second order polynomial equation. Gauss-Newton
and Levenberg-Marquardt methods are then used to
determine the coefficients from manufactures data.
Compared with the existing models, the new model
has two main advantages: (1) As the engineering
model is derived from engineering perspective, it
involves fewer input variables and has better
description of the cooling tower operation; (2) There
is no iterative computation required, this feature is
very important for online optimization of cooling
tower performance. Although the model is simple,
the results are very accurate. Application examples
are given for both counter flow and cross flow to
compare the proposed model with commonly used
models four governing equations can be used to
express the mass and energy balance in the system:
1) Mass
conservation of
air:
𝑚 𝑎,𝑖 + 𝑚 𝑒 = 𝑚 𝑎,𝑜 (1)
2) Heat
conservation of
air:
𝑚 𝑎,𝑖ℎ 𝑎,𝑖 + 𝑄𝑟𝑒𝑗 − 𝑄𝑒
= 𝑚 𝑎,𝑜ℎ 𝑎,𝑜
(2)
3) Mass
conservation of
condenser
water:
𝑚 𝑤,𝑖 − 𝑚 𝑒 + 𝑚 𝑚
= 𝑚 𝑤,𝑜
(3)
4) Heat
conservation of
condenser
water:
𝑚 𝑤,𝑖 𝑇𝑤,𝑖 𝐶𝑝𝑤 + 𝑄𝑟𝑒𝑗
+ 𝑚 𝑚 𝑇 𝑚 𝐶𝑝𝑤
= 𝑚 𝑤,𝑜 𝑇𝑤,𝑜 𝐶𝑝𝑤
(4)
In the governing equations, there are nine known
parameters including: six input variables,ha,i,
ma,i, mw,i , mm , Tm , Tw,i ; a constant Cpw; and two
measurable output variables mw,o ; Tw,o, and five
unknowns: three output variables: ha,i , ma,o and
, Qarej ; and two unmeasurable variables me and Qe .
As the unknown variables are more than the number
governing equations, it is insufficient to determine all
outlet conditions by the four governing equations
alone, additional equations that could depict the
characteristics of the cooling tower should be added.
In Braun’s model with effectiveness coefficient
(1989), the derivative of saturation air enthalpy with
respect to temperature, Cs, is introduced and used to
formulate the cooling load model. εa is also added as
a ratio of the actual heat transfer amount to the
theoretical maximum amount:
𝑄𝑟𝑒𝑗 = 𝜀 𝑎 𝑚 𝑎 (ℎ 𝑠,𝑤,𝑖 − ℎ 𝑎,𝑖) (5)
Analogous to a dry counter flow heat exchanger, the
effectiveness, εa , is evaluated by :
𝜀 𝑎 =
1−𝑒−𝑁𝑇𝑈 1−𝑚 ∗
1−𝑚∗ 𝑒−𝑁𝑇𝑈 1−𝑚 ∗ (6)
with NTU, m∗
, and Cs calculated respectively by:
𝑁𝑇𝑈 = 𝑐
𝑚 𝑎
𝑚 𝑤
−(1+𝑛)
(7)
𝑚∗
=
𝑚 𝑎
𝑚 𝑤
.
𝐶 𝑠
𝐶 𝑝𝑤
(8)
𝐶𝑠 =
𝑑ℎ 𝑠
𝑑𝑇 𝑇=𝑇 𝑤
≈
ℎ 𝑠,𝑤,𝑖−ℎ 𝑠,𝑤,𝑜
𝑇 𝑤,𝑖−𝑇 𝑤,𝑜
(9)
where, c and n are empirical constants specific to a
particular tower design derived from the
manufacturer. These two parameters are correlated as
a straight line on a log-log plot of NTU vs. the flow
rate ratio. Since Cs depends on outlet conditions of
cooling tower— Tw,o and hs,w,o , it cannot be
computed directly. Consequently, the outlet
conditions of cooling tower need to be guessed
initially at the reasonable values, and iterative
computation is engaged for Equation (1)-(9) to
calculate the ultimate results.
Although Braun’s model is more accurate than
Merkel’s one, it also has several problems.
The computations are very complicated, it
needs iterative computation to get the final
results, and the estimated outlet water
temperature is needed before calculation;
It is hard to find the function derivatives,
which are useful in real-time optimization
analysis;
The model was derived based on
mechanical principles, it only suitable for
the counter flow cooling towers. For the
crossflow cooling towers, a different model
is needed.
II. MODELS AND ANALYSIS
The main difficulties in real-time application of
Braun’s model are the initial estimation of 𝐶𝑠 and
highly nonlinearities of 𝜀 𝑎 , which resulted in a
complicated and time consuming computation. To
develop an effective engineering model, let’s analysis
both 𝐶𝑠 and 𝜀 𝑎form fundamental laws of mass and
energy balance.
2.1 Analysis Cs :
In Braun’s model (1989), a straight line between
water inlet temperature and water outlet temperature
on the air saturation enthalpy with respect to
temperature is used to approximate the curve between
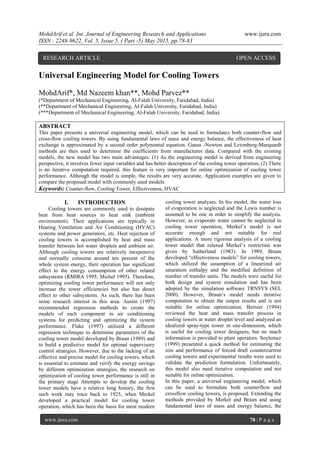
water inlet point and water outlet point (Fig 1), where
𝐶𝑠 is the ratio of length of line (1) ℎ 𝑠,𝑤,𝑖 − ℎ 𝑠,𝑤,𝑜 to
line (2) 𝑇𝑤,𝑖 − 𝑇𝑤,𝑜 .
3. MohdArif et al. Int. Journal of Engineering Research and Applications www.ijera.com
ISSN : 2248-9622, Vol. 5, Issue 5, ( Part -5) May 2015, pp.78-83
www.ijera.com 80 | P a g e
Fig 1. Saturation air enthalpy vs. temperature
For control and optimization purpose, however 𝑇𝑤,𝑜
and ℎ 𝑠,𝑤,𝑜 are output variables, which need to be
controlled, therefore, these two variables should not
be used as input variables to calculate the heat
rejection ration . Instead, we may express Equation
(9) with measurable variables as:
𝐶𝑠
𝑑ℎ 𝑠
𝑑𝑇 𝑇=𝑇 𝑤
≈
(ℎ 𝑠,𝑤,𝑖−ℎ 𝑠,𝑤𝑏 )+ 1(∆ℎ)
𝑇 𝑤,𝑖−𝑇 𝑤𝑏 + 2(∆𝑇)
(10)
where, ∆T is the approach of the cooling tower and
represents the difference between line (4) and line (2)
in Fig 1; ∆h is the saturated air enthalpy difference
with respect to ∆T. By energy and mass conservation
laws, the approach, ∆T, is a function of
𝑚 𝑎
𝑚 𝑤
and Tw,i − Twb , as the approach is affected by
the mass flow rate of both air and water and the
temperature difference between inlet water and
ambient air. ∆h can be considered as a function of ∆T,
also the function of
𝑚 𝑎
𝑚 𝑤
and 𝑦 = (𝑇𝑤.𝑖 − 𝑇𝑤𝑏 ).
Therefore, 𝐶𝑠 can be described as:
𝐶𝑠 = 𝑓3
𝑚 𝑎
𝑚 𝑤
(𝑇𝑤.𝑖 − 𝑇𝑤𝑏 ) (11)
2.2 Analysis 𝜺 𝒂:
From the Equation (6), (7), and (8), it clear shows
that the heat transfer effectiveness, 𝜀 𝑎, is the function
of NTU and m*, where NTU is the function of
ma
mw
and m* is the function of
ma
mw
and Cs. By
Equation (11), Cs is the function of
ma
mw
and (Tw.i −
Twb ). Then, we can obtain a general expression for
𝜀 𝑎 as:
𝜀 𝑎 = 𝑓𝑢𝑛𝑐𝑡𝑖𝑜𝑛
𝑚 𝑎
𝑚 𝑤
(𝑇𝑤.𝑖 − 𝑇𝑤𝑏 ) =
𝑓𝑢𝑛𝑐𝑡𝑖𝑜𝑛(𝑥, 𝑦) (12)
Where x =
ma
mw
and y= (Tw.i − Twb ) The heat
transfer effectiveness is the function of two variables,
which are the inlet conditions of the cooling tower.
As finding the exact function for Equation (12) is
neither practical nor necessary for real-time
application, the following engineering solution is
proposed.
Engineering model:
In order to solve the problem above, Taylor’s series
expansion is used as an approximation of the
unknown function in Equation (12). It is clear that 𝜀 𝑎
is a continuous variable under normal operating
conditions, its derivative and high-order derivatives
exist. Thus, we can apply Taylor’s series expansion
for two variables into 𝜀 𝑎 function. Because the
characteristics of cooling towers are highly nonlinear,
second-order Taylor’s series expansion is used to
better reflect the nonlinearity.
𝑓 𝑥, 𝑦 = 𝑓 𝑥0, 𝑦0 +
𝜕𝑓(𝑥0,𝑦0)
𝜕𝑥
𝑥 − 𝑥0 +
𝜕𝑓(𝑥0,𝑦0)
𝜕𝑦
(𝑦 −
𝑦0)+12!𝜕2𝑓(𝑥0,𝑦0)𝜕𝑥2𝑥−𝑥02+𝜕2𝑓(𝑥0,𝑦0)𝜕𝑦2𝑦−𝑦02
+2𝜕2𝑓(𝑥0,𝑦0)𝜕𝑥𝜕𝑦(𝑥−𝑥0)𝑦−𝑦0
(13)
Where, 𝑥0, 𝑦0 is any reasonable operating point of
cooling tower near (x, y). Once the point 𝑥0, 𝑦0 is
determined, 𝑥0, 𝑦0, 𝑓 𝑥0, 𝑦0 ,
𝜕𝑓(𝑥0,𝑦0)
𝜕𝑥
,
𝜕𝑓(𝑥0,𝑦0)
𝜕𝑦
,
𝜕2 𝑓(𝑥0,𝑦0)
𝜕𝑥2
,
𝜕2 𝑓(𝑥0,𝑦0)
𝜕𝑦 2
and
𝜕2 𝑓(𝑥0,𝑦0)
𝜕𝑥𝜕𝑦
can be treat as the
constants
To express the equation in neat way, Equation (13) is
rearranged and written as a function of two variables
form.
𝜀 𝑎 = 𝑐0 + 𝐶𝑐1
𝑚 𝑎
𝑚 𝑤
+ 𝑐2 𝑇𝑤.𝑖 − 𝑇𝑤𝑏 + 𝑐3
𝑚 𝑎
𝑚 𝑤
2
+
𝑐4 𝑇𝑤.𝑖 − 𝑇𝑤𝑏
2
+ 𝑐5
𝑚 𝑎
𝑚 𝑤
𝑇𝑤.𝑖 − 𝑇𝑤𝑏 (14)
Where, the coefficients, 𝑐0 − 𝑐5, are constants, and
determined only by the cooling tower characteristics,
which depend on the towers’ structure and design.
III. ALGORITHMS FOR
DETERMINING ENGINEERING
MODEL
The real performance data of the cooling tower
provided by manufacturers are used in our method.
.The objective function is given as:
𝑚𝑖𝑛
1
2
𝑁
𝑖=1 (𝑓𝑢𝑛𝑐𝑡𝑖𝑜𝑛(𝑐0, 𝑐1, 𝑐2, 𝑐3, 𝑐4, 𝑐5) −
𝐹𝑑𝑎𝑡𝑎𝑖)2 (15)
Where the function(.) is the right hand side of
Equation (14) and the real performance data of
cooling tower are represented by Fdatai. N is the
number of the sampling points. Fdatai can be derived
from manufacturers’ data by lookup -table or
interpolation. In order to obtain accurate results, the
number of sampling points must more than that of
coefficients, i.e. N> 5. Furthermore, the sampling
points should be distributed evenly among the whole
4. MohdArif et al. Int. Journal of Engineering Research and Applications www.ijera.com
ISSN : 2248-9622, Vol. 5, Issue 5, ( Part -5) May 2015, pp.78-83
www.ijera.com 81 | P a g e
range of operation.
Nonlinear least square method for curve fitting is
used to solve Equation (15), both Gauss-Newton and
Levenberg-Marquardt methods are implemented in
the optimization algorithms (Coleman et al. 1999). In
Gauss- Newton method, a search direction dk is
obtained at each major iteration step. The search
direction is expressed as:
J ukT
J ukdk−J ukFuk(16)
Where, 𝑢 = [𝑐0, 𝑐1, 𝑐2, 𝑐3, 𝑐, 𝑐5, ] 𝑇
; 𝑢 𝑘is the u value
of the kth iteration;
𝐹𝑖 𝑢 𝑘 =
1
2
(𝑓𝑢𝑛𝑐𝑡𝑖𝑜𝑛 𝑢 − 𝐹𝑑𝑎𝑡𝑎𝑖)2
;
𝐹 𝑢 𝑘 = 𝐹1 𝑢 𝑘 , 𝐹2 𝑢 𝑘 ⋯ , 𝐹 𝑁(𝑢 𝑘) 𝑇
;
𝐽 𝑢 𝑘 = j
c0
c1
.
.
.
c5
=
∂F1
∂c0
∂F1
∂c1
∂F2
∂c0
∂F2
∂c1
⋯
∂F1
∂c5
⋯
∂F2
∂c5
⋮ ⋮
∂FN
∂c0
∂FN
∂c1
⋱ ⋮
⋯
∂FN
∂c5
Juk is the Jacobian matrix with respect to uk. In the
case of H(uk) (Hessian Matrix of Fi(uk)) is
significant,Levenberg-Marquardt method is adopted.
It uses a search direction between the Gauss- Newton
direction and the steepest descent. This makes it less
effective but more robust than the Gauss-Newton
method. The Levenberg- Marquardt method is given
by:
𝐽 𝑢 𝑘
𝑇
𝐽 𝑢 𝑘 + 𝜆 𝑘 𝐼 𝑑 𝑘 = −𝐽 𝑢 𝑘 𝐹(𝑢 𝑘) (17)
In this equation, 𝜆 𝑘 controls both magnitude and
direction of 𝑑 𝑘 . When 𝜆 𝑘 is zero, the direction 𝑑 𝑘 is
identical to that of the Gauss-Newton method. As 𝜆 𝑘
tends to infinity, 𝑑 𝑘 tends towards a vector of zeros
and a steepest descent direction.
Remarks
1. In this method, the coefficients 𝑐0 − 𝑐5 are
determined offline by curve fitting in the
whole operating range. Therefore, the real-
time output calculation is straightforward
once the input variables are measured.
2. For more accurate results, it is possible to
construct a look up table for coefficients
𝑐0 − 𝑐5 by dividing the whole operating
range into sub-regions. One set of
coefficients is selected at one time
according to the cooling tower operation
conditions.
3. In Bruan’s model, both NTU and 𝜀 𝑎are
exponential functions, which requires
substantial computing effort. Whereas, in
the new model 𝜀 𝑎 is in a polynomial form
which is much easier to calculate and
suitable for on-line optimization.
4. For crossflow cooling towers, the analysis
is almost same except Equation (6), which
takes the following form according to the
heat exchange principle.
𝜀 𝑎 =
1
𝑚∗ 1 − 𝑒−𝑚∗ −𝑒−𝑁𝑇𝑈
(18)
However, this change will not affect the
model structure. The differences of the
different cooling tower models are
determined by coefficients of Equation (14).
Therefore, both counterflow and crossflow
cooling towers can be represented by the
same model.
5. In practice, it is very hard to measure the
inlet and outlet airflow rate ( ma,i and ma,o
) accurately. This problem could be solved
as follows:
Using energy conservation principle, we can
replace mahs,w,i−ha,i by mwCpwTw,i−Twb;
Writing
𝜀 𝑎 =
𝑚 𝑤,𝑖 𝐶 𝑝𝑤 𝑇 𝑤,𝑖+𝑚 𝑚 𝐶 𝑝𝑤 𝑇 𝑚 −𝑚 𝑤,𝑜 𝐶 𝑝𝑤 𝑇 𝑤,𝑜
𝑚 𝑤 ,𝑜 𝐶 𝑝𝑤 (𝑇 𝑤,𝑖−𝑇 𝑤𝑏 )
in Equation (19), according to the known variables:
εa , Tw,i , Twb , and mw,o , Equation (14) is again used
inversely to find the value of the mass airflow rate,
𝑚 𝑎 . The value will then be employed to determine
the overall heat rejection rate at the next sample time.
IV. RESULT
To validate the proposed model, the outputs of
new model are compared with model provided by
Braun (1989). Both counterflow and crossflow design
cooling towers are used to illustrate its universeness.
The parameters of cooling tower are given in
following:
Air flow rate: 10.7-32.7
kg/s (1.41-4.32*10
5
gpm);
Water flow rate: 21.7 kg/s
(344 gpm);
Inlet water temperature: 38C
(100.4F);
Ambient dry-bulb temperature: 35C
(95F);
Ambient wet-bulb temperature: 21-31C
(69.8-87.8F);
cin Equation (7): 2.3
(dimensionless);
nin Equation (7): -
0.72(dimensionless).
For the counterflow cooling tower, the heat transfer
effectiveness, εa ,varied with mass flow ratio of air to
water and the ambient wet-bulb temperature shown in
fig 2.
5. MohdArif et al. Int. Journal of Engineering Research and Applications www.ijera.com
ISSN : 2248-9622, Vol. 5, Issue 5, ( Part -5) May 2015, pp.78-83
www.ijera.com 82 | P a g e
Fig 2. Comparison of heat transfer effectiveness of
two models
where Ea1 and Ea2 are heat transfer effectiveness of
Braun’s model in ambient wet-bulb temperature 26C
and 30C respectively. Curve1 is the heat transfer
effectiveness given by the new model under 26C
wet-bulb temperature, and Curve2 under 30C wet-
bulb temperature. According to the figure, the results
of two models are almost same.
Fig 3. Counterflow cooling tower models
Fig 4. Counterflow cooling tower models
The results of heat rejection for the counterflow and
crossflow cooling towers are shown in fig 3 and 4
respectively. There are totally 121 points on each
figure. From the figures, it is clearly that the new
model can predict the performance of cooling tower
very well.
V. CONCLUSIONS
The new engineering model for cooling towers,
which can be used to formulate both counterflow and
crossflow cooling towers, has been presented in this
paper. The methods of Merkel and Braun and
fundamental laws of mass and energy balance are
used to develop the effectiveness of heat exchange
with polynomial form. Nonlinear least square curve -
fitting methods are used to determine the coefficients
of the model. Some engineering considerations are
also discussed. The comparison study of existing and
the new model is given to show that the new model
can predict the performance of both counterflow and
crossflow cooling tower accurately with less
computation. As the manufacture data are used to
determine the coefficients for the model, it is
predicted that it should have better performance
compared with the existing one’s.
In practice, many unpredictable factors affect the
performance of the cooling towers, such as outdoor
airflow rate, interior problems of cooling tower,
and measurement errors, etc. Therefore, the
coefficients of cooling tower model may not be
constant during the operational life span. Fault
detection or adaptive scheme should be added to
accommodate these changes; these aspects are also
subject to future study. Utilizing the model for on-
line optimization of both cooling towers and
chillers as well as condenser water loop for HVAC
systems is currently under study; the research
results will be published soon.
REFERENCES
[1] Ahmed, O., “DDC applications in variable-
water-volume systems,” ASHRAE
Transactions, Vol. 97(1), pp. 751-758, 1991.
[2] ASHRAE, ASHRAE Handbook—HVAC
Systems and Equipment, American Society of
Heating, Refrigerating, and Air-Conditioning
Engineers Inc., 1996.
[3] Austin, S.B., “Regression analysis for savings
verification,” ASHRAE Journal, Vol. 39, No.
10, pp. 57-63, 1997. Bernier, M.A., “Cooling
tower performance: theory and experiments,”
ASHRAE Transactions, Vol. 100(2), pp.114-
121, 1994.
[4] Braun, J.E., Klein, S.A. and Mitchell, J.W.,
“Effectiveness models for cooling towers and
cooling coils,” ASHRAE Transactions, Vol.
95(2), pp. 164-174, 1989.
[5] Burger, R., Cooling Tower Technology—
Maintenance, Updating and Rebuilding,
Fairmont Press Inc., 1995. Coleman, T.,
Branch, M.N. and Grace, A., Optimization
Toolbox for Use with MATLAB, MathWorks
Inc., 1999. Flake, B.A., “Parameter
estimation for multiresponse nonlinear
chilled-water plant models,” ASHRAE
Transactions,Vol. 97(1), pp. 470-485, 1997.
[6] Merkel, F., “Verdunstungskuhlung,” VDI
Forschungsarbeiten, No. 275, Berlin, 1925.
[7] Michel, A.B., “Thermal performance of
cooling towers,” ASHRAE Journal, Vol. 37,
No. 4, pp. 56-61, 1995. Mick, S., “Take it to
the limit … or just halfway?” ASHRAE
6. MohdArif et al. Int. Journal of Engineering Research and Applications www.ijera.com
ISSN : 2248-9622, Vol. 5, Issue 5, ( Part -5) May 2015, pp.78-83
www.ijera.com 83 | P a g e
Journal, Vol. 40, No. 7, pp. 32-39, 1998.
[8] Rocky Mountain Institute Research
Associates, Commercial Space Cooling and
Air Handling, Technology Atlas, E Source
Inc., 1995.
[9] Solar Energy Laboratory, Reference Manual
of TRNSYS, University of Wisconsin-
Madison, 2000.
[10] Soylemez, M.S., “Theoretical and
experimental analyses of cooling towers,”
ASHRAE Transactions, Vol. 105(1), pp. 330-
337, 1999.
[11] Sutherland, J.W., “Analysis of mechanical
draught counterflow air/water cooling
towers,” Journal of Heat Transfer, Vol. 105,
pp. 576-583, 1983.