This document presents a study that uses Particle Swarm Optimization (PSO) technique to solve the Dynamic Economic Dispatch (DED) problem for a 9-bus power system with 3 generators over a 24-hour period. The objective is to determine the optimal generator outputs at each hour to minimize total generation costs while satisfying system constraints. PSO is applied to find the optimal solution by updating generator output positions based on personal and global best cost values. Results found the minimum cost schedule for each generator over the 24 hours while ensuring system limits were not violated.
![Bulletin of Electrical Engineering and Informatics
Vol. 7, No. 3, September 2018, pp. 458~464
ISSN: 2302-9285, DOI: 10.11591/eei.v7i3.1278 458
Journal homepage: http://journal.portalgaruda.org/index.php/EEI/index
Dynamic Economic Dispatch Assessment Using Particle Swarm
Optimization Technique
Muhammad Murtadha Othman1
, Mohd Affendi Ismail Salim2
, Ismail Musirin3
, Nur Ashida Salim4
,
Mohammad Lutfi Othman5
1,2,3,4
Faculty of Electrical Engineering, Universiti Teknologi MARA, 40450 Shah Alam, Selangor, Malaysia
5
Centre for Advanced Power and Energy Research and Department of Electrical and Electronics Engineering,
Faculty of Engineering, Universiti Putra Malaysia, 43400 UPM Serdang, Selangor, Malaysia
Article Info ABSTRACT
Article history:
Received May 12, 2018
Revised Jul 20, 2018
Accepted Aug 11, 2018
This paper presents the application of Particle Swarm Optimization (PSO)
technique for solving the Dynamic Economic Dispatch (DED) problem. The
DED is one of the main functions in power system planning in order to
obtain optimum power system operation and control. It determines the
optimal operation of generating units at every predicted load demands over a
certain period of time. The optimum operation of generating units is obtained
by referring to the minimum total generation cost while the system is
operating within its limits. The DED based PSO technique is tested on a 9-
bus system containing of three generator bus, six load bus and twelve
transmission lines.
Keywords:
Dynamic Economic Dispatch
(DED)
Particle Swarm Optimization
(PSO) technique
Copyright © 2018 Institute of Advanced Engineering and Science.
All rights reserved.
Corresponding Author:
Muhammad Murtadha Othman,
Faculty of Electrical Engineering,
Universiti Teknologi MARA,
40450 Shah Alam, Selangor, Malaysia.
Email: mamat505my@yahoo.com
1. INTRODUCTION
DED is used to determine the optimal schedule of generating outputs on-line so as to meet the load
demand at the minimum operating cost under various system and operating constraints over the entire
dispatch periods. DED is an extension of the conventional economic dispatch problem that takes into
consideration the limits on the ramp rate of generating units to maintain the life of generation equipment. The
ramp rate constraints distinguish the DED problem from the traditional, static Economic Dispatch (ED)
[1],[2]. In general, the DED is solved by discretization of the entire dispatch period into a number of small
time periods.
Therefore, the static economic dispatch in each dispatch period is solved subject to the power
balance constraints and generator operating limits. Previous efforts on solving static ED problems have
employed various mathematical programming methods and optimization techniques. These conventional
methods include the lambda-iteration method, the base point and participation factors method, the gradient
method and dynamic programming (DP) [3].
Unfortunately, for generating units with non-linear characteristics, such as prohibited operating
zones, ramp rate limits, and non-convex cost functions, the conventional methods can hardly to obtain the
optimal solution. Furthermore, for a large-scale mixed-generating system, the conventional method has
oscillatory problem resulting in a local minimum solution or a longer solution time [4].
In order to make numerical methods more convenient in solving non-convex DED problems,
artificial intelligent techniques, such as the gradient-type Hopfield neural networks, have been employed to](https://image.slidesharecdn.com/171278-210621033128/85/Dynamic-Economic-Dispatch-Assessment-Using-Particle-Swarm-Optimization-Technique-1-320.jpg)
![BEEI ISSN: 2302-9285
Dynamic Economic Dispatch Assessment Using Particle Swarm... (Muhammad Murtadha Othman)
459
solve DED problems for units with ramping rate limit and spinning reserve constraint [5]. However, an
unsuitable transfer function adopted in the Hopfield model may suffer from excessive numerical iterations,
resulting in huge calculations [6].
In the past decade, the global optimization techniques known as genetic algorithms (GA), simulated
annealing (SA), tabu search (TS), and evolutionary programming (EP), which are the forms of probabilistic
heuristic algorithm, have been successfully used to overcome the non-convexity problems of the constrained
ED [7],[8]. The GA method has usually better efficiency than the SA method because the GA has parallel
search techniques, which emulate natural genetic operations. Due to its high potential for global optimization,
GA has received great attention in solving DED problems.
Therefore, PSO based economic dispatch algorithm has been reported and it has been shown that the
algorithm is capable of finding the global or near global optimum solutions for large optimization problems.
This paper presents an application of PSO technique to solve the DED problem in a power system. A 9 bus
system containing of three generator bus, six load bus and twelve transmission lines is used as case study to
show the effectiveness of the PSO technique over DED. The DED is determined by referring to the best
minimum of total generation cost. The best minimum of total generation cost is determined by gbest value
produced from PSO.
2. DED METHODOLOGY
The objective function of dynamic economic dispatch (DED) is to schedule the outputs
economically over a certain period of time under various system and operational constraints. The problem is
formulated as follows:
= =
=
T
t
N
i
it
it
t P
F
F
1 1
)
( (1)
where; Ft: total operating cost over the whole dispatch period.
T: number of hours in the time horizon.
N: number generating units.
Fit (Pit): fuel cost in terms of its real power output, Pit , at time, t.
The thermal plant can be expressed as input-output models where the input is the electric power
output of each unit and the output is the fuel cost. The quadratic fuel cost function is given as follows:
2
)
( it
i
it
i
i
it
it P
c
P
b
a
P
F +
+
= (2)
where; 𝑎𝑖 , 𝑏𝑖, 𝑐𝑖 : fuel cost coefficients of the ith
generator.
The objective function of DED is acquired by fulfilling the equality constraint of real power balance
and inequality constraint of real power operating given in Equations 3 and 4, respectively.
Lt
Dt
N
i
it P
P
P +
=
=1
(3)
where; Dt
P : forecasted total power demand at time, t.
Lt
P : transmission loss at time, t.
max
min it
it
it P
P
P
(4)
where; min
it
P : minimum real power output of generator i that can supply at time, t.
max
it
P : maximum real power output of generator i that can supply at time, t.
2.1. Representation of Particle Positions
In an initial process of PSO that is k=1 the positions or components (generating units) for each
particle is randomly initialized within the feasible range such a way that it should satisfy the constraint given
by Equation 4. In every jth
particle ( t
j
X ,
), there are N, total number of generators at every time interval, t.
The arrangement of generator’s components or positions for each particle, j, is shown in Equation 5.](https://image.slidesharecdn.com/171278-210621033128/85/Dynamic-Economic-Dispatch-Assessment-Using-Particle-Swarm-Optimization-Technique-2-320.jpg)
![ ISSN: 2302-9285
BEEI, Vol. 7, No. 3, September 2018 : 458 – 464
460
=
NT
N
N
T
T
j
S
S
S
S
S
S
S
S
S
X
2
1
2
22
21
1
12
11
(5)
where; it
P = it
S : component or position of a particle, which is the real power output of, ith
, generating unit
at time interval, t.
j : number of particles.
The best particle, j
X , is selected which gives a minimum value of generation cost function given by
Equation 1. This shows that the best, j
X , is referred to as, gbest, of all particles in the current iteration.
2.2. PSO Technique
Kennedy et al. [9]-[11] has mentioned that the PSO is basically developed through simulation of
bird flocking in two-dimension space. The position of each particle is represented by XY co-ordinate. The
velocity is expressed by Vx (the velocity of X axis) and Vy (the velocity of Y axis). Modification of the
particle position is realized by position and velocity information. Bird flocking optimizes a certain objective
function. Each particle knows its best value so far (pbest) and its XY position. This information is analogous
to personal experiences of each particle. Moreover, each particle knows the best value so far in the group
(gbest) among pbests. This information is analogous to knowledge of how the other agents around them have
performed. Now, each agent tries to modify its position using the information, such as, the current positions
(x, y), the current velocities (Vx,Vy), the distance between the current position and pbesti and the distance
between the current position and gbest. These modifications can be represented by the concept of velocity.
Velocity of each particle can be modified by the following equation:
)
(
)
( 2
2
1
1
1 k
i
k
i
i
k
i
k
i S
gbest
rand
c
S
pbest
rand
c
wV
V −
+
−
+
=
+ (6)
The following weighting function usually utilized in Equation 1.
iter
iter
w
w
w
w
−
−
=
max
min
max
max
)
( (7)
where; max
w : maximum inertia weight
min
w : minimum inertia weight
max
iter : maximum iteration number
iter : current iteration number
Using the Equation 7, a certain velocity, which gradually gets close to pbest and gbest can be
calculated. The current position (searching point in the solution space) can be modified by the following
equation.
1
1 +
+
+
= k
i
k
i
k
i V
S
S (8)
where; k
i
V : velocity of particle j at iteration k.
1
+
k
i
V : velocity of particle j at iteration k+1.
w: inertia weight factor.
1
c : constant weighting factor related to pbest.
2
c : constant weighting factor related to gbest.
1
rand : random number between 0 and 1.
2
rand : random number between 0 and 1.
k
i
S : current position of particle j at iteration k.
1
+
k
i
S : current position of particle j at iteration k+1.
i
pbest : best position of particle j.](https://image.slidesharecdn.com/171278-210621033128/85/Dynamic-Economic-Dispatch-Assessment-Using-Particle-Swarm-Optimization-Technique-3-320.jpg)
![BEEI ISSN: 2302-9285
Dynamic Economic Dispatch Assessment Using Particle Swarm... (Muhammad Murtadha Othman)
461
gbest : best particle.
The basic procedure of PSO is presented in term of flow chart shown in Figure 1.
Start
Generation of initial
conditions or positions of
each particle,
Update new velocity,
by using equation (6).
Update new position,
by using equation (8).
Is k = itermax ?
Yes
No
1
+
k
i
V
1
+
k
i
S
End
t
j
X ,
Figure 1. Flowchart of PSO procedure
2.3. DED based PSO Technique
The procedures of PSO technique that used for solving the DED for every time interval are
explained as follows:
a. Initialize the particle, j
X and velocity, i
V . The velocity, i
V should be in the range of [Vmax,Vmin] and
each particle should satisfy the constraint given by Equation 4.
b. Calculate the generation fuel cost F( i
S ) for each position or generator, i
S in every particle, j.
c. Obtain the pbest for every generator which refers to the minimum generation fuel cost.
d. Obtain the gbest which refers to a particle with minimum amount of total fuel cost.
e. Update i
V by using Equation 6. If i
V < min
i
V then, i
V = min
i
V . On the other hand, if i
V > max
i
V then, i
V =
max
i
V .
f. Update it
S for every particle by using Equation 8. Check whether each generator’s output is within its
operating limit. If i
S < min
i
S then, i
S = min
i
S . Besides that, if i
S > max
i
S then, i
S = max
i
S .
g. Go to the next time interval, t. Repeat procedure b) – f) until t=T.
h. Repeat procedure b) – g) until k=itermax.
i. Record the t
i
S ,
which refers to gbest.
The procedures of PSO technique that used for solving the DED for every time interval are
presented in term of flow chart shown in Figure 2.](https://image.slidesharecdn.com/171278-210621033128/85/Dynamic-Economic-Dispatch-Assessment-Using-Particle-Swarm-Optimization-Technique-4-320.jpg)
![ ISSN: 2302-9285
BEEI, Vol. 7, No. 3, September 2018 : 458 – 464
462
Initialize the particle position, Xj
and velocity, Vi.
Calculate the generation fuel cost
F(Si) for each position in every
particle, j.
Obtain the pbest for every
generator.
Obtain the gbest.
Update velocity, Vi by using
equation (6).
Is t =T ?
Is k = itermax ?
Update position, Sit for every
particle by using equation (8).
No
Yes
Start
Yes
No
End
Record Si,t which
refers to gbest
Figure 2. Flowchart of dynamic economic dispatch (DED) based particle swarm optimizaton (PCO)
technique
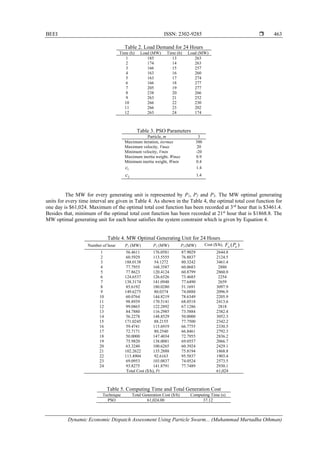
3. RESULTS AND DISCUSSION
A 9 bus system is used to demonstrate the performance of PSO to determine the DED of each
generator at every time interval [12]. The system consists of 3 units of generator, 6 load bus and 12
transmission lines. The load demand for the time intervals of 24 hours is given in Table 2. The information
for every generating unit is given in Table 1.
The simulation results of DED based PSO is obtained from a PC with Pentium 4 2.8 GHz processor
and 512MB RAM memory. The DED based PSO algorithm is written in MATLAB programming language.
The parameters which is used in the PSO is given in Table 3.
Table 1. Generator Unit Data
Quantities Unit 1 Unit 2 Unit 3
ai ($/h) 240 220 240
bi ($/MWh) 6.7 6.1 6.5
ci ($/MW2
h) 0.009 0.005 0.008
Pimin (MW) 50 50 50
Pimax (MW) 200 200 100](https://image.slidesharecdn.com/171278-210621033128/85/Dynamic-Economic-Dispatch-Assessment-Using-Particle-Swarm-Optimization-Technique-5-320.jpg)
![ ISSN: 2302-9285
BEEI, Vol. 7, No. 3, September 2018 : 458 – 464
464
4. CONCLUSION
Dynamic economic dispatch is a complex optimization problem whose importance may increase as
competition in power generation intensifies. The DED planning must perform the optimal generation
dispatch among the operating units to satisfy the system load demand, spinning reserve capacity, and
practical operation constraints of generators. PSO is a recent tool for solving complex optimization problems,
being attracted by the researchers in various diverse fields. It was also effectively used in solving complex
problems in the power system field. It is faster in finding quality solution compared to any evolutionary
computation technique but finds it difficult while exploring complex functions. It leads to premature
convergence and also has a poor fine tuning of the final solution. The PSO algorithm has been demonstrated
to have superior features, including high-quality solution and good computation efficiency. The results
showed that the proposed PSO method was indeed capable of obtaining higher quality solution efficiently in
constrained DED problems.
ACKNOWLEDGEMENT
The authors would like to acknowledge the Institute of Research Management & Innovation (IRMI),
UiTM Shah Alam, Selangor, Malaysia for the financial support of this research. This research is supported by
IRMI under the BESTARI Research Grant Scheme with project code: 600-IRMI/DANA 5/3/BESTARI
(119/2018).
REFERENCES
[1] Zou D., et al., “Solving the Dynamic Economic Dispatch by a Memory-Based Global Differential Evolution and a
Repair Technique of Constraint Handling,” Energy, vol. 147, pp. 59-80, 2018.
[2] Ding T. and Bie Z., “Parallel Augmented Lagrangian Relaxation for Dynamic Economic Dispatch Using Diagonal
Quadratic Approximation Method,” IEEE Transactions on Power Systems, vol/issue: 32(2), pp. 1115-1126, 2018.
[3] Asvany T., et al., “To Solve Economic Dispatch Problem Using Cooperative Particle Swarm Optimization
Algorithm,” IIOAB Journal, vol/issue: 8(2), pp. 191-198, 2017.
[4] Yare Y., “Intelligent Power System Operation in an Uncertain Environment,” PhD Thesis. Missouri University of
Science and Technology, 2010.
[5] Belhachem R., et al., “A Survey on Non Convex Dynamic Economic Dispatch Optimization Using Artificial
Intelligence Techniques,” Acta Electrotehnica, vol. 54, 2013.
[6] Benhamida F., et al., “Dynamic Economic Dispatch Solution with Practical Constraints Using a Recurrent Neural
Network,” Przegląd Elektrotechniczny, vol/issue: 87(8), pp. 149-153, 2011.
[7] Adarsh B. R., et al., “Economic Dispatch Using Chaotic Bat Algorithm,” Energy, vol. 96, pp. 666-675, 2016.
[8] Kamboj V. K., et al., “Solution of Non-Convex Economic Load Dispatch Problem for Small-Scale Power Systems
Using Ant Lion Optimizer,” Neural Computing and Applications, vol/issue: 28(8), pp. 2181-2192, 2017.
[9] Kennedy J. and Eberhart R., “Particle Swarm Optimization,” IEEE International Conference on Neural Networks
(ICNN’95). Perth, Australia, vol. IV, pp. 1942-1948, 1995.
[10] Kennedy J. and Eberhart R., “Swarm Intelligence,” Morgan Kaufmann Publishers, 2001.
[11] Kennedy J. and Eberhart R., “A Discrete Binary Version of the Particle Swarm Optimization Algorithm,” IEEE
International Conference on Systems, Man and Cybernetic (SMC’97). Orlando, Florida, USA, pp. 4104-4109,
1997.
[12] Saadat H., “Power System Analysis,” Third Edition. PSA Publishing, 2010.](https://image.slidesharecdn.com/171278-210621033128/85/Dynamic-Economic-Dispatch-Assessment-Using-Particle-Swarm-Optimization-Technique-7-320.jpg)