Download to read offline

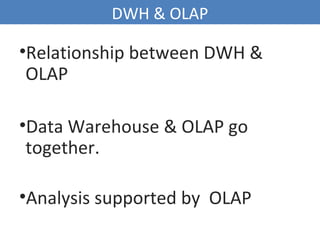
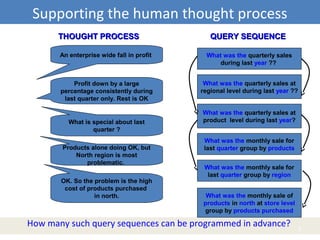
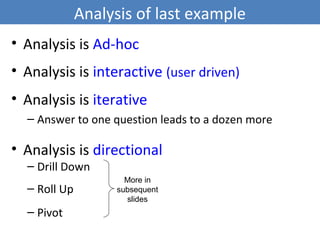
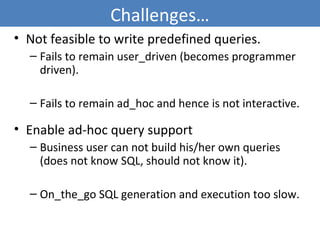
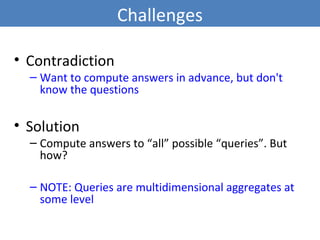
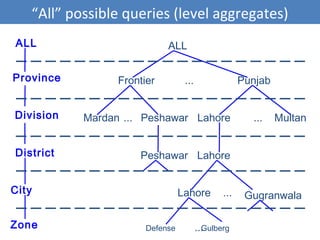
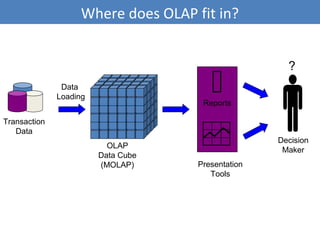

Data warehousing and online analytical processing (OLAP) are closely related, with OLAP supporting analysis of data stored in a data warehouse. OLAP enables fast, iterative, and ad-hoc analysis of aggregated data through multidimensional views and techniques like drill-down, roll-up, and pivoting. While it is not feasible to write all possible predefined queries for ad-hoc analysis, OLAP computes answers to "all possible queries" by pre-computing and storing aggregated data at multiple levels.