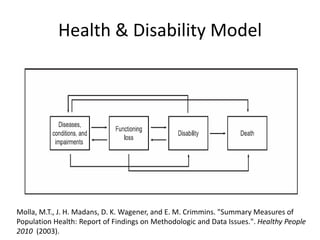
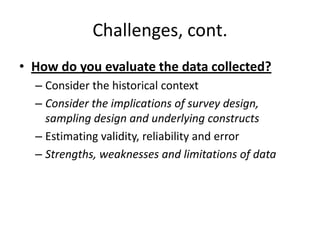
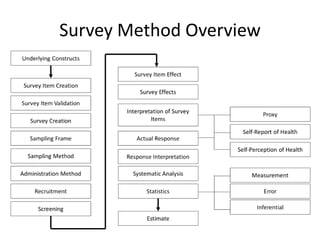
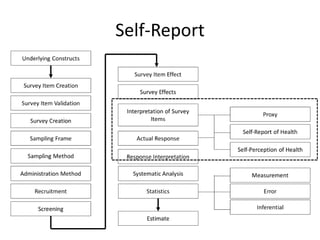
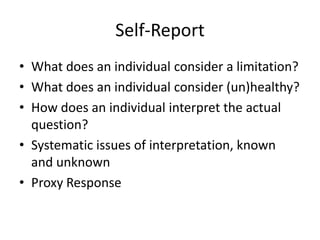
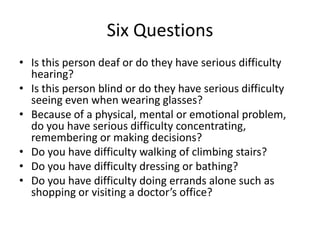
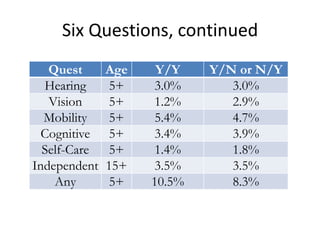
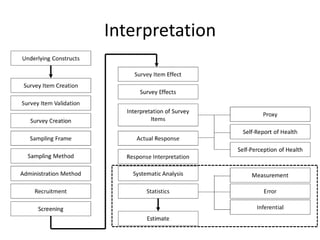
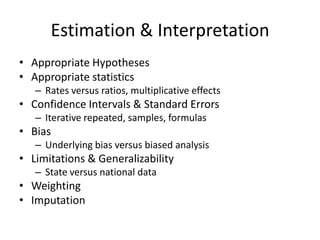
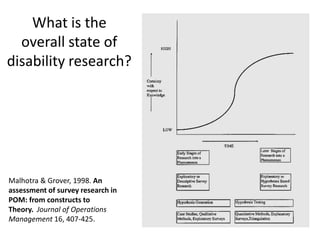
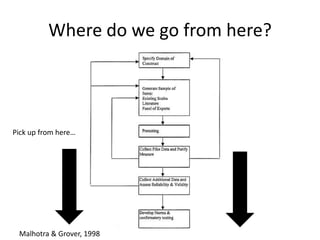
Disability Surveillance using National
Household Surveys in the United
States: Where have we been and
where are we going?
Eric A. Lauer, MPH, PhD Candidate
Institute On Disability
New Hampshire, USA
Introduction
• Focus
– The difficulties of defining disability. The concept
that disability is a state of being rather than a
diagnosis.
– There are unintended consequences of
measurement. We lose people in the national
surveillance model in the United States.
Overview
• Challenges for evaluating data
• Health & Disability Models
• National Survey Methodology
• Survey Administration
• Introduction of the Six Question Sequence
• Self-Reported Limitations
• Disability Surveillance in the United States
Challenges
• What is the relationship between health and
disability?
– Distinct yet overlapping constructs
– Function & Functional Limitations
Health & Disability Model
Molla, M.T., J. H. Madans, D. K. Wagener, and E. M. Crimmins. "Summary Measures of
Population Health: Report of Findings on Methodologic and Data Issues.". Healthy People
2010 (2003).
International Classification of
Functioning: Domains
ICF Applied
Challenges, cont.
• How do you evaluate the data collected?
– Consider the historical context
– Consider the implications of survey design,
sampling design and underlying constructs
– Estimating validity, reliability and error
– Strengths, weaknesses and limitations of data
Survey Method Overview
Challenges, continued
• Most importantly, how do we move
forward???
– Example, Cognitive Limitation & MEPS
– Acknowledged model gaps
– Discuss limitations in an open and transparent
manner
Model Gaps
There are several concepts that are missed by models of disability:
• Individuals can be perceived as having a disability, or consider themselves to have
a disability, but not have this evaluation based on any measurable phenomenon
• Disability can only be measured in the context of another domain or area. Some
models do not take this into account and there is a loss of explanatory power.
• The construct of disability is not stable, 5000 people in 5000 different life
circumstances will have difference rates of disability.
• That disability itself, as a distinct phenomenon, independent of any other factor
(age or health), changes over time. It may not be constant. Duration of disability
should be measured.
– There is acute and chronic disability, intermittent, and relatively stable/unstable
• Systems that address/explain disability are often not practical enough and do not
directly inform areas that could be targeted for the alleviation or prevention of
disability (Ex. poorly defining the concept of the environment)
Areas of Discussion
1.
2. 3.
4.
Constructs
Constructs, continued.
Construct
Error
Item
Malhotra & Grover, 1998
Survey Administration
Survey Administration, continued
• Sampling Design
• Primary Sampling Units
• Over- and Under- Sampling
• High- and Low- Response Regions
• Phone, Paper and In-Person Interviewing
• Subpopulations missed
• Non-response
Self-Report
Self-Report
• What does an individual consider a limitation?
• What does an individual consider (un)healthy?
• How does an individual interpret the actual
question?
• Systematic issues of interpretation, known
and unknown
• Proxy Response
Six Questions
• Is this person deaf or do they have serious difficulty
hearing?
• Is this person blind or do they have serious difficulty
seeing even when wearing glasses?
• Because of a physical, mental or emotional problem,
do you have serious difficulty concentrating,
remembering or making decisions?
• Do you have difficulty walking of climbing stairs?
• Do you have difficulty dressing or bathing?
• Do you have difficulty doing errands alone such as
shopping or visiting a doctor’s office?
Six Questions, continued
Quest Age Y/Y Y/N or N/Y
Hearing 5+ 3.0% 3.0%
Vision 5+ 1.2% 2.9%
Mobility 5+ 5.4% 4.7%
Cognitive 5+ 3.4% 3.9%
Self-Care 5+ 1.4% 1.8%
Independent 15+ 3.5% 3.5%
Any 5+ 10.5% 8.3%
Interpretation
Estimation & Interpretation
• Appropriate Hypotheses
• Appropriate statistics
– Rates versus ratios, multiplicative effects
• Confidence Intervals & Standard Errors
– Iterative repeated, samples, formulas
• Bias
– Underlying bias versus biased analysis
• Limitations & Generalizability
– State versus national data
• Weighting
• Imputation
What is the
overall state of
disability research?
Malhotra & Grover, 1998. An
assessment of survey research in
POM: from constructs to
Theory. Journal of Operations
Management 16, 407-425.
Where do we go from here?
Pick up from here…
Malhotra & Grover, 1998
ICF-AHRQ Recommended Health
Outcomes
Butler M, Kane RL, Larson S, Jeffery MM, Grove M. Quality Improvement Measurement of Outcomes for People With Disabilities. Closing
the Quality Gap: Revisiting the State of the Science. Evidence Report/Technology Assessment No. 208. (Prepared by the
Minnesota Evidence-based Practice Center under Contract No. 290-2007-10064-I.) AHRQ Publication No. 12(13)-E013-EF. Rockville, MD:
Agency for Healthcare Research and Quality; October 2012. www.effectivehealthcare.gov/reports/final.cfm.
What is it we are trying to measure?
What matters most?
• Should be based on the outcomes of goals of the
research
• Establish a relationship between the level of
focus and outcomes of interest
• Distinguish between the following factors:
– Interventions directed at a disability from specific
interventions directed at a given medical problem for
a person with a disability
– Comprehensive programs designed to integrate
medical and social services for people with
disabilities.
What is it we are trying to measure?
What matters most?
Butler M, Kane RL, Larson S, Jeffery MM, Grove M. Quality Improvement Measurement of Outcomes for People With Disabilities. Closing
the Quality Gap: Revisiting the State of the Science. Evidence Report/Technology Assessment No. 208. (Prepared by the
Minnesota Evidence-based Practice Center under Contract No. 290-2007-10064-I.) AHRQ Publication No. 12(13)-E013-EF. Rockville, MD:
Agency for Healthcare Research and Quality; October 2012. www.effectivehealthcare.gov/reports/final.cfm.
Thank you!
• Contact Information
Eric A. Lauer
Email: eric.lauer@unh.edu
Phone: 603-862-4320

Disability Statistics: Using National Surveys in the United States

  • 1.
    Disability Surveillance usingNational Household Surveys in the United States: Where have we been and where are we going? Eric A. Lauer, MPH, PhD Candidate Institute On Disability New Hampshire, USA
  • 2.
    Introduction • Focus – Thedifficulties of defining disability. The concept that disability is a state of being rather than a diagnosis. – There are unintended consequences of measurement. We lose people in the national surveillance model in the United States.
  • 3.
    Overview • Challenges forevaluating data • Health & Disability Models • National Survey Methodology • Survey Administration • Introduction of the Six Question Sequence • Self-Reported Limitations • Disability Surveillance in the United States
  • 4.
    Challenges • What isthe relationship between health and disability? – Distinct yet overlapping constructs – Function & Functional Limitations
  • 5.
    Health & DisabilityModel Molla, M.T., J. H. Madans, D. K. Wagener, and E. M. Crimmins. "Summary Measures of Population Health: Report of Findings on Methodologic and Data Issues.". Healthy People 2010 (2003).
  • 6.
  • 7.
  • 8.
    Challenges, cont. • Howdo you evaluate the data collected? – Consider the historical context – Consider the implications of survey design, sampling design and underlying constructs – Estimating validity, reliability and error – Strengths, weaknesses and limitations of data
  • 9.
  • 10.
    Challenges, continued • Mostimportantly, how do we move forward??? – Example, Cognitive Limitation & MEPS – Acknowledged model gaps – Discuss limitations in an open and transparent manner
  • 11.
    Model Gaps There areseveral concepts that are missed by models of disability: • Individuals can be perceived as having a disability, or consider themselves to have a disability, but not have this evaluation based on any measurable phenomenon • Disability can only be measured in the context of another domain or area. Some models do not take this into account and there is a loss of explanatory power. • The construct of disability is not stable, 5000 people in 5000 different life circumstances will have difference rates of disability. • That disability itself, as a distinct phenomenon, independent of any other factor (age or health), changes over time. It may not be constant. Duration of disability should be measured. – There is acute and chronic disability, intermittent, and relatively stable/unstable • Systems that address/explain disability are often not practical enough and do not directly inform areas that could be targeted for the alleviation or prevention of disability (Ex. poorly defining the concept of the environment)
  • 12.
  • 13.
  • 14.
  • 15.
  • 16.
    Survey Administration, continued •Sampling Design • Primary Sampling Units • Over- and Under- Sampling • High- and Low- Response Regions • Phone, Paper and In-Person Interviewing • Subpopulations missed • Non-response
  • 17.
  • 18.
    Self-Report • What doesan individual consider a limitation? • What does an individual consider (un)healthy? • How does an individual interpret the actual question? • Systematic issues of interpretation, known and unknown • Proxy Response
  • 19.
    Six Questions • Isthis person deaf or do they have serious difficulty hearing? • Is this person blind or do they have serious difficulty seeing even when wearing glasses? • Because of a physical, mental or emotional problem, do you have serious difficulty concentrating, remembering or making decisions? • Do you have difficulty walking of climbing stairs? • Do you have difficulty dressing or bathing? • Do you have difficulty doing errands alone such as shopping or visiting a doctor’s office?
  • 20.
    Six Questions, continued QuestAge Y/Y Y/N or N/Y Hearing 5+ 3.0% 3.0% Vision 5+ 1.2% 2.9% Mobility 5+ 5.4% 4.7% Cognitive 5+ 3.4% 3.9% Self-Care 5+ 1.4% 1.8% Independent 15+ 3.5% 3.5% Any 5+ 10.5% 8.3%
  • 21.
  • 22.
    Estimation & Interpretation •Appropriate Hypotheses • Appropriate statistics – Rates versus ratios, multiplicative effects • Confidence Intervals & Standard Errors – Iterative repeated, samples, formulas • Bias – Underlying bias versus biased analysis • Limitations & Generalizability – State versus national data • Weighting • Imputation
  • 23.
    What is the overallstate of disability research? Malhotra & Grover, 1998. An assessment of survey research in POM: from constructs to Theory. Journal of Operations Management 16, 407-425.
  • 24.
    Where do wego from here? Pick up from here… Malhotra & Grover, 1998
  • 25.
    ICF-AHRQ Recommended Health Outcomes ButlerM, Kane RL, Larson S, Jeffery MM, Grove M. Quality Improvement Measurement of Outcomes for People With Disabilities. Closing the Quality Gap: Revisiting the State of the Science. Evidence Report/Technology Assessment No. 208. (Prepared by the Minnesota Evidence-based Practice Center under Contract No. 290-2007-10064-I.) AHRQ Publication No. 12(13)-E013-EF. Rockville, MD: Agency for Healthcare Research and Quality; October 2012. www.effectivehealthcare.gov/reports/final.cfm.
  • 26.
    What is itwe are trying to measure? What matters most? • Should be based on the outcomes of goals of the research • Establish a relationship between the level of focus and outcomes of interest • Distinguish between the following factors: – Interventions directed at a disability from specific interventions directed at a given medical problem for a person with a disability – Comprehensive programs designed to integrate medical and social services for people with disabilities.
  • 27.
    What is itwe are trying to measure? What matters most? Butler M, Kane RL, Larson S, Jeffery MM, Grove M. Quality Improvement Measurement of Outcomes for People With Disabilities. Closing the Quality Gap: Revisiting the State of the Science. Evidence Report/Technology Assessment No. 208. (Prepared by the Minnesota Evidence-based Practice Center under Contract No. 290-2007-10064-I.) AHRQ Publication No. 12(13)-E013-EF. Rockville, MD: Agency for Healthcare Research and Quality; October 2012. www.effectivehealthcare.gov/reports/final.cfm.
  • 28.
    Thank you! • ContactInformation Eric A. Lauer Email: eric.lauer@unh.edu Phone: 603-862-4320