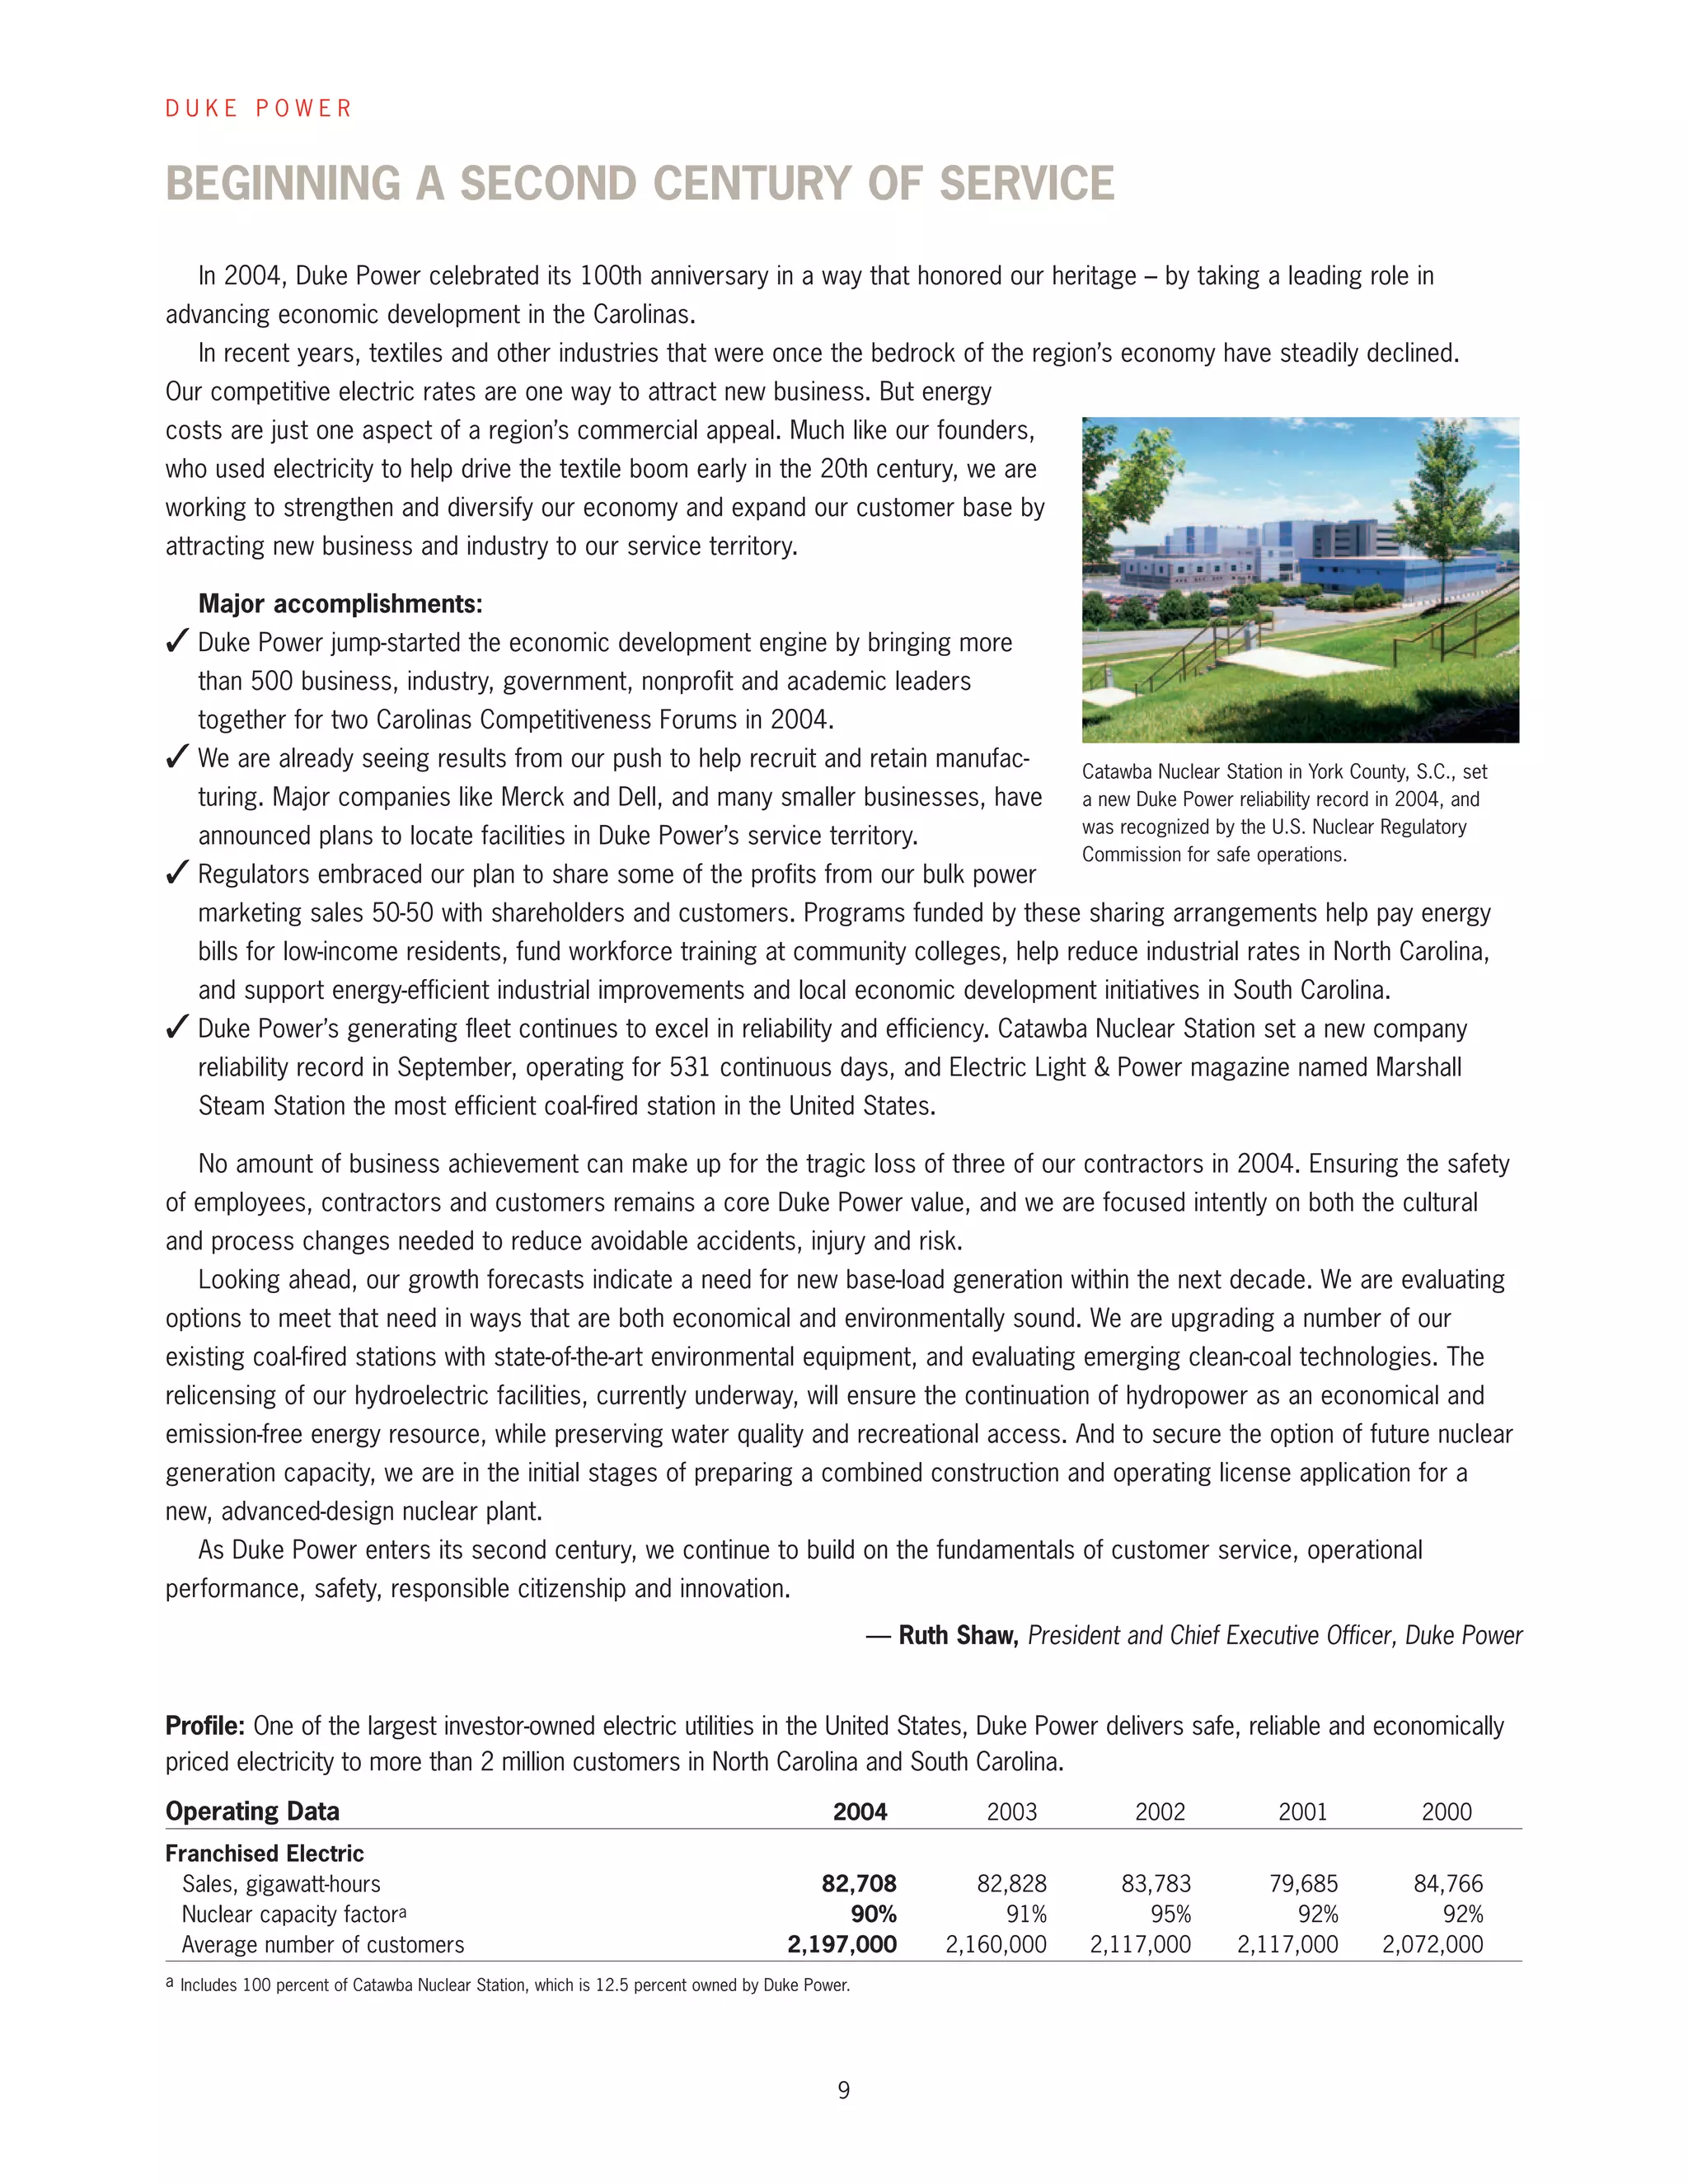
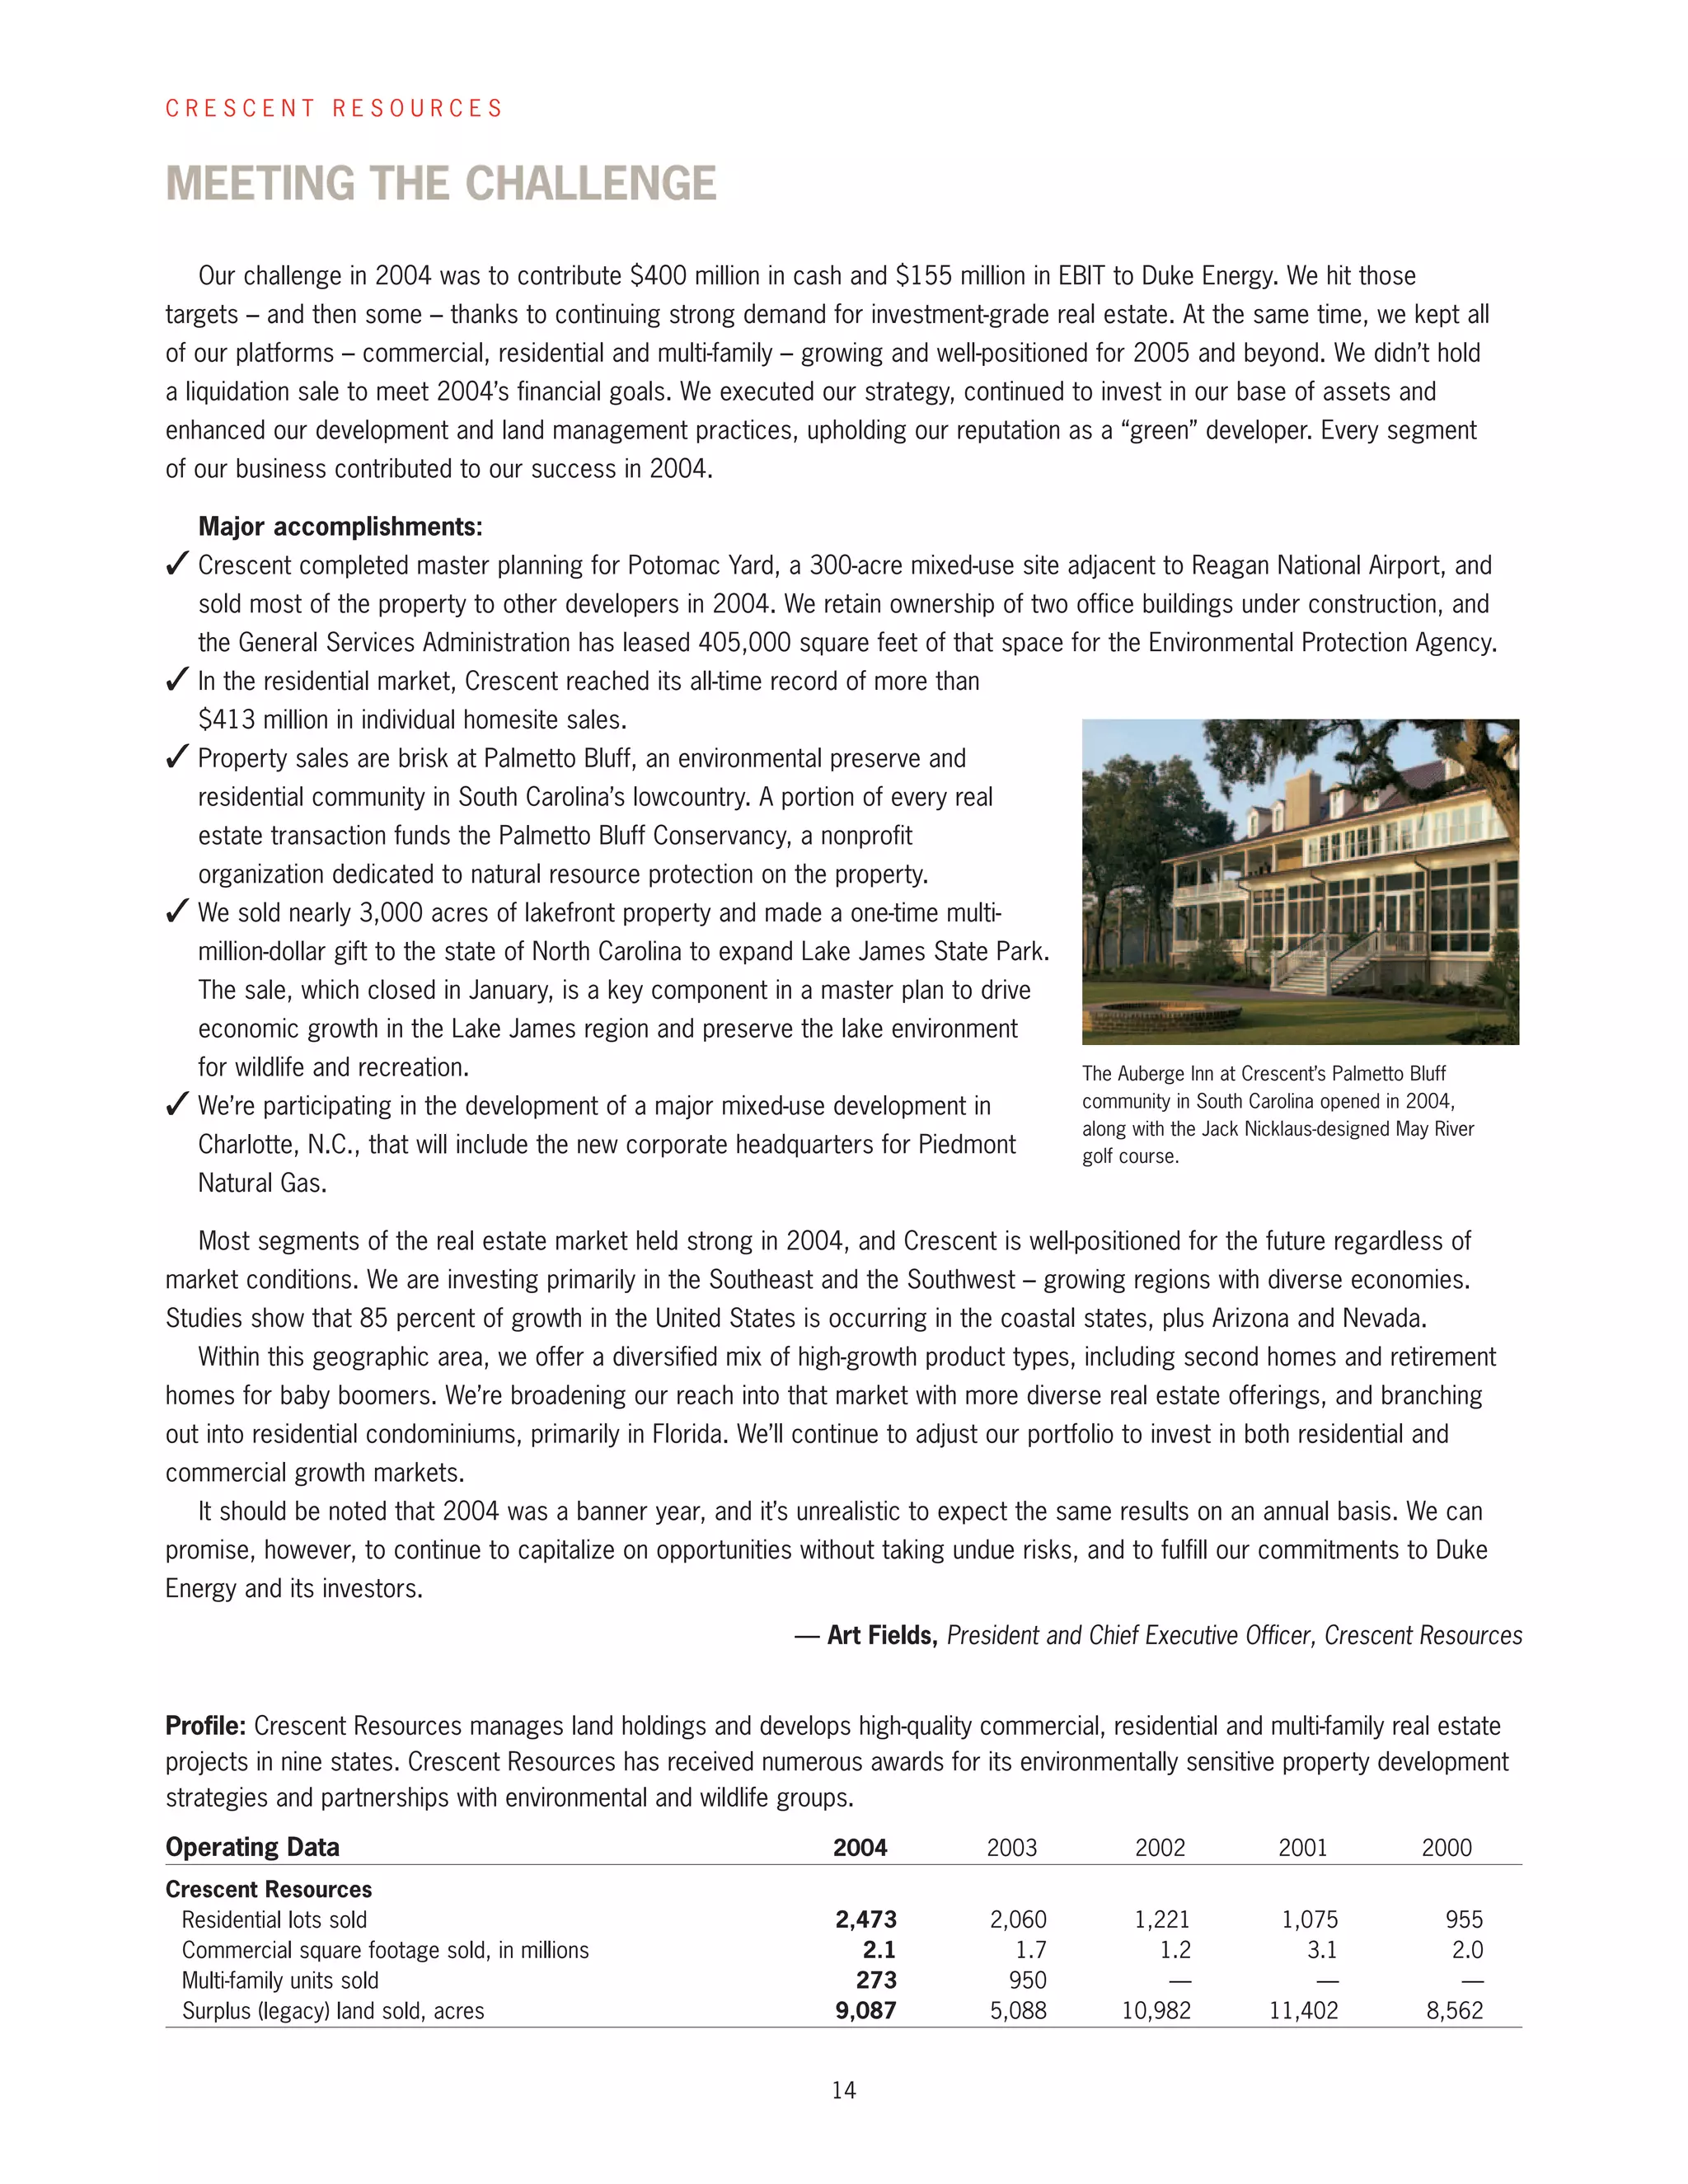
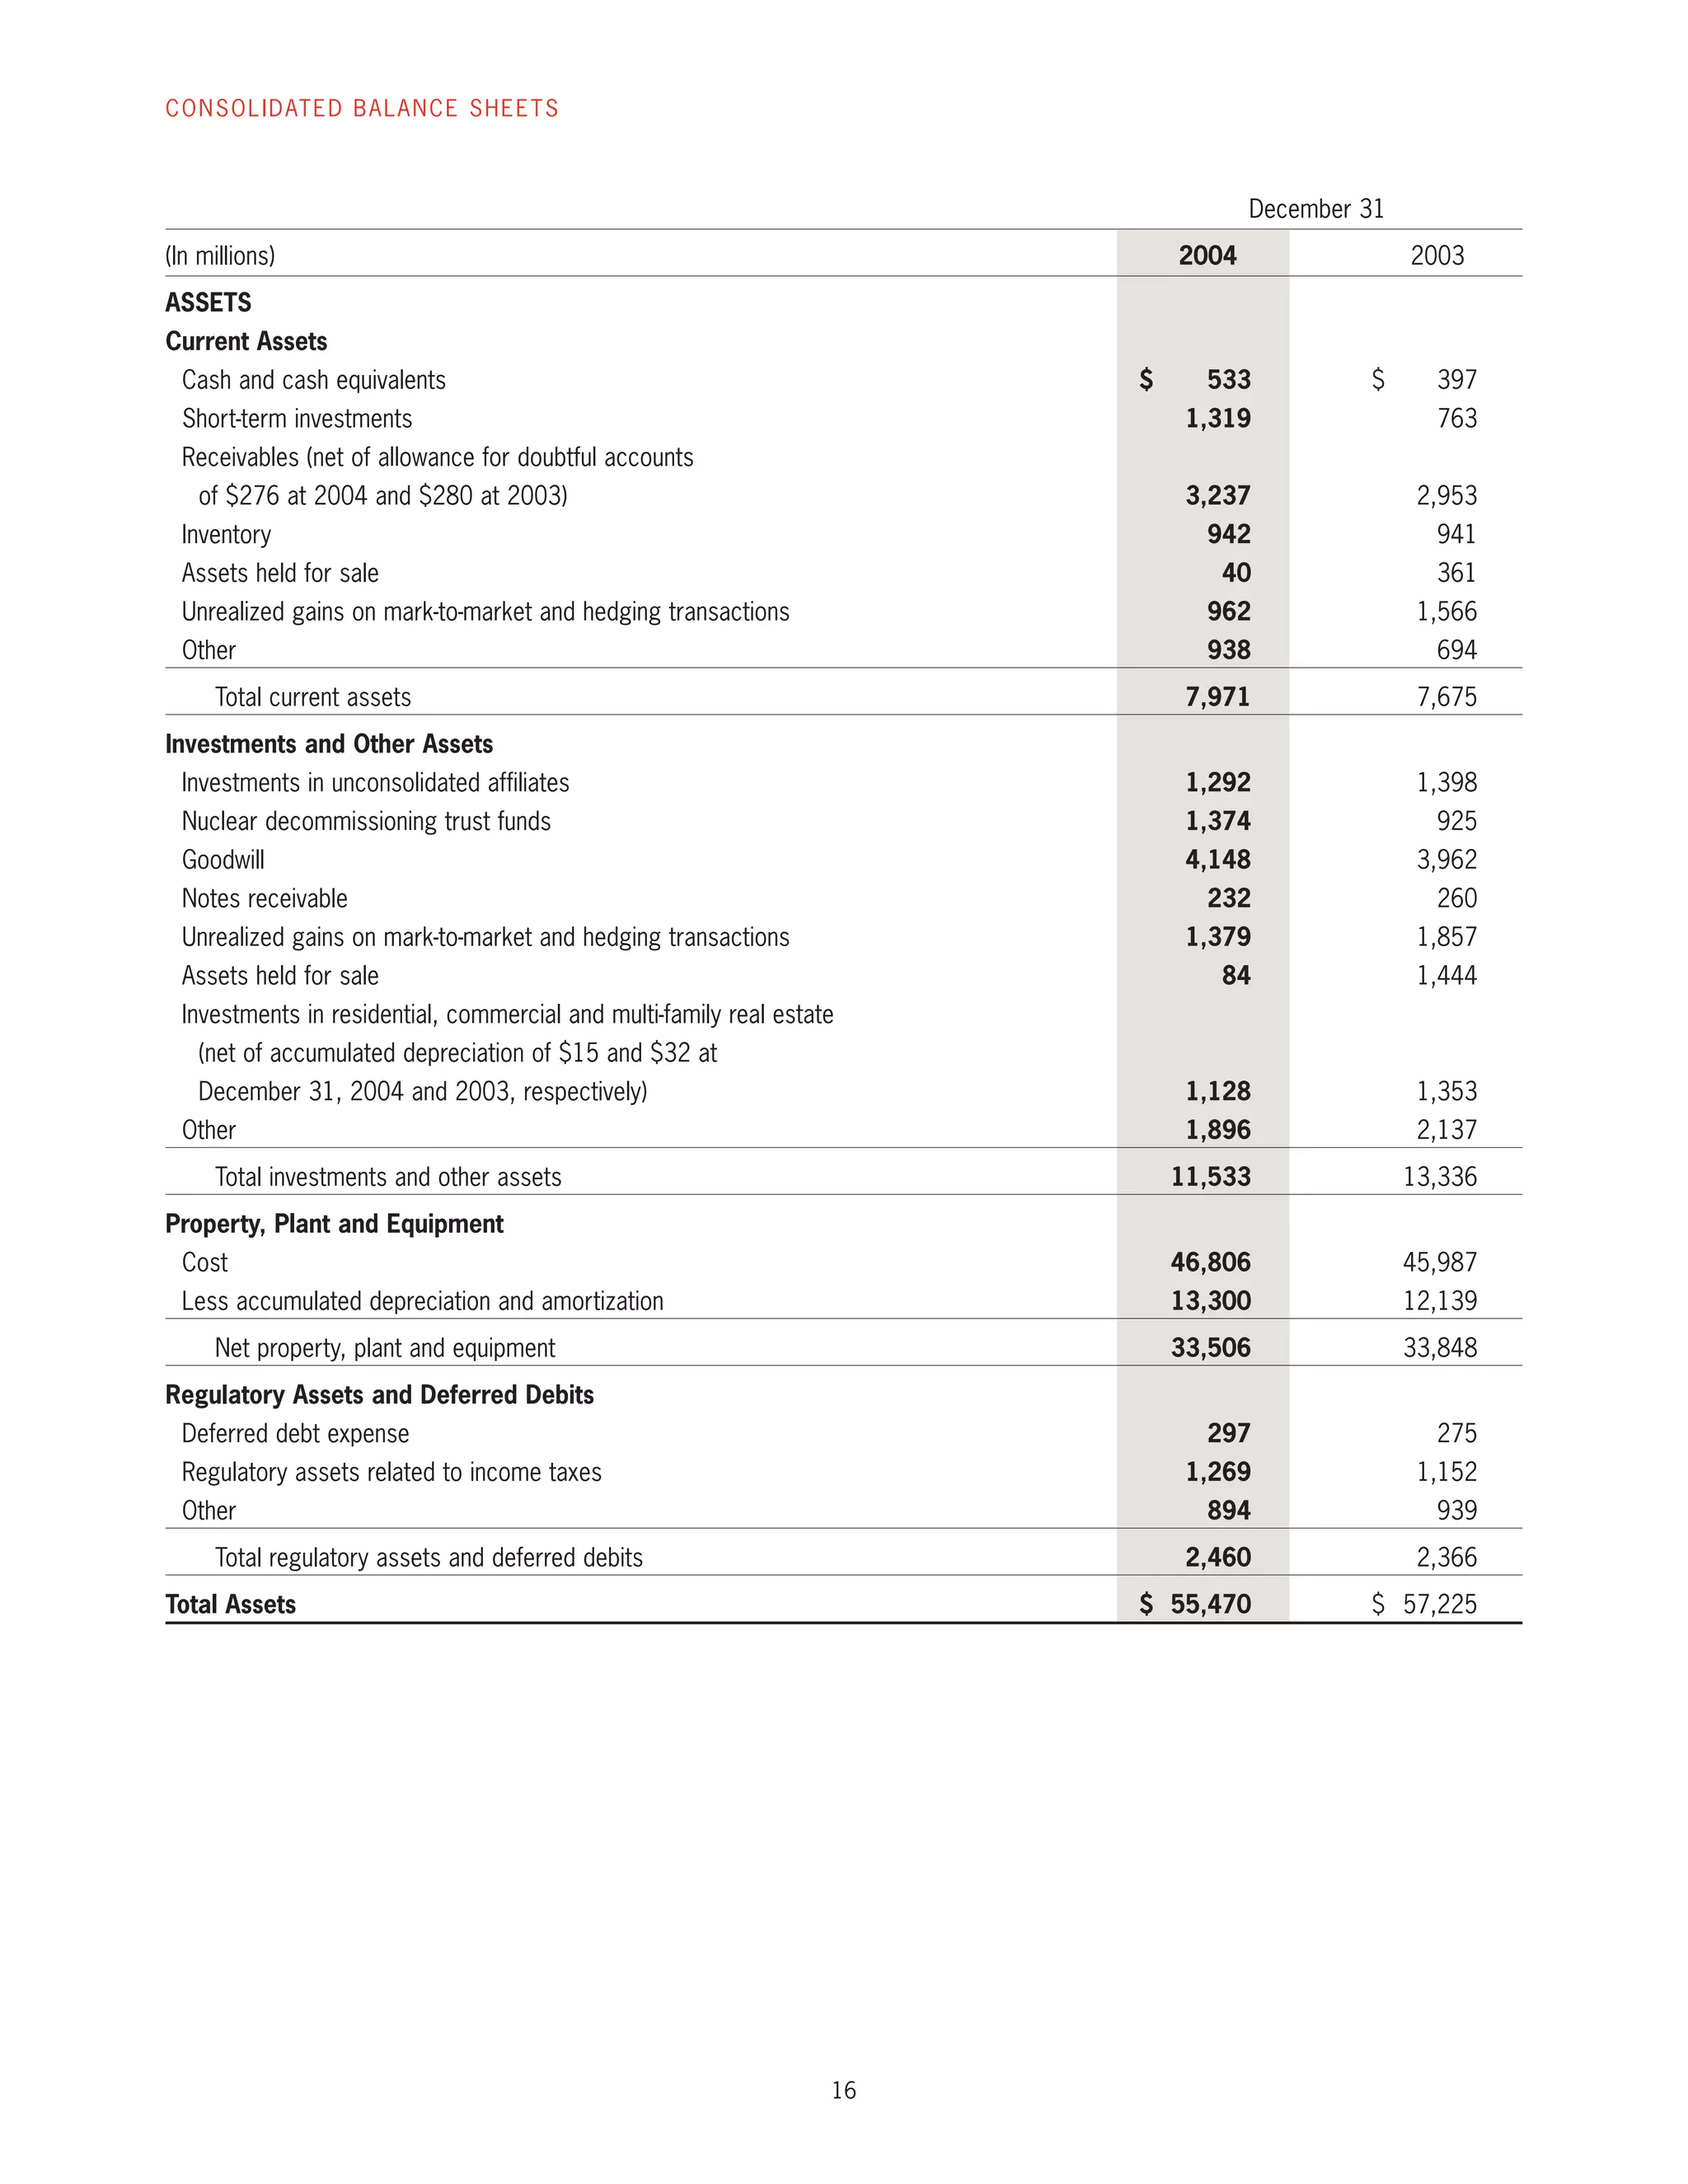
This document provides an overview of Duke Energy's 2004 annual report. It discusses Duke Energy's objectives for 2004 including generating cash, reducing debt, preserving dividends, resizing assets, improving safety, and restoring credibility. The chairman highlights accomplishments like exceeding financial targets, reducing debt, and stabilizing credit ratings. However, safety failures and an operational incident are noted as disappointments. Unfinished business is also mentioned, like developing a sustainable business model for Duke Energy North America. The chairman expresses optimism for 2005 while pursuing growth and leadership in the industry.
This 2003 annual report summarizes Cummins' financial performance and business highlights for 2003. Some key points:
- Sales increased 8% to $6.3 billion compared to 2002, with net earnings of $50 million.
- The engine business had sales of $3.6 billion, up 6% from 2002. Power generation sales were $1.3 billion, up 8% despite challenging market conditions. Filtration and other business sales reached a record $1.1 billion, up 11%.
- New partnerships and supply agreements were signed to expand the company's customer base. International joint ventures also grew, particularly in China and Asia.
- While markets remained difficult, the company focused on cost
This document summarizes the expected effects of the merger between Duke Energy and Cinergy. Shareholders and customers can expect value and reliable, affordable service. Local communities can anticipate support and enhancement. Employees will find a safe workplace that supports growth while sustaining the environment. The merger aims to increase value for investors while serving customers, communities, employees, and protecting the environment. Financial details of both companies from 2001-2005 are provided.
This document provides preliminary financial highlights and operating metrics for ConocoPhillips for the first quarter of 2004 compared to the first quarter of 2003. Some key figures include:
- Total revenues of $30.2 billion for the first quarter of 2004, up from $27.1 billion in the same period of 2003.
- Net income of $1.6 billion for the first quarter of 2004, up from $1.2 billion in the first quarter of 2003.
- Oil and gas production of 941 thousand barrels per day for the first quarter of 2004, up slightly from 935 thousand barrels per day in the same period of 2003.
This document provides financial highlights and selected financial data for ConocoPhillips for the first quarter of 2005 compared to the first quarter of 2004. Some key figures include:
- Net income for Q1 2005 was $2.912 billion compared to $1.616 billion in Q1 2004.
- Income from continuing operations was $2.923 billion in Q1 2005 compared to $1.603 billion in Q1 2004.
- Total worldwide crude oil and natural gas production was 942 thousand barrels of oil equivalent per day in Q1 2005.
- Total revenues for Q1 2005 were $38.918 billion compared to $30.217 billion in Q1 2004.
The document provides operating statistics and financial results for El Paso Corporation for the fourth quarter and full year of 2005. Some key details include:
- For the fourth quarter of 2005, El Paso reported a net loss of $162 million and a loss from continuing operations of $283 million.
- For the full year 2005, El Paso reported a net loss of $606 million and a loss from continuing operations of $702 million.
- El Paso reported earnings before interest and taxes of -$106 million for the fourth quarter and $398 million for the full year from its various business segments including pipelines, exploration and production, marketing and trading, power and field services.
The document summarizes Tribune Company's financial results for the first quarter of 2003 compared to 2002. Some key points:
- Operating revenues increased 5% to $1.29 billion driven by a 13% increase in television revenues. Operating profit before restructuring charges rose 10% to $276 million.
- Net income was $141 million compared to a net loss of $102 million in 2002. Earnings per share increased significantly.
- Publishing operating profit rose 21% to $198 million due to cost reductions. Broadcasting profit increased 25% to $90 million from higher television revenues and profits.
- Corporate losses narrowed to $11 million from restructuring charges in the prior year. The company had
el paso 22758BEF-CBE8-4368-BDC6-D02434EE5C13_EP_4Q08OpStatsFinalfinance49
The document provides operating statistics for El Paso Corporation for the fourth quarter of 2008. It includes consolidated statements of income, operating results, and business segment results for Pipelines, Exploration and Production, Marketing, Power, and Corporate/Other. Key details include a net loss of $1.68 billion for Q4 2008 driven by $2.66 billion in ceiling test charges in Exploration and Production. Pipelines EBIT was $319 million for Q4. Exploration and Production had an EBIT loss of $2.526 billion for the quarter due to the ceiling test charges.
- Ameriprise Financial reported a 14% increase in net income for Q3 2007 to $198 million compared to Q3 2006. Adjusted earnings increased 3% to $237 million, excluding separation costs.
- Earnings per share increased 17% to $0.83 for Q3 2007 compared to Q3 2006, while adjusted earnings per share increased 5% to $0.99.
- Revenues grew 11% to $2.2 billion in Q3 2007 driven by strong growth in management fees, distribution fees, and net investment income from hedges.
The document provides explanatory notes on non-GAAP financial information presented by MetLife. It defines various non-GAAP measures used by MetLife to analyze performance, such as operating earnings and operating return on common equity. These measures exclude items like investment gains and losses and discontinued operations to highlight underlying profitability. The document also includes reconciliations of the non-GAAP measures to the most directly comparable GAAP measures for historical periods.
This document summarizes the financial performance of a company for the third quarter and fiscal year ending June 30, 2005 compared to the prior year. It shows that net sales increased 6% for the quarter and 5% for the year. Earnings from continuing operations were $156 million for the quarter and $517 million for the year. The company also had significant earnings from discontinued operations of $579 million for the year from the sale of a business unit.
allstate Quarterly Investor Information 2003 1st finance7
Allstate reported strong financial results for the first quarter of 2003, with net income increasing 40% over the prior year to $665 million. Operating income per share increased 39.7% to $0.95, beating analyst estimates. This was driven by improved performance in Property-Liability, with underwriting income up significantly due to higher premiums earned and a lower combined ratio. Results were also boosted by lower realized capital losses. Allstate increased guidance for full-year operating income per share. While Allstate Financial results declined from lower annuity sales and an accounting adjustment, overall performance was solid given economic conditions.
- Ameriprise Financial reported increased earnings for the second quarter of 2007, with net income per share up 42% and adjusted earnings per share up 24%.
- Revenues grew 6% to $2.2 billion, driven by strong growth in fee-based businesses. Expenses rose 5% while income before taxes grew 14%.
- Net income was $196 million, up 39% from the prior year, while adjusted earnings rose 22% to $237 million, reflecting expense controls.
- ConocoPhillips reported significantly higher revenues and net income for both the fourth quarter and full year 2004 compared to the same periods in 2003, driven by higher oil and gas prices and increased production volumes.
- Revenues for the fourth quarter of 2004 were $40.1 billion, up 54% from $26 billion in the fourth quarter of 2003. Net income for the fourth quarter was $2.4 billion, up 138% from $1 billion.
- For the full year 2004, revenues were $136.9 billion compared to $105.1 billion in 2003. Net income was $8.1 billion compared to $4.7 billion in 2003.
Ameriprise Financial reported third quarter earnings for the first time as a public company following its spin off from American Express. Net income before discontinued operations was $123 million, down 35% year-over-year. Adjusted earnings, which exclude certain items, increased 11% to $179 million. Revenues grew 9% to $1.9 billion due to increases in management fees and distribution fees. Expenses increased due to separation costs related to the spin off from American Express.
allstate Quarterly Investor Information 2002 3rd finance7
The Allstate Corporation reported higher net income and operating income in the third quarter of 2002 compared to the same period in 2001. Operating income increased to $548 million from $401 million due primarily to increased property-liability premiums earned, improved auto and homeowners loss frequencies, and lower catastrophe losses. However, these gains were partly offset by reserve strengthening for asbestos and environmental losses and decreased operating income at Allstate Financial. For the full year 2002, Allstate anticipates operating income per share will be between $2.80 to $3.00, excluding restructuring charges.
Tribune Company reported financial results for the fourth quarter of 2006 with increases in operating revenues and income from continuing operations compared to the same period in 2005. Operating revenues grew 5.4% to $1.47 billion driven by increases in publishing and broadcasting revenues. Income from continuing operations increased 76.9% to $232.1 million due to higher operating profit and non-operating gains, partially offset by higher interest expense. Net income attributable to common shares grew 80.6% to $239.1 million. Earnings per share increased significantly for both basic and diluted amounts.
Revenues increased from $11.5 billion in 2006 to $12.8 billion in 2007 primarily due to higher electric utility revenues. Operating income increased from $2.6 billion to $2.8 billion between 2006 and 2007. Net income increased from $1.25 billion in 2006 to $1.31 billion in 2007, while basic earnings per share increased from $3.84 to $4.27 over the same period.
The document is Ameriprise Financial's quarterly statistical supplement for the fourth quarter of 2005. Some key points:
- In August 2005, Ameriprise transferred its 50% ownership of American Express International Deposit Company to American Express Company as part of its separation agreement.
- Net income for Q4 2005 was $111 million, a 53% decrease from Q4 2004, driven largely by separation costs related to the spin-off from American Express.
- Earnings per share (EPS) before separation costs, discontinued operations, and accounting changes was $0.77 for Q4 2005, down 16% from $0.92 in Q4 2004.
Viacom reported financial results for the first quarter of 2008 that showed increases in revenue, operating income, and earnings per share compared to the first quarter of 2007. Revenue grew 15% to $3.117 billion. Operating income increased 29% to $567 million. Diluted earnings per share from continuing operations rose 45% to $0.42. Media Networks and Filmed Entertainment, Viacom's two business segments, both saw revenue growth for the quarter despite lower theatrical revenues at Filmed Entertainment. Viacom also provided guidance for 2008-2010 of low double-digit annual growth in diluted earnings per share from continuing operations.
This document summarizes the financial performance of a company for the third quarter and first six months of 2005 compared to the same periods in 2004. It shows that net sales increased 6% for both periods while earnings from continuing operations decreased 38% and 24% respectively due to higher costs. The household products division grew sales and earnings both periods, while other divisions saw mixed results.
The document provides financial information for Procter & Gamble for the fourth quarter and fiscal year 2006 compared to 2005, including:
- Net sales increased 5% in the fourth quarter and 6% for the fiscal year.
- Earnings from continuing operations were $142 million in the fourth quarter and $443 million for the fiscal year.
This document provides financial highlights and selected financial data for ConocoPhillips for the three month and twelve month periods ending December 31, 2005 and 2004. Some key details include:
- Revenues for the three months ending December 31, 2005 were $52.2 billion compared to $40.1 billion for the same period in 2004.
- Net income for the twelve months ending December 31, 2005 was $13.5 billion compared to $8.1 billion for the same period in 2004.
- Earnings per share (diluted) for continuing operations for the twelve months ending December 31, 2005 were $9.63 compared to $5.79 for the same period in 2004.
Verizon Reports Sustained Revenue Growth and Continued Strong Cash Flows fo...finance2
This document summarizes Verizon Communications' consolidated statements of income for the fourth quarter and full year of 2008. Some key details:
- For Q4 2008, total operating revenues increased 3.4% to $24.6 billion and net income increased 15.2% to $1.24 billion compared to Q4 2007.
- For the full year 2008, total operating revenues increased 4.2% to $97.4 billion and net income increased 16.4% to $6.43 billion compared to 2007.
The document summarizes Henkel's financial results for the second quarter and first half of 2004 compared to the same periods in 2003. Net sales increased 9% in the second quarter and 6% year-to-date. Earnings from continuing operations rose 26% in the second quarter and 9% year-to-date due to growth across all business segments. Discontinued operations generated a large gain of $550 million from the exchange of businesses and increased earnings from discontinued operations significantly for both periods. As a result, net earnings increased substantially.
Yum! Brands reported its quarterly and annual segment results. In the fourth quarter of 2008, total revenues were $3.4 billion with operating profits of $360 million. For fiscal year 2008, total revenues were $11.3 billion with operating profits of $1.5 billion. The China division experienced the highest operating profits of $117 million and $469 million for the quarter and year respectively. Corporate and unallocated expenses included general and administrative costs not allocated to the business segments.
Cummins Inc. reported on its 2000 annual report. In 2000, Cummins sales were $6.6 billion with 28,000 employees. While the first half of 2000 was profitable, the second half saw a decline in key markets, resulting in an annual profit of only $8 million. The Power Generation and Filtration businesses remained strong, while the Engine Business was impacted by a 39% decline in heavy-duty truck engines in North America. Cummins outlined strategies to improve cash flow and grow profitable businesses to emerge stronger from the economic downturn, including reducing costs, improving quality, and leveraging technology partnerships.
- Operating revenue for the quarter ended March 31, 2006 was Rs. 278 crore, up 34% from the previous quarter and 26% from the same quarter last year. Total revenue was Rs. 279 crore, up 32% and 25% respectively.
- Operating profit for the quarter was Rs. 16.6 crore, up 37% from the previous quarter. Profit before tax was Rs. 14.3 crore, up 8% from last quarter. Profit after tax was Rs. 9.9 crore, down 18% from last quarter.
- Manpower productivity improved 18% from the previous quarter.
- Operating revenue for Q3 FY 2007 was Rs. 298.62 crore, up 44% year-over-year and 24% quarter-over-quarter. Total revenue was Rs. 300.41 crore, up 42% year-over-year and 24% quarter-over-quarter.
- EBITDA for Q3 FY 2007 was Rs. 29.20 crore, up 142% year-over-year and 70% quarter-over-quarter. Profit before tax was Rs. 28.23 crore, up 114% year-over-year and 84% quarter-over-quarter. Profit after tax was Rs. 20.40 crore, up 69
This document is CMC Limited's 28th annual report for the fiscal year 2003-2004. It contains information about the company's directors, auditors, registered office, corporate information, notice for the annual general meeting, directors' report, management discussion and analysis, and other disclosures. The annual general meeting will consider the adoption of financial statements, declaration of dividend, appointment of directors and auditors, and approval of remuneration of the managing director and new articles of association.
The document is a joint notice of annual meetings and proxy statement for Edison International and Southern California Edison Company (SCE). It notifies shareholders that the annual meetings will be held on May 19, 2005 to elect directors and vote on other matters. Shareholders are being asked to vote for the election of 10 directors for Edison International and 11 directors for SCE. Edison International shareholders will also vote on a shareholder proposal regarding "future golden parachutes." The document provides information on voting procedures and attendance at the annual meetings.
The document is a joint notice and proxy statement for the annual meetings of shareholders of Edison International and Southern California Edison Company (SCE) to be held on May 14, 2001. It provides information on electing directors, voting procedures, stock ownership, executive compensation, audit committee reports, and procedures for shareholder proposals for the next annual meeting. Shareholders will vote on electing 13 directors for Edison International and 12 directors for SCE.
The document summarizes an analyst day presentation for Cummins' Components Segment. It includes an agenda for presentations and Q&A on the segment. It then provides overviews of the individual business units (Turbo Technologies, Fuel Systems, Filtration, Emissions Solutions) within the Components Segment. Each business unit overview highlights key information like products, growth drivers, technology leadership, financial performance, and growth opportunities. The overall goal of the Components Segment is to differentiate Cummins engines and pursue revenue and earnings growth through 2021.
Textron delivered consistent growth in 1998 through leveraging existing strengths, building on past accomplishments, and focusing on a clear future vision. Key highlights included 12% revenue growth, 22% earnings per share growth, and strong financial discipline. Looking ahead, Textron is well-positioned for continued growth with a balanced mix of market-leading businesses, commitment to acquisitions and innovation, and a strong leadership team.
edison international 2000_annual_sce_1524finance21
This document provides the 2000 annual report for Southern California Edison Company (SCE). SCE is one of the largest electric utilities in the US, serving over 4.3 million customers in central and Southern California. In 2000, SCE recorded a net loss of $2.0 billion due to a $2.5 billion write-off of regulatory assets as their recovery through future rates was deemed improbable. The report discusses the energy crisis in California caused by deregulation and the memorandum of understanding signed between SCE and the California Department of Water Resources to resolve issues through legislation and regulatory actions.
The document provides financial results for an IT company for the 9 months ended December 2004 and the quarter ended December 2005.
For the 9 months ended December 2004, total revenue was Rs. 570 crore, profit before tax was Rs. 48 crore, and profit after tax was Rs. 45 crore. International revenue grew 55% and the international business share increased to 25% of overall revenue.
For the quarter ended December 2005, total revenue was Rs. 205.2 crore, profit before tax was Rs. 10.5 crore, and profit after tax was Rs. 9.3 crore. Embedded systems revenue grew 132% year-over-year and contributed 21% of international revenues.
The 2005 annual report summarizes Cummins' financial performance in 2005 as the best year in the company's history, with record revenues, earnings, EBIT, and cash flows. All of Cummins' business segments achieved record or improved financial results. The company increased profits as a percentage of sales through a lower cost structure. Cummins also strengthened its balance sheet, paid down debt, and began a stock repurchase program. The company reorganized to focus on faster growth, capturing synergies, and higher profits going forward. Cummins was recognized for its corporate citizenship and diversity efforts in 2005.
edison international 2002_annual_sce_7675finance21
Southern California Edison Company (SCE) is one of the largest electric utilities in the US, serving over 4.5 million customers in central and southern California. In 2002, SCE earned $1.2 billion in net income compared to $2.4 billion in 2001 and a loss of $2 billion in 2000. SCE's earnings have been impacted by regulatory decisions related to recovery of past power procurement costs and generation asset values. SCE continues to operate under a 2001 settlement agreement allowing recovery of $3.6 billion in past costs, while legal challenges to the agreement remain pending.
- Revenue for CMC was up 20% year-over-year for the quarter at Rs. 240.84 crore compared to Rs. 201.35 crore in the same quarter last year.
- EBITDA was Rs. 17.14 crore for the quarter, up 103% year-over-year. However, the quarter was impacted by a Rs. 12.58 crore provision for a contract under dispute.
- Profit before tax was Rs. 15.38 crore for the quarter, up 9% year-over-year.
- CMC reported consolidated revenue of Rs. 1085 crore for FY2006-07, an increase of 18% over the previous year. Consolidated profit before tax increased 99% to Rs. 98.97 crore.
- International revenue grew 54% driven by the American and UK geographies. The international business share of revenue increased from 28% to 35%.
- Services revenue increased 32% with significant growth in the SI and ITES business units. Operating margins expanded 355 basis points due to an improved business mix and increased manpower productivity.
- For Q4 FY2006-07, revenue grew 4% year-over-year while profit before tax increased 103% and margins expanded across all
edison international 2001_annual_sce_3186finance21
Southern California Edison Company (SCE) is one of the largest electric utilities in the US, serving central and southern California. SCE earned $2.4 billion in 2001 after incurring losses in 2000 due to deregulation issues. SCE's earnings included a $2.1 billion benefit from establishing regulatory assets to recover past power costs. Operating revenue increased in 2001 due to surcharges and decreased credits for direct access customers, partially offset by lower sales and penalties. SCE continues working to stabilize rates and recover prior power procurement costs.
This document contains the financial results for CMC Limited and its subsidiary for the quarter and year ended March 31, 2008. It shows the company's revenue, expenditures, profits, segment results, and capital employed. For the year, total revenue was Rs. 98,909 lakhs consolidated and Rs. 107,663 lakhs. Net profit after tax was Rs. 8,822 lakhs consolidated and Rs. 9,233 lakhs. The board proposed a dividend of Rs. 11 per share.
This 2003 annual report summarizes Cummins' financial performance and business highlights for 2003. Some key points:
- Sales increased 8% to $6.3 billion compared to 2002, with net earnings of $50 million.
- The engine business had sales of $3.6 billion, up 6% from 2002. Power generation sales were $1.3 billion, up 8% despite challenging market conditions. Filtration and other business sales reached a record $1.1 billion, up 11%.
- New partnerships and supply agreements were signed to expand the company's customer base. International joint ventures also grew, particularly in China and Asia.
- While markets remained difficult, the company focused on cost
The document provides operating statistics for El Paso Corporation for the fourth quarter of 2008. It includes consolidated statements of income, operating results, and business segment results for Pipelines, Exploration and Production, Marketing, Power, and Corporate/Other. Key details include a net loss of $1.68 billion for Q4 2008 driven by $2.66 billion in ceiling test charges in Exploration and Production. Pipelines contributed operating income of $291 million in Q4. Exploration and Production had an operating loss of $2.39 billion in Q4 due to the ceiling test charges.
el paso 22758BEF-CBE8-4368-BDC6-D02434EE5C13_EP_4Q08OpStatsFinalfinance49
The document provides operating statistics for El Paso Corporation for the fourth quarter of 2008. It includes consolidated statements of income, operating results, and business segment results for Pipelines, Exploration and Production, Marketing, Power, and Corporate/Other. Key details include a net loss of $1.68 billion for Q4 2008 driven by $2.66 billion in ceiling test charges in Exploration and Production. Pipelines generated $319 million in EBIT for Q4. Exploration and Production had an EBIT loss of $2.53 billion for the quarter due to the ceiling test charges.
el paso 02_274Q2006Earnings_FINAL_FINAL_bbfinance49
This document provides an investor update from El Paso Corporation for the fourth quarter and full year 2006. Key highlights include:
- The company reduced gross debt by $2.8 billion in 2006 and had $1 billion year-over-year swing in profits.
- Pipelines segment saw record earnings and a 22% increase in earnings from 2005. E&P segment replaced 108% of production primarily through drilling.
- For full year 2006, the company reported $1.75 billion in EBIT and $475 million in net income.
- The company used $2.5 billion in cash for debt reduction in 2006 and reduced net debt to $14.1 billion at the end of the year.
el paso 02_274Q2006Earnings_FINAL_FINAL_bbfinance49
This document provides an investor update from El Paso Corporation for the fourth quarter and full year 2006. Key highlights include:
- The company reduced gross debt by $2.8 billion in 2006 and had a $1 billion year-over-year swing in profits.
- Pipelines saw a 22% increase in earnings from 2005 and set a record. Exploration and production replaced 108% of production.
- For the fourth quarter, earnings were adjusted upwards by $122 million due to an alliance capacity buyout.
- For the full year, earnings were adjusted upwards by $122 million due to the buyout but adjusted downwards by $159 million due to income tax settlements and $172 million due to production hed
This document provides operating statistics and financial results for El Paso Corporation for the fourth quarter of 2005.
Some key highlights include:
- Consolidated net loss was $162 million for Q4 2005 compared to a net loss of $542 million for Q4 2004.
- The Pipeline Group segment earned $233 million in earnings before interest and taxes for Q4 2005, down from $369 million in Q4 2004.
- Exploration & Production earned $168 million in earnings before interest and taxes for Q4 2005, down slightly from $176 million in Q4 2004.
- Marketing and Trading lost $224 million in earnings before interest and taxes for Q4 2005, an improvement from a $
Danaher Corporation reported record results for the fourth quarter and full year 2003. Net earnings for Q4 2003 were $169.9 million, or $1.06 per share, compared to $161.7 million, or $1.03 per share for Q4 2002. For the full year, net earnings were $536.8 million or $3.37 per share compared to $290.4 million or $1.88 per share for 2002. Sales increased 17% in Q4 2003 to $1.49 billion and grew 16% for the full year to $5.29 billion. The company experienced strong growth in both its process/environmental controls and tools/components segments.
This document provides operating statistics and financial results for El Paso Corporation for the fourth quarter and full year of 2006. Some key details include:
- For the fourth quarter of 2006, El Paso reported net income of $166 million compared to a net loss of $162 million for the same period in 2005.
- For the full year 2006, net income was $475 million, an improvement from a net loss of $606 million in 2005.
- Earnings were positively impacted by higher earnings from the Pipelines, Exploration and Production, and Field Services segments.
- The results show improvement in El Paso's overall financial performance in 2006 compared to 2005.
This document provides operating statistics for El Paso Corporation for the fourth quarter of 2006. It includes consolidated statements of income, operating results, and business segment results for the company's pipelines, exploration and production, marketing, power, field services, and corporate divisions. For the fourth quarter of 2006, the company reported a net loss of $166 million compared to a net loss of $162 million in the fourth quarter of 2005. The pipelines segment reported earnings before interest and taxes of $302 million for the fourth quarter of 2006.
This document is Health Net's 2000 Annual Report. It provides an overview of the company's financial performance and operations in 2000. Key points include:
- Revenue increased 5% to $9.076 billion while net income grew 15% to $163.6 million.
- Operating cash flow improved over 23% to $366.2 million and debt was reduced.
- Membership grew by around 190,000, though medical cost ratios remained stable.
- The company continued working to improve efficiency and expand technology and consumer-focused programs.
- Government contracts were extended and behavioral health subsidiary MHN added new members.
Danaher Corporation announced its first quarter 2022 results. Net earnings were $82.7 million, comparable to the previous year's results. However, after adopting a new accounting standard that eliminated goodwill amortization, earnings per share fell 14% compared to the previous year. The company also recorded a $173.8 million charge related to goodwill impairment in some business units. Total sales were relatively flat at $1,004.2 million. The CEO commented that while core volumes declined 15% due to economic challenges, the company has seen signs of stability in revenues and gives a more positive outlook for the rest of the year.
Danaher Corporation announced record results for the second quarter and first half of 2005. Net earnings for the second quarter increased 25.5% compared to 2004, and sales increased 19%. For the first six months, net earnings increased 27.5% and sales increased 19%. The company's president stated that growth from existing businesses accounted for 5.5% sales growth in the quarter and that the company saw broad-based strength across its businesses.
- Danaher Corporation reported record results for the fourth quarter and full year 2002, with net earnings of $161.7 million and $290.4 million respectively.
- Fourth quarter sales increased 39% to $1.275 billion compared to $918.9 million in 2001. Full year sales grew 21% to $4.577 billion.
- The strong results were driven by acquisitions and 3.5% core volume growth, although the tools and components segment declined slightly.
Allstate operates from a strong financial position with over $104 billion in assets and $17.5 billion in shareholders' equity. It provides insurance and financial services to over 14 million households in the US. Allstate has $104.8 billion in assets and generates most of its revenues from property-liability insurance premiums and contract charges from its financial business. For 2000, Allstate reported revenues of $29.1 billion and net income of $2.2 billion.
The document summarizes financial information for Qwest Communications International Inc. for the three months and full year ended December 31, 2006 and 2005. It provides key metrics such as operating revenue, costs, segment income, EBITDA, cash flows, debt levels, and operating margins. Non-GAAP financial measures are reconciled to GAAP measures and footnotes explain how the non-GAAP measures are useful for evaluating the capital-intensive business.
Groupon has over 190,000 merchants worldwide across over 190 categories, with a salesforce of over 4,800 representatives enabling deals in 175 North American markets and 45 countries. In the first 9 months of 2011, Groupon featured deals from over 190,000 merchants worldwide, sold over 93 million Groupons, and had over 142 million subscribers. Groupon uses free cash flow and consolidated segment operating income as key non-GAAP measures to evaluate performance excluding non-cash expenses.
Tribune Company reported its fourth quarter and full year 2002 results. For the fourth quarter, revenues increased 8% year-over-year and net income increased 24%. Operating profit before restructuring charges increased 33% due to cost reductions. For the full year, revenues increased 2% and net income increased 43% due to restructuring initiatives and asset sales. Earnings per share increased 22% in the fourth quarter and 45% for the full year, reflecting continued improvement.
public serviceenterprise group library.corporate-irfinance20
PSEG held an earnings conference call to discuss its fourth quarter and full-year 2008 results. For Q4 2008, PSEG reported operating earnings of $250 million compared to $272 million in Q4 2007. For the full year, operating earnings were $1,487 million compared to $1,385 million in 2007. PSEG Power's Q4 operating earnings were $207 million, matching the prior year, while PSE&G's were $76 million compared to $77 million in Q4 2007. PSEG provided 2009 operating earnings guidance of $3.00-$3.25 per share.
This document provides a summary of PSEG's 4th quarter and full-year 2008 earnings conference call. It discusses PSEG meeting its 2008 earnings guidance despite challenges. Key points include PSEG focusing on operational excellence, laying a foundation for the future through carbon abatement and infrastructure programs, and strengthening its financial position by reducing debt and recognizing reserves for tax risks. The document also provides guidance for 2009 operating earnings of $3.00-$3.25 per share.
public serviceenterprise group Investor library.corporatefinance20
PSEG held an earnings conference call to discuss its fourth quarter and full-year 2008 results. For the fourth quarter, PSEG reported operating earnings of $250 million compared to $272 million in the prior year quarter. For the full year, operating earnings were $1,487 million compared to $1,385 million in 2007. PSEG Power's fourth quarter operating earnings were $207 million, matching the prior year, while PSE&G's were $76 million, down slightly from $77 million in 2007. PSEG provided 2009 operating earnings guidance of $3.00-$3.25 per share.
ConAgra Foods is selling its chicken business to focus on branded and value-added food items. The sale includes chicken processing operations and will generate cash for ConAgra to reinvest. ConAgra will receive Class A shares in Pilgrim's Pride, the chicken company acquiring its business, representing 7% of voting shares and 49% of equity. It can sell up to 1/3 of these shares annually but expects to reduce ownership over time based on market conditions. ConAgra will also receive notes from Pilgrim's Pride due in 2011 with a 10.5% interest rate to be paid semi-annually.
This document summarizes the Q1 FY2004 earnings results of a large packaged foods company. Key points include:
- Q1 EPS was $0.37 compared to $0.43 in Q1 FY2003, impacted by various one-time gains and losses.
- Packaged foods sales were down $168M excluding divested businesses, with a 5% volume decline.
- Several major brands saw growth, while others like Butterball declined.
- Corporate expenses increased due to litigation expenses from a past joint venture.
- The effective tax rate for FY2004 is estimated at 38%.
ConAgra Foods is selling its United Agri Products business to focus on branded and value-added products, as part of a broader strategy of divesting non-core businesses over the past year including fresh beef/pork, canned seafood, and cheese operations. The sale is expected to close by December 31, 2003 for cash and $60-75 million in preferred stock. ConAgra will retain some international UAP operations generating $250 million in annual sales, concentrated in several countries. Proceeds will be used for debt paydown and general corporate purposes including acquisitions and stock buybacks.
ConAgra Foods divested its poultry business to focus on branded, value-added foods with strong margins and growth. The $300 million cash and 25 million Pilgrim's Pride shares valued at $245 million totaled less than the poultry business' estimated $545 million book value due to the shares being valued based on past prices, not current prices. ConAgra Foods can sell up to 1/3 of the shares each year and account for shares eligible for resale within a year as securities, and other shares using cost accounting. The poultry business was previously reported in Meat Processing but is now in Discontinued Operations.
ConAgra Foods completed the divestiture of its chicken processing and crop inputs businesses, finalizing its strategy to focus on branded, value-added food opportunities. The company received $300 million in cash and 25 million shares of Pilgrim's Pride stock worth $245 million for the chicken business. ConAgra can sell up to 1/3 of the Pilgrim's Pride shares per year and will account for the shares as securities held for resale within one year or using the cost method if the eligibility for resale is over one year away. The chicken business was previously reported as part of ConAgra's Meat Processing segment but is now in Discontinued Operations.
ConAgra Foods has divested several commodity businesses and acquired branded and value-added food products to focus on higher margin businesses. The company is planning a share repurchase program using cash from strong operating cash flows and recent divestitures. ConAgra expects to continue investing in growth through acquisitions and paying down debt while deploying cash to dividends, debt repayment, and share repurchases as appropriate.
The document provides a Q&A summary of ConAgra Foods' financial results for Q2 FY04 compared to Q2 FY03. Key points include:
- Q2 FY04 diluted EPS was $0.51 compared to $0.44 in Q2 FY03, impacted by $0.04 in discontinued operations in FY04 and $0.03 in divestiture expenses in FY03.
- Sales comparability was impacted by $506M in divested fresh meat businesses in FY03 and $154M in divested canned food businesses in FY03.
- Examples of brand sales growth included Banquet, Chef Boyardee, Egg Beaters
Packaged Foods sales increased 4% excluding divestitures, with 2% volume growth. Several brands posted sales growth including Armour, Banquet, and Blue Bonnet, while others like ACT II and Butterball declined. Sales comparability was affected by $155 million in divested businesses last year. Operating profit grew 5% in Packaged Foods and 10% overall when adjusting for divested businesses and cost savings initiatives. The company is implementing cost cutting measures expected to save more than implementation costs in the future.
The document provides the quarterly and annual financial results for a company. Some key highlights include:
- Several consumer brands posted sales growth for the quarter including Banquet, Blue Bonnet, and Chef Boyardee, while others like ACT II and Eckrich saw declines.
- Total depreciation and amortization was around $93 million for the quarter and $352 million for the fiscal year.
- Capital expenditures were around $106 million for the quarter and $352 million for the fiscal year.
- Net interest expense was $80 million for the quarter and $275 million for the fiscal year.
- Corporate expenses were around $95 million for the quarter and $342 million
- Major brands in the Retail Products segment that posted sales growth included ACT II, Armour, Banquet, and Blue Bonnet. Brands that posted sales declines included Healthy Choice, Slim Jim, and Snack Pack.
- Retail volume increased 8% while foodservice volume was flat excluding divested businesses.
- Increased input costs negatively impacted operating profits in the Retail Products segment by approximately $45 million.
- Capital expenditures were approximately $105 million, reflecting increased investment in information systems.
This document contains the questions and answers from ConAgra Foods' Q2 FY2005 earnings call. Some key details include:
- Several major brands in the Retail Products segment posted sales growth, while others saw declines.
- Retail volume increased 7% and Foodservice volume decreased 1% excluding divested businesses.
- Capital expenditures increased significantly year-over-year due to investments in information systems.
- The company received proceeds from the sale of its minority interest in Swift Foods and shares of Pilgrim's Pride stock.
This document summarizes the Q3 2005 earnings results of a major food company. Some key highlights include: 1) Major brands in the Retail Products segment saw mixed sales results, with growth for brands like Chef Boyardee but declines for brands like Butterball. 2) Unit volumes declined 3% for Retail Products but increased 4% for Foodservice Products. 3) The packaged meats operations were slightly profitable but profits were over $45 million lower than the previous year. The company expects some improvement but not year-over-year profit gains for packaged meats in Q4.
This document summarizes ConAgra Foods' earnings results for fiscal year 2005 (FY05) in a question and answer format. Some key details include:
- FY05 diluted EPS was $1.23, including $0.12 in expenses that impacted comparability.
- Major brands in the Retail Products segment that saw sales growth included ACT II, Banquet, and Blue Bonnet. Brands that saw declines included Armour and Butterball.
- Retail Products volume increased 2% while Foodservice Products volume decreased 2% in Q4.
- Total depreciation and amortization was approximately $351 million for FY05 and $90 million for Q4. Capital expenditures
The document provides the questions and answers from the Q1 FY06 earnings call for ConAgra Foods. Some key details from the summary include:
- Sales grew for major brands like Butterball but declined for brands like ACT II. Retail Products volume declined 3% while Foodservice increased 4%.
- Depreciation and amortization was $89 million. Capital expenditures were $71 million and net interest expense was $68 million. Corporate expense was $73 million.
- Gross margin was 21.6% and operating margin was 10.9%. The effective tax rate for FY06 is estimated to be 36%.
Major brands in the Retail Products segment that posted sales growth included ACT II, Blue Bonnet, Butterball, Kid Cuisine, Marie Callender's, Reddi-wip and Ro*Tel. Brands that posted sales declines included Armour, Banquet, Cook's, DAVID, Eckrich, Egg Beaters, Healthy Choice, Hebrew National, Hunt's, LaChoy, Orville Redenbacher, PAM, Parkay, Peter Pan, Slim Jim, Snack Pack, Swiss Miss, Van Camp's and Wesson. Retail Products volume declined 5% for the quarter while Foodservice Products volume increased 2%. Corporate expense for the quarter was approximately $103 million
The document provides financial information from ConAgra Foods' Q3 FY06 quarterly earnings call. Some key details include:
- Retail segment sales grew 4% and Foodservice grew 1% over the prior year. Several major brands posted sales growth while others declined.
- Gross margin was 24.8% and operating margin was 12.5% for the quarter.
- Net debt was $3.6 billion, down from $4.5 billion a year prior due to debt repayment of $500 million during the quarter.
- Capital expenditures for the quarter and fiscal year-to-date were below prior year levels. Projected fiscal year expenditures are up to $400
- Major brands in the Consumer Foods segment that posted sales growth in Q4 FY06 included Blue Bonnet, Chef Boyardee, DAVID, Egg Beaters, Hebrew National, and Hunt's. Brands that posted sales declines included ACT II, Banquet, Healthy Choice, Peter Pan, Slim Jim, Snack Pack, and Van Camp's.
- Consumer Foods volume declined 2% in Q4 while Food and Ingredients volume increased 1%.
- Total depreciation and amortization for Q4 was approximately $85 million and approximately $353 million for all of FY06. Capital expenditures were approximately $92 million for Q4 and $288 million for FY
This document summarizes the Q1 FY07 financial results of ConAgra Foods. Some key highlights include:
- Consumer Foods volume increased 1% and Food and Ingredients volume increased 2% in Q1.
- Gross margin was 24.7% and operating margin was 11.7% for the quarter.
- Net debt decreased to $2.88 billion from $3.97 billion in Q1 FY06.
- Restructuring charges totaled $39 million pre-tax, impacting costs in Consumer Foods and corporate expenses.
Major brands in the Consumer Foods segment that posted sales growth included Egg Beaters, Healthy Choice, and Slim Jim. Brands that posted sales declines included ACT II and Blue Bonnet. Total depreciation and amortization from continuing operations was $88 million for the quarter and $177 million year-to-date. Capital expenditures were $66 million for the quarter and $111 million year-to-date. Net interest expense was $52 million for the quarter and $110 million year-to-date.
1) Several major brands in the Consumer Foods segment posted sales growth for the quarter, while others like ACT II and Banquet saw declines. Overall, Consumer Foods volume declined 1% excluding divested businesses.
2) Total depreciation and amortization from continuing operations was around $91 million for the quarter and $268 million year-to-date. Capital expenditures were around $147 million for the quarter and $258 million year-to-date.
3) The company's net debt at the end of the quarter was around $3 billion, with a net debt to total capital ratio of 39%.
How to Invest in Cryptocurrency for Beginners: A Complete GuideDaniel
Cryptocurrency is digital money that operates independently of a central authority, utilizing cryptography for security. Unlike traditional currencies issued by governments (fiat currencies), cryptocurrencies are decentralized and typically operate on a technology called blockchain. Each cryptocurrency transaction is recorded on a public ledger, ensuring transparency and security.
Cryptocurrencies can be used for various purposes, including online purchases, investment opportunities, and as a means of transferring value globally without the need for intermediaries like banks.
Discover the Future of Dogecoin with Our Comprehensive Guidance36 Crypto
Learn in-depth about Dogecoin's trajectory and stay informed with 36crypto's essential and up-to-date information about the crypto space.
Our presentation delves into Dogecoin's potential future, exploring whether it's destined to skyrocket to the moon or face a downward spiral. In addition, it highlights invaluable insights. Don't miss out on this opportunity to enhance your crypto understanding!
https://36crypto.com/the-future-of-dogecoin-how-high-can-this-cryptocurrency-reach/
Fabular Frames and the Four Ratio ProblemMajid Iqbal
Digital, interactive art showing the struggle of a society in providing for its present population while also saving planetary resources for future generations. Spread across several frames, the art is actually the rendering of real and speculative data. The stereographic projections change shape in response to prompts and provocations. Visitors interact with the model through speculative statements about how to increase savings across communities, regions, ecosystems and environments. Their fabulations combined with random noise, i.e. factors beyond control, have a dramatic effect on the societal transition. Things get better. Things get worse. The aim is to give visitors a new grasp and feel of the ongoing struggles in democracies around the world.
Stunning art in the small multiples format brings out the spatiotemporal nature of societal transitions, against backdrop issues such as energy, housing, waste, farmland and forest. In each frame we see hopeful and frightful interplays between spending and saving. Problems emerge when one of the two parts of the existential anaglyph rapidly shrinks like Arctic ice, as factors cross thresholds. Ecological wealth and intergenerational equity areFour at stake. Not enough spending could mean economic stress, social unrest and political conflict. Not enough saving and there will be climate breakdown and ‘bankruptcy’. So where does speculative design start and the gambling and betting end? Behind each fabular frame is a four ratio problem. Each ratio reflects the level of sacrifice and self-restraint a society is willing to accept, against promises of prosperity and freedom. Some values seem to stabilise a frame while others cause collapse. Get the ratios right and we can have it all. Get them wrong and things get more desperate.
The Rise and Fall of Ponzi Schemes in America.pptxDiana Rose
Ponzi schemes, a notorious form of financial fraud, have plagued America’s investment landscape for decades. Named after Charles Ponzi, who orchestrated one of the most infamous schemes in the early 20th century, these fraudulent operations promise high returns with little or no risk, only to collapse and leave investors with significant losses. This article explores the nature of Ponzi schemes, notable cases in American history, their impact on victims, and measures to prevent falling prey to such scams.
Understanding Ponzi Schemes
A Ponzi scheme is an investment scam where returns are paid to earlier investors using the capital from newer investors, rather than from legitimate profit earned. The scheme relies on a constant influx of new investments to continue paying the promised returns. Eventually, when the flow of new money slows down or stops, the scheme collapses, leaving the majority of investors with substantial financial losses.
Historical Context: Charles Ponzi and His Legacy
Charles Ponzi is the namesake of this deceptive practice. In the 1920s, Ponzi promised investors in Boston a 50% return within 45 days or 100% return in 90 days through arbitrage of international reply coupons. Initially, he paid returns as promised, not from profits, but from the investments of new participants. When his scheme unraveled, it resulted in losses exceeding $20 million (equivalent to about $270 million today).
Notable American Ponzi Schemes
1. Bernie Madoff: Perhaps the most notorious Ponzi scheme in recent history, Bernie Madoff’s fraud involved $65 billion. Madoff, a well-respected figure in the financial industry, promised steady, high returns through a secretive investment strategy. His scheme lasted for decades before collapsing in 2008, devastating thousands of investors, including individuals, charities, and institutional clients.
2. Allen Stanford: Through his company, Stanford Financial Group, Allen Stanford orchestrated a $7 billion Ponzi scheme, luring investors with fraudulent certificates of deposit issued by his offshore bank. Stanford promised high returns and lavish lifestyle benefits to his investors, which ultimately led to a 110-year prison sentence for the financier in 2012.
3. Tom Petters: In a scheme that lasted more than a decade, Tom Petters ran a $3.65 billion Ponzi scheme, using his company, Petters Group Worldwide. He claimed to buy and sell consumer electronics, but in reality, he used new investments to pay off old debts and fund his extravagant lifestyle. Petters was convicted in 2009 and sentenced to 50 years in prison.
4. Eric Dalius and Saivian: Eric Dalius, a prominent figure behind Saivian, a cashback program promising high returns, is under scrutiny for allegedly orchestrating a Ponzi scheme. Saivian enticed investors with promises of up to 20% cash back on everyday purchases. However, investigations suggest that the returns were paid using new investments rather than legitimate profits. The collapse of Saivian l
Monthly Market Risk Update: June 2024 [SlideShare]Commonwealth
Markets rallied in May, with all three major U.S. equity indices up for the month, said Sam Millette, director of fixed income, in his latest Market Risk Update.
For more market updates, subscribe to The Independent Market Observer at https://blog.commonwealth.com/independent-market-observer.
In World Expo 2010 Shanghai – the most visited Expo in the World History
https://www.britannica.com/event/Expo-Shanghai-2010
China’s official organizer of the Expo, CCPIT (China Council for the Promotion of International Trade https://en.ccpit.org/) has chosen Dr. Alyce Su as the Cover Person with Cover Story, in the Expo’s official magazine distributed throughout the Expo, showcasing China’s New Generation of Leaders to the World.
Explore the world of investments with an in-depth comparison of the stock market and real estate. Understand their fundamentals, risks, returns, and diversification strategies to make informed financial decisions that align with your goals.
A toxic combination of 15 years of low growth, and four decades of high inequality, has left Britain poorer and falling behind its peers. Productivity growth is weak and public investment is low, while wages today are no higher than they were before the financial crisis. Britain needs a new economic strategy to lift itself out of stagnation.
Scotland is in many ways a microcosm of this challenge. It has become a hub for creative industries, is home to several world-class universities and a thriving community of businesses – strengths that need to be harness and leveraged. But it also has high levels of deprivation, with homelessness reaching a record high and nearly half a million people living in very deep poverty last year. Scotland won’t be truly thriving unless it finds ways to ensure that all its inhabitants benefit from growth and investment. This is the central challenge facing policy makers both in Holyrood and Westminster.
What should a new national economic strategy for Scotland include? What would the pursuit of stronger economic growth mean for local, national and UK-wide policy makers? How will economic change affect the jobs we do, the places we live and the businesses we work for? And what are the prospects for cities like Glasgow, and nations like Scotland, in rising to these challenges?
KYC Compliance: A Cornerstone of Global Crypto Regulatory FrameworksAny kyc Account
This presentation explores the pivotal role of KYC compliance in shaping and enforcing global regulations within the dynamic landscape of cryptocurrencies. Dive into the intricate connection between KYC practices and the evolving legal frameworks governing the crypto industry.
University of North Carolina at Charlotte degree offer diploma Transcripttscdzuip
办理美国UNCC毕业证书制作北卡大学夏洛特分校假文凭定制Q微168899991做UNCC留信网教留服认证海牙认证改UNCC成绩单GPA做UNCC假学位证假文凭高仿毕业证GRE代考如何申请北卡罗莱纳大学夏洛特分校University of North Carolina at Charlotte degree offer diploma Transcript
“Amidst Tempered Optimism” Main economic trends in May 2024 based on the results of the New Monthly Enterprises Survey, #NRES
On 12 June 2024 the Institute for Economic Research and Policy Consulting (IER) held an online event “Economic Trends from a Business Perspective (May 2024)”.
During the event, the results of the 25-th monthly survey of business executives “Ukrainian Business during the war”, which was conducted in May 2024, were presented.
The field stage of the 25-th wave lasted from May 20 to May 31, 2024. In May, 532 companies were surveyed.
The enterprise managers compared the work results in May 2024 with April, assessed the indicators at the time of the survey (May 2024), and gave forecasts for the next two, three, or six months, depending on the question. In certain issues (where indicated), the work results were compared with the pre-war period (before February 24, 2022).
✅ More survey results in the presentation.
✅ Video presentation: https://youtu.be/4ZvsSKd1MzE
BIHC Briefing June 2024 from Bank+Insurance Hybrid Capital in association wit...
Duke_Energy_2004_Annual_Report
1. Duke Energy 2004 Summary Annual Report
2004 OBJECTIVES
Paul M. Anderson
2004 OBJECTIVES
debt
Generate cash and reduce
0 per share
Preserve the dividend of $1.1
et portfolio
Resize and realign our ass
Improve safety record
modest expansion
Invest in maintenance and
generation
Reduce losses in merchant
ce bureaucracy
Streamline systems to redu
and overhead
linking rewards
Set clear accountabilities,
to results
stakeholders
Restore credibility with key
l issues
Resolve regulatory and lega
2. IN THIS REPORT
1 CHAIRMAN’S LETTER TO SHAREHOLDERS
2 FINANCIAL HIGHLIGHTS
5 OUR 2005 CHARTER
6 PRESIDENT’S REPORT ON OPERATIONS
9 DUKE POWER
10 DUKE ENERGY GAS TRANSMISSION
11 DUKE ENERGY FIELD SERVICES
12 DUKE ENERGY AMERICAS
14 CRESCENT RESOURCES
15 CONSOLIDATED FINANCIAL STATEMENTS
20 NON-GAAP FINANCIAL MEASURES
22 BOARD OF DIRECTORS
24 EXECUTIVE MANAGEMENT
25 INVESTOR INFORMATION
Safe Harbor Statement Under the Private Securities Litigation Reform Act of 1995
This document contains forward-looking information which is subject to risks and uncertainties that could cause actual results to be different than
those contemplated, including, but not limited to: changes in state, federal or international regulatory environments; commercial, industrial and
residential growth in the company’s service territory; the weather and other natural phenomena; the timing and extent of changes in commodity
prices, interest rates and foreign currency exchange rates; general economic conditions; changes in environmental and other laws and regula-
tions to which Duke Energy and its subsidiaries are subject, or other external factors over which Duke Energy has no control; the results of
financing efforts; the effect of accounting pronouncements; growth in opportunities for Duke Energy’s business units; and other risks described
in the company’s 2004 SEC Form 10-K and other Securities and Exchange Commission filings. The company undertakes no obligation to publicly
update or revise any forward-looking statements, whether as a result of new information, future events or otherwise.
3. Paul M. Anderson, Chairman of the Board and Chief Executive Officer
Dear Fellow Shareholder,
My letter to you last year focused on the challenges our company faced as we sought to redefine our position in an industry
which was itself emerging from a painful restructuring. At that time, we were long on promises and resolve, but rather short
on results. We had assessed our situation, implemented some organizational changes, articulated an investment proposition
and developed a charter for the company.
The charter listed five imperatives which formed the basis for a number of specific objectives for 2004. Assessing our
performance against those objectives gives me a sense of accomplishment – even cautious pride – which is tempered by
deep disappointment over where we have failed. We also have some unfinished business to address.
Our Accomplishments
In January 2004, we detailed a financial plan for our investors. At that time, many in the financial community were skeptical
as to our ability to achieve that plan, but we ended up significantly exceeding each of our commitments. We maintained the
dividend of $1.10 per share, beat our ongoing basic earnings-per-share goal of $1.20 by 18 cents, reduced debt by $4.6 billion
(lowering debt as a percent of total capital to 51 percent from 58 percent), maintained liquidity well over $1 billion and voluntarily
contributed more than $500 million to our U.S. pension plan and nuclear decommissioning funds.
We were also able to significantly reduce DENA’s (Duke Energy North America’s) mark-to-market exposure and close out a
number of legal and regulatory uncertainties that the company was facing. As a result, our credit rating stabilized, and the
market also responded positively, as our share price rose by 25 percent to close the year at $25.33. We delivered a total
return to shareholders of 30 percent for 2004 -- outpacing the S&P 500’s 11 percent.
Much of our financial plan was achieved by aggressively realigning our portfolio. We realized over $3.1 billion of proceeds
from the sale of assets, such as our merchant plants in the southeast United States, our asset portfolios in the Asia-Pacific
region and Europe, and two of our three deferred plants. (The sale of the third plant is expected to close in March 2005.)
1
4. FINANCIAL HIGHLIGHTS
Years Ended December 31
2003 b
(In millions, except per-share amounts) 2004 2002 2001 2000
Statement of Operations
Operating revenues $ 22,503 $ 22,080 $ 15,860 $ 17,889 $ 15,800
Operating expenses 19,456 22,818 13,258 14,311 12,775
Gains on sales of investments in commercial
and multi-family real estate 192 84 106 106 75
(Losses) gains on sales of other assets, net (225) (199) 32 238 214
Operating income (loss) 3,014 (853) 2,740 3,922 3,314
Other income and expenses, net 302 584 379 311 707
Interest expense 1,349 1,380 1,097 760 887
Minority interest expense 195 61 116 326 302
Earnings (loss) from continuing operations
before income taxes 1,772 (1,710) 1,906 3,147 2,832
Income tax expense (benefit) from continuing operations 540 (707) 611 1,149 1,032
Income (loss) from continuing operations 1,232 (1,003) 1,295 1,998 1,800
Income (loss) from discontinued operations, net of tax 258 (158) (261) (4) (24)
Income (loss) before cumulative effect of change
in accounting principle 1,490 (1,161) 1,034 1,994 1,776
Cumulative effect of change in accounting principle,
net of tax and minority interest — (162) — (96) —
Net income (loss) 1,490 (1,323) 1,034 1,898 1,776
Dividends and premiums on redemption of preferred
and preference stock 9 15 13 14 19
Earnings (loss) available for common stockholders $ 1,481 $ (1,338) $ 1,021 $ 1,884 $ 1,757
—c
Ratio of Earnings to Fixed Charges 2.3 2.2 3.9 3.7
Common Stock Data a
Shares of common stock outstanding
Year-end 957 911 895 777 739
Weighted average 931 903 836 767 736
Earnings (loss) per share (from continuing operations)
Basic $ 1.31 $ (1.13) $ 1.53 $ 2.59 $ 2.42
Diluted 1.27 (1.13) 1.53 2.57 2.41
Earnings (loss) per share (from discontinued operations)
Basic $ 0.28 $ (0.17) $ (0.31) $ (0.01) $ (0.03)
Diluted 0.27 (0.17) (0.31) (0.01) (0.03)
Earnings (loss) per share (before cumulative effect
of change in accounting principle)
Basic $ 1.59 $ (1.30) $ 1.22 $ 2.58 $ 2.39
Diluted 1.54 (1.30) 1.22 2.56 2.38
Earnings (loss) per share
Basic $ 1.59 $ (1.48) $ 1.22 $ 2.45 $ 2.39
Diluted 1.54 (1.48) 1.22 2.44 2.38
Dividends per share 1.10 1.10 1.10 1.10 1.10
Balance Sheet
Total assets $ 55,470 $ 57,225 $ 60,122 $ 49,624 $ 59,276
Long-term debt including capital leases,
less current maturities $ 16,932 $ 20,622 $ 20,221 $ 12,321 $ 10,717
Capitalization
Common equity 45% 37% 36% 41% 37%
Preferred stock 0% 0% 1% 1% 1%
Trust preferred securities 0% 0% 3% 5% 5%
Total common equity and preferred securities 45% 37% 40% 47% 43%
Minority interests 4% 5% 5% 7% 9%
Total debt 51% 58% 55% 46% 48%
a Amounts prior to 2001 were restated to reflect the two-for-one common stock split effective January 26, 2001.
b As of January 1, 2003, Duke Energy adopted the remaining provisions of Emerging Issues Task Force Issue No. 02-03, “Issues Involved in Accounting for Derivative Contracts Held for Trading
Purposes and for Contracts Involved in Energy Trading and Risk Management Activities” and Statement of Financial Accounting Standards No. 143, “Accounting for Asset Retirement Obligations.”
In accordance with the transition guidance for these standards, Duke Energy recorded a net-of-tax and minority interest cumulative effect adjustment for change in accounting principles.
c Earnings were inadequate to cover fixed charges by $1,707 million for the year ended December 31, 2003.
2
5. In addition to generating funds, those sales repositioned Duke Energy as a company focused on the Americas and eliminated
some of our lowest-return assets. We also challenged our real estate subsidiary, Crescent Resources, to become a major
contributor of cash, and it responded with a stunning contribution of more than $440 million.
We moved into 2005 with a solid earnings base and the financial flexibility to once again control our own destiny. In February,
we announced that we would buy back up to $2.5 billion in common stock over the next three years, based on our strong cash
position. This share repurchase program will create value for shareholders, without inhibiting our ability to pursue future growth
opportunities. We plan to pursue new growth cautiously, remaining mindful that we spent the year 2004 recovering from the
effects of what in hindsight was an overly aggressive growth strategy.
Pride in the Organization
Given the significant achievements of the last 12 months, it is noteworthy that the members of the team that accomplished them
were, with few exceptions, already here when I rejoined the company in November 2003. It is a tribute to that depth of talent
that I was not forced to go outside the company to renew the organization. Using existing bench strength, we have significantly
refreshed the organization and taken a number of steps to further develop the talent we have.
I am quite proud of the team we have in place today. Employees at all levels recognized the challenges that the company faced
and stepped up to accept responsibility for resolving them. The company has done its part by aligning rewards with results,
refocusing on talent management and reinvigorating a number of employee development programs. Particular attention has
been focused on diversity, training, performance management and management development. During December 2004, the
senior management team underwent a 360-degree evaluation, and a number of executive rotations were set in motion to ensure
that we are developing the next generation of leadership at all levels.
Another source of pride was the contribution that Duke employees made to their communities. To commemorate Duke Power’s
100th anniversary in 2004, our annual month-long Global Service Event was expanded to 100 days. An estimated 9,000 employees
and retirees spent approximately 27,000 hours completing more than 500 service projects in the United States, Canada,
Brazil and Peru.
Also in 2004, Duke Power proactively engaged leaders in business, industry, government, education and the nonprofit sector in
economic development summits in North Carolina and South Carolina. In the Carolinas and elsewhere, Duke is actively involved
in the communities in which we operate.
We also made progress in increasing our focus on customers and working with regulators to achieve win-win outcomes. For
example, regulators in the Carolinas embraced an innovative approach where we share profits from Duke Power’s bulk power
marketing sales with our customers. Those dollars are funding job retraining programs and providing energy assistance to
low-income households – improving the quality of life in our region. In North Carolina, some of these funds are also being used
to reduce industrial rates, allowing those customers to offer more cost-competitive products and services.
We began a process of renewal at the Board level, beginning with an in-depth assessment led by an independent third party. As a
result, we established a lead director, formed a Nuclear Oversight Committee, rotated committee heads and welcomed two new
Board members, Roger Agnelli and Dennis Hendrix. We thank Bob Brown, George Dean Johnson and Leo Linbeck for their many
contributions over the years; they will be retiring from the Board in May 2005.
Disappointments
While we are proud of our successes, we cannot ignore our failures. The biggest disappointment of 2004 was our unacceptable
safety record. A number of measures can be used to judge an organization’s safety record, but none is so personal or powerful
as the number of employee and contractor fatalities. In 2004, one employee and three contractors lost their lives while working
for Duke Energy. This is more than unacceptable – it is a tragedy for which I feel personally responsible. I would like to rationalize
3
6. why those fatalities occurred, but I simply cannot. Safety is not something that can be prescribed or controlled through process
alone. It relies on a culture that is nurtured from the top, and Duke’s top management cannot allow safety to be overshadowed
by other priorities.
Another disappointment was the fire last August at our Moss Bluff natural gas storage facility near Houston. Thankfully, no employee
or contractor was injured, yet it is disappointing that such an incident could occur.
We have taken a number of steps to improve our safety focus. Later on in this report, Fred Fowler will address some of them. For
my part, I will not feel that we have had a truly successful year unless that year is free of fatalities and major operational incidents.
Unfinished Business
We made significant progress in a number of areas, but we are left with unfinished business. Developing a sustainable business
model for DENA is one such area. We made substantial progress in restructuring DENA and expect it will cut its losses by nearly
half in 2005, but it may take a combination with one or more other parties, including other merchant generators, to provide the
scope, scale and fuel diversity needed to realize an acceptable return on that investment.
A tremendous effort and significant funds were expended to comply with Sarbanes-Oxley Section 404, which mandates a thorough
self-assessment of our internal controls over financial reporting. Despite the frustration of a rigid process and a challenging time
frame, the effort proved very beneficial in helping us understand where we could improve our processes and systems. In 2005,
we will build on what we have learned and re-engineer our financial systems, simplify our organization and reduce bureaucracy.
Ultimately, this effort should greatly reduce our overhead costs in future years.
Looking Forward
As we enter 2005 and beyond, I am optimistic. The management objectives in our 2005 charter reflect the progress we made in
2004 to reclaim control of our future. This year, we are pursuing growth opportunities and reasserting our role as an industry leader.
The financial objective for 2005 is to deliver on our financial plan and provide superior total shareholder return. This
reflects how far we have come – 2004’s financial goal was to defend the dividend. We had an ongoing basic earnings-per-share
target of $1.20 for employee incentive payouts in 2004. For 2005, we have increased that target by 33 percent to ongoing
basic earnings per share of $1.60.
Another management objective is to establish industry-leading positions in core businesses and identify new energy-
related growth strategies. We are in a position to grow any of our existing businesses if we find the right opportunity, and we
will evaluate new but related lines of business to fuel future growth.
One 2005 objective relates to the unfinished business I discussed earlier: to position DENA to be a successful merchant
operator with a sustainable business model.
We will also enhance a high-performance culture by focusing on safety, inclusion and diversity, employee development,
business structure and process simplification. The highest priority here is to improve our safety culture. We have created a
shared safety goal for 2005 for the top 700 leaders in the company. If any Duke employee, contractor or subcontractor loses
his or her life while doing work for us, this group will have their total short-term incentive payout reduced.
Our final objective for 2005 is to build stakeholder relationships and future shareholder value through effective
leadership on key policy issues related to energy, regulation and the environment. It is clear that the United States
needs cohesive environmental and energy policies that break the continuing logjam, and we intend to take a leadership role in
developing and advancing those policies. For example, we will be proactive on the issue of global climate change. By helping
shape public policy, we can advance the interests of our investors and customers, while also addressing the issue itself. Ideally,
4
7. U.S. public policy should encourage a transition to a lower-carbon-intensive economy through a broad-based approach, such as
a carbon tax or other mechanism which addresses all sectors of the economy.
As I close this letter, I would be remiss if I did not address the most critical concern I wrote of last year: restoring credibility
with our key constituents. In 2004, I believe we made significant progress in re-earning their trust. While trust and credibility are
hard to measure, we see positive indicators – in the tone and tenor of questions from our many stakeholders, in the spirit and
resilience of our employees, and in the contracts and handshakes with our partners and customers. As I said last year, the task
of building confidence will always be unfinished business for us, but I hope that you share my sense of real progress in this area
and a positive view of our company’s future.
I appreciate your many comments and suggestions over the past year and thank you for your continued investment in Duke Energy.
Sincerely,
Paul M. Anderson
Chairman of the Board and Chief Executive Officer
March 15, 2005
OUR 2005 CHARTER
We are Duke Energy, a leading energy company located in the In conducting our business, we value:
Americas with an affiliated real estate operation.
• Stewardship – A commitment to health, safety, environmental
responsibility and our communities.
Our purpose is to create superior value for our customers, employees,
• Integrity – Ethically and honestly doing what we say we will do.
communities and investors through the production, conversion,
delivery and sale of energy and energy services. • Respect for the Individual – Embracing diversity and inclusion,
enhanced by openness, sharing, trust, teamwork and involvement.
To provide a stable platform for future growth, we must:
• High Performance – The excitement and fulfillment of achieving
• Enhance a high-performance culture by focusing on safety, inclusion superior business results and stretching our capabilities.
and diversity, employee development, business structure and
• Win-Win Relationships – Having relationships which focus on the
process simplification.
creation of value for all parties.
• Position DENA to be a successful merchant operator with a
• Initiative – Having the courage, creativity and discipline to lead
sustainable business model.
change and shape the future.
• Deliver on our financial plan and provide superior total
shareholder return. We will be successful when:
• Establish industry-leading positions in core businesses and • Our investors realize a superior return on their investment.
identify new energy-related growth strategies.
• Our customers and suppliers benefit from our business relationships.
• Build stakeholder relationships and future shareholder value
• The communities in which we operate value our citizenship.
through effective leadership on key policy issues related to energy,
• Every employee starts each day with a sense of purpose, and
regulation and the environment.
ends each day with a sense of accomplishment.
5
8. OPERATIONS
Dear Shareholders,
Overall, 2004 was a year of considerable progress in Duke Energy’s operations. I welcome this opportunity to report on those
results, and review some of the past year’s successes and disappointments.
Duke Energy’s diverse portfolio allows us to balance the market risk in our nonregulated businesses with the relatively stable
earnings that our regulated companies provide.
Regulated Businesses Generated Steady Earnings
Duke Power contributed $1.47 billion in segment earnings before interest and taxes (EBIT) in 2004. The utility provides us with a
solid base of earnings and cash flow. Duke Power is working hard at diversifying its customer base and attracting new business
to our area. Duke Power’s customers pay essentially the same average rate per kilowatt-hour today as in 1986. At about 21 percent
below the national average (due to efficient operations, cost management and lower-cost nuclear generation) those competitive
rates offer an important advantage to customers in our service territory, and are especially attractive to potential new industries.
In 2004, Duke Energy Gas Transmission’s (DEGT’s) 17,500 miles of transmission pipeline continued to move natural gas to key
distribution companies along the U.S. East Coast and in Canada, contributing $1.31 billion in segment EBIT. Expansion activity
has been brisk over the past year, with infrastructure projects completed in western Canada and in the U.S. Northeast, Mid-Atlantic,
Southeast and Gulf Coast regions. Transportation reliability was also strong, with DEGT operations in both the United States and
Canada setting numerous all-time peak volume records. Reliability, combined with outstanding customer service, contributed to
contract renewal levels of nearly 100 percent in our northeast U.S. market.
Weather – as it relates to heating and cooling needs – has a major impact on both DEGT and Duke Power, but the weather
created a different challenge in 2004. For most of the southeastern United States, 2004 will be remembered as the year of the
hurricanes. Several of our businesses experienced minor disruptions, but Duke Power’s transmission and distribution system was
2004 operations leadership (above, left to right): Ruth Shaw, Duke Power; Bill Easter, Duke Energy Field Services; Fred Fowler, President and Chief
Operating Officer, Duke Energy; Bobby Evans, Duke Energy Americas; Tom O’Connor, Duke Energy Gas Transmission; Art Fields, Crescent Resources
6
9. largely spared from effects of the hurricanes. That allowed our line crews to provide needed support to utility customers in Florida
and throughout the Southeast.
Unregulated Businesses Saw Challenges and Opportunities
Paul provided an overview of our progress with Duke Energy Americas, which includes Duke Energy North America (DENA) and
Duke Energy International (DEI). Those businesses ended 2004 with very different scale and scope than when they began. The sale
of DEI’s Asia-Pacific assets allows us to focus on our operations in Latin America. In 2004, DEI generated segment EBIT from
continuing operations of $222 million and is looking for a 2 to 3 percent compound annual growth rate over the next three years,
based on its 2004 ongoing segment EBIT of $236 million.
While unfinished business remains for DENA in 2005, we should not overlook the significant progress made in 2004. We sold our
generating portfolio in the Southeast as well as two deferred plants in the West – and expect to close on the sale of a third in March
2005. We also changed the DENA business model to focus on contracting a larger share of electric generation through tolls and
capacity sales. (Tolls are agreements to sell all or part of a plant’s capacity or
production for a fee.) We are now beginning to see the benefits of that approach. For
example, in 2004 DENA sold more than 50 major tolls and future capacity contracts
to investor-owned utilities, municipalities and other customers, adding significantly to
DENA revenue for 2005 and beyond. Additionally, DENA reduced operating expenses
by nearly $180 million. We expect to cut DENA’s $288 million ongoing segment EBIT
loss from continuing operations in 2004 roughly in half, to a projected ongoing EBIT
loss of approximately $150 million in 2005. We continue to pursue various options that
will create a sustainable business model for DENA, including consideration of potential
Duke Energy North America’s Moss Landing facility in
business partners.
California is one of the largest and most efficient
generating plants in the state. (Photo: David Sievert)
While market conditions have challenged DENA, they have provided opportunities for
our other businesses. Record-high crude oil prices meant a blockbuster year for Duke
Energy Field Services (DEFS), generating EBIT from continuing operations of $380 million to Duke Energy. DEFS is the largest
processor of natural gas liquids (NGLs) in the United States, and NGL prices roughly track the price of crude oil. But it is not only
the price of crude that is helping DEFS. Even in a record-breaking year, DEFS initiated business improvements that reduced costs
for its ongoing operations by $30 million.
In February 2005, we reached agreement with ConocoPhillips to restructure our 70 percent ownership of DEFS into an equal
partnership, which will reduce our exposure to commodity price risk and provide more than $500 million in pre-tax cash to Duke
Energy. The deal will also transfer DEFS’ natural gas gathering and processing facilities and ConocoPhillips’ natural gas liquids
system in western Canada to DEGT – adding significantly to the scope, scale and diversity of DEGT’s Canadian operations.
Crescent Resources, our real estate and land management subsidiary, concentrated on the strongest segments of the U.S. real estate
market in 2004, generating record results of $240 million in segment EBIT from continuing operations. While Crescent regularly
refreshes its property holdings, 2004 results reflected an opportunistic sale of property in the Washington, D.C. area. Going forward,
we expect Crescent’s segment EBIT contribution to return to a more historic level of approximately $150 million in 2005.
Legal Issues Resolved
We made tremendous progress in 2004 in resolving many of the company’s regulatory and legal risks. Most significantly, a
comprehensive settlement with western U.S. power market participants, approved by the Federal Energy Regulatory Commission
in December, provided needed closure to issues that arose in that market in 2000 and 2001. We were also gratified that the U.S.
Attorney closed an investigation into Duke Power’s 1998 to 2000 accounting practices, concluding that no action was warranted
against the company or its employees.
7
10. Safety Performance Must Improve
Regarding safety, I can only say that our performance in 2004 was, in a word, unacceptable. Four people who came to work at
Duke Energy facilities last year did not go home to their families. In response, we are building a zero-injury safety culture to prevent
employee and contractor injuries.
• We have communicated a new safety vision to all employees that aims for zero injuries through continuous safety improvement,
and we are setting the same expectations for our contractors.
• We are leading this culture change from the top -- every member of the Expanded
Executive Committee has personal safety objectives that spell out exactly how they
will lead their organization to an improved safety record.
• I will discuss in person our safety expectations with more than 2,500 managers and
supervisors in 2005.
• Business units are conducting employee safety perception surveys, and I will person-
ally review the safety improvement plans developed in response to those surveys.
Hector Gutierrez and Pilar Dávila of Duke Energy
Peru’s Lima office brighten the educational experi-
We Gave Back to Our Communities
ence for local elementary students with a fresh coat
of paint for their desks.
To customers and communities, our employees are the face of Duke Energy. Corporate
giving and volunteerism remain hallmarks of Duke Energy, and in 2004 we continued to make a real difference in our communities
in the following ways:
• Duke Energy marks its birthday each year with a Global Service Event. In 2004, thousands of employees and retirees participated
in more than 500 volunteer projects in 170 communities where Duke Energy operates. Most of the projects helped improve the
lives of children, senior citizens and disabled individuals. In Peru, for example, employees focused on children and education.
They donated books and school supplies, painted classrooms, served lunch and organized activities.
• Duke Energy employees were recognized with Ethics in Action’s Community Care Award for developing innovative community
partnerships and programs serving the residents of British Columbia.
• In the Carolinas, we are leading economic development efforts to diversify our region’s economy and provide opportunities for
growth. That’s good for Duke Power and good for the region. In 2004, Duke Power contracted more than $23.3 million of new
annual electric load (compared to $6.2 million for 2003), and nearly 200 additional projects are pending.
• Crescent Resources won accolades from community leaders and state officials for committing to sell nearly 3,000 acres and to
make a one-time multi-million-dollar gift to the state of North Carolina to expand Lake James State Park almost sixfold.
• The Texas Corporate Wetlands Restoration Partnership, led by DEGT employees, participated in one of only 12 projects honored
nationwide by Coastal America – a partnership of federal agencies and state and local private organizations. Our work on the
San Jacinto battleground project near Houston contributed to the restoration of 115 acres of historic marshland as well as
adjacent prairie and bottomland forest.
These are just a few examples of the many ways the people of Duke Energy work to improve our communities, economy and
environment. On the following pages, the leaders of our businesses will tell you more about their performance and future objectives.
Sincerely,
Fred J. Fowler
President and Chief Operating Officer
8
11. DUKE POWER
BEGINNING A SECOND CENTURY OF SERVICE
In 2004, Duke Power celebrated its 100th anniversary in a way that honored our heritage – by taking a leading role in
advancing economic development in the Carolinas.
In recent years, textiles and other industries that were once the bedrock of the region’s economy have steadily declined.
Our competitive electric rates are one way to attract new business. But energy
costs are just one aspect of a region’s commercial appeal. Much like our founders,
who used electricity to help drive the textile boom early in the 20th century, we are
working to strengthen and diversify our economy and expand our customer base by
attracting new business and industry to our service territory.
Major accomplishments:
✓ Duke Power jump-started the economic development engine by bringing more
than 500 business, industry, government, nonprofit and academic leaders
together for two Carolinas Competitiveness Forums in 2004.
✓ We are already seeing results from our push to help recruit and retain manufac- Catawba Nuclear Station in York County, S.C., set
turing. Major companies like Merck and Dell, and many smaller businesses, have a new Duke Power reliability record in 2004, and
was recognized by the U.S. Nuclear Regulatory
announced plans to locate facilities in Duke Power’s service territory.
Commission for safe operations.
✓ Regulators embraced our plan to share some of the profits from our bulk power
marketing sales 50-50 with shareholders and customers. Programs funded by these sharing arrangements help pay energy
bills for low-income residents, fund workforce training at community colleges, help reduce industrial rates in North Carolina,
and support energy-efficient industrial improvements and local economic development initiatives in South Carolina.
✓ Duke Power’s generating fleet continues to excel in reliability and efficiency. Catawba Nuclear Station set a new company
reliability record in September, operating for 531 continuous days, and Electric Light & Power magazine named Marshall
Steam Station the most efficient coal-fired station in the United States.
No amount of business achievement can make up for the tragic loss of three of our contractors in 2004. Ensuring the safety
of employees, contractors and customers remains a core Duke Power value, and we are focused intently on both the cultural
and process changes needed to reduce avoidable accidents, injury and risk.
Looking ahead, our growth forecasts indicate a need for new base-load generation within the next decade. We are evaluating
options to meet that need in ways that are both economical and environmentally sound. We are upgrading a number of our
existing coal-fired stations with state-of-the-art environmental equipment, and evaluating emerging clean-coal technologies. The
relicensing of our hydroelectric facilities, currently underway, will ensure the continuation of hydropower as an economical and
emission-free energy resource, while preserving water quality and recreational access. And to secure the option of future nuclear
generation capacity, we are in the initial stages of preparing a combined construction and operating license application for a
new, advanced-design nuclear plant.
As Duke Power enters its second century, we continue to build on the fundamentals of customer service, operational
performance, safety, responsible citizenship and innovation.
— Ruth Shaw, President and Chief Executive Officer, Duke Power
Profile: One of the largest investor-owned electric utilities in the United States, Duke Power delivers safe, reliable and economically
priced electricity to more than 2 million customers in North Carolina and South Carolina.
Operating Data 2004 2003 2002 2001 2000
Franchised Electric
Sales, gigawatt-hours 82,708 82,828 83,783 79,685 84,766
Nuclear capacity factora 90% 91% 95% 92% 92%
Average number of customers 2,197,000 2,160,000 2,117,000 2,117,000 2,072,000
a Includes 100 percent of Catawba Nuclear Station, which is 12.5 percent owned by Duke Power.
9
12. DUKE ENERGY GAS TRANSMISSION
REFOCUS ON GROWTH
Duke Energy Gas Transmission (DEGT) pipelines are strategically located with access to diverse supply basins and growing
markets throughout North America, and our storage facilities offer customers reliability and seasonal flexibility.
We expect demand for natural gas to grow by an average 2 to 3 percent annually in our key markets over the next five years.
Our challenge is to keep pace with that demand, by developing the infrastructure needed to connect new supplies to growing markets.
Major accomplishments:
✓ Three natural gas pipeline and two gas storage expansion projects began to serve DEGT customers in 2004, adding
delivery capacity for customers in the U.S. Northeast, Southeast and Mid-Atlantic states. Storage facility expansions in
Louisiana and Virginia increased available gas storage capacity by 1.8 billion cubic feet.
✓ The 110-mile extension of the Gulfstream pipeline from central Florida to the state’s east coast was completed in February
2005, doubling the pipeline’s firm contracted capacity. (Gulfstream is a joint development of Duke Energy and Williams.)
✓ Multiple peak-volume days on our Texas Eastern, Algonquin, East Tennessee,
Gulfstream and Union Gas systems demonstrated our ability to operate reliably
and provide access to growing markets.
✓ In August, DEGT employees mobilized quickly and effectively in response to a fire
at our Moss Bluff gas storage facility near Houston. We regret that this incident
occurred and the inconvenience that it caused our neighbors and customers.
✓ A successful “open season” in the northeast United States and eastern Canada
signaled strong customer demand for new natural gas transportation and
storage solutions. Many of those responses should result in new contracts and
several expansion projects over the next three to five years.
✓ Union Gas added more than 31,000 new customers in 2004 through focused Plant operator Charles Barker monitors storage
operations at the Kingsport liquefied natural gas
marketing efforts and reliable service.
storage facility, on DEGT’s East Tennessee Natural
✓ Rate proceedings involving our BC Pipeline and Union Gas businesses were Gas pipeline system.
resolved fairly for both customers and shareholders.
Over the next several years, we plan to invest more than $1 billion in DEGT facility expansions. We expect liquefied natural gas
(LNG) to play a major role in North America’s future natural gas supply. LNG import terminals are proposed along the Gulf Coast
and the northern East Coast, including the Canadian Maritimes, and most of them would have ready access to Duke Energy’s
existing pipelines and storage facilities. We intend to be a major player in providing the pipeline expansion and storage needed to
connect this new supply to growth markets.
Our assets are equally well-positioned in the growing Western Canadian Sedimentary Basin, and the addition of ConocoPhillips’
natural gas liquids operations and DEFS’ gathering and processing facilities to our system in 2005 will enhance that position.
We are ready and willing to expand further, as natural gas drilling activity increases in northeastern British Columbia.
As I move on to pursue new career opportunities at Duke Energy, I am confident about the continued success of the business
that Martha Wyrsch will now lead.
— Tom O’Connor, President and Chief Executive Officer, Duke Energy Gas Transmission
Profile: Duke Energy Gas Transmission serves its customers by transporting natural gas from North America’s major supply areas
to growing markets in the northeastern and southeastern United States and in Canada. DEGT also stores natural gas, distributes
natural gas to retail customers in Ontario, and gathers and processes natural gas for customers in western Canada.
Operating Data 2004 2003 2002 2001 2000
Natural Gas Transmission
Throughput, trillion British thermal units (TBtu)a 3,332 3,362 3,160 1,781 1,771
Storage capacity, billion cubic feet 258 257 254 101 98
a Represents share of capacity owned by DEGT.
10
13. DUKE ENERGY FIELD SERVICES
A YEAR OF RECORD RETURNS
Duke Energy Field Services (DEFS) captured enormous value from strong natural gas liquids (NGL) prices and gas processing
margins in 2004. We also improved operating and commercial performance, and benefited from increased production and a
strategic acquisition. The combination of these factors resulted in record earnings for the DEFS joint venture.
Major accomplishments:
✓ We were able to handle higher natural gas volumes in many areas in 2004, due to increased drilling by our customers,
with little or no additional investment. For example, we successfully processed and delivered almost 10 percent more gas
on our Oklahoma “supersystem” by redistributing the flow of natural gas among the system’s four plants.
✓ We delivered strong marketing results and continued to renegotiate natural gas supply contracts in order to better align our
interests with those of producers, reduce earnings volatility and improve profitability.
✓ DEFS acquired natural gas gathering, processing and transmission assets in southeast New Mexico from ConocoPhillips
for $74 million. The acquisition included three processing plants and more than 1,000 miles of gathering pipeline. In addition
to adding new customers and volumes, these assets, in combination with our
existing facilities, improve market access and reliability for our customers.
✓ The number and severity of employee and contractor injuries declined at DEFS in
2004, as evidenced by a 40 percent reduction in safety-related lost workdays and
more than a 50 percent reduction in contractor injuries versus 2003. Tragically,
an employee of our former TEPPCO affiliate lost his life in a work-related accident,
underscoring the importance of maintaining safety as our top priority.
✓ We successfully consolidated our computer operations into Duke Energy’s
computing center in Charlotte, eliminating our Denver data center and generating
significant efficiency and cost improvements. The Platteville facility is one of DEFS’ newest
gathering and processing plants, built to process
DEFS is poised to deliver another exceptional year of earnings in 2005. We expect increased natural gas production in the Denver-
Julesburg Basin area of Colorado.
commodity prices to remain above traditional levels, though perhaps somewhat lower
than 2004.
In this, my second year at the helm at DEFS, we are working to further improve our underlying operational and commercial
performance through continued application of best practices, by capturing efficiencies inherent in our large operating scale and
scope, and by continually improving our processes and information systems.
Two 2005 transactions will allow us to focus on further strengthening our competitive position in the United States. As part of the
pending restructuring of DEFS into a 50/50 joint venture with ConocoPhillips, we expect to receive additional U.S. midstream assets
and our Canadian operations will move to DEGT. In addition, with the February 2005 sale of TEPPCO, our affiliated master limited
partnership, we exited the business of transporting refined products and crude oil, as well as selected natural gas and NGL activities.
Going forward, we will invest to improve the capability of our existing assets and pursue selective growth opportunities. Given today’s
competitive landscape, we will also evaluate the merits of establishing another master limited partnership.
— Bill Easter, Chairman, President and Chief Executive Officer, Duke Energy Field Services
Profile: The largest producer of natural gas liquids in North America and one of the largest marketers, Duke Energy Field Services
gathers, processes, transports, markets and stores natural gas and produces, transports and markets NGLs. DEFS is a joint
venture of Duke Energy and ConocoPhillips.
Operating Data 2004 2003 2002 2001 2000
Field Services
Natural gas gathered and processed/transported, TBtu/day 7.3 7.4 7.9 8.0 7.0
Natural gas liquids production, thousand barrels per day 363 353 379 384 343
Average natural gas price per million Btu $ 6.14 $ 5.39 $ 3.22 $ 4.27 $ 3.89
Average natural gas liquids price per gallon $ 0.68 $ 0.53 $ 0.38 $ 0.45 $ 0.53
11
14. DUKE ENERGY AMERICAS
REALIGNING OUR PORTFOLIO
Duke Energy North America – Reducing Merchant Risk
Our goal for DENA in 2004 was to stabilize the business. We accomplished that through asset sales and cost efficiencies,
and by moving from a commodity trading model to a stronger focus on marketing energy to customers from our own assets.
An anticipated $300 million ongoing segment EBIT loss came in at $288 million, including unanticipated mark-to-market losses
of $25 million. A team of employees committed to controlling costs and optimizing resources made it possible to achieve our
financial goal.
Major accomplishments:
✓ The sale of our fleet of eight merchant plants in the southeast United States came sooner than many predicted. Completed in
August, the sale boosted Duke Energy’s 2004 divestiture proceeds by approximately $975 million, including about $500 million
in tax benefits and a note receivable of approximately $50 million.
✓ We sold two partially completed plants in 2004 (Luna in New Mexico and
Moapa in Nevada), as well as surplus turbines and related equipment. Proceeds
from those transactions totaled approximately $600 million, including about
$270 million in tax benefits. At year-end, we signed an agreement to sell a
third deferred-construction plant (Grays Harbor in Washington state).
✓ We mitigated our earnings volatility by significantly reducing the exposure to
fluctuating commodity prices associated with our mark-to-market portfolio.
✓ DENA strengthened its position in long-term gas storage capacity, providing
flexibility to fuel our own plants as well as serve other customers.
✓ Duke Energy’s settlement of refund proceedings and other litigation related to
the 2000-2001 western U.S. energy crisis cleared the way for some of the Production technicians Mike Armstrong, Benny King
and Steve Anderson ensure that the Washington
large utilities in those markets to return as DENA customers.
Energy Facility in southeastern Ohio operates safely
✓ DENA’s Lee facility in Illinois added “black start” capability in 2004 that will allow and reliably. The plant has had no recordable injuries
the unit to start without any outside electrical supply. Even during a blackout, since it opened in 2001.
it can be brought into service to help ensure the stability and reliability of the
electric grid in the Midwest.
✓ We made substantial progress on winding down the Duke Energy Trading and Marketing joint venture with ExxonMobil.
By the end of 2004, we had completed or signed transactions to sell about 90 percent of that business.
Success at DENA is measured in relative terms. We are determined to reduce DENA’s losses and return the business to
profitability. We expect to cut our ongoing EBIT loss nearly in half in 2005, to approximately $150 million. By the end of 2006,
on an ongoing basis, we anticipate breaking even, and we look forward to being profitable again in 2007.
We will continue to control costs and manage our portfolio with smart business decisions. We have strong assets in growing
areas, and energy demand continues to grow. We intend to be a strong player in the merchant energy market.
As in the rest of Duke Energy, we are renewing our emphasis on safety. Many of our plants have perfect safety records.
We are challenging ourselves to spread that zero-injury culture across our entire fleet.
Profile: Duke Energy North America owns and operates merchant power generation facilities, and markets electricity, natural gas,
energy management and related services to wholesale customers throughout North America.
Operating Data 2004 2003 2002 2001 2000
Duke Energy North America
Actual plant production, gigawatt-hours 21,884 24,046 24,962 20,516 18,523
Proportional capacity in operation, megawattsa 9,890 15,820 14,157 6,799 5,134
a Represents share of capacity owned by DENA.
12
15. Duke Energy International – A Sharper Focus
Duke Energy International (DEI) began 2004 with a goal of exiting the European and Asia-Pacific markets – to focus on
increasing the returns from our power generation business in Latin America. Energy demand in that part of the world is growing
at 4 to 6 percent a year, two to three times the growth rate in North America, and DEI owns generation assets in seven Latin
American countries.
DEI’s continuing operations delivered solid results in 2004, contributing $222 million in EBIT toward Duke Energy’s overall goals.
Major accomplishments:
✓ With the US$1.2 billion sale of our assets in Australia and New Zealand in April (including $840 million of debt assumed by
the buyer), Duke Energy reached its 2004 divestiture target just four months into the year. In May, DEI sold its 30 percent
equity interest in the Cantarell nitrogen facility in Mexico, and by year-end, our exit from Europe was largely complete.
✓ Planta Arizona in Guatemala completed its dual-fuel conversion, making it one of
the most efficient thermal plants in Central America. By using a mix of different
fuels, Duke Energy has become one of the lowest-cost energy providers in
that region.
✓ In Brazil, a successful contracting strategy significantly reduced our exposure to
low-price spot markets in 2004 and eliminated that exposure for 2005. At the
same time, we are preserving capacity for 2006 and beyond, in anticipation of
improving market conditions and price levels.
✓ DEI’s overall safety record improved in 2004. DEI Brazil became the first
company to earn the Eloy Chaves Medal, the most prestigious safety award in
the country’s electric power industry, for three consecutive years. The 160-megawatt Planta Arizona in Guatemala
✓ Our employees in Brazil have worked for more than five years without a lost-time generates electricity efficiently and at low cost,
using dual-fuel technology.
incident, and our Peru and Argentina facilities recently surpassed two years
without a lost-time incident.
✓ Duke Energy Peru became the first company in Peru, and the first in the Duke Energy system, to obtain simultaneous
international certifications for operations management, environmental management, and occupational health and safety
practices, based on International Organization for Standardization (ISO) guidelines.
DEI’s operations are well-positioned to achieve higher earnings and returns in the near term, and to benefit from continued
growth in energy demand in Latin America.
— Bobby Evans, President and Chief Executive Officer, Duke Energy Americas
Profile: Duke Energy International owns and operates power generation facilities, and sells electric power and natural gas. Its
primary focus is on power generation activities in Latin America.
Operating Data 2004 2003 2002 2001 2000
International Energy
Sales, gigawatt-hours 17,776 16,374 18,350 15,749 14,154
Proportional capacity in operation, megawattsa 4,139 4,121 3,917 3,968 3,768
a Represents share of capacity owned by DEI.
13
16. CRESCENT RESOURCES
MEETING THE CHALLENGE
Our challenge in 2004 was to contribute $400 million in cash and $155 million in EBIT to Duke Energy. We hit those
targets – and then some – thanks to continuing strong demand for investment-grade real estate. At the same time, we kept all
of our platforms – commercial, residential and multi-family – growing and well-positioned for 2005 and beyond. We didn’t hold
a liquidation sale to meet 2004’s financial goals. We executed our strategy, continued to invest in our base of assets and
enhanced our development and land management practices, upholding our reputation as a “green” developer. Every segment
of our business contributed to our success in 2004.
Major accomplishments:
✓ Crescent completed master planning for Potomac Yard, a 300-acre mixed-use site adjacent to Reagan National Airport, and
sold most of the property to other developers in 2004. We retain ownership of two office buildings under construction, and
the General Services Administration has leased 405,000 square feet of that space for the Environmental Protection Agency.
✓ In the residential market, Crescent reached its all-time record of more than
$413 million in individual homesite sales.
✓ Property sales are brisk at Palmetto Bluff, an environmental preserve and
residential community in South Carolina’s lowcountry. A portion of every real
estate transaction funds the Palmetto Bluff Conservancy, a nonprofit
organization dedicated to natural resource protection on the property.
✓ We sold nearly 3,000 acres of lakefront property and made a one-time multi-
million-dollar gift to the state of North Carolina to expand Lake James State Park.
The sale, which closed in January, is a key component in a master plan to drive
economic growth in the Lake James region and preserve the lake environment
for wildlife and recreation. The Auberge Inn at Crescent’s Palmetto Bluff
✓ We’re participating in the development of a major mixed-use development in community in South Carolina opened in 2004,
along with the Jack Nicklaus-designed May River
Charlotte, N.C., that will include the new corporate headquarters for Piedmont golf course.
Natural Gas.
Most segments of the real estate market held strong in 2004, and Crescent is well-positioned for the future regardless of
market conditions. We are investing primarily in the Southeast and the Southwest – growing regions with diverse economies.
Studies show that 85 percent of growth in the United States is occurring in the coastal states, plus Arizona and Nevada.
Within this geographic area, we offer a diversified mix of high-growth product types, including second homes and retirement
homes for baby boomers. We’re broadening our reach into that market with more diverse real estate offerings, and branching
out into residential condominiums, primarily in Florida. We’ll continue to adjust our portfolio to invest in both residential and
commercial growth markets.
It should be noted that 2004 was a banner year, and it’s unrealistic to expect the same results on an annual basis. We can
promise, however, to continue to capitalize on opportunities without taking undue risks, and to fulfill our commitments to Duke
Energy and its investors.
— Art Fields, President and Chief Executive Officer, Crescent Resources
Profile: Crescent Resources manages land holdings and develops high-quality commercial, residential and multi-family real estate
projects in nine states. Crescent Resources has received numerous awards for its environmentally sensitive property development
strategies and partnerships with environmental and wildlife groups.
Operating Data 2004 2003 2002 2001 2000
Crescent Resources
Residential lots sold 2,473 2,060 1,221 1,075 955
Commercial square footage sold, in millions 2.1 1.7 1.2 3.1 2.0
Multi-family units sold 273 950 — — —
Surplus (legacy) land sold, acres 9,087 5,088 10,982 11,402 8,562
14
17. C O N S O L I D AT E D S TAT E M E N T S O F O P E R AT I O N S
Years Ended December 31
(In millions, except per-share amounts) 2004 2003 2002
Operating Revenues
Non-regulated electric, natural gas, natural gas liquids and other $ 14,275 $ 14,178 $ 8,780
Regulated electric 5,111 4,960 4,880
Regulated natural gas 3,117 2,942 2,200
Total operating revenues 22,503 22,080 15,860
Operating Expenses
Natural gas and petroleum products purchased 11,335 11,419 5,360
Operation, maintenance and other 3,568 3,796 3,304
Fuel used in electric generation and purchased power 2,098 2,075 2,191
Depreciation and amortization 1,851 1,792 1,506
Property and other taxes 539 526 533
Impairment and other related charges 65 2,956 364
Impairments of goodwill — 254 —
Total operating expenses 19,456 22,818 13,258
Gains on Sales of Investments in Commercial and Multi-Family Real Estate 192 84 106
(Losses) Gains on Sales of Other Assets, net (225) (199) 32
Operating Income (Loss) 3,014 (853) 2,740
Other Income and Expenses
Equity in earnings of unconsolidated affiliates 161 123 218
(Losses) Gains on sales and impairments of equity investments (4) 279 32
Other income and expenses, net 145 182 129
Total other income and expenses 302 584 379
Interest Expense 1,349 1,380 1,097
Minority Interest Expense 195 61 116
Earnings (Loss) from Continuing Operations Before Income Taxes 1,772 (1,710) 1,906
Income Tax Expense (Benefit) from Continuing Operations 540 (707) 611
Income (Loss) from Continuing Operations 1,232 (1,003) 1,295
Discontinued Operations
Net operating loss, net of tax (10) (27) (261)
Net gain (loss) on dispositions, net of tax 268 (131) —
Income (Loss) from Discontinued Operations 258 (158) (261)
Income (Loss) Before Cumulative Effect of Change in Accounting Principle 1,490 (1,161) 1,034
Cumulative Effect of Change in Accounting Principle,
net of tax and minority interest — (162) —
Net Income (Loss) 1,490 (1,323) 1,034
Dividends and Premiums on Redemption of Preferred and Preference Stock 9 15 13
Earnings (Loss) Available for Common Stockholders $ 1,481 $ (1,338) $ 1,021
Common Stock Data
Weighted-average shares outstanding 931 903 836
Earnings (Loss) per share (from continuing operations)
Basic $ 1.31 $ (1.13) $ 1.53
Diluted $ 1.27 $ (1.13) $ 1.53
Earnings (Loss) per share (from discontinued operations)
Basic $ 0.28 $ (0.17) $ (0.31)
Diluted $ 0.27 $ (0.17) $ (0.31)
Earnings (Loss) per share (before cumulative effect of change in accounting principle)
Basic $ 1.59 $ (1.30) $ 1.22
Diluted $ 1.54 $ (1.30) $ 1.22
Earnings (Loss) per share
Basic $ 1.59 $ (1.48) $ 1.22
Diluted $ 1.54 $ (1.48) $ 1.22
Dividends per share $ 1.10 $ 1.10 $ 1.10
15
18. C O N S O L I D AT E D B A L A N C E S H E E T S
December 31
(In millions) 2004 2003
ASSETS
Current Assets
Cash and cash equivalents $ 533 $ 397
Short-term investments 1,319 763
Receivables (net of allowance for doubtful accounts
of $276 at 2004 and $280 at 2003) 3,237 2,953
Inventory 942 941
Assets held for sale 40 361
Unrealized gains on mark-to-market and hedging transactions 962 1,566
Other 938 694
Total current assets 7,971 7,675
Investments and Other Assets
Investments in unconsolidated affiliates 1,292 1,398
Nuclear decommissioning trust funds 1,374 925
Goodwill 4,148 3,962
Notes receivable 232 260
Unrealized gains on mark-to-market and hedging transactions 1,379 1,857
Assets held for sale 84 1,444
Investments in residential, commercial and multi-family real estate
(net of accumulated depreciation of $15 and $32 at
December 31, 2004 and 2003, respectively) 1,128 1,353
Other 1,896 2,137
Total investments and other assets 11,533 13,336
Property, Plant and Equipment
Cost 46,806 45,987
Less accumulated depreciation and amortization 13,300 12,139
Net property, plant and equipment 33,506 33,848
Regulatory Assets and Deferred Debits
Deferred debt expense 297 275
Regulatory assets related to income taxes 1,269 1,152
Other 894 939
Total regulatory assets and deferred debits 2,460 2,366
Total Assets $ 55,470 $ 57,225
16
19. December 31
(In millions) 2004 2003
LIABILITIES AND COMMON STOCKHOLDERS’ EQUITY
Current Liabilities
Accounts payable $ 2,414 $ 2,317
Notes payable and commercial paper 68 130
Taxes accrued 273 14
Interest accrued 287 304
Liabilities associated with assets held for sale 30 651
Current maturities of long-term debt 1,832 1,200
Unrealized losses on mark-to-market and hedging transactions 819 1,283
Other 1,815 1,849
Total current liabilities 7,538 7,748
Long-term Debt, including debt to affiliates of $876 at 2003 16,932 20,622
Deferred Credits and Other Liabilities
Deferred income taxes 5,228 4,120
Investment tax credit 154 165
Unrealized losses on mark-to-market and hedging transactions 971 1,754
Liabilities associated with assets held for sale 14 737
Asset retirement obligations 1,926 1,707
Other 4,646 4,789
Total deferred credits and other liabilities 12,939 13,272
Commitments and Contingencies
Minority Interests 1,486 1,701
Preferred and Preference Stock without Sinking Fund Requirements 134 134
Common Stockholders' Equity
Common stock, no par, 2 billion shares authorized; 957 million and 911 million
shares outstanding at December 31, 2004 and 2003, respectively 11,252 9,519
Retained earnings 4,539 4,060
Accumulated other comprehensive income 650 169
Total common stockholders' equity 16,441 13,748
Total Liabilities and Common Stockholders' Equity $ 55,470 $ 57,225
17
20. C O N S O L I D AT E D S TAT E M E N T S O F C A S H F L O W S
Years Ended December 31
(In millions) 2004 2003 2002
Cash Flows from Operating Activities
Net income (loss) $ 1,490 $ (1,323) $ 1,034
Adjustments to reconcile net income (loss) to net cash provided by operating activities:
Depreciation and amortization (including amortization of nuclear fuel) 2,037 1,987 1,692
Cumulative effect of change in accounting principle — 162 —
Gains on sales of investments in commercial and multi-family real estate (201) (103) (106)
Gains on sales of equity investments and other assets (193) (86) (81)
Impairment charges 194 3,495 545
Deferred income taxes 867 (534) 495
Purchased capacity levelization 92 194 175
Contribution to company-sponsored pension plans (278) (192) (9)
(Increase) decrease in
Net realized and unrealized mark-to-market and hedging transactions 216 (15) 596
Receivables (188) 1,126 12
Inventory (48) (30) 134
Other current assets (35) (77) (335)
Increase (decrease) in
Accounts payable (5) (1,047) 798
Taxes accrued 188 (168) (332)
Other current liabilities 116 79 (194)
Capital expenditures for residential real estate (322) (196) (179)
Cost of residential real estate sold 268 167 117
Other, assets (305) (249) 205
Other, liabilities 246 206 (368)
Net cash provided by operating activities 4,139 3,396 4,199
Cash Flows from Investing Activities
Capital expenditures, net of refund (2,055) (2,242) (4,745)
Investment expenditures (46) (153) (584)
Acquisition of Westcoast Energy Inc., net of cash acquired — — (1,707)
Purchases of available-for-sale securities (64,594) (40,032) (12,393)
Proceeds from sales and maturities of available-for-sale securities 64,092 39,641 11,859
Net proceeds from the sales of equity investments and other assets, and sales of
and collections on notes receivable 1,542 1,966 516
Proceeds from the sales of commercial and multi-family real estate 606 314 169
Other (309) (162) (69)
Net cash used in investing activities (764) (668) (6,954)
Cash Flows from Financing Activities
Proceeds from the:
Issuance of long-term debt 153 3,009 5,114
Issuance of common stock and common stock related to employee benefit plans 1,704 277 1,323
Payments for the redemption of:
Long-term debt (3,646) (2,849) (1,837)
Preferred stock of a subsidiary (176) (38) —
Preferred and preference stock — — (88)
Guaranteed preferred beneficial interests in subordinated notes — (250) —
Notes payable and commercial paper (67) (1,702) (1,067)
Distributions to minority interests (1,477) (2,508) (2,260)
Contributions from minority interests 1,277 2,432 2,535
Dividends paid (1,065) (1,051) (938)
Other 19 23 64
Net cash (used in) provided by financing activities (3,278) (2,657) 2,846
Changes in cash and cash equivalents associated with assets held for sale 39 (55) —
Net increase in cash and cash equivalents 136 16 91
Cash and cash equivalents at beginning of year 397 381 290
Cash and cash equivalents at end of year $ 533 $ 397 $ 381
Supplemental Disclosures
Cash paid for interest, net of amount capitalized $ 1,323 $ 1,324 $ 1,011
Cash (refunded) paid for income taxes $ (339) $ (18) $ 344
Significant non-cash transactions:
Debt retired in connection with disposition of businesses $ 840 $ 387 $ —
Note receivable from sale of southeast plants $ 48 $ — $ —
Remarketing of senior notes $ 1,625 $ — $ —
Acquisition of Westcoast Energy Inc.
Fair value of assets acquired $ — $ — $ 9,254
Liabilities assumed, including debt and minority interests — — 8,047
Issuance of common stock — — 1,702
Capital lease obligations related to property, plant and equipment $ — $ — $ 117
18
21. C O N S O L I D AT E D S TAT E M E N T S O F C O M M O N S T O C K H O L D E R S ' E Q U I T Y
AND COMPREHENSIVE INCOME (LOSS)
Accumulated Other Comprehensive Income (Loss)
Net Gains Minimum
Common Foreign (Losses) on Pension
Stock Common Retained Currency Cash Flow Liability
(In millions) Shares Stock Earnings Adjustments Hedges Adjustment Total
Balance December 31, 2001 777 $ 6,217 $ 6,292 $ (307) $ 487 $ — $12,689
Net income 1,034 1,034
Other Comprehensive Income
Foreign currency translation adjustments (340) (340)
Net unrealized gains on cash flow hedgesb 37 37
Reclassification into earnings from cash flow hedgesc (102) (102)
Minimum pension liability adjustmentd (484) (484)
Total comprehensive income 145
Dividend reinvestment and employee benefits 13 342 342
Equity offering 55 975 975
Westcoast acquisition 50 1,702 1,702
Common stock dividends (905) (905)
Preferred and preference stock dividends (13) (13)
Other capital stock transactions, net 9 9
Balance December 31, 2002 895 $ 9,236 $ 6,417 $ (647) $ 422 $ (484) $14,944
Net loss (1,323) (1,323)
Other Comprehensive Loss
Foreign currency translation adjustmentsa 986 986
Foreign currency translation adjustments reclassified
into earnings as a result of the sale of European operations (24) (24)
Net unrealized gains on cash flow hedgesb 116 116
Reclassification into earnings from cash flow hedgesc (240) (240)
Minimum pension liability adjustmentd 40 40
Total comprehensive loss (445)
Dividend reinvestment and employee benefits 16 283 (6) 277
Common stock dividends (993) (993)
Preferred and preference stock dividends (15) (15)
Other capital stock transactions, net (20) (20)
Balance December 31, 2003 911 $ 9,519 $ 4,060 $ 315 $ 298 $ (444) $13,748
Net income 1,490 1,490
Other Comprehensive Income
Foreign currency translation adjustments 279 279
Foreign currency translation adjustments reclassified
into earnings as a result of the sale of Asia-Pacific Business (54) (54)
Net unrealized gains on cash flow hedgesb 311 311
Reclassification into earnings from cash flow hedgesc (83) (83)
Minimum pension liability adjustmentd 28 28
Total comprehensive income 1,971
Dividend reinvestment and employee benefits 5 108 20 128
Equity offering 41 1,625 1,625
Common stock dividends (1,018) (1,018)
Preferred and preference stock dividends (9) (9)
Other capital stock transactions, net (4) (4)
Balance December 31, 2004 957 $11,252 $ 4,539 $ 540 $ 526 $ (416) $16,441
a Foreign currency translation adjustments, net of $114 tax benefit in 2003
b Net unrealized gains on cash flow hedges, net of $170 tax expense in 2004, $49 tax expense in 2003 and $72 tax expense in 2002
c Reclassification into earnings from cash flow hedges, net of $45 tax benefit in 2004, $130 tax benefit in 2003 and $94 tax benefit in 2002
d Minimum pension liability adjustment, net of $18 tax expense in 2004, $27 tax expense in 2003 and $309 tax benefit in 2002
19
22. NON-GAAP FINANCIAL MEASURES
––––––––––––––––––
Pages 1 and 4 of the Chairman’s letter reference a 2004 ongoing basic earnings-per-share goal of $1.20, which we beat by
18 cents. Page 4 of the Chairman’s letter also references the 2005 ongoing basic earnings-per-share target of $1.60. Ongoing
basic earnings per share is a non-GAAP (generally accepted accounting principles) financial measure because it excludes the
per-share effects of any “special items,” which represent certain income or charges which management believes will not be
recurring on a regular basis. The most directly comparable GAAP measure is basic earnings per share.
Information to reconcile the 2005 ongoing basic earnings-per-share target to the most directly comparable GAAP financial measure
is not available at this time, as management is unable to project special items for 2005. The following is a reconciliation of ongoing
to reported basic earnings per share for 2004:
Ongoing Basic Earnings per Share – 2004
(In millions, except earnings per share)
Pre-tax Tax Basic EPS
Amount Effect Impact
Ongoing Basic Earnings per Share $ 1.38
Net gain on sale of discontinued operations (net of minority interest of $7 million) $ 278 $ (16) 0.28
Net loss on asset sales, primarily sale of southeast U.S. plants
(including minority interest benefit of $25 million) (206) 72 (0.14)
Impairments and other related charges (net of minority interest of $12 million) (25) 9 (0.02)
Litigation reserves and settlements (net of minority interest of $5 million) and
contract termination charges (5) 2 0.00
Tax benefit from restructuring – 48 0.05
Adjustment to captive insurance reserve 64 (22) 0.04
Net loss on sales of equity investments (including minority interest benefit of $7 million)
and loss on asset exchanges (8) 3 0.00
Total basic earnings-per-share impact of special items 0.21
Basic Earnings per Share, as Reported $ 1.59
––––––––––––––––––
Page 1 of the Chairman’s letter references a debt reduction of $4.6 billion. This amount represents a non-GAAP measure
because it includes changes in amounts presented in the Consolidated Balance Sheets as other than “debt,” including amounts
classified as “liabilities associated with assets held for sale” and “minority interests.” The following is a reconciliation of the
$4.6 billion to the changes in the amounts reported in the Consolidated Balance Sheets as “debt”:
Reconciliation of Debt Paydown to Consolidated Balance Sheets – 2004
(In millions)
12/31/03 12/31/04 Difference
Long-term debt $20,622 $16,932 $ (3,690)
Current maturities of long-term debt and preferred stock 1,200 1,832 632
Notes payable and commercial paper 130 68 (62)
Total Debt 21,952 18,832 (3,120)
Changes due to foreign currency (300)
Other cash changes (89)
Sub-total (389)
Redeem Australia debt (890)
Redeem Westcoast Energy, Inc. preferred securities (176)
Total Change $(4,575)
Total debt paydown disclosed $ (4,600)
20