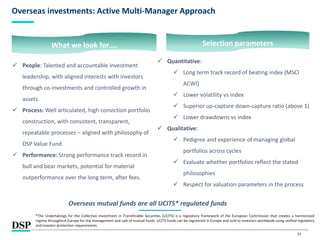
The document provides an overview of the DSP Value Fund including its investment philosophy, performance, portfolio characteristics, and current portfolio details. Some key points:
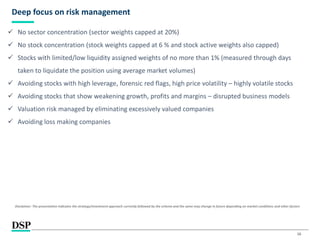
- The fund aims to generate steady long-term returns with lower volatility than the benchmark through a conservative approach focusing on quality companies at reasonable valuations.
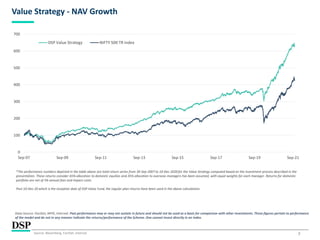
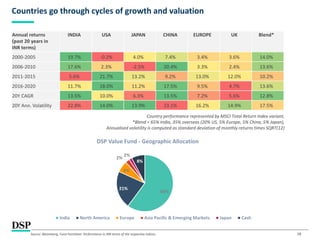
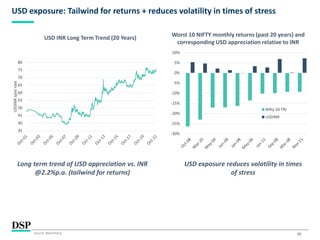
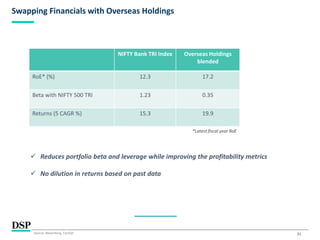
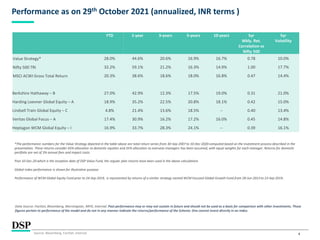
- Over longer time periods the fund has outperformed several benchmarks with lower volatility and drawdowns.
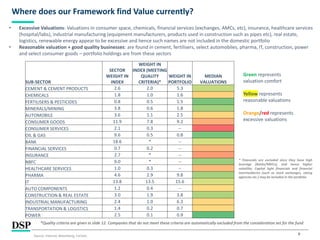
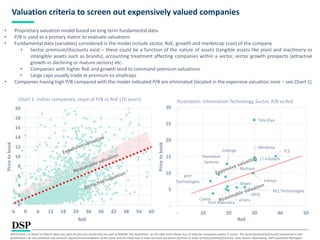
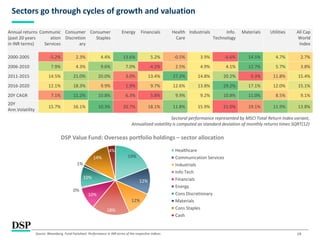
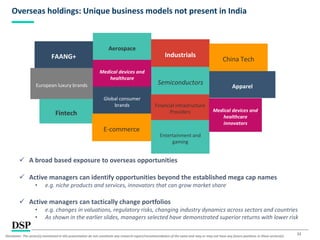
- The current portfolio emphasizes sectors like IT, materials, industrials, and healthcare that are seen as reasonably valued. It underweights sectors like consumer goods and financials seen as overvalued.
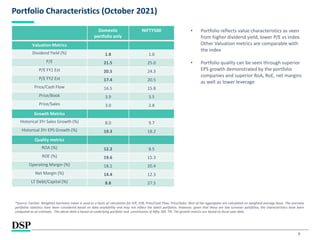
- Portfolio characteristics include higher dividend yield and quality metrics than the benchmark alongside lower valuations.
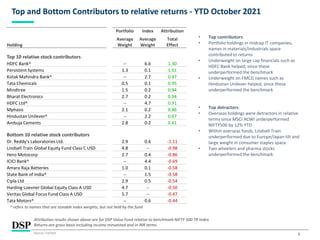
- Top holdings
![[Title to come]
[Sub-Title to come]
Strictly for Intended Recipients Only
Date
* DSP India Fund is the Company incorporated in Mauritius, under which ILSF is the corresponding share class
DSP Value Fund
November 2021](https://image.slidesharecdn.com/dspvaluefundpresentation-211228053642/85/DSP-Value-Fund-1-320.jpg)
![[Title to come]
[Sub-Title to come]
Strictly for Intended Recipients Only
Date
* DSP India Fund is the Company incorporated in Mauritius, under which ILSF is the corresponding share class
DSP Value Fund
November 2021](https://image.slidesharecdn.com/dspvaluefundpresentation-211228053642/75/DSP-Value-Fund-1-2048.jpg)
![5
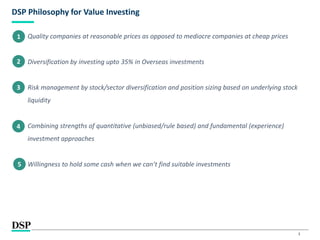
3-year Rolling Return Range (annualized, INR term )
Source: Bloomberg, FactSet, Internal
Data Source: FactSet, MFIE, Internal. Past performance may or may not sustain in future and should not be used as a basis for comparison with other investments. These figures pertain to performance
of the model and do not in any manner indicate the returns/performance of the Scheme. One cannot invest directly in an index.
*The performance numbers depicted in the table above are total return series for the Value Strategy computed based on the investment process described in the presentation. These returns consider 65%
allocation to domestic equities and.35% allocation to overseas managers has been assumed, with equal weights for each manager. Returns for domestic portfolio are net of 3% annual fees and impact costs.
Post 10-Dec-20 which is the inception date of DSP Value Fund, the regular plan returns have been used in the above calculations
Performance has been depicted for the period where comparable returns data for all above overseas holdings was available. The first data point refers to 3 year annualized returns from 30-Jun-2014 to 30-
Jun-2017
Global index performance is shown for illustrative purpose
Performance of WCM Global Equity Fund prior to 24-Sep-2019, is represented by returns of a similar strategy named WCM Focused Global Growth Fund from 28-Jun-2013 to 23-Sep-2019.
[Period: 30-Jun-2017 to 29-Oct-2021]
0.1%
-6.3%
2.6%
3.6%
6.0%
9.2%
5.4%
8.2%
22.3%
23.9%
19.8%
24.4%
23.6%
24.1%
20.0%
30.4%
-10% -5% 0% 5% 10% 15% 20% 25% 30% 35% 40%
Value Strategy
Nifty 500 TRI
MSCI ACWI TR Gross
Berkshire Hathaway – B
Harding Loevner Global Equity – A
Lindsell Train Global Equity – C
Veritas Global Focus – A
WCM Global Equity – I](https://image.slidesharecdn.com/dspvaluefundpresentation-211228053642/85/DSP-Value-Fund-5-320.jpg)