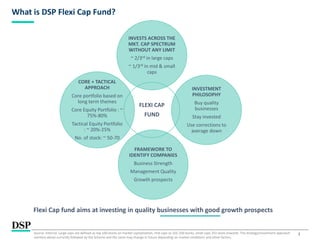
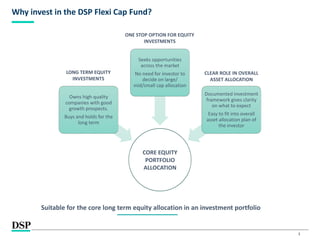
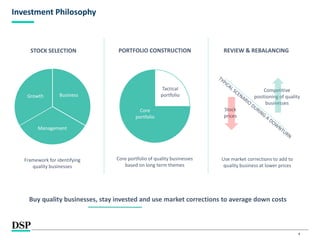
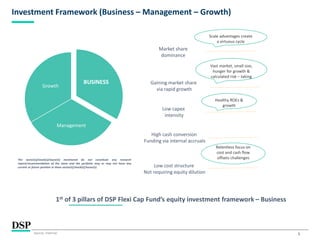
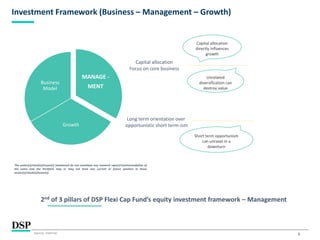
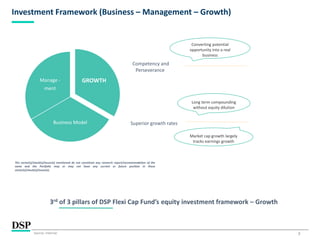
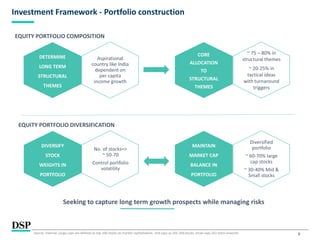
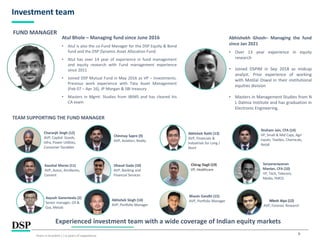
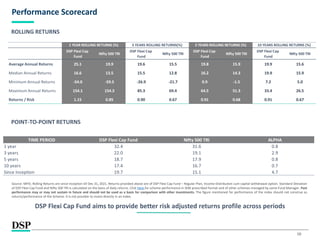
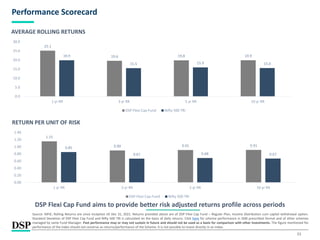
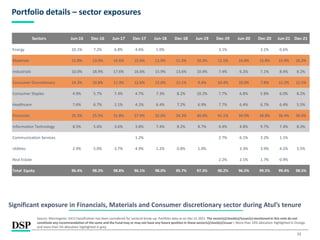
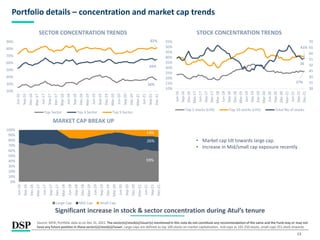
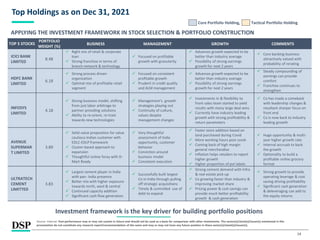
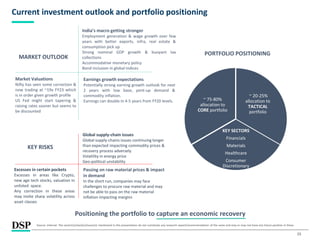
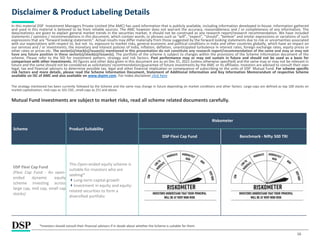
Dividend Policy and Dividend Decision Theories.pptx
DSP Flexi Fund Presentation Dec 2021.pdf
1. [Title to come]
[Sub-Title to come]
Strictly for Intended Recipients Only
Date
* DSP India Fund is the Company incorporated in Mauritius, under which ILSF is the corresponding share class
Dec 2021
| People | Processes | Performance |
DSP Flexi Cap Fund (erstwhile DSP Equity Fund)
#INVESTFORGOOD
2. 2
What is DSP Flexi Cap Fund?
FLEXI CAP
FUND
INVESTS ACROSS THE
MKT. CAP SPECTRUM
WITHOUT ANY LIMIT
~ 2/3rd in large caps
~ 1/3rd in mid & small
caps
INVESTMENT
PHILOSOPHY
Buy quality
businesses
Stay invested
Use corrections to
average down
FRAMEWORK TO
IDENTIFY COMPANIES
Business Strength
Management Quality
Growth prospects
CORE + TACTICAL
APPROACH
Core portfolio based on
long term themes
Core Equity Portfolio : ~
75%-80%
Tactical Equity Portfolio
: ~ 20%-25%
No. of stock: ~ 50-70
Flexi Cap fund aims at investing in quality businesses with good growth prospects
Source: Internal. Large-caps are defined as top 100 stocks on market capitalization, mid-caps as 101-250 stocks, small-caps 251 stock onwards. The strategy/investment approach
mention above currently followed by the Scheme and the same may change in future depending on market conditions and other factors.
3. 3
Why invest in the DSP Flexi Cap Fund?
CORE EQUITY
PORTFOLIO
ALLOCATION
Owns high quality
companies with good
growth prospects.
Buys and holds for the
long term
Seeks opportunities
across the market
No need for investor to
decide on large/
mid/small cap allocation
Documented investment
framework gives clarity
on what to expect
Easy to fit into overall
asset allocation plan of
the investor
LONG TERM EQUITY
INVESTMENTS
ONE STOP OPTION FOR EQUITY
INVESTMENTS
CLEAR ROLE IN OVERALL
ASSET ALLOCATION
Suitable for the core long term equity allocation in an investment portfolio
4. 4
Investment Philosophy
Business
Management
Growth
STOCK SELECTION
Framework for identifying
quality businesses
PORTFOLIO CONSTRUCTION
Core
portfolio
Tactical
portfolio
Core portfolio of quality businesses
based on long term themes
REVIEW & REBALANCING
Stock
prices
Competitive
positioning of quality
businesses
Use market corrections to add to
quality business at lower prices
Buy quality businesses, stay invested and use market corrections to average down costs
5. 5
Investment Framework (Business – Management – Growth)
Market share
dominance
Gaining market share
via rapid growth
Low capex
intensity
High cash conversion
Funding via internal accruals
Low cost structure
Not requiring equity dilution
1st of 3 pillars of DSP Flexi Cap Fund’s equity investment framework – Business
BUSINESS
Management
Growth
The sector(s)/stock(s)/issuer(s) mentioned do not constitute any research
report/recommendation of the same and the portfolio may or may not have any
current or future position in these sector(s)/stock(s)/issuer(s).
Scale advantages create
a virtuous cycle
Vast market, small size,
hunger for growth &
calculated risk – taking
Healthy ROEs &
growth
Relentless focus on
cost and cash flow
offsets challenges
Source: Internal.
6. 6
Investment Framework (Business – Management – Growth)
Long term orientation over
opportunistic short term-ism
2nd of 3 pillars of DSP Flexi Cap Fund’s equity investment framework – Management
Capital allocation
Focus on core business
MANAGE -
MENT
Growth
Business
Model
The sector(s)/stock(s)/issuer(s) mentioned do not constitute any research report/recommendation of
the same and the Portfolio may or may not have any current or future position in these
sector(s)/stock(s)/issuer(s).
Capital allocation
directly influences
growth
Unrelated
diversification can
destroy value
Short term opportunism
can unravel in a
downturn
Source: Internal.
7. 7
Investment Framework (Business – Management – Growth)
Superior growth rates
3rd of 3 pillars of DSP Flexi Cap Fund’s equity investment framework – Growth
Competency and
Perseverance
GROWTH
Business Model
Manage -
ment
The sector(s)/stock(s)/issuer(s) mentioned do not constitute any research report/recommendation of the
same and the Portfolio may or may not have any current or future position in these
sector(s)/stock(s)/issuer(s).
Converting potential
opportunity into a real
business
Long term compounding
without equity dilution
Market cap growth largely
tracks earnings growth
Source: Internal.
8. 8
Investment Framework - Portfolio construction
DETERMINE
LONG TERM
STRUCTURAL
THEMES
Aspirational
country like India
dependent on
per capita
income growth
DIVERSIFY
STOCK
WEIGHTS IN
PORTFOLIO
No. of stocks=>
~ 50-70
Control portfolio
volatility
MAINTAIN
MARKET CAP
BALANCE IN
PORTFOLIO
Diversified
portfolio
~ 60-70% large
cap stocks
~ 30-40% Mid &
Small stocks
CORE
ALLOCATION
TO
STRUCTURAL
THEMES
~ 75 – 80% in
structural themes
~ 20-25% in
tactical ideas
with turnaround
triggers
Seeking to capture long term growth prospects while managing risks
EQUITY PORTFOLIO COMPOSITION
EQUITY PORTFOLIO DIVERSIFICATION
Source: Internal. Large-caps are defined as top 100 stocks on market capitalization, mid-caps as 101-250 stocks, small-caps 251 stock onwards.
9. 9
Investment team
Atul Bhole – Managing fund since June 2016
• Atul is also the co-Fund Manager for the DSP Equity & Bond
fund and the DSP Dynamic Asset Allocation Fund.
• Atul has over 14 year of experience in fund management
and equity research with Fund management experience
since 2011
• Joined DSP Mutual Fund in May 2016 as VP – Investments.
Previous work experience with Tata Asset Management
(Feb 07 – Apr 16), JP Morgan & SBI treasury
• Masters in Mgmt. Studies from JBIMS and has cleared his
CA exam
Experienced investment team with a wide coverage of Indian equity markets
FUND MANAGER
Years in brackets ( ) is years of experience.
TEAM SUPPORTING THE FUND MANAGER
Charanjit Singh (12)
AVP, Capital Goods,
Infra, Power Utilities,
Consumer Durables
Abhishekh Ghosh– Managing the fund
since Jan 2021
• Over 13 year experience in equity
research
• Joined DSPIM in Sep 2018 as midcap
analyst. Prior experience of working
with Motilal Oswal in their institutional
equities division
• Masters in Management Studies from N
L Dalmia Institute and has graduation in
Electronic Engineering.
Chinmay Sapre (9)
AVP, Aviation, Realty
Kaushal Maroo (11)
AVP, Autos, Ancillaries,
Cement
Dhaval Gada (10)
AVP, Banking and
Financial Services
Abhishek Rathi (13)
AVP, Financials &
Industrials for Long /
Short
Aayush Ganeriwala (2)
Senior manager, Oil &
Gas, Metals
Suryanarayanan
Manian, CFA (10)
VP, Tech, Telecom,
Media, FMCG
Nilesh Aiya (12)
AVP, Forensic Research
Resham Jain, CFA (14)
VP, Small & Mid Caps, Agri
inputs, Textiles, Chemicals,
Retail
Chirag Dagli (19)
VP, Healthcare
Abhishek Singh (14)
AVP, Portfolio Manager
Bhavin Gandhi (15)
AVP, Portfolio Manager
10. 10
Performance Scorecard
Source: MFIE; Rolling Returns are since inception till Dec 31, 2021. Returns provided above are of DSP Flexi Cap Fund – Regular Plan, Income Distribution cum capital withdrawal option. Standard Deviation
of DSP Flexi Cap Fund and Nifty 500 TRI is calculated on the basis of daily returns. Click here for scheme performance in SEBI prescribed format and of other schemes managed by same Fund Manager. Past
performance may or may not sustain in future and should not be used as a basis for comparison with other investments. The figure mentioned for performance of the index should not construe as
returns/performance of the Scheme. It is not possible to invest directly in an index.
DSP Flexi Cap Fund aims to provide better risk adjusted returns profile across periods
ROLLING RETURNS
POINT-TO-POINT RETURNS
TIME PERIOD DSP Flexi Cap Fund Nifty 500 TRI ALPHA
1 year 32.4 31.6 0.8
3 years 22.0 19.1 2.9
5 years 18.7 17.9 0.8
10 years 17.4 16.7 0.7
Since Inception 19.7 15.1 4.7
DSP Flexi Cap
Fund
Nifty 500 TRI
DSP Flexi Cap
Fund
Nifty 500 TRI
DSP Flexi Cap
Fund
Nifty 500 TRI
DSP Flexi Cap
Fund
Nifty 500 TRI
Average Annual Returns 25.1 19.9 19.6 15.5 19.8 15.9 19.9 15.6
Median Annual Returns 16.6 13.5 15.5 12.8 16.2 14.3 19.9 15.9
Minimum Annual Returns -54.0 -59.5 -26.9 -21.7 0.9 -1.5 7.2 5.0
Maximum Annual Returns 154.1 154.3 85.3 69.4 64.5 51.3 33.4 26.5
Returns / Risk 1.15 0.85 0.90 0.67 0.91 0.68 0.91 0.67
1 YEAR ROLLING RETURNS (%) 3 YEARS ROLLING RETURNS(%) 5 YEARS ROLLING RETURNS (%) 10 YEARS ROLLING RETURNS (%)
11. 11
Performance Scorecard
Source: MFIE; Rolling Returns are since inception till Dec 31, 2021. Returns provided above are of DSP Flexi Cap Fund – Regular Plan, Income Distribution cum capital withdrawal option.
Standard Deviation of DSP Flexi Cap Fund and Nifty 500 TRI is calculated on the basis of daily returns. Click here for scheme performance in SEBI prescribed format and of other schemes
managed by same Fund Manager. Past performance may or may not sustain in future and should not be used as a basis for comparison with other investments. The figure mentioned for
performance of the index should not construe as returns/performance of the Scheme. It is not possible to invest directly in an index.
DSP Flexi Cap Fund aims to provide better risk adjusted returns profile across periods
AVERAGE ROLLING RETURNS
RETURN PER UNIT OF RISK
25.1
19.6 19.8 19.9
19.9
15.5 15.9 15.6
0.0
5.0
10.0
15.0
20.0
25.0
30.0
1 yr RR 3 yr RR 5 yr RR 10 yr RR
DSP Flexi Cap Fund Nifty 500 TRI
1.15
0.90 0.91 0.91
0.85
0.67 0.68 0.67
0.00
0.20
0.40
0.60
0.80
1.00
1.20
1.40
1 yr RR 3 yr RR 5 yr RR 10 yr RR
DSP Flexi Cap Fund Nifty 500 TRI
12. 12
Portfolio details – sector exposures
Significant exposure in Financials, Materials and Consumer discretionary sector during Atul’s tenure
Source: Morningstar; GICS Classification has been considered for sectoral break-up. Portfolio data as on Dec 31 2021. The sector(s)/stock(s)/issuer(s) mentioned in this note do not
constitute any recommendation of the same and the Fund may or may not have any future position in these sector(s)/stock(s)/issuer | More than 10% allocation highlighted in Orange
and more than 5% allocation highlighted in grey
Sectors Jun-16 Dec-16 Jun-17 Dec-17 Jun-18 Dec-18 Jun-19 Dec-19 Jun-20 Dec-20 Jun-21 Dec-21
Energy 10.1% 7.2% 6.8% 4.6% 1.0% 3.1% 3.1% 0.6%
Materials 12.8% 13.0% 14.6% 15.6% 11.9% 11.3% 10.3% 11.5% 16.8% 15.8% 15.9% 16.3%
Industrials 10.0% 18.9% 17.6% 16.6% 15.9% 13.6% 10.4% 7.4% 6.2% 7.1% 8.4% 8.2%
Consumer Discretionary 14.3% 10.8% 11.3% 12.6% 15.0% 12.1% 9.4% 10.4% 10.0% 7.8% 12.2% 12.5%
Consumer Staples 4.9% 5.7% 7.4% 4.7% 7.3% 8.2% 10.2% 7.7% 6.8% 5.8% 6.0% 8.2%
Healthcare 7.6% 6.7% 2.1% 4.1% 6.4% 7.2% 6.9% 7.7% 6.4% 6.7% 6.4% 5.5%
Financials 25.3% 25.5% 31.8% 27.9% 32.0% 34.3% 40.4% 41.1% 34.0% 34.8% 36.4% 36.0%
Information Technology 8.5% 5.6% 3.6% 3.8% 7.4% 8.2% 8.7% 4.4% 4.8% 9.7% 7.4% 8.3%
Communication Services 1.2% 2.7% 6.1% 3.2% 1.1%
Utilities 2.9% 5.0% 3.7% 4.9% 1.2% 0.8% 1.0% 3.3% 3.9% 4.2% 3.5%
Real Estate 2.2% 2.1% 1.7% 0.9%
Total Equity 96.4% 98.3% 98.8% 96.1% 98.0% 95.7% 97.3% 98.2% 96.5% 99.5% 99.4% 98.5%
13. 0%
10%
20%
30%
40%
50%
60%
70%
80%
90%
100%
Jun-16
Sep-16
Dec-16
Mar-17
Jun-17
Sep-17
Dec-17
Mar-18
Jun-18
Sep-18
Dec-18
Mar-19
Jun-19
Sep-19
Dec-19
Mar-20
Jun-20
Sep-20
Dec-20
Mar-21
Jun-21
Sep-21
Dec-21
MARKET CAP BREAK UP
Large Cap Mid Cap Small Cap
13
Portfolio details – concentration and market cap trends
Significant increase in stock & sector concentration during Atul’s tenure
• Market cap tilt towards large cap.
• Increase in Mid/small cap exposure recently
59%
26%
14%
Source: MFIE; Portfolio data as on Dec 31, 2021. The sector(s)/stock(s)/issuer(s) mentioned in this note do not constitute any recommendation of the same and the Fund may or may not
have any future position in these sector(s)/stock(s)/issuer. Large-caps are defined as top 100 stocks on market capitalization, mid-caps as 101-250 stocks, small-caps 251 stock onwards.
36%
65%
81%
20%
30%
40%
50%
60%
70%
80%
90%
Jun-16
Sep-16
Dec-16
Mar-17
Jun-17
Sep-17
Dec-17
Mar-18
Jun-18
Sep-18
Dec-18
Mar-19
Jun-19
Sep-19
Dec-19
Mar-20
Jun-20
Sep-20
Dec-20
Mar-21
Jun-21
Sep-21
Dec-21
SECTOR CONCENTRATION TRENDS
Top Sector Top 3 Sector Top 5 Sector
27%
41%
56
30
35
40
45
50
55
60
65
70
10%
15%
20%
25%
30%
35%
40%
45%
50%
55%
Jun-16
Sep-16
Dec-16
Mar-17
Jun-17
Sep-17
Dec-17
Mar-18
Jun-18
Sep-18
Dec-18
Mar-19
Jun-19
Sep-19
Dec-19
Mar-20
Jun-20
Sep-20
Dec-20
Mar-21
Jun-21
Sep-21
Dec-21
STOCK CONCENTRATION TRENDS
Top 5 stocks (LHS) Top 10 stocks (LHS) Total No of stocks
14. 14
Top Holdings as on Dec 31, 2021
Source: Internal. Past performance may or may not sustain in future and should not be used as a basis for comparison with other investments. The sector(s)/stock(s)/issuer(s) mentioned in this
presentation do not constitute any research report/recommendation of the same and may or may not have any future position in these sector(s)/stock(s)/issuer(s).
APPLYING THE INVESTMENT FRAMEWORK IN STOCK SELECTION & PORTFOLIO CONSTRUCTION
Investment framework is the key driver for building portfolio positions
Core Portfolio Holding, Tactical Portfolio Holding
TOP 5 STOCKS
PORTFOLIO
WEIGHT (%)
BUSINESS MANAGEMENT GROWTH COMMENTS
ICICI BANK
LIMITED
8.48
✓ Right mix of retail & corporate
loan
✓ Strong franchise in terms of
branch network & technology
✓ Focused on profitable
growth with granularity
✓ Advances growth expected to be
better than industry average
✓ Possibility of strong earnings
growth for next 2 years
✓ Core banking business
attractively valued with
probability of rerating
HDFC BANK
LIMITED
6.18
✓ Strong process driven
organization
✓ Optimal mix of profitable retail
segment
✓ Focused on consistent
profitable growth
✓ Prudent in credit quality
and ALM management
✓ Advances growth expected to be
better than industry average
✓ Possibility of strong earnings
growth for next 2 years
✓ Steady compounding of
earnings can provide
comfort
✓ Franchise continues to
strengthen
INFOSYS
LIMITED
4.18
✓ Strong business model, shifting
from just labor arbitrage to
partner providing solutions
✓ Ability to re-orient, re-train
towards new technologies
✓ Management’s growth
strategies playing out
✓ Continuity of culture,
values despite
management changes
✓ Investments in & flexibility to
front sales team started to yield
results with many large deal wins
✓ Currently have industry leading
growth with strong profitability &
return parameters
✓ Co has made a comeback
with leadership changes &
resultant sharper focus on
front end
✓ Co is now back to industry
leading growth
AVENUE
SUPERMAR
T LIMITED
3.89
✓ Solid value proposition for value
cautious Indian customer with
EDLC-EDLP framework
✓ Cluster-based approach to
expansion
✓ Thoughtful online foray with D-
Mart Ready
✓ Very thoughtful
assessment of India
opportunity, customer
behavior
✓ Conviction around
business model
✓ Consistent execution
✓ Faster store addition based on
land purchased during Covid
✓ More working hours post covid
✓ Coming back of high margin
general merchandise
✓ Inflation helps retailers to report
higher growth
✓ Higher proportion of pvt labels
✓ Huge opportunity & multi-
year higher growth rate
✓ Internal accruals to back
the growth
✓ Optionality to build a
profitable online grocery
format
ULTRATECH
CEMENT
LIMITTED
3.83
✓ Largest cement player in India
with pan- India presence
✓ Better mix with higher exposure
towards north, west & central
✓ Continued capacity addition
✓ Significant cash flow generation
✓ Successfully built largest
Co in India through pulling
off strategic acquisitions
✓ Timely & controlled use of
debt to expand
✓ Strong cement demand with Infra
& real estate pick-up
✓ Co growing faster than industry &
improving market share
✓ Pricing power & cost savings can
provide much better profitability
growth & cash generation
✓ Strong growth to provide
operating leverage & cost
saving driving profitability
✓ Significant cash generation
& deleveraging can add to
the equity returns
15. 15
Current investment outlook and portfolio positioning
MARKET OUTLOOK
Market Valuations
Nifty has seen some correction &
now trading at ~19x FY23 which
is in order given growth profile
US Fed might start tapering &
raising rates sooner but seems to
be discounted
Earnings growth expectations
Potentially strong earning growth outlook for next
2 years with low base, pent-up demand &
commodity inflation.
Earnings can double in 4-5 years from FY20 levels.
~ 20-25%
allocation to
TACTICAL
portfolio
KEY SECTORS
Financials
Materials
Healthcare
Consumer
Discretionary
~ 75-80%
allocation to
CORE portfolio
KEY RISKS
Global supply-chain issues
Global supply-chains issues continuing longer
than expected impacting commodity prices &
recovery process adversely
Volatility in energy price
Geo-political unstability
Passing on raw material prices & impact
in demand
In the short run, companies may face
challenges to procure raw material and may
not be able to pass on the raw material
inflation impacting margins
PORTFOLIO POSITIONING
Positioning the portfolio to capture an economic recovery
Source: Internal. The sector(s)/stock(s)/issuer(s) mentioned in this presentation do not constitute any research report/recommendation of the same and may or may not have any future position in these
Excesses in certain pockets
Excesses in areas like Crypto,
new age tech stocks, valuation in
unlisted space.
Any correction in these areas
may invite sharp volatility across
asset classes
India’s macro getting stronger
Employment generation & wage growth over few
years with better exports, infra, real estate &
consumption pick up
Strong nominal GDP growth & buoyant tax
collections
Accommodative monetary policy
Bond inclusion in global indices
16. Scheme Product Suitability
Riskometer
DSP Flexi Cap Fund Benchmark - Nifty 500 TRI
DSP Flexi Cap Fund
(Flexi Cap Fund - An open-
ended dynamic equity
scheme investing across
large cap, mid cap, small cap
stocks)
This Open-ended equity scheme is
suitable for investors who are
seeking*
Long-term capital growth
Investment in equity and equity-
related securities to form a
diversified portfolio
16
Disclaimer & Product Labeling Details
In this material DSP Investment Managers Private Limited (the AMC) has used information that is publicly available, including information developed in-house. Information gathered
and used in this material is believed to be from reliable sources. The AMC however does not warrant the accuracy, reasonableness and / or completeness of any information. The
data/statistics are given to explain general market trends in the securities market, it should not be construed as any research report/research recommendation. We have included
statements / opinions / recommendations in this document, which contain words, or phrases such as “will”, “expect”, “should”, “believe” and similar expressions or variations of such
expressions that are “forward looking statements”. Actual results may differ materially from those suggested by the forward looking statements due to risk or uncertainties associated
with our expectations with respect to, but not to, exposure to market risks, general economic and political conditions in India and other countries globally, which have an impact on
our services and / or investments, the monetary and interest policies of India, inflation, deflation, unanticipated turbulence in interest rates, foreign exchange rates, equity prices or
other rates or prices etc. The sector(s)/stock(s)/issuer(s) mentioned in this presentation do not constitute any research report/recommendation of the same and may or may not
have any future position in these sector(s)/stock(s)/issuer(s). The portfolio of the scheme is subject to changes within the provisions of the Scheme Information document of the
scheme. Please refer to the SID for investment pattern, strategy and risk factors. Past performance may or may not sustain in future and should not be used as a basis for
comparison with other investments. All figures and other data given in this document are as on Dec 31, 2021 (unless otherwise specified) and the same may or may not be relevant in
future and the same should not be considered as solicitation/ recommendation/guarantee of future investments by the AMC or its affiliates. Investors are advised to consult their own
legal, tax and financial advisors to determine possible tax, legal and other financial implication or consequence of subscribing to the units of DSP Mutual Fund. For scheme specific
risk factors and more details, please read the Scheme Information Document, Statement of Additional Information and Key Information Memorandum of respective Scheme
available on ISC of AMC and also available on www.dspim.com. For Index disclaimer click here
The strategy mentioned has been currently followed by the Scheme and the same may change in future depending on market conditions and other factors. Large-caps are defined as top 100 stocks on
market capitalization, mid-caps as 101-250 , small-caps as 251 and above.
Mutual Fund investments are subject to market risks, read all scheme related documents carefully.
*Investors should consult their financial advisors if in doubt about whether the Scheme is suitable for them.