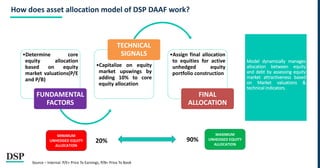
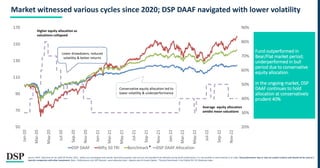
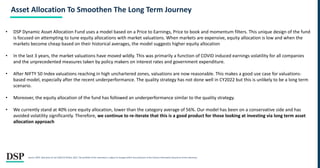
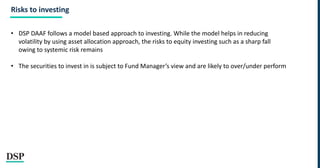
DSP Dynamic Asset Allocation Fund (DAAF)
An open- ended dynamic asset allocation fund
FUND FLASH
How does asset allocation model of DSP DAAF work?
•Determine core
equity allocation
based on equity
market valuations(P/E
and P/B)
FUNDAMENTAL
FACTORS
•Capitalize on equity
market upswings by
adding 10% to core
equity allocation
TECHNICAL
SIGNALS •Assign final allocation
to equities for active
unhedged equity
portfolio construction
FINAL
ALLOCATION
MINIMUM
UNHEDGED EQUITY
ALLOCATION
MAXIMUM
UNHEDGED EQUITY
ALLOCATION
20% 90%
Model dynamically manages
allocation between equity
and debt by assessing equity
market attractiveness based
on Market valuations &
technical indicators.
Source – Internal. P/E= Price To Earnings, P/B= Price To Book
Market witnessed various cycles since 2020; DSP DAAF navigated with lower volatility
Fund outperformed in
Bear/Flat market period;
underperformed in bull
period due to conservative
equity allocation.
In the ongoing market, DSP
DAAF continues to hold
allocation at conservatively
prudent 40%
Source: MFIE. Data from 01 Jan 2020 till 30 Nov, 2022,. Indices are unmanaged and used for illustrative purposes only and are not intended to be indicative of any fund’s performance. It is not possible to invest directly in an index. Past performance may or may not sustain in future and should not be used as a
basis for comparison with other investments. Note – Performance is for DSP Dynamic asset allocation fund – Regular plan & Growth Option, *Scheme Benchmark= Crisil Hybrid 50+ 50- Moderate Index
20%
30%
40%
50%
60%
70%
80%
90%
50
70
90
110
130
150
170
Jan-20
Mar-20
May-20
Jul-20
Sep-20
Nov-20
Jan-21
Mar-21
May-21
Jul-21
Sep-21
Nov-21
Jan-22
Mar-22
May-22
Jul-22
Sep-22
Nov-22
DSP DAAF Nifty 50 TRI Benchmark DSP DAAF Allocation
Higher equity allocation as
valuations collapsed
Average equity allocation
amidst mean valuations
Lower drawdowns, reduced
volatility & better returns
Conservative equity allocation led to
lower volatility & underperformance
*
The Drag In The Performance Is Attributed To Quality Underperforming
Source: MFIE. Data from 01 Jan 2020 till 30 Nov, 2022. The portfolio of the scheme(s) is subject to changes within the provisions of the Scheme Information document of the scheme(s) . The sector(s)/stock(s)/issuer(s) mentioned in this document do not constitute any recommendation of the same and the Fund
may or may not have any future position in these sector(s)/stock(s)/issuer(s).
Sector
Average
Weight
Total Return
Contribution To
Return
Industrials 6.19 29.20 1.80
Financials 37.62 2.45 1.44
Consumer Discretionary 11.62 4.93 0.43
Materials 15.63 5.69 0.26
Energy -0.01 18.96 0.00
Communication Services -0.01 2.96 0.00
Real Estate -0.00 10.82 -0.00
Health Care 5.17 -8.90 -0.60
Information Technology 11.53 -5.63 -0.63
Consumer Staples 9.04 -11.84 -1.01
Utilities 3.22 -22.89 -1.23
“Generally quality & growing
businesses provide better & consistent
returns for longer periods with some
intermittent volatility while value
stocks typically perform in long cycles.
We have just witnessed one such
episode in CY22 & are firm believers in
mean reversion & comeback of growth
stocks sooner than later. These
companies, by the virtue of their
franchise strength & management
competencies consolidate their position
during volatile times & capture even
larger pie of growth. We are continually
buying more into such companies at
lower valuations & would advise
investors to do the same so to enjoy the
benefits of true investing” - Atul Bhole,
Fund Manager
Lower Volatility helps to provide smoother investor experience
Source: MFIE. Data from 01 Jan 2020 till 30 Nov , 2022,. Indices are unmanaged and used for illustrative purposes only and are not intended to be indicative of any fund’s performance. It is not possible to invest directly in an index. Past performance may or may not sustain in future and should not be used as a
basis for comparison with other investments. Refer slide 7-10 for performance of scheme in SEBI prescribed format and of other schemes managed by same Fund Managers. CRISIL Hybrid 50+50 – Moderate Index is benchmark for DSP DAAF and Nifty 50 TRI is standard benchmark for the DSP DAAF. Note –
Performance is for DSP Dynamic Asset Allocation Fund (DSP DAAF)– Regular plan & Growth Option, *Scheme Benchmark= Crisil Hybrid 50+ 50- Moderate Index
Lesser Sharp drawdowns compared to Nifty 50 Significantly lower standard deviation since 2020
Less than half
volatility vs Nifty 50
DSP DAAF can be suitable for conservative to moderate profile investors who are seeking equity exposure with lower volatility
11%
23%
11%
DSP DAAF Nifty 50 TRI Benchmark
Std deviation
-45%
-40%
-35%
-30%
-25%
-20%
-15%
-10%
-5%
0%
Jan-20
Mar-20
May-20
Jul-20
Sep-20
Nov-20
Jan-21
Mar-21
May-21
Jul-21
Sep-21
Nov-21
Jan-22
Mar-22
May-22
Jul-22
Sep-22
Nov-22
Nifty 50 TRI
Benchmark
DSP Dynamic Asset Allocation Fund - Reg - Growth
*
*
Asset Allocation To Smoothen The Long Term Journey
• DSP Dynamic Asset Allocation Fund uses a model based on a Price to Earnings, Price to book and momentum filters. This unique design of the fund
is focused on attempting to tune equity allocations with market valuations. When markets are expensive, equity allocation is low and when the
markets become cheap based on their historical averages, the model suggests higher equity allocation
• In the last 3 years, the market valuations have moved wildly. This was primarily a function of COVID induced earnings volatility for all companies
and the unprecedented measures taken by policy makers on interest rates and government expenditure.
• After NIFTY 50 Index valuations reaching in high unchartered zones, valuations are now reasonable. This makes a good use case for valuations-
based model, especially after the recent underperformance. The quality strategy has not done well in CY2022 but this is unlikely to be a long term
scenario.
• Moreover, the equity allocation of the fund has followed an underperformance similar to the quality strategy.
• We currently stand at 40% core equity allocation, lower than the category average of 56%. Our model has been on a conservative side and has
avoided volatility significantly. Therefore, we continue to re-iterate that this is a good product for those looking at investing via long term asset
allocation approach
Source: MFIE. Data from 01 Jan 2020 till 30 Nov, 2022..The portfolio of the scheme(s) is subject to changes within the provisions of the Scheme Information document of the scheme(s).
DSP DAAF Performance (In SEBI format)
This fund CRISIL Hybrid 50+50 - Moderate Index^ NIFTY 50 TRI #
CAGR Current Value CAGR Current Value CAGR Current Value
1 Year 1.79% ₹ 10,179 6.84% ₹ 10,684 11.93% ₹ 11,193
3 years 7.78% ₹ 12,525 12.99% ₹ 14,436 17.22% ₹ 16,123
5 Years 7.18% ₹ 14,147 10.85% ₹ 16,739 14.32% ₹ 19,529
since Inception 8.26% ₹ 20,137 12.7% ₹ 28,698 15.15% ₹ 34,698
NAV / Index
Value
₹ 20.14 ₹ 11,584 ₹ 27,276
Date of allotment: Feb 06, 2014.
Period for which fund's performance has been provided is computed based on last day of the month-end preceding the date of advertisement
Different plans shall have a different expense structure. The performance details provided herein are of Regular Plan-Growth Option.
Since inception returns have been calculated from the date of allotment. Data is as on November 30, 2022.
Past performance may or may not be sustained in future and should not be used as a basis for comparison with other investments
^ Fund Benchmark # Standard Benchmark
Fund Managers-
1. Atul Bhole (Managing this fund since February 2018)
2. Dhaval Gada ( Managing this fund since September 2022)
3. Laukik Bagwe (Managing this fund since July 2021)
Other Schemes managed by Atul Bhole
Data as on November 30, 2022
Different plans shall have a different expense structure. The performance details provided herein are of regular plan-growth option.
Past performance may or may not be sustained in future and should not be used as a basis for comparison with other investment
Sr. No. Period 1 Year 3 Years 5 Years
Scheme
return (%)
Benchmark
return (%)
Scheme
return (%)
Benchmark
return (%)
Scheme
return (%)
Benchmark
return (%)
1
DSP Flexi Cap
Fund
(0.17) 10.2 15.89 18.83 11.67 13.03
2
DSP Dynamic
Asset Allocation
Fund
1.79 6.84 7.78 12.99 7.18 10.85
3
DSP Equity &
Bond Fund
0.7 8.29 13.3 14.88 9.96 11.88
Other Schemes managed by Laukik Bagwe
. No. Period 1 Year 3 Years 5 Years
Scheme return (%)
Benchmark return
(%)
Scheme return (%)
Benchmark return
(%)
Scheme return (%)
Benchmark return
(%)
1
DSP Nifty SDL Plus G-Sec
Jun 2028 30:70 Index
Fund
NA NA NA NA NA NA
2 DSP Short Term Fund 2.74 3.04 4.91 5.45 5.88 6.5
3 DSP Floater Fund 2.43 3.24 NA 5.96 NA 6.76
4 DSP 10Y G-Sec Fund (0.55) (0.21) 4.05 3.47 5.49 5.1
5
DSP Global Allocation
Fund
(6.22) (3.25) 7.26 8.12 7.23 9.56
6 DSP Credit Risk Fund 8.81 5.77 5.51 8.56 3.57 7.92
7
DSP Dynamic Asset
Allocation Fund
1.79 6.84 7.78 12.99 7.18 10.85
8
DSP Banking & PSU Debt
Fund
2.91 2.84 5.49 5.74 6.51 6.37
9
DSP US Flexible Equity
Fund
(2.14) (3.1) 13.97 15.31 13.09 15.96
10
DSP Government
Securities Fund
2.32 1.26 6.16 5.52 7.32 6.52
Data as on November 30, 2022
Different plans shall have a different expense structure. The performance details provided herein are of regular plan-growth option.
Past performance may or may not be sustained in future and should not be used as a basis for comparison with other investment
Other Schemes managed by Dhaval Gada
Sr. No. Period 1 Year 3 Years 5 Years
Scheme return
(%)
Benchmark
return (%)
Scheme return
(%)
Benchmark
return (%)
Scheme return
(%)
Benchmark
return (%)
1
DSP Flexi
Cap Fund
(0.17) 10.2 15.89 18.83 11.67 13.03
2
DSP
Dynamic
Asset
Allocation
Fund
1.79 6.84 7.78 12.99 7.18 10.85
3
DSP Equity
& Bond
Fund
0.7 8.29 13.3 14.88 9.96 11.88
Data as on November 30, 2022
Different plans shall have a different expense structure. The performance details provided herein are of regular plan-growth option.
Past performance may or may not be sustained in future and should not be used as a basis for comparison with other investment
Risks to investing
• DSP DAAF follows a model based approach to investing. While the model helps in reducing
volatility by using asset allocation approach, the risks to equity investing such as a sharp fall
owing to systemic risk remains
• The securities to invest in is subject to Fund Manager’s view and are likely to over/under perform
Disclaimer
Fund Product Suitability Riskometer
DSP Dynamic Asset Allocation Fund Benchmark - CRISIL Hybrid 50+50 – Moderate IndexRISIL
DSP Dynamic Asset Allocation
Fund
(An open ended dynamic asset
allocation fund)
This scheme is suitable for investors who are seeking*
Long term capital growth
Investments in equity and equity related securities
including the use of equity derivatives strategies and
arbitrage opportunities with balance exposure in
debt and money market instruments.
*Investors should consult their financial advisers if in doubt about whether the Scheme is suitable for them.
Disclaimer
In this material DSP Investment Managers Private Limited. (the AMC) has used information that is publicly available, including information developed in-house. Information gathered and used in this
material is believed to be from reliable sources. The AMC however does not warrant the accuracy, reasonableness and / or completeness of any information. The data/statistics are given to explain
general market trends in the securities market, it should not be construed as any research report/research recommendation. We have included statements / opinions / recommendations in this
document, which contain words, or phrases such as “will”, “expect”, “should”, “believe” and similar expressions or variations of such expressions that are “forward looking statements”. Actual results may
differ materially from those suggested by the forward looking statements due to risk or uncertainties associated with our expectations with respect to, but not limited to, exposure to market risks, general
economic and political conditions in India and other countries globally, which have an impact on our services and / or investments, the monetary and interest policies of India, inflation, deflation,
unanticipated turbulence in interest rates, foreign exchange rates, equity prices or other rates or prices etc.
The sector(s)/stock(s)/issuer(s) mentioned in this presentation do not constitute any research report/recommendation of the same and the Fund may or may not have any future position in these
sector(s)/stock(s)/issuer(s). The portfolio of the scheme is subject to changes within the provisions of the Scheme Information document of the scheme. Please refer to the SID for investment pattern,
strategy and risk factors which is available at www.dspim.com. Past performance may or may not sustain in future and should not be used as a basis for comparison with other investments.
The investment approach / framework/ strategy mentioned herein are currently followed by the scheme and the same may change in future depending on market conditions and other factors.
There is no guarantee of returns/income generation in the Scheme. Further, there is no assurance of any capital protection/capital guarantee to the investors in the Scheme.
All figures and other data given in this document for the fund and the model may or may not be relevant in future and the same should not be considered as solicitation/ recommendation/guarantee of
future investments by the AMC or its affiliates. Investors are advised to consult their own legal, tax and financial advisors to determine possible tax, legal and other financial implication or consequence of
subscribing to the units of DSP Mutual Fund.
Mutual Fund investments are subject to market risks, read all scheme related documents carefully.
#INVESTFORGOOD

DSP Dynamic Asset Allocation Fund Presentation

  • 1.
    DSP Dynamic AssetAllocation Fund (DAAF) An open- ended dynamic asset allocation fund FUND FLASH
  • 2.
    How does assetallocation model of DSP DAAF work? •Determine core equity allocation based on equity market valuations(P/E and P/B) FUNDAMENTAL FACTORS •Capitalize on equity market upswings by adding 10% to core equity allocation TECHNICAL SIGNALS •Assign final allocation to equities for active unhedged equity portfolio construction FINAL ALLOCATION MINIMUM UNHEDGED EQUITY ALLOCATION MAXIMUM UNHEDGED EQUITY ALLOCATION 20% 90% Model dynamically manages allocation between equity and debt by assessing equity market attractiveness based on Market valuations & technical indicators. Source – Internal. P/E= Price To Earnings, P/B= Price To Book
  • 3.
    Market witnessed variouscycles since 2020; DSP DAAF navigated with lower volatility Fund outperformed in Bear/Flat market period; underperformed in bull period due to conservative equity allocation. In the ongoing market, DSP DAAF continues to hold allocation at conservatively prudent 40% Source: MFIE. Data from 01 Jan 2020 till 30 Nov, 2022,. Indices are unmanaged and used for illustrative purposes only and are not intended to be indicative of any fund’s performance. It is not possible to invest directly in an index. Past performance may or may not sustain in future and should not be used as a basis for comparison with other investments. Note – Performance is for DSP Dynamic asset allocation fund – Regular plan & Growth Option, *Scheme Benchmark= Crisil Hybrid 50+ 50- Moderate Index 20% 30% 40% 50% 60% 70% 80% 90% 50 70 90 110 130 150 170 Jan-20 Mar-20 May-20 Jul-20 Sep-20 Nov-20 Jan-21 Mar-21 May-21 Jul-21 Sep-21 Nov-21 Jan-22 Mar-22 May-22 Jul-22 Sep-22 Nov-22 DSP DAAF Nifty 50 TRI Benchmark DSP DAAF Allocation Higher equity allocation as valuations collapsed Average equity allocation amidst mean valuations Lower drawdowns, reduced volatility & better returns Conservative equity allocation led to lower volatility & underperformance *
  • 4.
    The Drag InThe Performance Is Attributed To Quality Underperforming Source: MFIE. Data from 01 Jan 2020 till 30 Nov, 2022. The portfolio of the scheme(s) is subject to changes within the provisions of the Scheme Information document of the scheme(s) . The sector(s)/stock(s)/issuer(s) mentioned in this document do not constitute any recommendation of the same and the Fund may or may not have any future position in these sector(s)/stock(s)/issuer(s). Sector Average Weight Total Return Contribution To Return Industrials 6.19 29.20 1.80 Financials 37.62 2.45 1.44 Consumer Discretionary 11.62 4.93 0.43 Materials 15.63 5.69 0.26 Energy -0.01 18.96 0.00 Communication Services -0.01 2.96 0.00 Real Estate -0.00 10.82 -0.00 Health Care 5.17 -8.90 -0.60 Information Technology 11.53 -5.63 -0.63 Consumer Staples 9.04 -11.84 -1.01 Utilities 3.22 -22.89 -1.23 “Generally quality & growing businesses provide better & consistent returns for longer periods with some intermittent volatility while value stocks typically perform in long cycles. We have just witnessed one such episode in CY22 & are firm believers in mean reversion & comeback of growth stocks sooner than later. These companies, by the virtue of their franchise strength & management competencies consolidate their position during volatile times & capture even larger pie of growth. We are continually buying more into such companies at lower valuations & would advise investors to do the same so to enjoy the benefits of true investing” - Atul Bhole, Fund Manager
  • 5.
    Lower Volatility helpsto provide smoother investor experience Source: MFIE. Data from 01 Jan 2020 till 30 Nov , 2022,. Indices are unmanaged and used for illustrative purposes only and are not intended to be indicative of any fund’s performance. It is not possible to invest directly in an index. Past performance may or may not sustain in future and should not be used as a basis for comparison with other investments. Refer slide 7-10 for performance of scheme in SEBI prescribed format and of other schemes managed by same Fund Managers. CRISIL Hybrid 50+50 – Moderate Index is benchmark for DSP DAAF and Nifty 50 TRI is standard benchmark for the DSP DAAF. Note – Performance is for DSP Dynamic Asset Allocation Fund (DSP DAAF)– Regular plan & Growth Option, *Scheme Benchmark= Crisil Hybrid 50+ 50- Moderate Index Lesser Sharp drawdowns compared to Nifty 50 Significantly lower standard deviation since 2020 Less than half volatility vs Nifty 50 DSP DAAF can be suitable for conservative to moderate profile investors who are seeking equity exposure with lower volatility 11% 23% 11% DSP DAAF Nifty 50 TRI Benchmark Std deviation -45% -40% -35% -30% -25% -20% -15% -10% -5% 0% Jan-20 Mar-20 May-20 Jul-20 Sep-20 Nov-20 Jan-21 Mar-21 May-21 Jul-21 Sep-21 Nov-21 Jan-22 Mar-22 May-22 Jul-22 Sep-22 Nov-22 Nifty 50 TRI Benchmark DSP Dynamic Asset Allocation Fund - Reg - Growth * *
  • 6.
    Asset Allocation ToSmoothen The Long Term Journey • DSP Dynamic Asset Allocation Fund uses a model based on a Price to Earnings, Price to book and momentum filters. This unique design of the fund is focused on attempting to tune equity allocations with market valuations. When markets are expensive, equity allocation is low and when the markets become cheap based on their historical averages, the model suggests higher equity allocation • In the last 3 years, the market valuations have moved wildly. This was primarily a function of COVID induced earnings volatility for all companies and the unprecedented measures taken by policy makers on interest rates and government expenditure. • After NIFTY 50 Index valuations reaching in high unchartered zones, valuations are now reasonable. This makes a good use case for valuations- based model, especially after the recent underperformance. The quality strategy has not done well in CY2022 but this is unlikely to be a long term scenario. • Moreover, the equity allocation of the fund has followed an underperformance similar to the quality strategy. • We currently stand at 40% core equity allocation, lower than the category average of 56%. Our model has been on a conservative side and has avoided volatility significantly. Therefore, we continue to re-iterate that this is a good product for those looking at investing via long term asset allocation approach Source: MFIE. Data from 01 Jan 2020 till 30 Nov, 2022..The portfolio of the scheme(s) is subject to changes within the provisions of the Scheme Information document of the scheme(s).
  • 7.
    DSP DAAF Performance(In SEBI format) This fund CRISIL Hybrid 50+50 - Moderate Index^ NIFTY 50 TRI # CAGR Current Value CAGR Current Value CAGR Current Value 1 Year 1.79% ₹ 10,179 6.84% ₹ 10,684 11.93% ₹ 11,193 3 years 7.78% ₹ 12,525 12.99% ₹ 14,436 17.22% ₹ 16,123 5 Years 7.18% ₹ 14,147 10.85% ₹ 16,739 14.32% ₹ 19,529 since Inception 8.26% ₹ 20,137 12.7% ₹ 28,698 15.15% ₹ 34,698 NAV / Index Value ₹ 20.14 ₹ 11,584 ₹ 27,276 Date of allotment: Feb 06, 2014. Period for which fund's performance has been provided is computed based on last day of the month-end preceding the date of advertisement Different plans shall have a different expense structure. The performance details provided herein are of Regular Plan-Growth Option. Since inception returns have been calculated from the date of allotment. Data is as on November 30, 2022. Past performance may or may not be sustained in future and should not be used as a basis for comparison with other investments ^ Fund Benchmark # Standard Benchmark Fund Managers- 1. Atul Bhole (Managing this fund since February 2018) 2. Dhaval Gada ( Managing this fund since September 2022) 3. Laukik Bagwe (Managing this fund since July 2021)
  • 8.
    Other Schemes managedby Atul Bhole Data as on November 30, 2022 Different plans shall have a different expense structure. The performance details provided herein are of regular plan-growth option. Past performance may or may not be sustained in future and should not be used as a basis for comparison with other investment Sr. No. Period 1 Year 3 Years 5 Years Scheme return (%) Benchmark return (%) Scheme return (%) Benchmark return (%) Scheme return (%) Benchmark return (%) 1 DSP Flexi Cap Fund (0.17) 10.2 15.89 18.83 11.67 13.03 2 DSP Dynamic Asset Allocation Fund 1.79 6.84 7.78 12.99 7.18 10.85 3 DSP Equity & Bond Fund 0.7 8.29 13.3 14.88 9.96 11.88
  • 9.
    Other Schemes managedby Laukik Bagwe . No. Period 1 Year 3 Years 5 Years Scheme return (%) Benchmark return (%) Scheme return (%) Benchmark return (%) Scheme return (%) Benchmark return (%) 1 DSP Nifty SDL Plus G-Sec Jun 2028 30:70 Index Fund NA NA NA NA NA NA 2 DSP Short Term Fund 2.74 3.04 4.91 5.45 5.88 6.5 3 DSP Floater Fund 2.43 3.24 NA 5.96 NA 6.76 4 DSP 10Y G-Sec Fund (0.55) (0.21) 4.05 3.47 5.49 5.1 5 DSP Global Allocation Fund (6.22) (3.25) 7.26 8.12 7.23 9.56 6 DSP Credit Risk Fund 8.81 5.77 5.51 8.56 3.57 7.92 7 DSP Dynamic Asset Allocation Fund 1.79 6.84 7.78 12.99 7.18 10.85 8 DSP Banking & PSU Debt Fund 2.91 2.84 5.49 5.74 6.51 6.37 9 DSP US Flexible Equity Fund (2.14) (3.1) 13.97 15.31 13.09 15.96 10 DSP Government Securities Fund 2.32 1.26 6.16 5.52 7.32 6.52 Data as on November 30, 2022 Different plans shall have a different expense structure. The performance details provided herein are of regular plan-growth option. Past performance may or may not be sustained in future and should not be used as a basis for comparison with other investment
  • 10.
    Other Schemes managedby Dhaval Gada Sr. No. Period 1 Year 3 Years 5 Years Scheme return (%) Benchmark return (%) Scheme return (%) Benchmark return (%) Scheme return (%) Benchmark return (%) 1 DSP Flexi Cap Fund (0.17) 10.2 15.89 18.83 11.67 13.03 2 DSP Dynamic Asset Allocation Fund 1.79 6.84 7.78 12.99 7.18 10.85 3 DSP Equity & Bond Fund 0.7 8.29 13.3 14.88 9.96 11.88 Data as on November 30, 2022 Different plans shall have a different expense structure. The performance details provided herein are of regular plan-growth option. Past performance may or may not be sustained in future and should not be used as a basis for comparison with other investment
  • 11.
    Risks to investing •DSP DAAF follows a model based approach to investing. While the model helps in reducing volatility by using asset allocation approach, the risks to equity investing such as a sharp fall owing to systemic risk remains • The securities to invest in is subject to Fund Manager’s view and are likely to over/under perform
  • 12.
    Disclaimer Fund Product SuitabilityRiskometer DSP Dynamic Asset Allocation Fund Benchmark - CRISIL Hybrid 50+50 – Moderate IndexRISIL DSP Dynamic Asset Allocation Fund (An open ended dynamic asset allocation fund) This scheme is suitable for investors who are seeking* Long term capital growth Investments in equity and equity related securities including the use of equity derivatives strategies and arbitrage opportunities with balance exposure in debt and money market instruments. *Investors should consult their financial advisers if in doubt about whether the Scheme is suitable for them.
  • 13.
    Disclaimer In this materialDSP Investment Managers Private Limited. (the AMC) has used information that is publicly available, including information developed in-house. Information gathered and used in this material is believed to be from reliable sources. The AMC however does not warrant the accuracy, reasonableness and / or completeness of any information. The data/statistics are given to explain general market trends in the securities market, it should not be construed as any research report/research recommendation. We have included statements / opinions / recommendations in this document, which contain words, or phrases such as “will”, “expect”, “should”, “believe” and similar expressions or variations of such expressions that are “forward looking statements”. Actual results may differ materially from those suggested by the forward looking statements due to risk or uncertainties associated with our expectations with respect to, but not limited to, exposure to market risks, general economic and political conditions in India and other countries globally, which have an impact on our services and / or investments, the monetary and interest policies of India, inflation, deflation, unanticipated turbulence in interest rates, foreign exchange rates, equity prices or other rates or prices etc. The sector(s)/stock(s)/issuer(s) mentioned in this presentation do not constitute any research report/recommendation of the same and the Fund may or may not have any future position in these sector(s)/stock(s)/issuer(s). The portfolio of the scheme is subject to changes within the provisions of the Scheme Information document of the scheme. Please refer to the SID for investment pattern, strategy and risk factors which is available at www.dspim.com. Past performance may or may not sustain in future and should not be used as a basis for comparison with other investments. The investment approach / framework/ strategy mentioned herein are currently followed by the scheme and the same may change in future depending on market conditions and other factors. There is no guarantee of returns/income generation in the Scheme. Further, there is no assurance of any capital protection/capital guarantee to the investors in the Scheme. All figures and other data given in this document for the fund and the model may or may not be relevant in future and the same should not be considered as solicitation/ recommendation/guarantee of future investments by the AMC or its affiliates. Investors are advised to consult their own legal, tax and financial advisors to determine possible tax, legal and other financial implication or consequence of subscribing to the units of DSP Mutual Fund. Mutual Fund investments are subject to market risks, read all scheme related documents carefully.
  • 14.