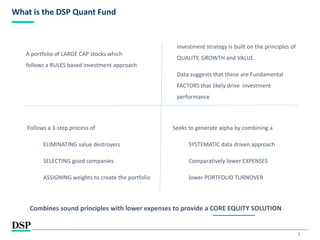
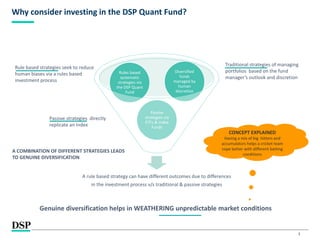
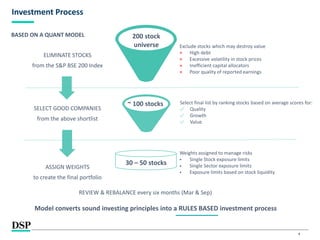
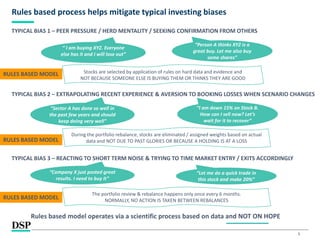
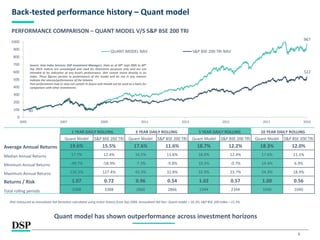
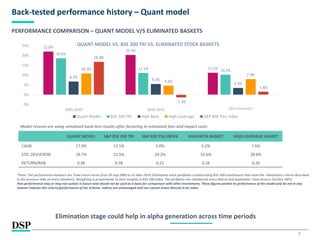
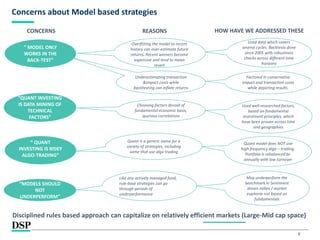
[Title to come]
[Sub-Title to come]
Date
* DSP India Fund is the Company incorporated in Mauritius, under which ILSF is the corresponding share class
November 2019
| People | Processes | Performance |
DSP Quant Fund
Introduction
2
What is the DSP Quant Fund
A portfolio of LARGE CAP stocks which
follows a RULES based investment approach
Investment strategy is built on the principles of
QUALITY, GROWTH and VALUE.
Data suggests that these are Fundamental
FACTORS that likely drive investment
performance
Follows a 3-step process of
ELIMINATING value destroyers
SELECTING good companies
ASSIGNING weights to create the portfolio
Seeks to generate alpha by combining a
SYSTEMATIC data driven approach
Comparatively lower EXPENSES
lower PORTFOLIO TURNOVER
Combines sound principles with lower expenses to provide a CORE EQUITY SOLUTION
A rule based strategy can have different outcomes due to differences
in the investment process v/s traditional & passive strategies
Passive
strategies via
ETFs & Index
Funds
Rules based
systematic
strategies via
the DSP Quant
Fund
Diversified
funds
managed by
human
discretion
3
Why consider investing in the DSP Quant Fund?
Rule based strategies seek to reduce
human biases via a rules based
investment process
Passive strategies directly
replicate an index
Traditional strategies of managing
portfolios based on the fund
manager’s outlook and discretion
Genuine diversification helps in WEATHERING unpredictable market conditions
CONCEPT EXPLAINED
Having a mix of big -hitters and
accumulators helps a cricket team
cope better with different batting
conditions
A COMBINATION OF DIFFERENT STRATEGIES LEADS
TO GENUINE DIVERSIFICATION
4
Investment Process
ELIMINATE STOCKS
from the S&P BSE 200 Index
SELECT GOOD COMPANIES
from the above shortlist
ASSIGN WEIGHTS
to create the final portfolio
200 stock
universe
~ 100 stocks
30 – 50 stocks
Exclude stocks which may destroy value
× High debt
× Excessive volatility in stock prices
× Inefficient capital allocators
× Poor quality of reported earnings
Select final list by ranking stocks based on average scores for:
✅ Quality
✅ Growth
✅ Value
Weights assigned to manage risks
 Single Stock exposure limits
 Single Sector exposure limits
 Exposure limits based on stock liquidity
Model converts sound investing principles into a RULES BASED investment process
BASED ON A QUANT MODEL
REVIEW & REBALANCE every six months (Mar & Sep)
5
Rules based process helps mitigate typical investing biases
TYPICAL BIAS 1 – PEER PRESSURE / HERD MENTALITY / SEEKING CONFIRMATION FROM OTHERS
TYPICAL BIAS 3 – REACTING TO SHORT TERM NOISE & TRYING TO TIME MARKET ENTRY / EXITS ACCORDINGLY
TYPICAL BIAS 2 – EXTRAPOLATING RECENT EXPERIENCE & AVERSION TO BOOKING LOSSES WHEN SCENARIO CHANGES
“ I am buying XYZ. Everyone
else has it and I will lose out”
“Person A thinks XYZ is a
great buy. Let me also buy
some shares”
Stocks are selected by application of rules on hard data and evidence and
NOT BECAUSE SOMEONE ELSE IS BUYING THEM OR THINKS THEY ARE GOOD
“
“Sector A has done so well in
the past few years and should
keep doing very well”
“I am down 15% on Stock B.
How can I sell now? Let’s
wait for it to recover”
During the portfolio rebalance, stocks are eliminated / assigned weights based on actual
data and NOT DUE TO PAST GLORIES OR BECAUSE A HOLDING IS AT A LOSS
“
“Company X just posted great
results. I need to buy it”
“Let me do a quick trade in
this stock and make 20%”
The portfolio review & rebalance happens only once every 6 months.
NORMALLY, NO ACTION IS TAKEN BETWEEN REBALANCES
Rules based model operates via a scientific process based on data and NOT ON HOPE
RULES BASED MODEL
RULES BASED MODEL
RULES BASED MODEL
6
Back-tested performance history – Quant model
967
90
522
0
100
200
300
400
500
600
700
800
900
1000
2005 2007 2009 2011 2013 2015 2017 2019
QUANT MODEL NAV S&P BSE 200 TRI NAV
PERFORMANCE COMPARISON – QUANT MODEL V/S S&P BSE 200 TRI
1 YEAR DAILY ROLLING 3 YEAR DAILY ROLLING 5 YEAR DAILY ROLLING 10 YEAR DAILY ROLLING
Quant Model S&P BSE 200 TRI Quant Model S&P BSE 200 TRI Quant Model S&P BSE 200 TRI Quant Model S&P BSE 200 TRI
Average Annual Returns 19.6% 15.5% 17.6% 11.6% 18.7% 12.2% 18.3% 12.0%
Median Annual Returns 17.7% 12.4% 16.5% 11.6% 18.8% 12.4% 17.6% 11.1%
Minimum Annual Returns -49.7% -58.9% -7.3% -9.8% 10.3% -0.7% 14.4% 6.9%
Maximum Annual Returns 136.5% 127.4% 43.3% 32.8% 32.9% 23.7% 24.3% 18.9%
Returns / Risk 1.07 0.72 0.96 0.54 1.02 0.57 1.00 0.56
Total rolling periods 3388 3388 2866 2866 2344 2344 1040 1040
Source: Asia Index Services, DSP Investment Managers. Data as of 30th Sept 2005 to 30th
Sep 2019. Indices are unmanaged and used for illustrative purposes only and are not
intended to be indicative of any fund’s performance. One cannot invest directly in an
index. These figures pertain to performance of the model and do not in any manner
indicate the returns/performance of the Scheme.
Past performance may or may not sustain in future and should not be used as a basis for
comparison with other investments.
Quant model has shown outperformance across investment horizons
Risk measured as annualized Std Deviation calculated using entire history from Sep 2005. Annualized Std Dev: Quant model = 18.3%, S&P BSE 200 Index = 21.3%
7
Back-tested performance history – Quant model
22.0%
20.3%
11.2%
18.6%
11.1% 10.2%
6.7%
5.5%
3.5%
10.9%
4.6%
7.9%
16.8%
-1.4%
1.6%
-5%
0%
5%
10%
15%
20%
25%
2005-2010 2010-2015 2015-Now
QUANT MODEL VS. BSE 200 TRI VS. ELIMINATED STOCK BASKETS
Quant Model BSE 200 TRI High Beta High Leverage S&P BSE PSU index
QUANT MODEL S&P BSE 200 TRI S&P BSE PSU INDEX HIGH BETA BASKET HIGH LEVERAGE BASKET
CAGR 17.9% 13.1% 5.0% 5.2% 7.6%
STD. DEVIATION 18.7% 22.5% 24.2% 33.6% 28.8%
RETURN/RISK 0.96 0.58 0.21 0.16 0.26
*Note: The performance numbers are Total return series from 30-Sep-2005 to 31-Mar-2019. Eliminated stock portfolios created using BSE 200 constituents that meet the elimination criteria described
in the previous slide at every rebalance. Weighting is proportional to their weights in BSE 200 index. The portfolios are rebalanced every March and September. Data Source: FactSet, MFIE.
Past performance may or may not sustain in future and should not be used as a basis for comparison with other investments. These figures pertain to performance of the model and do not in any
manner indicate the returns/performance of the Scheme. Indices are unmanaged and one cannot invest directly in an index.
Model returns are using simulated back-test results after factoring in estimated fees and impact costs
PERFORMANCE COMPARISON – QUANT MODEL V/S ELIMINATED BASKETS
Elimination stage could help in alpha generation across time periods
2015 onwards*
8
Concerns about Model based strategies
“ MODEL ONLY
WORKS IN THE
BACK-TEST”
“
“QUANT INVESTING
IS DATA MINING OF
TECHNICAL
FACTORS”
“ QUANT
INVESTING IS RISKY
ALGO-TRADING”
Overfitting the model to recent
history can over-estimate future
returns. Recent winners become
expensive and tend to mean
revert
Underestimating transaction
&impact costs while
backtesting can inflate returns
Choosing factors devoid of
fundamental economic basis,
spurious correlations
Factored in conservative
impact and transaction costs
while depicting results.
Quant model does NOT use
high frequency algo – trading.
Portfolio is rebalanced bi-
annually with low turnover
Disciplined rules based approach can capitalize on relatively efficient markets (Large-Mid cap space)
“
“MODELS SHOULD
NOT
UNDERPERFORM”
May underperform the
benchmark in Sentiment
driven rallies / market
euphoria not based on
fundamentals
REASONS
Quant is a generic name for a
variety of strategies, including
some that use algo trading
Used well-researched factors,
based on fundamental
investment principles, which
have been proven across time
and geographies
Like any actively managed fund,
rule-base strategies can go
through periods of
underperformance
CONCERNS HOW HAVE WE ADDRESSED THESE
Used data which covers
several cycles. Backtests done
since 2005 with robustness
checks across different time
horizons
9
Quantitative research & strategy team
TEAM WHICH DEVELOPED THE QUANT MODEL
Aparna Karnik – Senior VP & Head
Risk & Quantitative Analysis
• 16 year experience in investment,
credit and operations risk
• Prior experience with CRISIL Ratings
(Structured Finance Division, Large
Corporate Group)
• Masters in Management Studies from
Jamnalal Bajaj Institute of Management
Studies
Prateek Nigudkar – Senior Mgr.
Risk & Quantitative Analysis
• 7 years experience in quantitative
finance and thematic research
• Prior experience with State Street
Global Advisors (Global Beta
Solutions Group) and Credit Suisse
(Private Banking Global Research
Division)
• MS (Quantitative Finance) from Olin
Business School, Washington
University in St. Louis MO
Rahul Jain – Associate VP
Risk & Quantitative Analysis
• 11 years experience in quantitative
analysis, risk management and ETF
strategies
• Prior experience with Goldman Sachs
in Bangalore as Lead Strategist (Risk)
and Deutsche Bank Securities Inc. as
VP (Equity Trading)
• Masters of Technology and Bachelors
of Technology – Computer Science
from IIT Delhi, FRM, GARP
Team with DEEP EXPERIENCE in quantitative strategies across Indian & Global markets
10
Product labelling details
Fund Product Suitability Riskometer
DSP Quant Fund
(An open ended equity scheme investing based
on a quant model theme)
This open ended scheme is suitable for investors who are seeking*
Long term capital growth
Investment in active portfolio of stocks screened, selected, weighed and rebalanced on the
basis of a predefined fundamental factor model
*Investors should consult their financial/tax advisors if in doubt about whether the product is suitable for them.
11
Disclaimer
In this material DSP Investment Managers Pvt. Ltd. (the AMC) has used information that is publicly available, including information developed in-house. Information gathered and used in this material is believed to be from
reliable sources. The AMC however does not warrant the accuracy, reasonableness and / or completeness of any information. The data/statistics are given to explain general market trends in the securities market, it should not
be construed as any research report/research recommendation. We have included statements / opinions / recommendations in this document, which contain words, or phrases such as “will”, “expect”, “should”, “believe” and
similar expressions or variations of such expressions that are “forward looking statements”. Actual results may differ materially from those suggested by the forward looking statements due to risk or uncertainties associated
with our expectations with respect to, but not limited to, exposure to market risks, general economic and political conditions in India and other countries globally, which have an impact on our services and / or investments, the
monetary and interest policies of India, inflation, deflation, unanticipated turbulence in interest rates, foreign exchange rates, equity prices or other rates or prices etc.
The sector(s)/stock(s)/issuer(s) mentioned in this presentation do not constitute any research report/recommendation of the same and the Fund may or may not have any future position in these sector(s)/stock(s)/issuer(s).
The portfolio of the scheme is subject to changes within the provisions of the Scheme Information document of the scheme. Please refer to the SID for investment pattern, strategy and risk factors which is available at
www.dspim.com. Past performance may or may not sustain in future and should not be used as a basis for comparison with other investments.
DSP Mutual Fund and its schemes are not registered in any jurisdiction, except the Schemes viz. DSP Equity Opportunities Fund and DSP Dynamic Asset Allocation Fund, which are registered with the Securities and Commodities
Authority (“the SCA”) in the United Arab Emirates (UAE). The distribution of the Schemes in UAE would be undertaken by Barjeel Geojit Securities LLC, which is a licensed local distributor registered with SCA. .The distribution of
this material in certain jurisdictions may be restricted or subject to registration requirements and, accordingly, persons who come into possession of this material in such jurisdictions are required to in form themselves about,
and to observe, any such restrictions.
The strategy mentioned has been currently followed by the Scheme and the same may change in future depending on market conditions and other factors. There is no guarantee of returns/income generation in the
Scheme. Further, there is no assurance of any capital protection/capital guarantee to the investors in the Scheme.
The S&P BSE 100, S&P BSE 200, S&P BSE Small Cap Index, S&P BSE Teck, S&P BSE Metals, S&P BSE Oil, Gas & S&P BSE SENSEX and S&P Healthcare are product of Asia Index Private Limited, which is a joint venture of S&P Dow
Jones Indices LLC or its affiliates (“SPDJI”) and BSE, and has been licensed for use by DSP Investment Managers Pvt. Ltd. Standard & Poor’s® and S&P® are registered trademarks of Standard & Poor’s Financial Services LLC
(“S&P”); BSE® is a registered trademark of BSE Limited (“BSE”); and Dow Jones® is a registered trademark of Dow Jones Trademark Holdings LLC (“Dow Jones”). © Asia Index Private Limited 2014. All rights reserved.
All figures and other data given in this document for the Quant model are as on Sep 30th 2019 (unless otherwise specified) and the same may or may not be relevant in future and the same should not be considered as
solicitation/ recommendation/guarantee of future investments by DSP Investment Managers Pvt. Ltd. or its affiliates. Investors are advised to consult their own legal, tax and financial advisors to determine possible tax, legal
and other financial implication or consequence of subscribing to the units of DSP Mutual Fund.
For complete details on risk factors, event of suspension of subscriptions and more details, investors are requested to read the Scheme Information Document (SID) of the Scheme.
Mutual Fund investments are subject to market risks, read all scheme related documents carefully.
INVESTMENT MANAGERS

DSP Quant Fund - Introduction

  • 1.
    [Title to come] [Sub-Titleto come] Date * DSP India Fund is the Company incorporated in Mauritius, under which ILSF is the corresponding share class November 2019 | People | Processes | Performance | DSP Quant Fund Introduction
  • 2.
    2 What is theDSP Quant Fund A portfolio of LARGE CAP stocks which follows a RULES based investment approach Investment strategy is built on the principles of QUALITY, GROWTH and VALUE. Data suggests that these are Fundamental FACTORS that likely drive investment performance Follows a 3-step process of ELIMINATING value destroyers SELECTING good companies ASSIGNING weights to create the portfolio Seeks to generate alpha by combining a SYSTEMATIC data driven approach Comparatively lower EXPENSES lower PORTFOLIO TURNOVER Combines sound principles with lower expenses to provide a CORE EQUITY SOLUTION
  • 3.
    A rule basedstrategy can have different outcomes due to differences in the investment process v/s traditional & passive strategies Passive strategies via ETFs & Index Funds Rules based systematic strategies via the DSP Quant Fund Diversified funds managed by human discretion 3 Why consider investing in the DSP Quant Fund? Rule based strategies seek to reduce human biases via a rules based investment process Passive strategies directly replicate an index Traditional strategies of managing portfolios based on the fund manager’s outlook and discretion Genuine diversification helps in WEATHERING unpredictable market conditions CONCEPT EXPLAINED Having a mix of big -hitters and accumulators helps a cricket team cope better with different batting conditions A COMBINATION OF DIFFERENT STRATEGIES LEADS TO GENUINE DIVERSIFICATION
  • 4.
    4 Investment Process ELIMINATE STOCKS fromthe S&P BSE 200 Index SELECT GOOD COMPANIES from the above shortlist ASSIGN WEIGHTS to create the final portfolio 200 stock universe ~ 100 stocks 30 – 50 stocks Exclude stocks which may destroy value × High debt × Excessive volatility in stock prices × Inefficient capital allocators × Poor quality of reported earnings Select final list by ranking stocks based on average scores for: ✅ Quality ✅ Growth ✅ Value Weights assigned to manage risks  Single Stock exposure limits  Single Sector exposure limits  Exposure limits based on stock liquidity Model converts sound investing principles into a RULES BASED investment process BASED ON A QUANT MODEL REVIEW & REBALANCE every six months (Mar & Sep)
  • 5.
    5 Rules based processhelps mitigate typical investing biases TYPICAL BIAS 1 – PEER PRESSURE / HERD MENTALITY / SEEKING CONFIRMATION FROM OTHERS TYPICAL BIAS 3 – REACTING TO SHORT TERM NOISE & TRYING TO TIME MARKET ENTRY / EXITS ACCORDINGLY TYPICAL BIAS 2 – EXTRAPOLATING RECENT EXPERIENCE & AVERSION TO BOOKING LOSSES WHEN SCENARIO CHANGES “ I am buying XYZ. Everyone else has it and I will lose out” “Person A thinks XYZ is a great buy. Let me also buy some shares” Stocks are selected by application of rules on hard data and evidence and NOT BECAUSE SOMEONE ELSE IS BUYING THEM OR THINKS THEY ARE GOOD “ “Sector A has done so well in the past few years and should keep doing very well” “I am down 15% on Stock B. How can I sell now? Let’s wait for it to recover” During the portfolio rebalance, stocks are eliminated / assigned weights based on actual data and NOT DUE TO PAST GLORIES OR BECAUSE A HOLDING IS AT A LOSS “ “Company X just posted great results. I need to buy it” “Let me do a quick trade in this stock and make 20%” The portfolio review & rebalance happens only once every 6 months. NORMALLY, NO ACTION IS TAKEN BETWEEN REBALANCES Rules based model operates via a scientific process based on data and NOT ON HOPE RULES BASED MODEL RULES BASED MODEL RULES BASED MODEL
  • 6.
    6 Back-tested performance history– Quant model 967 90 522 0 100 200 300 400 500 600 700 800 900 1000 2005 2007 2009 2011 2013 2015 2017 2019 QUANT MODEL NAV S&P BSE 200 TRI NAV PERFORMANCE COMPARISON – QUANT MODEL V/S S&P BSE 200 TRI 1 YEAR DAILY ROLLING 3 YEAR DAILY ROLLING 5 YEAR DAILY ROLLING 10 YEAR DAILY ROLLING Quant Model S&P BSE 200 TRI Quant Model S&P BSE 200 TRI Quant Model S&P BSE 200 TRI Quant Model S&P BSE 200 TRI Average Annual Returns 19.6% 15.5% 17.6% 11.6% 18.7% 12.2% 18.3% 12.0% Median Annual Returns 17.7% 12.4% 16.5% 11.6% 18.8% 12.4% 17.6% 11.1% Minimum Annual Returns -49.7% -58.9% -7.3% -9.8% 10.3% -0.7% 14.4% 6.9% Maximum Annual Returns 136.5% 127.4% 43.3% 32.8% 32.9% 23.7% 24.3% 18.9% Returns / Risk 1.07 0.72 0.96 0.54 1.02 0.57 1.00 0.56 Total rolling periods 3388 3388 2866 2866 2344 2344 1040 1040 Source: Asia Index Services, DSP Investment Managers. Data as of 30th Sept 2005 to 30th Sep 2019. Indices are unmanaged and used for illustrative purposes only and are not intended to be indicative of any fund’s performance. One cannot invest directly in an index. These figures pertain to performance of the model and do not in any manner indicate the returns/performance of the Scheme. Past performance may or may not sustain in future and should not be used as a basis for comparison with other investments. Quant model has shown outperformance across investment horizons Risk measured as annualized Std Deviation calculated using entire history from Sep 2005. Annualized Std Dev: Quant model = 18.3%, S&P BSE 200 Index = 21.3%
  • 7.
    7 Back-tested performance history– Quant model 22.0% 20.3% 11.2% 18.6% 11.1% 10.2% 6.7% 5.5% 3.5% 10.9% 4.6% 7.9% 16.8% -1.4% 1.6% -5% 0% 5% 10% 15% 20% 25% 2005-2010 2010-2015 2015-Now QUANT MODEL VS. BSE 200 TRI VS. ELIMINATED STOCK BASKETS Quant Model BSE 200 TRI High Beta High Leverage S&P BSE PSU index QUANT MODEL S&P BSE 200 TRI S&P BSE PSU INDEX HIGH BETA BASKET HIGH LEVERAGE BASKET CAGR 17.9% 13.1% 5.0% 5.2% 7.6% STD. DEVIATION 18.7% 22.5% 24.2% 33.6% 28.8% RETURN/RISK 0.96 0.58 0.21 0.16 0.26 *Note: The performance numbers are Total return series from 30-Sep-2005 to 31-Mar-2019. Eliminated stock portfolios created using BSE 200 constituents that meet the elimination criteria described in the previous slide at every rebalance. Weighting is proportional to their weights in BSE 200 index. The portfolios are rebalanced every March and September. Data Source: FactSet, MFIE. Past performance may or may not sustain in future and should not be used as a basis for comparison with other investments. These figures pertain to performance of the model and do not in any manner indicate the returns/performance of the Scheme. Indices are unmanaged and one cannot invest directly in an index. Model returns are using simulated back-test results after factoring in estimated fees and impact costs PERFORMANCE COMPARISON – QUANT MODEL V/S ELIMINATED BASKETS Elimination stage could help in alpha generation across time periods 2015 onwards*
  • 8.
    8 Concerns about Modelbased strategies “ MODEL ONLY WORKS IN THE BACK-TEST” “ “QUANT INVESTING IS DATA MINING OF TECHNICAL FACTORS” “ QUANT INVESTING IS RISKY ALGO-TRADING” Overfitting the model to recent history can over-estimate future returns. Recent winners become expensive and tend to mean revert Underestimating transaction &impact costs while backtesting can inflate returns Choosing factors devoid of fundamental economic basis, spurious correlations Factored in conservative impact and transaction costs while depicting results. Quant model does NOT use high frequency algo – trading. Portfolio is rebalanced bi- annually with low turnover Disciplined rules based approach can capitalize on relatively efficient markets (Large-Mid cap space) “ “MODELS SHOULD NOT UNDERPERFORM” May underperform the benchmark in Sentiment driven rallies / market euphoria not based on fundamentals REASONS Quant is a generic name for a variety of strategies, including some that use algo trading Used well-researched factors, based on fundamental investment principles, which have been proven across time and geographies Like any actively managed fund, rule-base strategies can go through periods of underperformance CONCERNS HOW HAVE WE ADDRESSED THESE Used data which covers several cycles. Backtests done since 2005 with robustness checks across different time horizons
  • 9.
    9 Quantitative research &strategy team TEAM WHICH DEVELOPED THE QUANT MODEL Aparna Karnik – Senior VP & Head Risk & Quantitative Analysis • 16 year experience in investment, credit and operations risk • Prior experience with CRISIL Ratings (Structured Finance Division, Large Corporate Group) • Masters in Management Studies from Jamnalal Bajaj Institute of Management Studies Prateek Nigudkar – Senior Mgr. Risk & Quantitative Analysis • 7 years experience in quantitative finance and thematic research • Prior experience with State Street Global Advisors (Global Beta Solutions Group) and Credit Suisse (Private Banking Global Research Division) • MS (Quantitative Finance) from Olin Business School, Washington University in St. Louis MO Rahul Jain – Associate VP Risk & Quantitative Analysis • 11 years experience in quantitative analysis, risk management and ETF strategies • Prior experience with Goldman Sachs in Bangalore as Lead Strategist (Risk) and Deutsche Bank Securities Inc. as VP (Equity Trading) • Masters of Technology and Bachelors of Technology – Computer Science from IIT Delhi, FRM, GARP Team with DEEP EXPERIENCE in quantitative strategies across Indian & Global markets
  • 10.
    10 Product labelling details FundProduct Suitability Riskometer DSP Quant Fund (An open ended equity scheme investing based on a quant model theme) This open ended scheme is suitable for investors who are seeking* Long term capital growth Investment in active portfolio of stocks screened, selected, weighed and rebalanced on the basis of a predefined fundamental factor model *Investors should consult their financial/tax advisors if in doubt about whether the product is suitable for them.
  • 11.
    11 Disclaimer In this materialDSP Investment Managers Pvt. Ltd. (the AMC) has used information that is publicly available, including information developed in-house. Information gathered and used in this material is believed to be from reliable sources. The AMC however does not warrant the accuracy, reasonableness and / or completeness of any information. The data/statistics are given to explain general market trends in the securities market, it should not be construed as any research report/research recommendation. We have included statements / opinions / recommendations in this document, which contain words, or phrases such as “will”, “expect”, “should”, “believe” and similar expressions or variations of such expressions that are “forward looking statements”. Actual results may differ materially from those suggested by the forward looking statements due to risk or uncertainties associated with our expectations with respect to, but not limited to, exposure to market risks, general economic and political conditions in India and other countries globally, which have an impact on our services and / or investments, the monetary and interest policies of India, inflation, deflation, unanticipated turbulence in interest rates, foreign exchange rates, equity prices or other rates or prices etc. The sector(s)/stock(s)/issuer(s) mentioned in this presentation do not constitute any research report/recommendation of the same and the Fund may or may not have any future position in these sector(s)/stock(s)/issuer(s). The portfolio of the scheme is subject to changes within the provisions of the Scheme Information document of the scheme. Please refer to the SID for investment pattern, strategy and risk factors which is available at www.dspim.com. Past performance may or may not sustain in future and should not be used as a basis for comparison with other investments. DSP Mutual Fund and its schemes are not registered in any jurisdiction, except the Schemes viz. DSP Equity Opportunities Fund and DSP Dynamic Asset Allocation Fund, which are registered with the Securities and Commodities Authority (“the SCA”) in the United Arab Emirates (UAE). The distribution of the Schemes in UAE would be undertaken by Barjeel Geojit Securities LLC, which is a licensed local distributor registered with SCA. .The distribution of this material in certain jurisdictions may be restricted or subject to registration requirements and, accordingly, persons who come into possession of this material in such jurisdictions are required to in form themselves about, and to observe, any such restrictions. The strategy mentioned has been currently followed by the Scheme and the same may change in future depending on market conditions and other factors. There is no guarantee of returns/income generation in the Scheme. Further, there is no assurance of any capital protection/capital guarantee to the investors in the Scheme. The S&P BSE 100, S&P BSE 200, S&P BSE Small Cap Index, S&P BSE Teck, S&P BSE Metals, S&P BSE Oil, Gas & S&P BSE SENSEX and S&P Healthcare are product of Asia Index Private Limited, which is a joint venture of S&P Dow Jones Indices LLC or its affiliates (“SPDJI”) and BSE, and has been licensed for use by DSP Investment Managers Pvt. Ltd. Standard & Poor’s® and S&P® are registered trademarks of Standard & Poor’s Financial Services LLC (“S&P”); BSE® is a registered trademark of BSE Limited (“BSE”); and Dow Jones® is a registered trademark of Dow Jones Trademark Holdings LLC (“Dow Jones”). © Asia Index Private Limited 2014. All rights reserved. All figures and other data given in this document for the Quant model are as on Sep 30th 2019 (unless otherwise specified) and the same may or may not be relevant in future and the same should not be considered as solicitation/ recommendation/guarantee of future investments by DSP Investment Managers Pvt. Ltd. or its affiliates. Investors are advised to consult their own legal, tax and financial advisors to determine possible tax, legal and other financial implication or consequence of subscribing to the units of DSP Mutual Fund. For complete details on risk factors, event of suspension of subscriptions and more details, investors are requested to read the Scheme Information Document (SID) of the Scheme. Mutual Fund investments are subject to market risks, read all scheme related documents carefully.
  • 12.