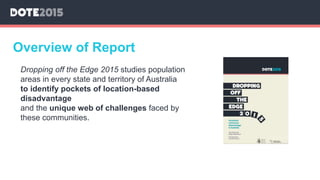
DROPPING OFF THE EDGE 2015
FRSA Conference, Brisbane
11 November 2015
Marcelle Mogg
CEO, Catholic Social Services Australia
Outline of Presentation
1. Overview of Key Findings from the Dropping off the Edge 2015 Report
2. Implications for Families
3. Importance of Social Cohesion
4. Our Advocacy Position and Policy Challenges
About the research sponsors
Catholic Social Services Australia
• We represent a national network of 59 Catholic social service organisations that provide
direct support to more than one million Australians each year. We develop social welfare
policies, programs and other strategic responses that work towards the economic,
social and spiritual well-being of the Australian community.
Jesuit Social Services
• We work to build a just society where all people can live to their full potential - by
partnering with community to support those most in need and working to change
policies, practices, ideas and values that perpetuate inequality, prejudice and exclusion.
Why we commissioned this research
• The 2007 Dropping off the Edge Report (and 1999, 2004) led to
Governments committing to a place based approach and the
establishment of the National Social Inclusion Board.
• We received many requests for updating the data to provide a better
evidence base.
• We believe we cannot and should not turn away from the challenge of
persistent and entrenched disadvantage.
• We hold hope that the young people in these communities will have a
better outlook and life opportunities.
Overview of Report
Dropping off the Edge 2015 studies population
areas in every state and territory of Australia
to identify pockets of location-based
disadvantage
and the unique web of challenges faced by
these communities.
16 years of research
• 1999 and 2004 – NSW and Vic
• 2007 and 2015 – National
2015 Authors: Prof Tony Vinson and Assoc Prof Margot Rawsthorne (University of
Sydney) with Dr Adrian Beavis and Dr Matthew Ericson
What the research tells us
• Provides a picture of where disadvantage is concentrated
• Presents a snapshot of what attributes dispose an area to be highly
disadvantaged
• Looks for patterns of connectedness between the indicators
• Devises a single social disadvantage score (ranking) for each locality
within each jurisdiction
• Identifies highly disadvantaged communities warranting national as well as
state and territory attention
Units of Study
As small as the available records permit:
• Postcodes: Victoria (667), NSW (621), ACT (26)
• Statistical Local Areas (SLA) : Queensland (475), South Australia (125),
Northern Territory (16)
• Local Government Areas (LGA): Tasmania (29), Western Australia (140)
Indicators – National and State/Territory data
Main findings – National
• Concentrated – assessment 2125 discrete areas found disadvantage is
concentrated in a small number of communities – 3% approx
• Web of disadvantage – prison admissions, unemployment, lack of formal
education, domestic violence, mental health and low income are the most
prevalent indicators
• Persistent – in general, 8/9 out of the top 12 communities have been the most
disadvantaged previously
• Focus – regional/rural and Indigenous communities feature in the most
disadvantaged, and outer metro areas also vulnerable
Main findings – burden of disadvantage
Example of improvements between 2007-15
• Windale (new Newcastle) has marked improvements in Year 3 NAPLAN.
• In this community, a “School as Community Centre” was established – more
parental involvement in early education and general community well being.
• “Green shoots” demonstrate hope for younger generation
2. Implications for Families
• Collates state and national data – not available elsewhere
• Research has been done over a time series so changes (+ve and -ve
can be tracked)
• Provides an evidence base for service planning, needs assessment
and advocacy for funding
DOTE evidence as a tool
• All of the indicators of disadvantage impact on families in some way
• Families within communities in rural, regional and indigenous communities are the
most disadvantaged
• Each family and community is affected by different indicators of disadvantage and
these need to be understood
Example: In Qld the most disadvantaged communities have
4x the rate of domestic violence and
8x the rate of criminal convictions
Families – what this research tells us
• Families may be dealing with complex disadvantage within
communities that have entrenched disadvantage – intergenerational
disadvantage
• Community wide disadvantage needs to be addressed in conjunction
with family intervention: employment opportunities, affordable housing,
services, training and transport
• Strong communities can dampen the effect of disadvantage – placing
emphasis on community building and cohesion can assist families in these
communities
Families – what this research tells us - cont
3. Importance of Social Cohesion
Testing the impact of social cohesion
(Vic research by Prof Tony Vinson)
• Social cohesion – Connections between people and between them
and their wider community
• Do local social connections affect community resilience?
• Can the strengths of these connections lessen the impact of
disadvantage?
Source: Vinson, T., (2004) Community Adversity and Resilience: The distribution of social disadvantage in Victoria and New South Wales and the mediating role of social cohesion, Jesuit Social Services
Examples of Impact of Social Cohesion
Factor 1 Factor 2 495 postcode
areas of Victoria
Low Social
Cohesion (N=164)
High Social
Cohesion (N=155)
Crime Unemployment Imprisonment .44 .67 .17
Child
Maltreatment
Low family income Child mistreatment .36 .59 .27
Early Years Low family income No preschool .39 .56 .17
Early Years Early school
leaving
Low birth weight .19 .46 .11
Employment Early school
leaving
Unemployment .42 .67 .14
Violence Unemployment Domestic violence .41 .44 .30
Mental Health Unemployment Psychiatric hospital
admission
.30 .50 .12
Source: Vinson, T., (2004) Community Adversity and Resilience: The distribution of social disadvantage in Victoria and New South Wales and the mediating role of social cohesion, Jesuit Social Services
Characteristics of social cohesion
• Volunteerism
• Membership of local groups
• Group action to help community
• Neighbours help in difficult times
• Feeling safe walking in neighbourhood
• Agree people can be trusted
• Attendance at local community events
• Feel valued by society
Physical environment – social cohesion
• Safe places to meet – libraries, parks
• Walking safely – lighting, activity areas
• Community facilities – recreation, halls
• Access to commercial, community and health services
• Public transport – to access services and social networks
• Housing – affordable, well designed for needs
Findings about social cohesion
• Strong social cohesion can “dampen” effects of harmful conditions
• This needs to be supported by other interventions – education,
income, health, parenting skills etc.
• Place effects have greatest influence on children and late adolescence
(e.g. health, education, parenting support)
• Requires long term intervention
4. Our advocacy position
and challenges
Confronting and overcoming
disadvantage
We cannot and should not turn away from the challenge of persistent and
entrenched disadvantage.
A new approach is needed so we don’t continue to fail the 3% of
communities that bear the greatest burden of disadvantage.
Starting the conversation
What can be done to address entrenched disadvantage?
• Focus on most disadvantaged locations
• Develop solutions that are unique to each community
• Responses that are integrated – across silos and across governments
• Long term
• Involve communities
• 13 formal state briefings across the country and over 20 smaller targeted
stakeholder meetings
• Over 250 people attended from government (politicians), community sector
and some private sector
• Provided ideas and feedback on local issues – most were positive that
disadvantage could be addressed and gave case studies as examples
• However some frustration with current practices
Briefings from August – November 2015
• Getting the right balance between individualised services and investment
in the community
• Creative solutions needed as ‘business as usual’ may not work
• Silos in service delivery are hindering outcomes – interrelationships
between indicators need to be understood
• Services should be coordinated on the ground
Policy ideas and challenges
• Communities should be at the centre of decision making
• Each community is different and the issues need to be understood
• Rural and regional communities are generally the most disadvantaged –
costs of service delivery are higher in these areas
Other ideas
Further information
www.dote.org.au and #DOTE2015
• Report
• Summary Document
• State Fact Sheets
• Maps
• Advocacy Materials
• State Based Briefings
Thank you
Contact:
Catholic Social Services Australia 02 6285 1366
Jesuit Social Services 03 9421 7600

Dropping off the Edge 2015

  • 1.
    DROPPING OFF THEEDGE 2015 FRSA Conference, Brisbane 11 November 2015 Marcelle Mogg CEO, Catholic Social Services Australia
  • 2.
    Outline of Presentation 1.Overview of Key Findings from the Dropping off the Edge 2015 Report 2. Implications for Families 3. Importance of Social Cohesion 4. Our Advocacy Position and Policy Challenges
  • 3.
    About the researchsponsors Catholic Social Services Australia • We represent a national network of 59 Catholic social service organisations that provide direct support to more than one million Australians each year. We develop social welfare policies, programs and other strategic responses that work towards the economic, social and spiritual well-being of the Australian community. Jesuit Social Services • We work to build a just society where all people can live to their full potential - by partnering with community to support those most in need and working to change policies, practices, ideas and values that perpetuate inequality, prejudice and exclusion.
  • 4.
    Why we commissionedthis research • The 2007 Dropping off the Edge Report (and 1999, 2004) led to Governments committing to a place based approach and the establishment of the National Social Inclusion Board. • We received many requests for updating the data to provide a better evidence base. • We believe we cannot and should not turn away from the challenge of persistent and entrenched disadvantage. • We hold hope that the young people in these communities will have a better outlook and life opportunities.
  • 5.
    Overview of Report Droppingoff the Edge 2015 studies population areas in every state and territory of Australia to identify pockets of location-based disadvantage and the unique web of challenges faced by these communities.
  • 6.
    16 years ofresearch • 1999 and 2004 – NSW and Vic • 2007 and 2015 – National 2015 Authors: Prof Tony Vinson and Assoc Prof Margot Rawsthorne (University of Sydney) with Dr Adrian Beavis and Dr Matthew Ericson
  • 7.
    What the researchtells us • Provides a picture of where disadvantage is concentrated • Presents a snapshot of what attributes dispose an area to be highly disadvantaged • Looks for patterns of connectedness between the indicators • Devises a single social disadvantage score (ranking) for each locality within each jurisdiction • Identifies highly disadvantaged communities warranting national as well as state and territory attention
  • 8.
    Units of Study Assmall as the available records permit: • Postcodes: Victoria (667), NSW (621), ACT (26) • Statistical Local Areas (SLA) : Queensland (475), South Australia (125), Northern Territory (16) • Local Government Areas (LGA): Tasmania (29), Western Australia (140)
  • 9.
    Indicators – Nationaland State/Territory data
  • 10.
    Main findings –National • Concentrated – assessment 2125 discrete areas found disadvantage is concentrated in a small number of communities – 3% approx • Web of disadvantage – prison admissions, unemployment, lack of formal education, domestic violence, mental health and low income are the most prevalent indicators • Persistent – in general, 8/9 out of the top 12 communities have been the most disadvantaged previously • Focus – regional/rural and Indigenous communities feature in the most disadvantaged, and outer metro areas also vulnerable
  • 11.
    Main findings –burden of disadvantage
  • 12.
    Example of improvementsbetween 2007-15 • Windale (new Newcastle) has marked improvements in Year 3 NAPLAN. • In this community, a “School as Community Centre” was established – more parental involvement in early education and general community well being. • “Green shoots” demonstrate hope for younger generation
  • 13.
  • 14.
    • Collates stateand national data – not available elsewhere • Research has been done over a time series so changes (+ve and -ve can be tracked) • Provides an evidence base for service planning, needs assessment and advocacy for funding DOTE evidence as a tool
  • 15.
    • All ofthe indicators of disadvantage impact on families in some way • Families within communities in rural, regional and indigenous communities are the most disadvantaged • Each family and community is affected by different indicators of disadvantage and these need to be understood Example: In Qld the most disadvantaged communities have 4x the rate of domestic violence and 8x the rate of criminal convictions Families – what this research tells us
  • 16.
    • Families maybe dealing with complex disadvantage within communities that have entrenched disadvantage – intergenerational disadvantage • Community wide disadvantage needs to be addressed in conjunction with family intervention: employment opportunities, affordable housing, services, training and transport • Strong communities can dampen the effect of disadvantage – placing emphasis on community building and cohesion can assist families in these communities Families – what this research tells us - cont
  • 17.
    3. Importance ofSocial Cohesion
  • 18.
    Testing the impactof social cohesion (Vic research by Prof Tony Vinson) • Social cohesion – Connections between people and between them and their wider community • Do local social connections affect community resilience? • Can the strengths of these connections lessen the impact of disadvantage? Source: Vinson, T., (2004) Community Adversity and Resilience: The distribution of social disadvantage in Victoria and New South Wales and the mediating role of social cohesion, Jesuit Social Services
  • 19.
    Examples of Impactof Social Cohesion Factor 1 Factor 2 495 postcode areas of Victoria Low Social Cohesion (N=164) High Social Cohesion (N=155) Crime Unemployment Imprisonment .44 .67 .17 Child Maltreatment Low family income Child mistreatment .36 .59 .27 Early Years Low family income No preschool .39 .56 .17 Early Years Early school leaving Low birth weight .19 .46 .11 Employment Early school leaving Unemployment .42 .67 .14 Violence Unemployment Domestic violence .41 .44 .30 Mental Health Unemployment Psychiatric hospital admission .30 .50 .12 Source: Vinson, T., (2004) Community Adversity and Resilience: The distribution of social disadvantage in Victoria and New South Wales and the mediating role of social cohesion, Jesuit Social Services
  • 20.
    Characteristics of socialcohesion • Volunteerism • Membership of local groups • Group action to help community • Neighbours help in difficult times • Feeling safe walking in neighbourhood • Agree people can be trusted • Attendance at local community events • Feel valued by society
  • 21.
    Physical environment –social cohesion • Safe places to meet – libraries, parks • Walking safely – lighting, activity areas • Community facilities – recreation, halls • Access to commercial, community and health services • Public transport – to access services and social networks • Housing – affordable, well designed for needs
  • 22.
    Findings about socialcohesion • Strong social cohesion can “dampen” effects of harmful conditions • This needs to be supported by other interventions – education, income, health, parenting skills etc. • Place effects have greatest influence on children and late adolescence (e.g. health, education, parenting support) • Requires long term intervention
  • 23.
    4. Our advocacyposition and challenges
  • 24.
    Confronting and overcoming disadvantage Wecannot and should not turn away from the challenge of persistent and entrenched disadvantage. A new approach is needed so we don’t continue to fail the 3% of communities that bear the greatest burden of disadvantage.
  • 25.
    Starting the conversation Whatcan be done to address entrenched disadvantage? • Focus on most disadvantaged locations • Develop solutions that are unique to each community • Responses that are integrated – across silos and across governments • Long term • Involve communities
  • 26.
    • 13 formalstate briefings across the country and over 20 smaller targeted stakeholder meetings • Over 250 people attended from government (politicians), community sector and some private sector • Provided ideas and feedback on local issues – most were positive that disadvantage could be addressed and gave case studies as examples • However some frustration with current practices Briefings from August – November 2015
  • 27.
    • Getting theright balance between individualised services and investment in the community • Creative solutions needed as ‘business as usual’ may not work • Silos in service delivery are hindering outcomes – interrelationships between indicators need to be understood • Services should be coordinated on the ground Policy ideas and challenges
  • 28.
    • Communities shouldbe at the centre of decision making • Each community is different and the issues need to be understood • Rural and regional communities are generally the most disadvantaged – costs of service delivery are higher in these areas Other ideas
  • 29.
    Further information www.dote.org.au and#DOTE2015 • Report • Summary Document • State Fact Sheets • Maps • Advocacy Materials • State Based Briefings
  • 30.
    Thank you Contact: Catholic SocialServices Australia 02 6285 1366 Jesuit Social Services 03 9421 7600