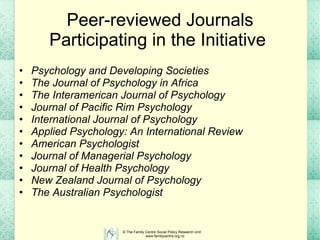
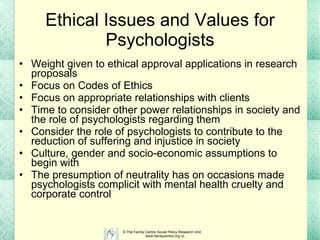
Poverty Reduction and Psychology Charles Waldegrave The Family Centre Social Policy Research Unit,  Lower Hutt, Wellington, New Zealand www.familycentre.org.nz   Presentation to  New Zealand Psychological Society Annual Conference 2010 Rydges Hotel, Rotorua Tuesday 20 July 2010
Poverty Reduction and Psychology  A global focus in Psychology Journals  Express the desire of the psychology community worldwide to give greater focus to the importance of the contribution psychology can and does make to poverty reduction  A Special Feature Issue in each participating Journal The idea internationally was to accelerate input from an entire field by psychology journals throughout the world coordinating in a temporal sense around mid 2010 by either producing a special section of papers, or an entire issue of the journal, on the poverty reduction theme.
Peer-reviewed Journals Participating in the Initiative  Psychology and Developing Societies The Journal of Psychology in Africa The Interamerican Journal of Psychology Journal of Pacific Rim Psychology International Journal of Psychology Applied Psychology: An International Review American Psychologist Journal of Managerial Psychology Journal of Health Psychology New Zealand Journal of Psychology The Australian Psychologist
Studies on Health Status and Inequalities They show a distinct relationship between inequalities in society and physical and mental illhealth.  Poorer people die earlier, consistently have the poorest health and the highest hospitalisation rates.  Furthermore, when there is an overall improvement in a country’s population health status, the health inequalities do not usually decrease.   The evidence is overwhelming.
INEQUALITIES AND HEALTH Brenner’s research on the effects of economic recession in the USA indicated that a 1% rise in unemployment in a given year is followed by:  6% more admissions into psychiatric hospitals,  a 4% rise in suicides,  a 4% rise in state prison admissions  and 6% more homicides.
INEQUALITIES AND HEALTH Ctd Benzeval, M., Judge, K., & Whitehead, M. (Eds.). (1995).  Tackling inequalities in health: An agenda for action,  London: King’s Fund. Acheson, Sir, D. (1998).  Independent inquiry into inequalities in health.  Norwich: Stationary Office. Available from:  http://www.archive.official-documents.co.uk/document/doh/ih/contents.htm   National Health Committee (1998)  The Social, Cultural and Economic Determinants of Health in New Zealand: Action to improve health,  Wellington: Ministry of Health Kawachi, I. and Kennedy, B. (2002).  The Health of Nations.   New York: The New Press. Kawachi, I., and Berkman, L.F. (2003).  Neighbourhoods and Health.  New York: Oxford University Press.
INEQUALITIES AND HEALTH Ctd Mackenbach, J. (2006).  Health inequalities: Europe in profile,  An independent, expert report commissioned by the UK Presidency of the EU (February 2006) Ministry of Social Development (2009).  The Social Report 2009.  Wellington: Ministry of  Social Development. Available from:  http:// www.socialreport.msd.govt.nz /   Wilkinson, R. and Pickett, K. (2009).  The Spirit Level: Why more equal societies almost always do better.  London: Allen Lane. Marmot, Sir M. (Chair of the Independent Review Commission) (2010).  Fair Society, Healthy Lives: The Marmot Review . S trategic review of health inequalities in England post-2010 .  London: The Marmot Review,  Department of Health.  Available from  http:// www.ucl.ac.uk/gheg/marmotreview/FairSocietyHealthyLives
Special Issue Chapter Titles Preventing child poverty: Barriers and solutions The impact of poverty on wellbeing during midlife Ageing in a material world Economic hardship among older people in New Zealand: The effects of low living standards on social support, loneliness, and mental health. Human costs of poverty in Aotearoa Global poverty, aid advertisements and cognition Can poverty drive you mad?   A literature review with clinical and primary prevention implications
ICAP Conference Melbourne Stuart Carr – State of the art address Launch of the global issues initiative Symposium All branches of psychology can contribute – Chris Burt, Ishbel McWha
Proportion (%) of the population in low-income households (60 per cent threshold), by age and sex, selected years, 1986–2008 Source:  MSD (2009) ‘Social Report 2009’: p.63 9 12 13 12 20 2008 8 11 13 17 16 2007 7 13 17 22 23 2004 7 14 18 21 29 2001 9 12 18 16 28 1998 8 15 23 20 35 1994 6 6 12 8 16 1990 4 5 8 5 11 1986 65+ 45-64 25-44 18-24 0-17 Year         Children  
Proportion (%) of the population in low-income households (60 per cent threshold), by age and sex, selected years, 1986–2008 cont. Source:  MSD (2009) ‘Social Report 2009’: p.63 14 13 11 2008 13 13 11 2007 17 15 15 2004 19 17 14 2001 18 16 13 1998 23 20 17 1994 11 9 8 1990 8 7 5 1986 Total 15+ 15+ Year   Females Males  
Proportion of households with housing cost outgoings-to-income ratio greater than 30 per cent, 1988–2008 Percentage of all households March years 1988-1998: June years from 2001 Source:  MSD (2009) ‘Social Report 2009’: p.64 1988 1989 1990 1991 1992 1993 1994 1995 1996 1997 1998 1999 2000 2001 2002 2003 2004 2005 2006 2007 2008 30 25 20 15 10 5 0
Distribution of ELSI-3 scores by ELSI level –  whole population (2008) ELSI Levels (1 – 7) Source:  Perry (2009) ‘Non-income measures of material wellbeing and hardship’: p.48
Distribution of ELSI-3 scores for age groups (2008) 0-17  years 18-24  years 25-44  years 45-64  years 65+  years Source:  Perry (2009) ‘Non-income measures of material wellbeing and hardship’: p.50
Distribution of ELSI-3 scores for family type, under 65 (2008) One person Couple only Sole parent Two parent Source:  Perry (2009) ‘Non-income measures of material wellbeing and hardship’: p.50 40 30 20 10 0
Distribution of ELSI-3 scores by ethnicity, 2008 LSS Source:  Perry (2009) ‘Non-income measures of material wellbeing and hardship’: p.52 Population percentage European Maori Pacific 40 30 20 10 0
Distribution of ELSI-3 scores by ethnicity, 2008 LSS Source:  Perry (2009) ‘Non-income measures of material wellbeing and hardship’: p.52 40 30 20 10 0 Population percentage Other Asian
Child poverty rates (%) in selected European countries, Canada, the US, Mexico and Australia c 2006:  60% of median threshold (BHC) Source:  Perry (2009) ‘Household income in New Zealand 1982-2008’: p.119
20 21 22 22 23 24 24 25 25 25 25 26 26 29 30 34 9 Norway Estonia 10 Denmark Portugal 10 Finland Australia 2003 12 Germany Ireland 12 Iceland Greece 12 Slovenia United Kingdom 14 France Spain  14 Netherlands Lithuania 15 Austria Canada 2004 15 Belgium Hungary 15 Sweden Italy 16 Czech Republic Poland 17 Slovakia Latvia 19 EU-25 average United States 2004 19 New Zealand 2007 Mexico 2004 20 Luxembourg Turkey 2004
Incidence and Severity of Poverty, After Housing Costs NZPMP 61.3% 63.8% 96.7% 95.5% 62.2% 60.2% 78.2% 80.0% Efficiency 848 643 115 146 626 422 1589 1211 Disposable 2191 1778 3438 3222 1654 1059 7283 6059 Market                 Poverty Gap $m 3.2% 0.0% 84.7% 83.7% 11.3% 14.4% 27.5% 31.6% Efficiency 35.0 33.5 10.8 12.3 18.8 16.7 21.9 20.3 Disposable 33.9 33.5 70.6 75.3 21.2 19.5 30.2 29.7 Market 2001 1998 2001 1998 2001 1998 2001 1998 Children 0-18 Adults 65+ Adults 18-64 People Incidence
Incidence, Structure and Severity of Poverty, by Ethnic Status, 2000 NZPMP 60 per cent of Median Equivalent Household Disposable Income Threshold   21.9 35.0 17.6 100.0 100.0 100.0 16.3 23.9 13.8 Total 28.0 39.4 23.9 8.1 7.8 8.3 19.6 25.3 17.6 Other 43.0 54.0 36.8 9.1 10.7 8.3 29.0 34.2 26.1 Pacific 31.4 39.3 27.5 20.6 24.1 18.6 25.6 32.9 22.1 Maori 18.2 31.3 14.5 62.4 57.4 64.7 13.5 20.3 11.6 European Total Child Adult Total Child Adult Total Child Adult Incidence (post-housing) Structure Incidence (pre-housing) Ethnicity
Ethical Issues and Values for Psychologists Weight given to ethical approval applications in research proposals Focus on Codes of Ethics Focus on appropriate relationships with clients Time to consider other power relationships in society and the role of psychologists regarding them Consider the role of psychologists to contribute to the reduction of suffering and injustice in society Culture, gender and socio-economic assumptions to begin with The presumption of neutrality has on occasions made psychologists complicit with mental health cruelty and corporate control
Subfields of Psychology Biological  Biopsychosocial  Clinical  Cognitive  Comparative  Developmental  Educational  Industrial-Organisational  Personality  Social
THERAPISTS/COUSELLORS AND PAIN Therapists and clinicians, as a professional group, are the most informed ‘experts’ of the collective grounded levels of hurt, sadness and pain in modern countries. Those who live in deep pain are of course the primary ‘experts’ in the sadness and hurt they and their communities experience, but therapists and clinicians are the professional helpers who continually witness that pain with many individuals and families and across a variety of communities week after week.
As such they carry a substantial responsibility to identify, quantify and describe the severity and causes of it.  This is ethically essential if they are committed to honouring their client group. They have a responsibility to publish and publicise the causes and outcomes of people’s pain in order that they may be addressed in the public debate and impact on policy.  Good policy in this sense can address issues of wellbeing and inclusion in informed and effective ways, eg income, housing, health, education and employment policies.
Other Examples Educational psychology Industrial psychology Organisational psychology
Poverty Reduction and Psychology The challenge has been laid by peers within our discipline The challenge is of course enormous The challenge has an ethical basis and we have shown in recent years that we are capable rising to difficult ethical challenges Every subfield of psychology has a contribution to make Aotearoa New Zealand will be a much safer, diverse, more inclusive and pleasant country if we can succeed Can we approach this within the profession as a major structural challenge, as we have other challenges and plan achievable goals?

Poverty reduction, Charles Waldegrave

  • 1.
    Poverty Reduction andPsychology Charles Waldegrave The Family Centre Social Policy Research Unit, Lower Hutt, Wellington, New Zealand www.familycentre.org.nz Presentation to New Zealand Psychological Society Annual Conference 2010 Rydges Hotel, Rotorua Tuesday 20 July 2010
  • 2.
    Poverty Reduction andPsychology A global focus in Psychology Journals Express the desire of the psychology community worldwide to give greater focus to the importance of the contribution psychology can and does make to poverty reduction A Special Feature Issue in each participating Journal The idea internationally was to accelerate input from an entire field by psychology journals throughout the world coordinating in a temporal sense around mid 2010 by either producing a special section of papers, or an entire issue of the journal, on the poverty reduction theme.
  • 3.
    Peer-reviewed Journals Participatingin the Initiative Psychology and Developing Societies The Journal of Psychology in Africa The Interamerican Journal of Psychology Journal of Pacific Rim Psychology International Journal of Psychology Applied Psychology: An International Review American Psychologist Journal of Managerial Psychology Journal of Health Psychology New Zealand Journal of Psychology The Australian Psychologist
  • 4.
    Studies on HealthStatus and Inequalities They show a distinct relationship between inequalities in society and physical and mental illhealth. Poorer people die earlier, consistently have the poorest health and the highest hospitalisation rates. Furthermore, when there is an overall improvement in a country’s population health status, the health inequalities do not usually decrease. The evidence is overwhelming.
  • 5.
    INEQUALITIES AND HEALTHBrenner’s research on the effects of economic recession in the USA indicated that a 1% rise in unemployment in a given year is followed by: 6% more admissions into psychiatric hospitals, a 4% rise in suicides, a 4% rise in state prison admissions and 6% more homicides.
  • 6.
    INEQUALITIES AND HEALTHCtd Benzeval, M., Judge, K., & Whitehead, M. (Eds.). (1995). Tackling inequalities in health: An agenda for action, London: King’s Fund. Acheson, Sir, D. (1998). Independent inquiry into inequalities in health. Norwich: Stationary Office. Available from: http://www.archive.official-documents.co.uk/document/doh/ih/contents.htm National Health Committee (1998) The Social, Cultural and Economic Determinants of Health in New Zealand: Action to improve health, Wellington: Ministry of Health Kawachi, I. and Kennedy, B. (2002). The Health of Nations. New York: The New Press. Kawachi, I., and Berkman, L.F. (2003). Neighbourhoods and Health. New York: Oxford University Press.
  • 7.
    INEQUALITIES AND HEALTHCtd Mackenbach, J. (2006). Health inequalities: Europe in profile, An independent, expert report commissioned by the UK Presidency of the EU (February 2006) Ministry of Social Development (2009). The Social Report 2009. Wellington: Ministry of Social Development. Available from: http:// www.socialreport.msd.govt.nz / Wilkinson, R. and Pickett, K. (2009). The Spirit Level: Why more equal societies almost always do better. London: Allen Lane. Marmot, Sir M. (Chair of the Independent Review Commission) (2010). Fair Society, Healthy Lives: The Marmot Review . S trategic review of health inequalities in England post-2010 . London: The Marmot Review, Department of Health. Available from http:// www.ucl.ac.uk/gheg/marmotreview/FairSocietyHealthyLives
  • 8.
    Special Issue ChapterTitles Preventing child poverty: Barriers and solutions The impact of poverty on wellbeing during midlife Ageing in a material world Economic hardship among older people in New Zealand: The effects of low living standards on social support, loneliness, and mental health. Human costs of poverty in Aotearoa Global poverty, aid advertisements and cognition Can poverty drive you mad?   A literature review with clinical and primary prevention implications
  • 9.
    ICAP Conference MelbourneStuart Carr – State of the art address Launch of the global issues initiative Symposium All branches of psychology can contribute – Chris Burt, Ishbel McWha
  • 10.
    Proportion (%) ofthe population in low-income households (60 per cent threshold), by age and sex, selected years, 1986–2008 Source: MSD (2009) ‘Social Report 2009’: p.63 9 12 13 12 20 2008 8 11 13 17 16 2007 7 13 17 22 23 2004 7 14 18 21 29 2001 9 12 18 16 28 1998 8 15 23 20 35 1994 6 6 12 8 16 1990 4 5 8 5 11 1986 65+ 45-64 25-44 18-24 0-17 Year         Children  
  • 11.
    Proportion (%) ofthe population in low-income households (60 per cent threshold), by age and sex, selected years, 1986–2008 cont. Source: MSD (2009) ‘Social Report 2009’: p.63 14 13 11 2008 13 13 11 2007 17 15 15 2004 19 17 14 2001 18 16 13 1998 23 20 17 1994 11 9 8 1990 8 7 5 1986 Total 15+ 15+ Year   Females Males  
  • 12.
    Proportion of householdswith housing cost outgoings-to-income ratio greater than 30 per cent, 1988–2008 Percentage of all households March years 1988-1998: June years from 2001 Source: MSD (2009) ‘Social Report 2009’: p.64 1988 1989 1990 1991 1992 1993 1994 1995 1996 1997 1998 1999 2000 2001 2002 2003 2004 2005 2006 2007 2008 30 25 20 15 10 5 0
  • 13.
    Distribution of ELSI-3scores by ELSI level – whole population (2008) ELSI Levels (1 – 7) Source: Perry (2009) ‘Non-income measures of material wellbeing and hardship’: p.48
  • 14.
    Distribution of ELSI-3scores for age groups (2008) 0-17 years 18-24 years 25-44 years 45-64 years 65+ years Source: Perry (2009) ‘Non-income measures of material wellbeing and hardship’: p.50
  • 15.
    Distribution of ELSI-3scores for family type, under 65 (2008) One person Couple only Sole parent Two parent Source: Perry (2009) ‘Non-income measures of material wellbeing and hardship’: p.50 40 30 20 10 0
  • 16.
    Distribution of ELSI-3scores by ethnicity, 2008 LSS Source: Perry (2009) ‘Non-income measures of material wellbeing and hardship’: p.52 Population percentage European Maori Pacific 40 30 20 10 0
  • 17.
    Distribution of ELSI-3scores by ethnicity, 2008 LSS Source: Perry (2009) ‘Non-income measures of material wellbeing and hardship’: p.52 40 30 20 10 0 Population percentage Other Asian
  • 18.
    Child poverty rates(%) in selected European countries, Canada, the US, Mexico and Australia c 2006: 60% of median threshold (BHC) Source: Perry (2009) ‘Household income in New Zealand 1982-2008’: p.119
  • 19.
    20 21 2222 23 24 24 25 25 25 25 26 26 29 30 34 9 Norway Estonia 10 Denmark Portugal 10 Finland Australia 2003 12 Germany Ireland 12 Iceland Greece 12 Slovenia United Kingdom 14 France Spain 14 Netherlands Lithuania 15 Austria Canada 2004 15 Belgium Hungary 15 Sweden Italy 16 Czech Republic Poland 17 Slovakia Latvia 19 EU-25 average United States 2004 19 New Zealand 2007 Mexico 2004 20 Luxembourg Turkey 2004
  • 20.
    Incidence and Severityof Poverty, After Housing Costs NZPMP 61.3% 63.8% 96.7% 95.5% 62.2% 60.2% 78.2% 80.0% Efficiency 848 643 115 146 626 422 1589 1211 Disposable 2191 1778 3438 3222 1654 1059 7283 6059 Market                 Poverty Gap $m 3.2% 0.0% 84.7% 83.7% 11.3% 14.4% 27.5% 31.6% Efficiency 35.0 33.5 10.8 12.3 18.8 16.7 21.9 20.3 Disposable 33.9 33.5 70.6 75.3 21.2 19.5 30.2 29.7 Market 2001 1998 2001 1998 2001 1998 2001 1998 Children 0-18 Adults 65+ Adults 18-64 People Incidence
  • 21.
    Incidence, Structure andSeverity of Poverty, by Ethnic Status, 2000 NZPMP 60 per cent of Median Equivalent Household Disposable Income Threshold   21.9 35.0 17.6 100.0 100.0 100.0 16.3 23.9 13.8 Total 28.0 39.4 23.9 8.1 7.8 8.3 19.6 25.3 17.6 Other 43.0 54.0 36.8 9.1 10.7 8.3 29.0 34.2 26.1 Pacific 31.4 39.3 27.5 20.6 24.1 18.6 25.6 32.9 22.1 Maori 18.2 31.3 14.5 62.4 57.4 64.7 13.5 20.3 11.6 European Total Child Adult Total Child Adult Total Child Adult Incidence (post-housing) Structure Incidence (pre-housing) Ethnicity
  • 22.
    Incidence, Structure andSeverity of Poverty, by Ethnic Status, 2000 NZPMP 60 per cent of Median Equivalent Household Disposable Income Threshold   21.9 35.0 17.6 100.0 100.0 100.0 16.3 23.9 13.8 Total 28.0 39.4 23.9 8.1 7.8 8.3 19.6 25.3 17.6 Other 43.0 54.0 36.8 9.1 10.7 8.3 29.0 34.2 26.1 Pacific 31.4 39.3 27.5 20.6 24.1 18.6 25.6 32.9 22.1 Maori 18.2 31.3 14.5 62.4 57.4 64.7 13.5 20.3 11.6 European Total Child Adult Total Child Adult Total Child Adult Incidence (post-housing) Structure Incidence (pre-housing) Ethnicity
  • 23.
    Ethical Issues andValues for Psychologists Weight given to ethical approval applications in research proposals Focus on Codes of Ethics Focus on appropriate relationships with clients Time to consider other power relationships in society and the role of psychologists regarding them Consider the role of psychologists to contribute to the reduction of suffering and injustice in society Culture, gender and socio-economic assumptions to begin with The presumption of neutrality has on occasions made psychologists complicit with mental health cruelty and corporate control
  • 24.
    Subfields of PsychologyBiological Biopsychosocial Clinical Cognitive Comparative Developmental Educational Industrial-Organisational Personality Social
  • 25.
    THERAPISTS/COUSELLORS AND PAINTherapists and clinicians, as a professional group, are the most informed ‘experts’ of the collective grounded levels of hurt, sadness and pain in modern countries. Those who live in deep pain are of course the primary ‘experts’ in the sadness and hurt they and their communities experience, but therapists and clinicians are the professional helpers who continually witness that pain with many individuals and families and across a variety of communities week after week.
  • 26.
    As such theycarry a substantial responsibility to identify, quantify and describe the severity and causes of it. This is ethically essential if they are committed to honouring their client group. They have a responsibility to publish and publicise the causes and outcomes of people’s pain in order that they may be addressed in the public debate and impact on policy. Good policy in this sense can address issues of wellbeing and inclusion in informed and effective ways, eg income, housing, health, education and employment policies.
  • 27.
    Other Examples Educationalpsychology Industrial psychology Organisational psychology
  • 28.
    Poverty Reduction andPsychology The challenge has been laid by peers within our discipline The challenge is of course enormous The challenge has an ethical basis and we have shown in recent years that we are capable rising to difficult ethical challenges Every subfield of psychology has a contribution to make Aotearoa New Zealand will be a much safer, diverse, more inclusive and pleasant country if we can succeed Can we approach this within the profession as a major structural challenge, as we have other challenges and plan achievable goals?