SlideShare a Scribd company logo
1 | S m i t h
Jacob Smith
Trout Population Survey by Underwater Videography
ABSTRACT:
As native trout and steelhead populations are declining there is a gap in
the knowledge of how many of these fish are truly left. In Southern California
these fish are as endangered as anywhere else in the world, with only a couple
known watersheds holding genetically wild trout, including the San Gabriel River
system, Santa Ana River, and the San Luis Rey River system(Jacobson et al 2014).
In the San Luis Rey drainage is Pauma Creek, a small extremely healthy trout
stream that has historically had trout of native steelhead lineage.
In order to study these fish this study develops a protocol for using
underwater videography as a method for quantifying population size. This was
done in order to replace the existing methods that are either inaccurate or
detrimental to the fish being studied. Using multiple cameras suspended in
holding pools within Pauma Creek recordings were taken and analyzed to
quantify these imperiled fish. These cameras were used in a way to maximize
the amount of the stream being recorded while still maintaining a lightweight
system that can easily be taken into remote areas of the backcountry. As a
result this study has produced footage that when analyzed has contained more
accurate population data than the other methods used to calibrate it.
2 | S m i t h
INTRODUCTION:
Rainbow trout of the species Oncorhynchus mykiss are naturally occurring
along the Pacific basin, ranging from Alaska through Mexico in cold headwaters,
creeks, small to large rivers, cool lakes, estuaries, and oceans (Staley & Mueller,
2000). Because of their ability to thrive in hatchery environments they have
been introduced all over the United States and even in areas overseas. These
trout are key predators in the habitats that they live in, eating many different
invertebrates and occasionally other fish. The best habitat for them is moving
water that is cool and clean with many different hiding places for them as well as
gravel beds for them to spawn on (Staley & Mueller, 2000).
California is home to 20 endemic salmonids and the vast majority of them
are in decline with studies projecting that 65% of them will be extinct within 100
years (Moyle et al, 2008). These trout have long stood as both economically
valuable due to the recreational fisheries based on them, as well as their
ecological importance to the waters that they live in. Native trout can be used as
a meter stick for the health of a watershed, as healthy populations are typically
found in areas with intact ecological systems (Staley & Mueller, 2000). As factors
such as reduced flows, diversions, sedimentation, pollution, increased
temperatures, migration barriers and invasive species hurt our water supply the
trout populations steadily decline. In Southern California trout habitat is being
lost at an alarming rate as the water they need to survive is being diverted for
3 | S m i t h
human needs and agriculture especially in times of drought. This impacted the
anadromous life history form of rainbow trout called steelhead. The decline in
Southern California Steelhead populations led to the federal listing under the
Endangered Species Act (ESA) of the Southern California Coast steelhead in 1997
from the Santa Maria River at the north end to Malibu Creek at the south end
(NOAA, 2012). Following steelhead sightings and genetic documentation in
watersheds south of Malibu Creek, the geographic boundary was extended
southward to the U.S.-Mexico border in 2002. The listing status of this expanded
region was reaffirmed in 2006 (NOAA, 2012).
Baseline trout population counts are essential parts of restoration efforts
to quantify success of restoration programs. Areas of Southern California that
hold trout are generally in remote areas in pools that are too deep for other
forms of population surveys, and equipment needs to be light for multi-day
backpacking trips to the site.
Trout in these small streams are difficult to get accurate population data
on while not being too stressful on the fish. The protocol under development
here is designed to overcome issues with each of the well-known methods for
quantifying trout populations including electrofishing, netting, and snorkel
survey in deep headwater pools. Electrofishing is a method that involves
introducing an electrical charge to an area with the intention to stun the fish in
which case they will float to the surface to be counted and inspected. For
4 | S m i t h
netting as a population survey, the selected area is netted all the way around
and slowly drawn together as to catch the fish in the confines of the net to be
counted and inspected. Snorkel surveys are taken by one or more person
getting in the water with snorkel gear where they will slowly move through the
area counting individuals as they go.
An issue with these existing methods is that when trout in remote
locations in southern California are surveyed the drawbacks of current methods
are exacerbated both statistically and biologically. This is due to the small
streams in which that they live and the lack of access to them. The fact that the
streams are so small presents an interesting challenge in snorkel surveying as the
fish are extremely skittish in these areas and can avoid being seen by hiding
under banks and behind rocks. The issue with electrofishing this area, besides
the stress it puts on the fish, is the weight of the equipment carried into the
backcountry as it can require additional people to accompany the field crew. It
has been noted that snorkel surveys, though less accurate than electrofishing,
sample a larger proportion of the water which can improve their population
estimates, but to produce data that is more accurate multiple methods can be
used to calibrate the data (Hankin and Reeves, 1988).
A study was done in 2011 using underwater videography and three pass
electrofishing to determine population counts of Eastern Cape redfin,
Pseudobarbus afer, and the Cape kurper, Sandelia capensis, in South Africa
5 | S m i t h
(Ellender et al, 2011). This study recorded underwater video data of these
imperiled fish and analyzed it using maxN statistics, “where relative abundance is
defined as the maximum number of individuals for each species present in the
field of view at the same time” (Ellender et al, 2011). These numbers were
referenced against the three pass electrofishing statistics using various statistical
models to determine if underwater videography was a reasonable alternative to
electrofishing (Ellender et al, 2011). For the Eastern Cape redfin the correlations
between underwater videography and electrofishing were highly significant
while the correlation for Cape kurper was not (Ellender et al, 2011). There are
various behavioral reasons given why the correlation was not as good for the
Caper kurper but for the Eastern Cape redfin the underwater video data
consistently detected a higher abundance of fish than three pass electrofishing.
This led to the conclusion that underwater videography was a viable alternative
to population studies for some species of fish.
Ellender pointed out that a primary prerequisite for studying imperiled
fish was to use the least destructive method possible that still provides accurate
and precise results. Stress, injuries, and mortalities among captured fish during
electrofishing are unavoidable, in Ellender’s study there were instantaneous
mortalities of two individuals of Eastern Cape redfin. This accounted for less
than one percent of the fish sampled by electrofishing. However it was noted
that this number may not be an accurate indication of actual mortality rates
(Ellender et al, 2011). A study of rainbow trout that examined effects of
6 | S m i t h
electrofishing took post capture X-rays showed that over half the fish sampled
had some sort of spinal cord injury and hemorrhages (Snyder, 2003). The
findings of these studies mentioned helped to mold my experiment.
California Trout, or CalTrout, is a nonprofit organization whose mission is
to protect and restore wild trout and other salmonids as well as their native
waters in California. I worked in conjunction with the Southern California region
of the organization and directly with the South Coast Steelhead Coalition
Coordinator, Sandra Jacobson. Southern California is one of the most imperiled
trout fisheries due to groundwater withdrawal and surface water diversions,
urbanization, the presence of invasive species, fish passage barriers, and overall
decreased water quality (Moyle et al, 2008). The Coalition has developed a
Strategic and Implementation Plan aligned with the federal NMFS Southern
California Steelhead Recovery Plan, which is geared towards implementing
projects that restore the endangered steelhead. It further utilizes its diverse
stakeholder base to educate the community through public outreach events.
The goal of my project with CalTrout was to develop a protocol for
deploying appropriate camera equipment to collect population data during fish
and habitat surveys in less than an hour in remote areas, in an approach that
overcomes technical drawbacks of snorkel survey, netting and electrofishing in
terms of accuracy, reproducibility and species identification. The whole project
is centered on the West Fork San Luis Rey River, which has one of the two known
remaining native rainbow trout populations in Southern California.
7 | S m i t h
The majority of the testing was to be done on Pauma Creek, a stream
that is part of the San Luis Rey River systemthough they are now separated by
fish barriers in the watershed. The area tested in Pauma Creek is from Palomar
Mountain down into Pauma Indian Reservation. This creek historically had wild
trout of native coastal steelhead descent (Jacobson et al, 2014). However,
population genetic surveys performed in recent years showed introgression of
hatchery lineage in the upper Pauma Creek population since 1997 (Jacobson et al
2014). It is currently not known whether the lower sections of Pauma still retain
native trout. Much of the water from the San Luis Rey watershed is diverted
away to the City of Escondido at a point upstream of where Pauma Creek enters
the River. Years of water quality testing and fisheries surveys have
demonstrated that this stream is one of the healthiest in San Diego County and is
a prime candidate for augmenting the trout population that currently resides
there, and restoring a steelhead population in Pauma Creek.
This study seeks to develop a protocol using a multicamera systemfor
conducting population surveys using underwater videography. This is done in
order to improve upon the accuracy and portability of the methods of snorkel
surveys and electrofishing currently used in order to protect native trout
populations and maintain healthy stream systems and eventually make these
fish open to recreational fishing again in a more sustainable fashion.
8 | S m i t h
MATERIALS AND METHODS:
Materials:
Once the grant for our project was funded I began researching cameras
by using field of view (FOV), low light capabilities and resolution as the main
factors in the evaluation. These specifications were compared among several
action style cameras that are available on the market. It was also necessary for
the cameras to have high adaptability to the different camera rigs that were
being developed. More research was done on the battery life of the cameras
and the memory that would be needed for long field tests. All of this was done
in conjunction with Sandra Jacobson from Caltrout who was integral in the
logistics of the entire project.
The monetary support for this project came from a grant funded by the
California Wildland Grassroots Fund to the Lead Applicant Trout Unlimited – San
Diego Chapter 920. The concept for this project arose in collaboration with the
Steelhead Coalition coordinator Sandra Jacobson; a Trout Unlimited-San Diego
member Howard Pippen; a regional CDFW fisheries biologist Russell Barabe, and
environmental staff member Jeremy Zagarella with the Pauma Band of Mission
Indians. The small grant for equipment provided enough money for the cameras
and accessories while also being paired with matching funds from Golden State
Flycasters to outfit the underwater robotic device.
9 | S m i t h
The Gopro Hero4 Silver camera was selected and three of them were
purchased. The cameras were purchased by Sandra Jacobson along with three
32 GB micro SD cards and three 64 GB micro SD cards. The micro SD cards
selected were with class 10 speed ratings. To build the multiple camera
configuration three Gopro handlebar clamp mounts were purchased to attach
the cameras. For the body of the camera configuration threaded half inch PVC
sprinkler risers were purchased in assorted lengths from 12-24 inches. To attach
the risers together half inch couplings were purchased one per riser. For the top
and bottom pieces a half inch PVC ‘T’ was bought along with an end cap
respectively. As a float for the top a can float was purchased from a local marine
store. Finally there was cordage purchased to anchor the camera configuration
for the trials. After the unit was assembled the weight of the multiple camera
unit as it would be tested was 22 ounces. A test plan was also written up that
outlined that variables to be tested, resources required, risks assessment, as well
a schedule in the form of a standard Microsoft Project Gantt chart to create a
timeline and resource allocation for the project.
Once the data was collected the cameras memory was uploaded onto a
computer to analyze the video. For best results the videos should be analyzed
on a screen with 1080p capabilities. The video is watched by a minimum of two
people who do not share their findings with each other until after viewing in
order to not bias results. Once these numbers were recorded they could be
compared to the snorkel surveys performed.
10 | S m i t h
The initial series of tests focused on components of the underwater
videography rig. To test portability, weight of the multiple camera rig was
measured. The original tests were based on the battery and memory available
for us on the cameras chosen. The camera tests were repeated in different
capture settings. All cameras were 1080p at different fps settings (frames per
second); 60, 30, and 24 fps.
To test memory and battery life simultaneously, fully charged cameras
were turned on to record until the battery was fully depleted. The videos were
then uploaded to see the file size and length of the video. The battery-depleted
cameras were put on the charger in a standard 120 volt wall outlet and timed
until the red charging indicator light turned off.
For interpreting the video a media player had to be identified that could
play three videos side by side. Online research was done extensively to find a
player that could control the three videos at once and also be able to control
them individually.
The next series of tests was performed collaboratively with Sandra
Jacobson, CalTrout; Russell Barabe of the California Department of Fish and
Wildlife; Dylan Nickerson of CDFW; Howard Pippen of the Golden State
Flycasters and Trout Unlimited; and Jeremy Zagarella of the Pauma Band of
Mission Indians. With the camera configuration in a beta prototype rig we went
to Lake Miramar to test FOV and camera setting issues.
11 | S m i t h
The first field test on May 29, 2015 at Lake Miramar compared the wide
and medium camera angle settings, described on the cameras specifications as
170o and 127o respectively. The camera was set to 1080p and 60fps in the
medium viewing angle and suspended in the lake to 27 inches. Video was taken
as we moved an object that was intended to be a makeshift secchi disk (a tool
used to measure water turbidity as a unit of distance); a Gopro surf-mount plate
that was grey on one side and white on the opposite which we named the “surfie
disk.” The surfie disk away from the camera out to a distance of 20 feet. This
test was repeated in the wide viewing angle and the video was analyzed the next
day.
To determine the blind spots in the camera configuration and to
maximize the cameras’ view of the trout underwater in the streams, further field
of view testing was performed. For the lateral blind spots we ran a test at the
lake in which a pole suspended from a string held at distances of 12, 18, and 24
inches from the lens. An additional test was run to test the horizontal blind
spots in which an object was held in between two cameras, 60o from each
camera, at the center pole and moved away from the cameras until it could be
viewed by both cameras. The video was analyzed in real time using the cameras
wifi enabled mobile application. The range of this wifi was also tested in the lake
by suspending the camera until it lost connection with the mobile application on
an IPad Mini (Figure 1).
12 | S m i t h
Figure 1. Jacob Smith syncingthe Gopro camera’s wifi to an IPad mini on a dock at Lake
Miramar.
To determine vertical GoPro camera rig blind spots and test the
OpenROV robot underwater capabilities, tests were again performed during the
second field test on June 25, 2015 at Lake Miramar. The camera was set to the
wide viewing angle at 1080p and 60fps and suspended to depths of 26 inches, 52
inches, and 87 inches. At each depth the “surfie disk” was brought in one foot
increments, rotating from the white to grey side each foot, until it was at the
pole which the camera was suspended on. This video was analyzed and the
information used to find the actual vertical viewing angle of the camera which
13 | S m i t h
showed the blind spots. The turbidity of the water on this test was also tested
using a secchi disk that was lowered until no longer visible.
Figure 2. The camera rigis made up of 3 Gopro Hero4 cameras arranged around a PVC pipeat
120o increments. This design is to optimize the video coverage of the stream whilemaintaining
the lightestand most packableunitpossible.
To develop the anchor system, an array of different materials that could
possibly be used to keep the cameras stationary in the streams was purchased
and tested. Bailing wire, tent stakes, fishing weights and assorted lengths of
cordage were tested. The first anchor configuration tested was using two
lengths of quarter inch cordage to attach to the top of the float to natural
features on the shore. If there was no suitable place to tie these lines to the
shore then tent stakes could be driven into the ground for tie off. The next
configuration used bailing wire to tie the cordage to river rocks that could then
be used as anchors.
The openROV 2.6 robot, assembled and built by Howard Pippen built
from the openRov 2.6 kit, was tested to run initial tests and gain piloting
experience (Figure 3). The field group tested various hardware variables and
14 | S m i t h
learned the openROV’s capabilities in the lake. When in the lake the openROV
was piloted near fish to see their response and interaction with it.
Figure 3. The openROV robot seen above enabled video footage up to 100 yards away and video
documented areas not be reachableon foot.
The third field test on July 13, 2015 was performed in upper Pauma Creek
near Palomar State Park (Figure 6) Members of the field crew included Russell
Barabe of CDFW, myself and Sandra Jacobson of CalTrout. The objective of this
test was to gather initial information about how to set up the cameras in the
pool, observe trout’s reaction to the camera, and gather sufficient video for
trout population counts. We hiked through the Palomar Conference Center
about one mile to the creek which due to drought conditions had reduced flow
15 | S m i t h
and pool size. We successfully found a pool of sufficient depth (about 26 inches
deep) and visible trout that warranted testing the underwater videography rig.
Figure 4. A trout rises in a pool before being tested in upper Pauma Creek.
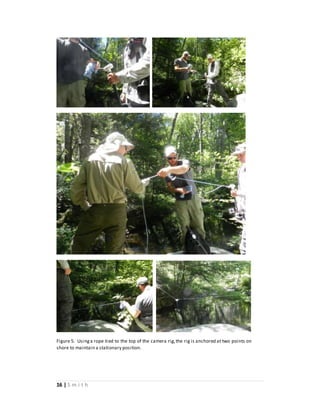
The camera rig was tied to shore using two lengths of rope tied from the
top of rig then onto tree limbs on the banks of the creek. The cameras were
deployed into the center of the pool with subjective discretion involving viewing
obstructions, the depth of the water, and observations of fish locations in the
pool (Figure 5).
16 | S m i t h
Figure 5. Usinga rope tied to the top of the camera rig,the rig is anchored at two points on
shore to maintain a stationary position.
17 | S m i t h
The cameras were placed into the water while recording and were
allowed to record between 15 and 25 minutes while participants were sitting out
of site taking water chemistry measurements. These pools were then allowed to
sit for 5-10 minutes to let the trout readjust.
The fourth field test was performed on July 16 in Pauma Creek in the
middle section of Pauma canyon that has larger pools and more remote terrain.
Members of the field crew included Russell Barabe (CDFW), Dylan Nickerson of
CDFW, and myself. This area had to be reached by an extremely strenuous trail
that used a system of ropes to make a steep descent down to the creek from the
road that was roughly 1000 feet above and under one mile away (Figure 6).
The pools tested were all within a one mile stretch of each other on a
section of Pauma Creek with extremely limited access. The pools ranged from
three by five yards to five by seven yards. A max depth of each pool was also
estimated from 0.3 yards up to two yards in the largest pool tested. Along with
varying sizes and depths the pools also ranged from full sun to partial to near
complete shade from the vegetation canopy. All of the tests were run between
9:45AM and 2:30PM. Two snorkel surveys were performed by different
individuals to use as comparison to the video data.
The fifth field test was performed on July 17 in Pauma Creek in the lower
section on Pauma Indian Reservation, with permission from Pauma Band of
Mission Indians and participation of Jeremy Zagarella, a member of the
18 | S m i t h
environmental staff at Pauma. Members of the field crew included Russell
Barabe of CDFW, Jeremy Zagarella of Pauma environmental staff, Howard
Pippen of Golden State Flycasters, and myself. The objective of this test was to
test the openROV in a deep pool in lower Pauma Creek The openROV was
deployed for roughly an hour in this deep pool and flown in various patterns to
test capabilities. The pool had an estimated size of 12 yards by 10 yards with a
depth of over three yards.
Figure 6. Pauma Creek canyon showingsites of field tests, Palomar Mountain is shown on the
rightand Pauma Indian Reservation on the left (the creek flows rightto left).
Results:
The depletion time for the Gopro batteries while recording was found to
be on average 1 hour and 50 minutes. The total charge time was 1 hour 45
minutes with the original Gopro batteries plugged into the wall outlet. The
19 | S m i t h
charge time using the portable power source was 2 hours 5 minutes. The
underwater wifi capabilities of the Gopro cameras only allowed connection to a
submersion in 1 inch of water.
In the turbidity test for both the medium and the wide FOV settings the
grey side of the “surfie disk” was lost at 18 feet in the lateral direction at a depth
of 27 inches in Lake Miramar. The white side of the disk was never lost in the test
out to 20 feet (Table 1). The test relating depth and lateral viewing ability
showed that at a depth of 10.5 feet there was no impact on the presence of a
fish-like object.
Table 1. The results showfrom testing the camera settings as they relate to the ability to see the
presence of an object at a known depth and distancein Lake Miramar.
The original lateral blind spot test at Lake Miramar was found to be only
partially successful resulting in an estimate of 120o-140o lateral viewing field in
the wide angle and roughly 90o in the medium angle. The second test showed
the lateral blind spots between the cameras went out to 7 inches in the wide
angle and 15 inches in the medium angle. After these tests it was concluded the
wide angle was best for our purposes and the remaining results were all done in
the wide viewing angle.
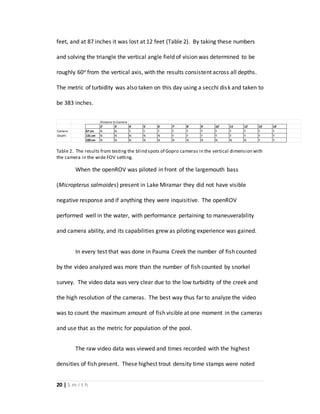
In the vertical blind spot test the first depth of 26 inches precluded view
of the surface object at three feet, at the depth of 52 inches it was lost at six
Results:
Test 1 Measurement: Visibility at either white side (Y or N) or gray side (Y or N) of submerged disk
Distance from camera 4 ft 5 ft 6 ft 7 ft 8 ft 9 ft 10 ft 11 ft 12 ft 13 ft 14 ft 15 ft 16 ft 17 ft 18 ft 19 ft 20 ft
27" depth, med angle Y/Y Y/Y Y/Y Y/Y Y/Y Y/Y Y/Y Y/Y Y/Y Y/Y Y/Y Y/Y Y/Y Y/Y Y/N Y/N Y/N
27" depth, wide angle n/d n/d n/d n/d Y/Y Y/Y Y/Y Y/Y Y/Y Y/Y Y/Y Y/Y Y/Y Y/Y Y/N Y/N Y/N
20 | S m i t h
feet, and at 87 inches it was lost at 12 feet (Table 2). By taking these numbers
and solving the triangle the vertical angle field of vision was determined to be
roughly 60o from the vertical axis, with the results consistent across all depths.
The metric of turbidity was also taken on this day using a secchi disk and taken to
be 383 inches.
Table 2. The results from testing the blind spots of Gopro cameras in the vertical dimension with
the camera in the wide FOV setting.
When the openROV was piloted in front of the largemouth bass
(Micropterus salmoides) present in Lake Miramar they did not have visible
negative response and if anything they were inquisitive. The openROV
performed well in the water, with performance pertaining to maneuverability
and camera ability, and its capabilities grew as piloting experience was gained.
In every test that was done in Pauma Creek the number of fish counted
by the video analyzed was more than the number of fish counted by snorkel
survey. The video data was very clear due to the low turbidity of the creek and
the high resolution of the cameras. The best way thus far to analyze the video
was to count the maximum amount of fish visible at one moment in the cameras
and use that as the metric for population of the pool.
The raw video data was viewed and times recorded with the highest
densities of fish present. These highest trout density time stamps were noted
Distance to Camera
2' 3' 4' 5' 6' 7' 8' 9' 10' 11' 12' 13' 14'
Camera 67 cm N N Y Y Y Y Y Y Y Y Y Y Y
Depth: 131 cm N N N N N Y Y Y Y Y Y Y Y
220 cm N N N N N N N N N N N Y Y
21 | S m i t h
and 5-20 second clips of the videos surrounding the timestamp were then
excised from the full video. This was performed using the Gopro studio
software. This footage was then sent out to the team working on the project
for analysis. Every person recorded the maximum number of fish present at one
time in each clip independently. These numbers are to be reported back to me
so the average can be taken and a population estimate for the pool can be made.
This data is still being processed and the findings will soon give us an idea
of these trout population sizes. My estimate of the initial numbers indicates a
higher population than what was estimated by us while observing the pool
before camera deployment.
DISCUSSION:
A multicamera systemcan effectively be used to gather video
information about trout streams and their populations, though the process of
developing specific methods for data collection and analysis is stillongoing. If
these methods continue to be refined, they will replace less precise methods of
population study and give valuable insight into the population dynamics of these
endangered native fish. This data will ultimately allow for better protection of
the species.
The multitude of FOV tests and blind spot checks gave us a good idea of
the video coverage we have of the pools with the three cameras. The results of
this test show us that we will cover the majority of the pools out to a distance of
22 | S m i t h
20 feet in relatively high resolution. This was important because it allows us to
see the individuals in the stream and avoid double counting the fish by being
able to identify markings and size. The lateral blind spots showed the area lost
was negligible as we don’t expect the trout to approach the cameras in that
close of a range due to their skittish nature. However in the vertical blind spot
test there was a considerable amount of water that is missed by the cameras.
This test proved to be very important in developing the protocol for counting the
trout as it is common behavior for the trout to be near the surface hunting for
food. Because of this there was a decision to be made whether it was more
important for our video to cover more of the surface or of the substrate in the
streams. For our purposes in the warm Southern California summer we decided
to focus the study in the bottom half of the pool where the water may be slightly
cooler.
The simple design of the multiple camera configuration allowed the
system to have optimal portability when travelling into the remote backcountry
trout streams. This was such an integral part of the project as most of the areas
that are remaining in Southern California that have wild trout are in rarely
travelled areas that can be especially difficult to get to. It has been near
impossible to get heavy electrofishing equipment into these areas so accurate
population counts have not been attainable. Trout are very easily spooked so
having something that is so small and portable added to our stealth when
deploying the camera rig.
23 | S m i t h
One of the biggest concerns was how the trout would respond to our
testing equipment in their natural environment. The field tests at Lake Miramar
showed that many largemouth bass were very inquisitive of our cameras and
ROV but quickly adapted to it and swamnearby the camera rig and OpenROV
robot. This is consistent with speculation that bass are a much more curious fish
and studies that indicate different hunting techniques and life cycles than trout.
Pauma Creek where we did our initial testing embodied all of these
factors. The access point used on July 16 to Pauma creek was a trail that covered
almost 1000 vertical feet down to the stream and larger pools to get a more
accurate assessment of population counts. Once we reached the stream it was
flowing at less than 0.5 cubic feet per second. Also every time the water was
disturbed in the majority of these pools the trout would scatter into hiding
places, even doing this before the water was disturbed just by our presence.
However, in deeper sections trout were visible near the camera within one to
two minutes suggesting that they adapt to the camera presence quickly.
The problem of trout skittishness addressed in the tests by allowing the
pools to have a ‘reset period’ before accurate data could be collected after we
had disturbed the pool. When pools containing trout were approached, they
behaved normally until they detected stranger presence, and then swam into
hiding places out of sight. This ‘reset period’ was a five minute rest before we
started the timer on our survey. This decision was made after watching the
24 | S m i t h
preliminary footage of trout streams and seeing the behavior of the fish return
to a more stable and normal behavior in a time of roughly five minutes. This
information allows us to analyze the video more effectively as well by allowing
us to skip through a few minutes of raw data to the point at which the fish have
settled back into more normal behavior. We learned that these fish were also
very variable from one location to the next, theories about why this may be
include the amount of sun that the pool has on it, the depth of the water,
previous human contact, and water flow.
Another reason why this rest period is important in the running of these
tests is because of the silty substrate of this stream. When setting up the
cameras there were times where we would have to step into the water, and it
would kick up a lot sediment into the water column that brought down the
clarity of the water drastically. Because these tests hinged so heavily on visibility
this extra time allowed the water to settle back down and lower the turbidity we
had caused. Another factor that was discovered in this test was how light
conditions affected the camera’s ability to record clear video. It was discovered
that when light was coming towards the camera from overhead the visibility was
cut by more than half. This led to further subjectivity as to where to anchor the
cameras as putting them in a shady or indirect sunlight area was very important
to collecting clear data.
25 | S m i t h
One of the hardest parts of this experiment was finding a way to analyze
the data and quantify it as a number. A method used for quantifying snorkel
surveys and electrofishing is to calculate fish densities (fish/m2) and basin-wide
average density per species (Constable and Suring, 2007). This appears as a good
start to metrics for this study as it is still a work in progress to come up with an
effective method for quantification. Also maxN will be evaluated as this data is
analyzed, by taking stills from the video at increments in order to get an average
maximum of fish in the pool.
Analysis of the raw video data takes a longer than the originally expected
amount of time to analyze. This is due to the process of originally watching the
videos of an average length of 15 minutes then excising the clips of highest
densities followed by an analysis of the video done by a minimum of two people.
This process, though tedious, allows us to get concrete data from an otherwise
meaningless video. Also with extracted clips data can be presented in a much
quicker and more effective process. These clips can easily be circulated
amongst peers to get many peoples input if there is any controversy amongst
the original reviewer’s data. It is a task that most anyone can do and is a good
way to get involvement in a project about fish that need protecting from people
who would otherwise have no idea an issue ever even existed.
The openROV, when tested in Pauma Creek showed the piece of
equipment’s short comings in that environment, as it would be better suited for
26 | S m i t h
a bigger body of water, but also allowed us to capture a few very clear images of
trout in larger pools. Due to the skittish nature of these trout, their response
was very skeptical due to the buzzing of the propellers on the openROV. Beyond
the noise of it, it was difficult to use the camera for population counts because of
the lack of precision in its movements that are expected to be overcome with
the purchase of new components. It seems that there are other potential
applications for the openROV in larger river or estuarine systems that can’t be
accurately surveyed by cameras in a single location. They can also be fitted with
water chemistry sensors to transmit real-time data on water microenvironments
supplemented with visual documentation of aquatic organisms present to
position the systemfor behavioral analysis of aquatic organisms in unstudied
places.
Pauma Creek is currently impacted by drought conditions. This showed
the cameras’ optimal conditions to be used. With the stream being so low, a
majority of the trout were concentrated in the small pools throughout. When
these pools were snorkeled, the amount of sediment that was kicked up by the
diver allowed the fish to hide from sight and get lower count numbers than even
those informally taken when we walked up onto the pool and took note of the
fish visible from the surface.
There are plans to continue this study in Pauma Creek by going back to
the area where we did our testing and electrofishing a small sample of pools as
27 | S m i t h
further control studies. This will be done on pools that were marked with
flagging tape when doing our testing. This will help to calibrate the results that
we got from our video versus the snorkel surveys. Care will be taken to minimize
impact to fish, but is needed to test the accuracy of our protocol.
Underwater videography is the only form of surveying that can be done
without someone present in or around the water which seemed to be an
important part of getting accurate data. With cameras suspended in the water
without anything else to disturb them there is opportunity for more than just
population counts. Much is unknown about trout behavior especially these wild
fish that are disappearing and with these tests we have the rare opportunity to
watch them in their native environments. If this information can be attained, it
could lead to a better understanding of how to protect these fish and their
habitat.
There is hope that this survey study could be used to study the Southern
California Steelhead (Oncorhynchus mykiss) which are an ocean going rainbow
trout that come into fresh water to spawn. These fish have undergone a massive
decline due to fish barriers and declining habitats (Moyle et al, 2008). They are
only found in a couple of streams at this point and are very near extinction
(Jacobson et al, 2014). These fish are native to the San Luis Rey River so their
presence in our study was always thought to have future potential to try to
restore these fish if we can gain more knowledge about them and their habitat.
28 | S m i t h
Figure 7. The Southern Californiasteelhead pictured here is one of the most endangered fish in
the country with a population that has declined an estimated over 90 %( Moyle et al,2008).
CONCLUSION:
In this study I experimented with a new form of population study to be
used on trout in slow moving pools that are located in remote backcountry
areas. This study used GoPro cameras as opposed to electrofishing and snorkel
surveys and is much less harmful to the fish and more accurate in these habitats.
While in the drought conditions that were tested in Pauma Creek, this new
method shows promise as a way to efficiently and accurately collect data while
keeping the stream habitat as pristine as possible. The results have preliminarily
proved this method to be effective and have opened up an avenue to many
future tests. There are plans to take this new protocol into a multitude of
Southern California streams with the hopes of gaining knowledge that will allow
us to better understand and protect native trout and steelhead for the
generations to come.
29 | S m i t h
REFERENCES:
Constable, Jr, R.J. and E. Suring. Smith River Steelhead and Coho Monitoring
Verification Study, 2007. Monitoring Program Report Number OPSW-ODFW-
2009-11, Oregon Department of Fish and Wildlife, Salem
Ellender, B.R., Becker A., Weyl, O.L.F. and E.R. Swartz (2012) Underwater video
analysis as a non-destructive alternative to electrofishing for sampling imperilled
headwater stream fishes. Aquatic Conserv: Mar. Freshw. Ecosyst. 22: pp. 58-65.
Hankin, D. G. and G. H. Reeves. (1988). Estimating total fish abundance and total
habitat area in small streams based on visual estimation methods. Canadian
Journal of Fisheries and Aquatic Sciences 45:834-844.
Jacobson, S., Marshall, J., Dalrymple, D., Kawasaki, F., Pearse, D., Abadia-
Cordoso, A., and J.C. Garza (2014) Genetic Analysis of Trout (Oncorhynchus
mykiss) in Southern California Coastal Rivers and Streams. Final Report for
California Department of Fish and Wildlife, Project No. 0950015.
Moyle, P., Israel, J., Purdy, S. (2008) SOS: California’s Native Fish Crisis. California
Trout. http://caltrout.org/pdf/SoS-Californias-Native-Fish-Crisis.pdf
Snyder, D. E. (2003). Electrofishing and its harmful effects on fish (No.
USGS/BRD/ITR-2003-0002). GEOLOGICAL SURVEY RESTON VA
BIOLOGICALRESOURCES DIV.
Staley, K., Mueller, M. (2000) Rainbow Trout (Oncorhynchus mykiss). United
States Department of Agriculture. Web
http://www.fws.gov/northeast/wssnfh/pdfs/RAINBOW1.pdf

More Related Content

What's hot

JLGASKIN_ISTS_Poster1
JLGASKIN_ISTS_Poster1JLGASKIN_ISTS_Poster1
JLGASKIN_ISTS_Poster1
Jaynie Gaskin
 
Moscicki_David_CV_20160823
Moscicki_David_CV_20160823Moscicki_David_CV_20160823
Moscicki_David_CV_20160823
David Moscicki
 
John Richardson, UBC - Learning How to Protect Water for Environmental and Hu...
John Richardson, UBC - Learning How to Protect Water for Environmental and Hu...John Richardson, UBC - Learning How to Protect Water for Environmental and Hu...
John Richardson, UBC - Learning How to Protect Water for Environmental and Hu...
BC Water Science Symposium
 
Michalak et al 2014 JEZ with COVER
Michalak et al 2014 JEZ with COVERMichalak et al 2014 JEZ with COVER
Michalak et al 2014 JEZ with COVER
Jonathan Velotta
 
article_cherabin
article_cherabinarticle_cherabin
article_cherabin
Angus Smith
 
Abstract_Findabhair_Ni_Fhaolain
Abstract_Findabhair_Ni_FhaolainAbstract_Findabhair_Ni_Fhaolain
Abstract_Findabhair_Ni_Fhaolain
Findabhair N
 
Haemogregarine in turtle
Haemogregarine in turtleHaemogregarine in turtle
Haemogregarine in turtle
Bridget Altman
 
Lavides et al 2016_reef fish disappearances Philippines_Plos One.PDF
Lavides et al 2016_reef fish disappearances Philippines_Plos One.PDFLavides et al 2016_reef fish disappearances Philippines_Plos One.PDF
Lavides et al 2016_reef fish disappearances Philippines_Plos One.PDF
Margarita Lavides
 

What's hot (20)

JLGASKIN_ISTS_Poster1
JLGASKIN_ISTS_Poster1JLGASKIN_ISTS_Poster1
JLGASKIN_ISTS_Poster1
 
The future biogeography of freshwater fishes
The future biogeography of freshwater fishesThe future biogeography of freshwater fishes
The future biogeography of freshwater fishes
 
Moscicki_David_CV_20160823
Moscicki_David_CV_20160823Moscicki_David_CV_20160823
Moscicki_David_CV_20160823
 
THESIS
THESISTHESIS
THESIS
 
John Richardson, UBC - Learning How to Protect Water for Environmental and Hu...
John Richardson, UBC - Learning How to Protect Water for Environmental and Hu...John Richardson, UBC - Learning How to Protect Water for Environmental and Hu...
John Richardson, UBC - Learning How to Protect Water for Environmental and Hu...
 
Predation, habitat use and impact of Pterois
Predation, habitat use and impact of PteroisPredation, habitat use and impact of Pterois
Predation, habitat use and impact of Pterois
 
dietBHposter
dietBHposterdietBHposter
dietBHposter
 
Michalak et al 2014 JEZ with COVER
Michalak et al 2014 JEZ with COVERMichalak et al 2014 JEZ with COVER
Michalak et al 2014 JEZ with COVER
 
Beyond taxonomy: A traits-based approach to fish community ecology
Beyond taxonomy: A traits-based approach to fish community ecology Beyond taxonomy: A traits-based approach to fish community ecology
Beyond taxonomy: A traits-based approach to fish community ecology
 
APS_Vol13-Issue2_48-53_Woody
APS_Vol13-Issue2_48-53_WoodyAPS_Vol13-Issue2_48-53_Woody
APS_Vol13-Issue2_48-53_Woody
 
May2013
May2013May2013
May2013
 
Trophic downgrading of planet earth
Trophic downgrading of planet earthTrophic downgrading of planet earth
Trophic downgrading of planet earth
 
article_cherabin
article_cherabinarticle_cherabin
article_cherabin
 
Vulnerability of lake ecosystems to species invasions in Washington
Vulnerability of lake ecosystems to species invasions in WashingtonVulnerability of lake ecosystems to species invasions in Washington
Vulnerability of lake ecosystems to species invasions in Washington
 
AGould_CV_2016
AGould_CV_2016AGould_CV_2016
AGould_CV_2016
 
Abstract_Findabhair_Ni_Fhaolain
Abstract_Findabhair_Ni_FhaolainAbstract_Findabhair_Ni_Fhaolain
Abstract_Findabhair_Ni_Fhaolain
 
SMSNews
SMSNewsSMSNews
SMSNews
 
A Quantitative Study of the Productivity of the Foraminifera in the Sea
A Quantitative Study of the Productivity of the Foraminifera in the SeaA Quantitative Study of the Productivity of the Foraminifera in the Sea
A Quantitative Study of the Productivity of the Foraminifera in the Sea
 
Haemogregarine in turtle
Haemogregarine in turtleHaemogregarine in turtle
Haemogregarine in turtle
 
Lavides et al 2016_reef fish disappearances Philippines_Plos One.PDF
Lavides et al 2016_reef fish disappearances Philippines_Plos One.PDFLavides et al 2016_reef fish disappearances Philippines_Plos One.PDF
Lavides et al 2016_reef fish disappearances Philippines_Plos One.PDF
 

Viewers also liked

آزمون بسته های نرم افزاری ترم اول
آزمون بسته های نرم افزاری ترم اولآزمون بسته های نرم افزاری ترم اول
آزمون بسته های نرم افزاری ترم اول
minaparsa2
 
Ahmed Ahmed Ali CV
Ahmed Ahmed Ali CVAhmed Ahmed Ali CV
Ahmed Ahmed Ali CV
Ahmed Ali
 

Viewers also liked (13)

Tecnología alberto cartagena
Tecnología alberto cartagenaTecnología alberto cartagena
Tecnología alberto cartagena
 
Carrie Falcone- "Chapters"
Carrie Falcone- "Chapters"Carrie Falcone- "Chapters"
Carrie Falcone- "Chapters"
 
آزمون بسته های نرم افزاری ترم اول
آزمون بسته های نرم افزاری ترم اولآزمون بسته های نرم افزاری ترم اول
آزمون بسته های نرم افزاری ترم اول
 
luis de broglie
luis de broglieluis de broglie
luis de broglie
 
luis de broglie
luis de broglieluis de broglie
luis de broglie
 
آزمون بسته های نرم افزاری ترم اول
آزمون بسته های نرم افزاری ترم اولآزمون بسته های نرم افزاری ترم اول
آزمون بسته های نرم افزاری ترم اول
 
Power of The Inbox
Power of The Inbox Power of The Inbox
Power of The Inbox
 
Calzado aliexpres
Calzado aliexpresCalzado aliexpres
Calzado aliexpres
 
Skype for Business in Healthcare - Continuant
Skype for Business in Healthcare - ContinuantSkype for Business in Healthcare - Continuant
Skype for Business in Healthcare - Continuant
 
selecting effective teaching strategy
selecting effective teaching strategyselecting effective teaching strategy
selecting effective teaching strategy
 
Ahmed Ahmed Ali CV
Ahmed Ahmed Ali CVAhmed Ahmed Ali CV
Ahmed Ahmed Ali CV
 
آزمون بسته های نرم افزاری ترم اول
آزمون بسته های نرم افزاری ترم اولآزمون بسته های نرم افزاری ترم اول
آزمون بسته های نرم افزاری ترم اول
 
Diablada pillareña
Diablada pillareñaDiablada pillareña
Diablada pillareña
 

Similar to UWV draft 3

Darwin_Grouper_34x44 grouper poster - final (1)
Darwin_Grouper_34x44 grouper poster - final (1)Darwin_Grouper_34x44 grouper poster - final (1)
Darwin_Grouper_34x44 grouper poster - final (1)
Margarita Lavides
 
ESYS Symposium Poster
ESYS Symposium Poster ESYS Symposium Poster
ESYS Symposium Poster
Sara Winter
 
BSB Postgrad & Honours Projects
BSB Postgrad & Honours ProjectsBSB Postgrad & Honours Projects
BSB Postgrad & Honours Projects
Murdoch University
 
ENVS 120 Updated FINAL DRAFT
ENVS 120 Updated FINAL DRAFTENVS 120 Updated FINAL DRAFT
ENVS 120 Updated FINAL DRAFT
Michael Maguire
 
AISES-poster influences of lamprey
AISES-poster influences of lampreyAISES-poster influences of lamprey
AISES-poster influences of lamprey
Eva Carl
 
Website update 2012 6-15
Website update 2012 6-15Website update 2012 6-15
Website update 2012 6-15
KerriL
 
Angelica Morales - Final Proposal
Angelica Morales - Final ProposalAngelica Morales - Final Proposal
Angelica Morales - Final Proposal
A. Cathy Morales
 
DouglasFishBull2014
DouglasFishBull2014DouglasFishBull2014
DouglasFishBull2014
Ver Iriarte
 
Joshua Seidman Honors Thesis Rough Draft 2.4 enm
Joshua Seidman Honors Thesis Rough Draft 2.4 enmJoshua Seidman Honors Thesis Rough Draft 2.4 enm
Joshua Seidman Honors Thesis Rough Draft 2.4 enm
Joshua Seidman
 
SPLASH-contract-Report-May08
SPLASH-contract-Report-May08SPLASH-contract-Report-May08
SPLASH-contract-Report-May08
Ver Iriarte
 
One Fish, Two Fish, Blue Crab, Pompano- An Analysis of Marine and Estuarine S...
One Fish, Two Fish, Blue Crab, Pompano- An Analysis of Marine and Estuarine S...One Fish, Two Fish, Blue Crab, Pompano- An Analysis of Marine and Estuarine S...
One Fish, Two Fish, Blue Crab, Pompano- An Analysis of Marine and Estuarine S...
Cody Gramlin
 

Similar to UWV draft 3 (20)

Grimaldo tidal marsh
Grimaldo tidal marshGrimaldo tidal marsh
Grimaldo tidal marsh
 
posterlayoutnew
posterlayoutnewposterlayoutnew
posterlayoutnew
 
Biology And Conservation Of The California Tiger Salamander Revised 2009
Biology And Conservation Of The California Tiger Salamander Revised 2009Biology And Conservation Of The California Tiger Salamander Revised 2009
Biology And Conservation Of The California Tiger Salamander Revised 2009
 
Darwin_Grouper_34x44 grouper poster - final (1)
Darwin_Grouper_34x44 grouper poster - final (1)Darwin_Grouper_34x44 grouper poster - final (1)
Darwin_Grouper_34x44 grouper poster - final (1)
 
ESYS Symposium Poster
ESYS Symposium Poster ESYS Symposium Poster
ESYS Symposium Poster
 
BSB Postgrad & Honours Projects
BSB Postgrad & Honours ProjectsBSB Postgrad & Honours Projects
BSB Postgrad & Honours Projects
 
ENVS 120 Updated FINAL DRAFT
ENVS 120 Updated FINAL DRAFTENVS 120 Updated FINAL DRAFT
ENVS 120 Updated FINAL DRAFT
 
Freshwater Matters from the FBA
Freshwater Matters from the FBAFreshwater Matters from the FBA
Freshwater Matters from the FBA
 
AISES-poster influences of lamprey
AISES-poster influences of lampreyAISES-poster influences of lamprey
AISES-poster influences of lamprey
 
Website update 2012 6-15
Website update 2012 6-15Website update 2012 6-15
Website update 2012 6-15
 
CCW conference: Protecting Susquehanna and impacts on jobs
CCW conference: Protecting Susquehanna and impacts on jobsCCW conference: Protecting Susquehanna and impacts on jobs
CCW conference: Protecting Susquehanna and impacts on jobs
 
Angelica Morales - Final Proposal
Angelica Morales - Final ProposalAngelica Morales - Final Proposal
Angelica Morales - Final Proposal
 
DR-Meg du Bray final
DR-Meg du Bray finalDR-Meg du Bray final
DR-Meg du Bray final
 
Freshwater matters Nov 2015
Freshwater matters Nov 2015 Freshwater matters Nov 2015
Freshwater matters Nov 2015
 
DouglasFishBull2014
DouglasFishBull2014DouglasFishBull2014
DouglasFishBull2014
 
Carl LoBue, "TNC’s shellfish restoration efforts on Long Island NY: Achieveme...
Carl LoBue, "TNC’s shellfish restoration efforts on Long Island NY: Achieveme...Carl LoBue, "TNC’s shellfish restoration efforts on Long Island NY: Achieveme...
Carl LoBue, "TNC’s shellfish restoration efforts on Long Island NY: Achieveme...
 
Joshua Seidman Honors Thesis Rough Draft 2.4 enm
Joshua Seidman Honors Thesis Rough Draft 2.4 enmJoshua Seidman Honors Thesis Rough Draft 2.4 enm
Joshua Seidman Honors Thesis Rough Draft 2.4 enm
 
DSK thesis final 1 4 16
DSK thesis final 1 4 16DSK thesis final 1 4 16
DSK thesis final 1 4 16
 
SPLASH-contract-Report-May08
SPLASH-contract-Report-May08SPLASH-contract-Report-May08
SPLASH-contract-Report-May08
 
One Fish, Two Fish, Blue Crab, Pompano- An Analysis of Marine and Estuarine S...
One Fish, Two Fish, Blue Crab, Pompano- An Analysis of Marine and Estuarine S...One Fish, Two Fish, Blue Crab, Pompano- An Analysis of Marine and Estuarine S...
One Fish, Two Fish, Blue Crab, Pompano- An Analysis of Marine and Estuarine S...
 

UWV draft 3

  • 1. 1 | S m i t h Jacob Smith Trout Population Survey by Underwater Videography ABSTRACT: As native trout and steelhead populations are declining there is a gap in the knowledge of how many of these fish are truly left. In Southern California these fish are as endangered as anywhere else in the world, with only a couple known watersheds holding genetically wild trout, including the San Gabriel River system, Santa Ana River, and the San Luis Rey River system(Jacobson et al 2014). In the San Luis Rey drainage is Pauma Creek, a small extremely healthy trout stream that has historically had trout of native steelhead lineage. In order to study these fish this study develops a protocol for using underwater videography as a method for quantifying population size. This was done in order to replace the existing methods that are either inaccurate or detrimental to the fish being studied. Using multiple cameras suspended in holding pools within Pauma Creek recordings were taken and analyzed to quantify these imperiled fish. These cameras were used in a way to maximize the amount of the stream being recorded while still maintaining a lightweight system that can easily be taken into remote areas of the backcountry. As a result this study has produced footage that when analyzed has contained more accurate population data than the other methods used to calibrate it.
  • 2. 2 | S m i t h INTRODUCTION: Rainbow trout of the species Oncorhynchus mykiss are naturally occurring along the Pacific basin, ranging from Alaska through Mexico in cold headwaters, creeks, small to large rivers, cool lakes, estuaries, and oceans (Staley & Mueller, 2000). Because of their ability to thrive in hatchery environments they have been introduced all over the United States and even in areas overseas. These trout are key predators in the habitats that they live in, eating many different invertebrates and occasionally other fish. The best habitat for them is moving water that is cool and clean with many different hiding places for them as well as gravel beds for them to spawn on (Staley & Mueller, 2000). California is home to 20 endemic salmonids and the vast majority of them are in decline with studies projecting that 65% of them will be extinct within 100 years (Moyle et al, 2008). These trout have long stood as both economically valuable due to the recreational fisheries based on them, as well as their ecological importance to the waters that they live in. Native trout can be used as a meter stick for the health of a watershed, as healthy populations are typically found in areas with intact ecological systems (Staley & Mueller, 2000). As factors such as reduced flows, diversions, sedimentation, pollution, increased temperatures, migration barriers and invasive species hurt our water supply the trout populations steadily decline. In Southern California trout habitat is being lost at an alarming rate as the water they need to survive is being diverted for
  • 3. 3 | S m i t h human needs and agriculture especially in times of drought. This impacted the anadromous life history form of rainbow trout called steelhead. The decline in Southern California Steelhead populations led to the federal listing under the Endangered Species Act (ESA) of the Southern California Coast steelhead in 1997 from the Santa Maria River at the north end to Malibu Creek at the south end (NOAA, 2012). Following steelhead sightings and genetic documentation in watersheds south of Malibu Creek, the geographic boundary was extended southward to the U.S.-Mexico border in 2002. The listing status of this expanded region was reaffirmed in 2006 (NOAA, 2012). Baseline trout population counts are essential parts of restoration efforts to quantify success of restoration programs. Areas of Southern California that hold trout are generally in remote areas in pools that are too deep for other forms of population surveys, and equipment needs to be light for multi-day backpacking trips to the site. Trout in these small streams are difficult to get accurate population data on while not being too stressful on the fish. The protocol under development here is designed to overcome issues with each of the well-known methods for quantifying trout populations including electrofishing, netting, and snorkel survey in deep headwater pools. Electrofishing is a method that involves introducing an electrical charge to an area with the intention to stun the fish in which case they will float to the surface to be counted and inspected. For
  • 4. 4 | S m i t h netting as a population survey, the selected area is netted all the way around and slowly drawn together as to catch the fish in the confines of the net to be counted and inspected. Snorkel surveys are taken by one or more person getting in the water with snorkel gear where they will slowly move through the area counting individuals as they go. An issue with these existing methods is that when trout in remote locations in southern California are surveyed the drawbacks of current methods are exacerbated both statistically and biologically. This is due to the small streams in which that they live and the lack of access to them. The fact that the streams are so small presents an interesting challenge in snorkel surveying as the fish are extremely skittish in these areas and can avoid being seen by hiding under banks and behind rocks. The issue with electrofishing this area, besides the stress it puts on the fish, is the weight of the equipment carried into the backcountry as it can require additional people to accompany the field crew. It has been noted that snorkel surveys, though less accurate than electrofishing, sample a larger proportion of the water which can improve their population estimates, but to produce data that is more accurate multiple methods can be used to calibrate the data (Hankin and Reeves, 1988). A study was done in 2011 using underwater videography and three pass electrofishing to determine population counts of Eastern Cape redfin, Pseudobarbus afer, and the Cape kurper, Sandelia capensis, in South Africa
  • 5. 5 | S m i t h (Ellender et al, 2011). This study recorded underwater video data of these imperiled fish and analyzed it using maxN statistics, “where relative abundance is defined as the maximum number of individuals for each species present in the field of view at the same time” (Ellender et al, 2011). These numbers were referenced against the three pass electrofishing statistics using various statistical models to determine if underwater videography was a reasonable alternative to electrofishing (Ellender et al, 2011). For the Eastern Cape redfin the correlations between underwater videography and electrofishing were highly significant while the correlation for Cape kurper was not (Ellender et al, 2011). There are various behavioral reasons given why the correlation was not as good for the Caper kurper but for the Eastern Cape redfin the underwater video data consistently detected a higher abundance of fish than three pass electrofishing. This led to the conclusion that underwater videography was a viable alternative to population studies for some species of fish. Ellender pointed out that a primary prerequisite for studying imperiled fish was to use the least destructive method possible that still provides accurate and precise results. Stress, injuries, and mortalities among captured fish during electrofishing are unavoidable, in Ellender’s study there were instantaneous mortalities of two individuals of Eastern Cape redfin. This accounted for less than one percent of the fish sampled by electrofishing. However it was noted that this number may not be an accurate indication of actual mortality rates (Ellender et al, 2011). A study of rainbow trout that examined effects of
  • 6. 6 | S m i t h electrofishing took post capture X-rays showed that over half the fish sampled had some sort of spinal cord injury and hemorrhages (Snyder, 2003). The findings of these studies mentioned helped to mold my experiment. California Trout, or CalTrout, is a nonprofit organization whose mission is to protect and restore wild trout and other salmonids as well as their native waters in California. I worked in conjunction with the Southern California region of the organization and directly with the South Coast Steelhead Coalition Coordinator, Sandra Jacobson. Southern California is one of the most imperiled trout fisheries due to groundwater withdrawal and surface water diversions, urbanization, the presence of invasive species, fish passage barriers, and overall decreased water quality (Moyle et al, 2008). The Coalition has developed a Strategic and Implementation Plan aligned with the federal NMFS Southern California Steelhead Recovery Plan, which is geared towards implementing projects that restore the endangered steelhead. It further utilizes its diverse stakeholder base to educate the community through public outreach events. The goal of my project with CalTrout was to develop a protocol for deploying appropriate camera equipment to collect population data during fish and habitat surveys in less than an hour in remote areas, in an approach that overcomes technical drawbacks of snorkel survey, netting and electrofishing in terms of accuracy, reproducibility and species identification. The whole project is centered on the West Fork San Luis Rey River, which has one of the two known remaining native rainbow trout populations in Southern California.
  • 7. 7 | S m i t h The majority of the testing was to be done on Pauma Creek, a stream that is part of the San Luis Rey River systemthough they are now separated by fish barriers in the watershed. The area tested in Pauma Creek is from Palomar Mountain down into Pauma Indian Reservation. This creek historically had wild trout of native coastal steelhead descent (Jacobson et al, 2014). However, population genetic surveys performed in recent years showed introgression of hatchery lineage in the upper Pauma Creek population since 1997 (Jacobson et al 2014). It is currently not known whether the lower sections of Pauma still retain native trout. Much of the water from the San Luis Rey watershed is diverted away to the City of Escondido at a point upstream of where Pauma Creek enters the River. Years of water quality testing and fisheries surveys have demonstrated that this stream is one of the healthiest in San Diego County and is a prime candidate for augmenting the trout population that currently resides there, and restoring a steelhead population in Pauma Creek. This study seeks to develop a protocol using a multicamera systemfor conducting population surveys using underwater videography. This is done in order to improve upon the accuracy and portability of the methods of snorkel surveys and electrofishing currently used in order to protect native trout populations and maintain healthy stream systems and eventually make these fish open to recreational fishing again in a more sustainable fashion.
  • 8. 8 | S m i t h MATERIALS AND METHODS: Materials: Once the grant for our project was funded I began researching cameras by using field of view (FOV), low light capabilities and resolution as the main factors in the evaluation. These specifications were compared among several action style cameras that are available on the market. It was also necessary for the cameras to have high adaptability to the different camera rigs that were being developed. More research was done on the battery life of the cameras and the memory that would be needed for long field tests. All of this was done in conjunction with Sandra Jacobson from Caltrout who was integral in the logistics of the entire project. The monetary support for this project came from a grant funded by the California Wildland Grassroots Fund to the Lead Applicant Trout Unlimited – San Diego Chapter 920. The concept for this project arose in collaboration with the Steelhead Coalition coordinator Sandra Jacobson; a Trout Unlimited-San Diego member Howard Pippen; a regional CDFW fisheries biologist Russell Barabe, and environmental staff member Jeremy Zagarella with the Pauma Band of Mission Indians. The small grant for equipment provided enough money for the cameras and accessories while also being paired with matching funds from Golden State Flycasters to outfit the underwater robotic device.
  • 9. 9 | S m i t h The Gopro Hero4 Silver camera was selected and three of them were purchased. The cameras were purchased by Sandra Jacobson along with three 32 GB micro SD cards and three 64 GB micro SD cards. The micro SD cards selected were with class 10 speed ratings. To build the multiple camera configuration three Gopro handlebar clamp mounts were purchased to attach the cameras. For the body of the camera configuration threaded half inch PVC sprinkler risers were purchased in assorted lengths from 12-24 inches. To attach the risers together half inch couplings were purchased one per riser. For the top and bottom pieces a half inch PVC ‘T’ was bought along with an end cap respectively. As a float for the top a can float was purchased from a local marine store. Finally there was cordage purchased to anchor the camera configuration for the trials. After the unit was assembled the weight of the multiple camera unit as it would be tested was 22 ounces. A test plan was also written up that outlined that variables to be tested, resources required, risks assessment, as well a schedule in the form of a standard Microsoft Project Gantt chart to create a timeline and resource allocation for the project. Once the data was collected the cameras memory was uploaded onto a computer to analyze the video. For best results the videos should be analyzed on a screen with 1080p capabilities. The video is watched by a minimum of two people who do not share their findings with each other until after viewing in order to not bias results. Once these numbers were recorded they could be compared to the snorkel surveys performed.
  • 10. 10 | S m i t h The initial series of tests focused on components of the underwater videography rig. To test portability, weight of the multiple camera rig was measured. The original tests were based on the battery and memory available for us on the cameras chosen. The camera tests were repeated in different capture settings. All cameras were 1080p at different fps settings (frames per second); 60, 30, and 24 fps. To test memory and battery life simultaneously, fully charged cameras were turned on to record until the battery was fully depleted. The videos were then uploaded to see the file size and length of the video. The battery-depleted cameras were put on the charger in a standard 120 volt wall outlet and timed until the red charging indicator light turned off. For interpreting the video a media player had to be identified that could play three videos side by side. Online research was done extensively to find a player that could control the three videos at once and also be able to control them individually. The next series of tests was performed collaboratively with Sandra Jacobson, CalTrout; Russell Barabe of the California Department of Fish and Wildlife; Dylan Nickerson of CDFW; Howard Pippen of the Golden State Flycasters and Trout Unlimited; and Jeremy Zagarella of the Pauma Band of Mission Indians. With the camera configuration in a beta prototype rig we went to Lake Miramar to test FOV and camera setting issues.
  • 11. 11 | S m i t h The first field test on May 29, 2015 at Lake Miramar compared the wide and medium camera angle settings, described on the cameras specifications as 170o and 127o respectively. The camera was set to 1080p and 60fps in the medium viewing angle and suspended in the lake to 27 inches. Video was taken as we moved an object that was intended to be a makeshift secchi disk (a tool used to measure water turbidity as a unit of distance); a Gopro surf-mount plate that was grey on one side and white on the opposite which we named the “surfie disk.” The surfie disk away from the camera out to a distance of 20 feet. This test was repeated in the wide viewing angle and the video was analyzed the next day. To determine the blind spots in the camera configuration and to maximize the cameras’ view of the trout underwater in the streams, further field of view testing was performed. For the lateral blind spots we ran a test at the lake in which a pole suspended from a string held at distances of 12, 18, and 24 inches from the lens. An additional test was run to test the horizontal blind spots in which an object was held in between two cameras, 60o from each camera, at the center pole and moved away from the cameras until it could be viewed by both cameras. The video was analyzed in real time using the cameras wifi enabled mobile application. The range of this wifi was also tested in the lake by suspending the camera until it lost connection with the mobile application on an IPad Mini (Figure 1).
  • 12. 12 | S m i t h Figure 1. Jacob Smith syncingthe Gopro camera’s wifi to an IPad mini on a dock at Lake Miramar. To determine vertical GoPro camera rig blind spots and test the OpenROV robot underwater capabilities, tests were again performed during the second field test on June 25, 2015 at Lake Miramar. The camera was set to the wide viewing angle at 1080p and 60fps and suspended to depths of 26 inches, 52 inches, and 87 inches. At each depth the “surfie disk” was brought in one foot increments, rotating from the white to grey side each foot, until it was at the pole which the camera was suspended on. This video was analyzed and the information used to find the actual vertical viewing angle of the camera which
  • 13. 13 | S m i t h showed the blind spots. The turbidity of the water on this test was also tested using a secchi disk that was lowered until no longer visible. Figure 2. The camera rigis made up of 3 Gopro Hero4 cameras arranged around a PVC pipeat 120o increments. This design is to optimize the video coverage of the stream whilemaintaining the lightestand most packableunitpossible. To develop the anchor system, an array of different materials that could possibly be used to keep the cameras stationary in the streams was purchased and tested. Bailing wire, tent stakes, fishing weights and assorted lengths of cordage were tested. The first anchor configuration tested was using two lengths of quarter inch cordage to attach to the top of the float to natural features on the shore. If there was no suitable place to tie these lines to the shore then tent stakes could be driven into the ground for tie off. The next configuration used bailing wire to tie the cordage to river rocks that could then be used as anchors. The openROV 2.6 robot, assembled and built by Howard Pippen built from the openRov 2.6 kit, was tested to run initial tests and gain piloting experience (Figure 3). The field group tested various hardware variables and
  • 14. 14 | S m i t h learned the openROV’s capabilities in the lake. When in the lake the openROV was piloted near fish to see their response and interaction with it. Figure 3. The openROV robot seen above enabled video footage up to 100 yards away and video documented areas not be reachableon foot. The third field test on July 13, 2015 was performed in upper Pauma Creek near Palomar State Park (Figure 6) Members of the field crew included Russell Barabe of CDFW, myself and Sandra Jacobson of CalTrout. The objective of this test was to gather initial information about how to set up the cameras in the pool, observe trout’s reaction to the camera, and gather sufficient video for trout population counts. We hiked through the Palomar Conference Center about one mile to the creek which due to drought conditions had reduced flow
  • 15. 15 | S m i t h and pool size. We successfully found a pool of sufficient depth (about 26 inches deep) and visible trout that warranted testing the underwater videography rig. Figure 4. A trout rises in a pool before being tested in upper Pauma Creek. The camera rig was tied to shore using two lengths of rope tied from the top of rig then onto tree limbs on the banks of the creek. The cameras were deployed into the center of the pool with subjective discretion involving viewing obstructions, the depth of the water, and observations of fish locations in the pool (Figure 5).
  • 16. 16 | S m i t h Figure 5. Usinga rope tied to the top of the camera rig,the rig is anchored at two points on shore to maintain a stationary position.
  • 17. 17 | S m i t h The cameras were placed into the water while recording and were allowed to record between 15 and 25 minutes while participants were sitting out of site taking water chemistry measurements. These pools were then allowed to sit for 5-10 minutes to let the trout readjust. The fourth field test was performed on July 16 in Pauma Creek in the middle section of Pauma canyon that has larger pools and more remote terrain. Members of the field crew included Russell Barabe (CDFW), Dylan Nickerson of CDFW, and myself. This area had to be reached by an extremely strenuous trail that used a system of ropes to make a steep descent down to the creek from the road that was roughly 1000 feet above and under one mile away (Figure 6). The pools tested were all within a one mile stretch of each other on a section of Pauma Creek with extremely limited access. The pools ranged from three by five yards to five by seven yards. A max depth of each pool was also estimated from 0.3 yards up to two yards in the largest pool tested. Along with varying sizes and depths the pools also ranged from full sun to partial to near complete shade from the vegetation canopy. All of the tests were run between 9:45AM and 2:30PM. Two snorkel surveys were performed by different individuals to use as comparison to the video data. The fifth field test was performed on July 17 in Pauma Creek in the lower section on Pauma Indian Reservation, with permission from Pauma Band of Mission Indians and participation of Jeremy Zagarella, a member of the
  • 18. 18 | S m i t h environmental staff at Pauma. Members of the field crew included Russell Barabe of CDFW, Jeremy Zagarella of Pauma environmental staff, Howard Pippen of Golden State Flycasters, and myself. The objective of this test was to test the openROV in a deep pool in lower Pauma Creek The openROV was deployed for roughly an hour in this deep pool and flown in various patterns to test capabilities. The pool had an estimated size of 12 yards by 10 yards with a depth of over three yards. Figure 6. Pauma Creek canyon showingsites of field tests, Palomar Mountain is shown on the rightand Pauma Indian Reservation on the left (the creek flows rightto left). Results: The depletion time for the Gopro batteries while recording was found to be on average 1 hour and 50 minutes. The total charge time was 1 hour 45 minutes with the original Gopro batteries plugged into the wall outlet. The
  • 19. 19 | S m i t h charge time using the portable power source was 2 hours 5 minutes. The underwater wifi capabilities of the Gopro cameras only allowed connection to a submersion in 1 inch of water. In the turbidity test for both the medium and the wide FOV settings the grey side of the “surfie disk” was lost at 18 feet in the lateral direction at a depth of 27 inches in Lake Miramar. The white side of the disk was never lost in the test out to 20 feet (Table 1). The test relating depth and lateral viewing ability showed that at a depth of 10.5 feet there was no impact on the presence of a fish-like object. Table 1. The results showfrom testing the camera settings as they relate to the ability to see the presence of an object at a known depth and distancein Lake Miramar. The original lateral blind spot test at Lake Miramar was found to be only partially successful resulting in an estimate of 120o-140o lateral viewing field in the wide angle and roughly 90o in the medium angle. The second test showed the lateral blind spots between the cameras went out to 7 inches in the wide angle and 15 inches in the medium angle. After these tests it was concluded the wide angle was best for our purposes and the remaining results were all done in the wide viewing angle. In the vertical blind spot test the first depth of 26 inches precluded view of the surface object at three feet, at the depth of 52 inches it was lost at six Results: Test 1 Measurement: Visibility at either white side (Y or N) or gray side (Y or N) of submerged disk Distance from camera 4 ft 5 ft 6 ft 7 ft 8 ft 9 ft 10 ft 11 ft 12 ft 13 ft 14 ft 15 ft 16 ft 17 ft 18 ft 19 ft 20 ft 27" depth, med angle Y/Y Y/Y Y/Y Y/Y Y/Y Y/Y Y/Y Y/Y Y/Y Y/Y Y/Y Y/Y Y/Y Y/Y Y/N Y/N Y/N 27" depth, wide angle n/d n/d n/d n/d Y/Y Y/Y Y/Y Y/Y Y/Y Y/Y Y/Y Y/Y Y/Y Y/Y Y/N Y/N Y/N
  • 20. 20 | S m i t h feet, and at 87 inches it was lost at 12 feet (Table 2). By taking these numbers and solving the triangle the vertical angle field of vision was determined to be roughly 60o from the vertical axis, with the results consistent across all depths. The metric of turbidity was also taken on this day using a secchi disk and taken to be 383 inches. Table 2. The results from testing the blind spots of Gopro cameras in the vertical dimension with the camera in the wide FOV setting. When the openROV was piloted in front of the largemouth bass (Micropterus salmoides) present in Lake Miramar they did not have visible negative response and if anything they were inquisitive. The openROV performed well in the water, with performance pertaining to maneuverability and camera ability, and its capabilities grew as piloting experience was gained. In every test that was done in Pauma Creek the number of fish counted by the video analyzed was more than the number of fish counted by snorkel survey. The video data was very clear due to the low turbidity of the creek and the high resolution of the cameras. The best way thus far to analyze the video was to count the maximum amount of fish visible at one moment in the cameras and use that as the metric for population of the pool. The raw video data was viewed and times recorded with the highest densities of fish present. These highest trout density time stamps were noted Distance to Camera 2' 3' 4' 5' 6' 7' 8' 9' 10' 11' 12' 13' 14' Camera 67 cm N N Y Y Y Y Y Y Y Y Y Y Y Depth: 131 cm N N N N N Y Y Y Y Y Y Y Y 220 cm N N N N N N N N N N N Y Y
  • 21. 21 | S m i t h and 5-20 second clips of the videos surrounding the timestamp were then excised from the full video. This was performed using the Gopro studio software. This footage was then sent out to the team working on the project for analysis. Every person recorded the maximum number of fish present at one time in each clip independently. These numbers are to be reported back to me so the average can be taken and a population estimate for the pool can be made. This data is still being processed and the findings will soon give us an idea of these trout population sizes. My estimate of the initial numbers indicates a higher population than what was estimated by us while observing the pool before camera deployment. DISCUSSION: A multicamera systemcan effectively be used to gather video information about trout streams and their populations, though the process of developing specific methods for data collection and analysis is stillongoing. If these methods continue to be refined, they will replace less precise methods of population study and give valuable insight into the population dynamics of these endangered native fish. This data will ultimately allow for better protection of the species. The multitude of FOV tests and blind spot checks gave us a good idea of the video coverage we have of the pools with the three cameras. The results of this test show us that we will cover the majority of the pools out to a distance of
  • 22. 22 | S m i t h 20 feet in relatively high resolution. This was important because it allows us to see the individuals in the stream and avoid double counting the fish by being able to identify markings and size. The lateral blind spots showed the area lost was negligible as we don’t expect the trout to approach the cameras in that close of a range due to their skittish nature. However in the vertical blind spot test there was a considerable amount of water that is missed by the cameras. This test proved to be very important in developing the protocol for counting the trout as it is common behavior for the trout to be near the surface hunting for food. Because of this there was a decision to be made whether it was more important for our video to cover more of the surface or of the substrate in the streams. For our purposes in the warm Southern California summer we decided to focus the study in the bottom half of the pool where the water may be slightly cooler. The simple design of the multiple camera configuration allowed the system to have optimal portability when travelling into the remote backcountry trout streams. This was such an integral part of the project as most of the areas that are remaining in Southern California that have wild trout are in rarely travelled areas that can be especially difficult to get to. It has been near impossible to get heavy electrofishing equipment into these areas so accurate population counts have not been attainable. Trout are very easily spooked so having something that is so small and portable added to our stealth when deploying the camera rig.
  • 23. 23 | S m i t h One of the biggest concerns was how the trout would respond to our testing equipment in their natural environment. The field tests at Lake Miramar showed that many largemouth bass were very inquisitive of our cameras and ROV but quickly adapted to it and swamnearby the camera rig and OpenROV robot. This is consistent with speculation that bass are a much more curious fish and studies that indicate different hunting techniques and life cycles than trout. Pauma Creek where we did our initial testing embodied all of these factors. The access point used on July 16 to Pauma creek was a trail that covered almost 1000 vertical feet down to the stream and larger pools to get a more accurate assessment of population counts. Once we reached the stream it was flowing at less than 0.5 cubic feet per second. Also every time the water was disturbed in the majority of these pools the trout would scatter into hiding places, even doing this before the water was disturbed just by our presence. However, in deeper sections trout were visible near the camera within one to two minutes suggesting that they adapt to the camera presence quickly. The problem of trout skittishness addressed in the tests by allowing the pools to have a ‘reset period’ before accurate data could be collected after we had disturbed the pool. When pools containing trout were approached, they behaved normally until they detected stranger presence, and then swam into hiding places out of sight. This ‘reset period’ was a five minute rest before we started the timer on our survey. This decision was made after watching the
  • 24. 24 | S m i t h preliminary footage of trout streams and seeing the behavior of the fish return to a more stable and normal behavior in a time of roughly five minutes. This information allows us to analyze the video more effectively as well by allowing us to skip through a few minutes of raw data to the point at which the fish have settled back into more normal behavior. We learned that these fish were also very variable from one location to the next, theories about why this may be include the amount of sun that the pool has on it, the depth of the water, previous human contact, and water flow. Another reason why this rest period is important in the running of these tests is because of the silty substrate of this stream. When setting up the cameras there were times where we would have to step into the water, and it would kick up a lot sediment into the water column that brought down the clarity of the water drastically. Because these tests hinged so heavily on visibility this extra time allowed the water to settle back down and lower the turbidity we had caused. Another factor that was discovered in this test was how light conditions affected the camera’s ability to record clear video. It was discovered that when light was coming towards the camera from overhead the visibility was cut by more than half. This led to further subjectivity as to where to anchor the cameras as putting them in a shady or indirect sunlight area was very important to collecting clear data.
  • 25. 25 | S m i t h One of the hardest parts of this experiment was finding a way to analyze the data and quantify it as a number. A method used for quantifying snorkel surveys and electrofishing is to calculate fish densities (fish/m2) and basin-wide average density per species (Constable and Suring, 2007). This appears as a good start to metrics for this study as it is still a work in progress to come up with an effective method for quantification. Also maxN will be evaluated as this data is analyzed, by taking stills from the video at increments in order to get an average maximum of fish in the pool. Analysis of the raw video data takes a longer than the originally expected amount of time to analyze. This is due to the process of originally watching the videos of an average length of 15 minutes then excising the clips of highest densities followed by an analysis of the video done by a minimum of two people. This process, though tedious, allows us to get concrete data from an otherwise meaningless video. Also with extracted clips data can be presented in a much quicker and more effective process. These clips can easily be circulated amongst peers to get many peoples input if there is any controversy amongst the original reviewer’s data. It is a task that most anyone can do and is a good way to get involvement in a project about fish that need protecting from people who would otherwise have no idea an issue ever even existed. The openROV, when tested in Pauma Creek showed the piece of equipment’s short comings in that environment, as it would be better suited for
  • 26. 26 | S m i t h a bigger body of water, but also allowed us to capture a few very clear images of trout in larger pools. Due to the skittish nature of these trout, their response was very skeptical due to the buzzing of the propellers on the openROV. Beyond the noise of it, it was difficult to use the camera for population counts because of the lack of precision in its movements that are expected to be overcome with the purchase of new components. It seems that there are other potential applications for the openROV in larger river or estuarine systems that can’t be accurately surveyed by cameras in a single location. They can also be fitted with water chemistry sensors to transmit real-time data on water microenvironments supplemented with visual documentation of aquatic organisms present to position the systemfor behavioral analysis of aquatic organisms in unstudied places. Pauma Creek is currently impacted by drought conditions. This showed the cameras’ optimal conditions to be used. With the stream being so low, a majority of the trout were concentrated in the small pools throughout. When these pools were snorkeled, the amount of sediment that was kicked up by the diver allowed the fish to hide from sight and get lower count numbers than even those informally taken when we walked up onto the pool and took note of the fish visible from the surface. There are plans to continue this study in Pauma Creek by going back to the area where we did our testing and electrofishing a small sample of pools as
  • 27. 27 | S m i t h further control studies. This will be done on pools that were marked with flagging tape when doing our testing. This will help to calibrate the results that we got from our video versus the snorkel surveys. Care will be taken to minimize impact to fish, but is needed to test the accuracy of our protocol. Underwater videography is the only form of surveying that can be done without someone present in or around the water which seemed to be an important part of getting accurate data. With cameras suspended in the water without anything else to disturb them there is opportunity for more than just population counts. Much is unknown about trout behavior especially these wild fish that are disappearing and with these tests we have the rare opportunity to watch them in their native environments. If this information can be attained, it could lead to a better understanding of how to protect these fish and their habitat. There is hope that this survey study could be used to study the Southern California Steelhead (Oncorhynchus mykiss) which are an ocean going rainbow trout that come into fresh water to spawn. These fish have undergone a massive decline due to fish barriers and declining habitats (Moyle et al, 2008). They are only found in a couple of streams at this point and are very near extinction (Jacobson et al, 2014). These fish are native to the San Luis Rey River so their presence in our study was always thought to have future potential to try to restore these fish if we can gain more knowledge about them and their habitat.
  • 28. 28 | S m i t h Figure 7. The Southern Californiasteelhead pictured here is one of the most endangered fish in the country with a population that has declined an estimated over 90 %( Moyle et al,2008). CONCLUSION: In this study I experimented with a new form of population study to be used on trout in slow moving pools that are located in remote backcountry areas. This study used GoPro cameras as opposed to electrofishing and snorkel surveys and is much less harmful to the fish and more accurate in these habitats. While in the drought conditions that were tested in Pauma Creek, this new method shows promise as a way to efficiently and accurately collect data while keeping the stream habitat as pristine as possible. The results have preliminarily proved this method to be effective and have opened up an avenue to many future tests. There are plans to take this new protocol into a multitude of Southern California streams with the hopes of gaining knowledge that will allow us to better understand and protect native trout and steelhead for the generations to come.
  • 29. 29 | S m i t h REFERENCES: Constable, Jr, R.J. and E. Suring. Smith River Steelhead and Coho Monitoring Verification Study, 2007. Monitoring Program Report Number OPSW-ODFW- 2009-11, Oregon Department of Fish and Wildlife, Salem Ellender, B.R., Becker A., Weyl, O.L.F. and E.R. Swartz (2012) Underwater video analysis as a non-destructive alternative to electrofishing for sampling imperilled headwater stream fishes. Aquatic Conserv: Mar. Freshw. Ecosyst. 22: pp. 58-65. Hankin, D. G. and G. H. Reeves. (1988). Estimating total fish abundance and total habitat area in small streams based on visual estimation methods. Canadian Journal of Fisheries and Aquatic Sciences 45:834-844. Jacobson, S., Marshall, J., Dalrymple, D., Kawasaki, F., Pearse, D., Abadia- Cordoso, A., and J.C. Garza (2014) Genetic Analysis of Trout (Oncorhynchus mykiss) in Southern California Coastal Rivers and Streams. Final Report for California Department of Fish and Wildlife, Project No. 0950015. Moyle, P., Israel, J., Purdy, S. (2008) SOS: California’s Native Fish Crisis. California Trout. http://caltrout.org/pdf/SoS-Californias-Native-Fish-Crisis.pdf Snyder, D. E. (2003). Electrofishing and its harmful effects on fish (No. USGS/BRD/ITR-2003-0002). GEOLOGICAL SURVEY RESTON VA BIOLOGICALRESOURCES DIV. Staley, K., Mueller, M. (2000) Rainbow Trout (Oncorhynchus mykiss). United States Department of Agriculture. Web http://www.fws.gov/northeast/wssnfh/pdfs/RAINBOW1.pdf