Download to read offline


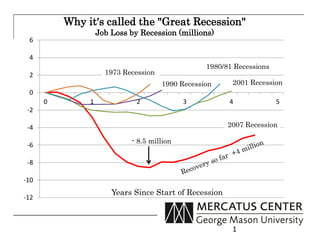
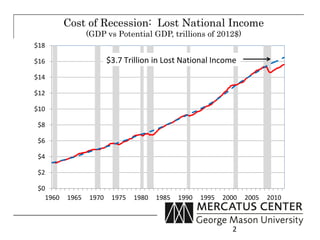
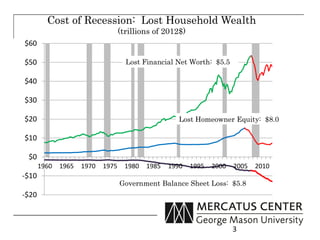
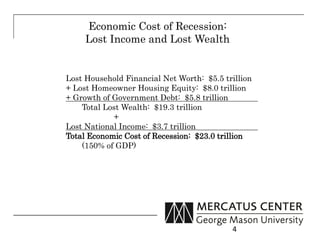
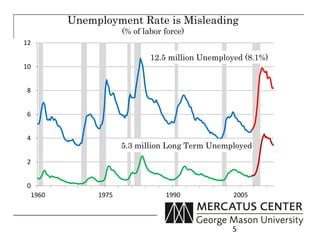
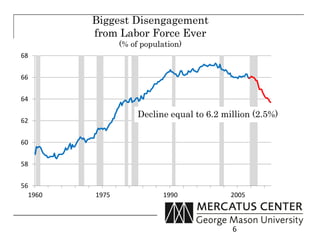
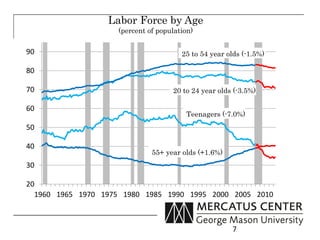
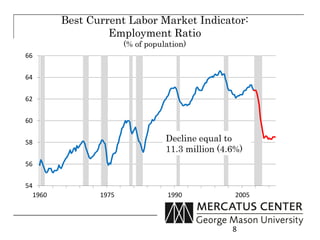
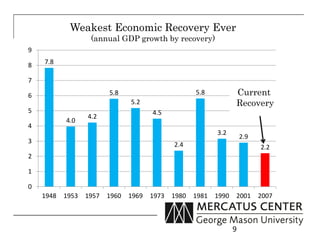

The document provides an analysis of the U.S. labor market during the 'Great Recession,' highlighting the severe job losses and economic costs associated with the recession, amounting to a total economic cost of $23 trillion. It notes an unprecedented disengagement from the labor force and presents statistics regarding unemployment and changes in labor force demographics. Additionally, the document outlines indicators for assessing the employment situation and compares the current recovery to previous ones, indicating a remarkably weak economic recovery.