This document analyzes demand-side linkages between the formal and informal sectors in six West African capitals using household expenditure data. It finds:
1) Households purchase both formal and informal goods and use both formal and informal distribution channels, indicating overlapping customer bases between the sectors.
2) Demand for informal goods and distribution channels tends to decrease with rising income, while demand for formal goods and channels increases, suggesting the informal sector faces constraints from the demand side.
3) Estimated demand elasticities further show rising incomes are associated with lower consumption of informal goods and use of informal distribution channels.
There is a solid foundation upon which to argue that the labour market is the most important market of modern economies (see, for example, Elliott 1991). The reason for this arises
from the well-known fact that, by a wide margin, most individuals derive their current income flow from selling their labour services. This applies to the Finnish labour markets,
which have gained growing interest during the 1990s.
The prominent reason for the interest has been the empirical feature that the unemployment rate soared during the so-called great slump of the early 1990s. Since then, according to a number of commentators on public affairs, unemployment has been the most important economic and social problem
in Finland. In this respect, the situation is nowadays much the same across the whole of the European labour markets.
As a consequence of this development of the 1990s, the
issues associated with the Finnish labour markets constitute a topical research theme.
Professor Alejandro Diaz Bautista, Input Output Conference, June 2012.Economist
Input Output Economics: Empirical Applications in Mexico and International Experience in the Development of Input Output Analysis. Professor Alejandro Diaz-Bautista, June 2012.
Misallocations go a long way. Firm-level evidence from PolandGRAPE
We analyze the link between prior resource misallocation and subsequent long-run economic growth. We use two unique and novel sources of data for Poland and measure misallocation inherited from the period of central planning, i.e. period where input prices did not determine the use of inputs at firm, industry and country level. We find that regions with more misaligned firms under central planning (especially in terms of under-capitalization) experienced lower economic growth once market mechanisms were reinstated. This result proves highly robust, even three decades since the market mechanisms were reinstated. To explain this finding, we assess regional, sectoral, and cohort dimension of the inputs misallocation. We show that under-capitalization was more prevalent that over-capitalization, and that it was due mostly to the firm and sector level variation in factor inputs. Given this insight, subsequent reallocation of the resources required shifting of inputs not only between firms, but also between sectors: a process which is relatively more prone to specificity and information frictions.
INDUSTRY 4.0 The new industrial revolution - Think Act 2014polenumerique33
Publication du cabinet Roland Berger "INDUSTRY 4.0 The new industrial revolution" - Think Act 2014
http://www.rolandberger.com/media/publications/2014-04-02-rbsc-pub-INDUSTRY_4_0_The_new_industrial_revolution.html
Spain-Bangladesh international trade for small and medium enterprises: Explor...Samsul Alam
There exists no adverse relation between Spain and Bangladesh instead it is seen rare international as well as bilateral relation of these two countries and we found scopes for engaging international trade for both of the countries. Spain is a country capable of producing for example, a lot of electronic products. In Bangladesh, there are growing demand for some of the top listed goods like vehicles, machineries and more. The surplus of these goods if any, exported to that country, a huge foreign currency may be achieved and thus the country may be financially benefited to cope with the existing market recession. On the other hand, there are some top listed exporting goods of Bangladesh including clothing, labor, leather, and more. Spain might get economic advantage to some extent from international trade with Bangladesh. Thus, from both side export-import trade relationship of these Small and Medium Enterprises (SMEs), both countries can be economically benefited and thus Spain can get solution for reducing existing recession to some extent and Bangladesh can find a feasible solution to achieve the vision 2021 of digital Bangladesh and 2041 of being a developed country in the world. Again, there will be a bilateral relationship between these two countries. This study attempts to justify the relevance and feasibility for Spain of the goods to be exported to and imported from Bangladesh. The findings of this qualitative study show that there are possible scopes and fields to make a big deal between Spain and Bangladesh and thus the international trade for SMEs would positively contribute to the economic development of the both parties.
Diversification and Economic DevelopmentDany Bahar
These slides summarize some of my research with my coauthors on the role of local markets and international flows on the process of diversification of a country's export basket.
Federal Reserve White Paper on ManufacturingDavid Crace
Resource document on the manufacturing industry over the last 20 years. Very insightful perspective, facts and figures on the impact of offshoring, efficiency gains, etc.
Rising rate of unemployment in the face of various policies and programmes by the successive Nigeria government prompted the researcher to evaluate the contributions of the once neglected informal sector of the economy
The term "informal sector" is today widely used in writings on both developing and developed countries. It is invoked to refer to street vendors in Bogota, shoe-shine workers in Calcutta, specialised knitwear makers in Modena and producers of fashion garments in New York City.
What these activities appear to have in common is a mode of organisation different from the unit of production most familiar in economic theory, the firm or corporation. These activities are also likely to be unregulated by the state and excluded from standard economic accounts of national income. In this paper, I survey the literature on the "informal sector" in an attempt to understand the different applications of the term. I also wish to examine if it is possible and useful to arrive at a definition of the informal sector that can be applied to the different contexts, in the developing and developed world, in which the term is used.
I shall argue that different aspects of regulation by the state provide the key to identifying an informal sector. Research on activities encompassed by the term "informal sector" grew out of studies, in the fifties and sixties, on the dualistic nature of developing societies. The concept of dualism or a dual economy relates to various asymmetries in organisation and production, and dualism in the structure of an economy as between traditional and modern, peasant and capitalist sectors was considered to be a distinguishing characteristic of developing countries.
Development was seen in terms of a shift from a traditional to a modern, an unorganised to an organised, a subsistence to a capitalist economy. Models of dualistic development recognised the interactions between the two sectors and examined their implications for growth. In this literature, the pre-capitalist or traditional economy was expected to decline in relation to the growing capitalist or modern economy. In general, these models assumed a diminishing of the prevailing asymmetries over time and a slow disappearance of dualism in the course of development.
The distinction between formal and informal activities emerged from the attempts of scholars to apply the dualism framework to labour markets in urban areas of developing countries.
Chapter 5 How Managers Use Balance of Payments Data – p.213Do.docxrobertad6
Chapter 5: How Managers Use Balance of Payments Data – p.213
Do some research on the items in the table below and see if you see a pattern with the various country’s economies:
1. What is the G7?
2. What is the E7?
G7 Countries
Continent where the country lies
GDP
Ease of Doing Business
1.
2.
3.
4.
5.
6.
7.
NOTE: When you find the GDP (Gross National Product) note the year – you may not have 2018 statistics. That is okay –find the latest data available. You may need to search for the Ranking of Ease of Doing Business – and then find the countries that make up the G7 or the E7.
NEXT PAGE!
E7 Countries
Continent where the country lies
GDP
Ease of Doing Business
1.
2.
3.
4.
5.
6.
7.
A. Compare the 2 groups of countries – explain your findings.
Globalization Effects on Country Institutions, People and Business
Chapter 3
Key Points for the Chapter
Economic development comprises positive economic growth and entails changes in a country’s political, economic, and cultural institutions, as well as in individual values, attitudes, and behaviors.
Economic development requires resources from public and private sectors, both internal and external.
Technology transfers by international corporations comprise manufacturing technologies, management organizations, and marketing know-how.
Intro: The Economic Development Process
Economic development is the progress countries make in living standards as they experience positive economic growth and the changes occurring in societal and cultural institutions and values as nations move toward more advanced stages of industrialization.
Economic progress demonstrates human progress, and more pragmatically, it keeps politicians in power, companies busy, and consumers (and voters) optimistic about the future.
Technology Transfers
International trade, investments, and global media have opened world markets up to a variety of modernizing influences.
In general terms, technology transfers occur as corporations enter new markets with products, technologies, lifestyles, and business methods developed in their home and other international markets.
Technology transfers first affect urban segments of developing countries where there are developed infrastructures and pocket of economically significant customers.
As media become commercialization and distribution channels are built into rural areas, greater proportions of developing-country populations come into contact with modernization influences.
4
Positive Effects
Positive effects occur as societies are exposed to broad varieties of products that make lives easier.
Convenience products such as packaged foods, and consumer durables such as refrigerators, radios, televisions, and stoves have positive effects on consumer lifestyles.
New technologies in manufacturing and distribution make products cheaper and more widely available. They provide employment opportunities for lo.
1. Is the Informal Sector Constrained
from the Demand Side?
Evidence for Six West African Capitals
by Marcus Böhme, Rainer Thiele
No. 1683 | February 2011
2. Kiel Institute for the World Economy, Hindenburgufer 66, 24105 Kiel, Germany
Kiel Working Paper No. 1683| February 2011
Is the Informal Sector Constrained from the Demand Side?
Evidence for Six West African Capitals *
Marcus Böhme, Rainer Thiele
Abstract:
Employing a unique dataset that covers households from six West African capitals, this paper
provides new evidence on the demand for informal sector products and services. We first
investigate whether demand linkages exist between formal and informal products and
distribution channels, and whether there is an overlapping customer base, which would imply
that both formal sector wage earners and informal workers buy both formal and informal
products using both formal and informal distribution channels. In a second step, we estimate
demand elasticities based on Engel curves. We find a strongly overlapping customer base and
strong demand-side linkages between the formal and informal sector, with the exception that
informal goods are hardly bought through formal distribution channels. The estimated
demand elasticities tend to show that rising incomes are associated with a lower propensity to
consume informal sector goods and to use informal distribution channels. We therefore
conclude that the informal sector in West Africa is likely to be constrained from the demand
side.
Keywords: Informal sector; formal-informal linkages; Engel curve estimates; West Africa
JEL classification: D12; 017
Marcus Böhme
Kiel Institute for the World Economy
24100 Kiel, Germany
Telephone: +49(0)431-8814 571
E-mail: marcus.boehme.@ifw-kiel.de
Rainer Thiele
Kiel Institute for the World Economy
24100 Kiel, Germany
Telephone: +49(0)431-8814 215
E-mail: rainer.thiele@ifw-kiel.de
*The authors gratefully acknowledge funding from the World Bank’s Multi Donor Trust Fund
(MDTF) “Labor Markets, Job Creation, and Economic Growth, Scaling up Research,
Capacity Building, and Action on the Ground” for the project on “Unlocking potential:
Tackling economic, institutional and social constraints of informal entrepreneurship in Sub-
Saharan Africa”. Special thanks are due to AFRISTAT and DIAL, in particular Constance
Torelli and François Roubaud, for providing and preparing the datasets used in this paper.
____________________________________
The responsibility for the contents of the working papers rests with the author, not the Institute. Since working papers are of
a preliminary nature, it may be useful to contact the author of a particular working paper about results or caveats before
referring to, or quoting, a paper. Any comments on working papers should be sent directly to the author.
Coverphoto: uni_com on photocase.com
3. 1
1. Introduction
In urban Sub-Saharan Africa (SSA), formal employment covered by labor legislation and social
protection schemes is the exception rather than the rule. By far the largest part of urban employment
is generated by micro and small enterprises, and (self-) employment in those enterprises can be
considered informal by almost any definition one might want to apply. The informal sector is
characterized by a high degree of heterogeneity comprising both low and high return activities. This
implies a sub-optimal allocation of production factors where poor urban households are prevented
from escaping the lower tier of informal employment. Among the constraints that may bring about
this heterogeneity, supply side factors such as capital market failures have received considerable
attention in the literature (e.g. de Mel et al. 2008).
It has been less well recognized that the evolution of the informal sector is also shaped by the
demand side, in particular by the structure of final demand as well as linkages to the formal sector.
The literature on the structure of demand has mainly been descriptive. It has not only distinguished
informal and formal products and services, but also formal and informal customers or households,
typically identified by the (main) sector of occupation of the household head (formal or informal).
A core proposition of this literature has been that informal and formal products will often have an
overlapping customer base (Sethuraman 1997). Such overlaps may reflect complementary or
competitive product markets. The most common example of a complementary market occurs when
the informal sector sells formal sector products. In competitive markets, the two sectors compete
within the same product market, and the informal sector may for example retain market shares by
charging lower prices. The rather limited evidence for Sub-Saharan Africa tends to confirm the
notion of an overlapping customer base. Covering a sample of 13 Sub-Saharan African countries,
Xaba et al. (2002) find rather strong inter-linkages in the final product market, with each sector
being a strong supply as well as demand base of the other sector. Similar results are obtained by
Grimm and Günther (2006) for the case of Burkina Faso.
By contrast, Fortin et al. (2000) suggest various reasons why working in the informal sector will
raise the probability of buying products in the informal market, thereby limiting the demand
overlap. For instance, those working in the informal sector may have an informational advantage
about how and where to obtain informal goods and services. In accordance with this reasoning,
Livingstone (1991) finds that in Kenya informal goods target mainly low-income consumers, while
Reilly et al. (2006) obtain an inverse relationship between purchases from informal markets and
income.
4. Of crucial importance for the economic prospects of informal entrepreneurs is the elasticity of
demand for their products, which in turn depends on the strength of formal-informal linkages.
Again, evidence on this issue is scarce. The only exception in the African context is Lachaud (1990)
who shows that rising wages lead to a lower propensity to consume informal sector goods. D'Haese
and Van Huylenbroeck (2005) find evidence that supermarkets create fierce competition with local
agricultural sales in South Africa. With rising income households tend to purchase their goods at
supermarkets because they are able to offer a broader variety and a higher quality at lower prices.
Even though this study does not address the informal sector directly it can be assumed that local
agricultural sales are often informal.
This paper aims to broaden the evidence on the characteristics of demand for informal sector
products and services in Africa. We extend the literature in various ways. First, by using fully
comparable data for a sample of six West African countries, we provide a comprehensive set of
demand elasticities based on Engel curves. Second, in contrast to previous papers, our dataset
allows us to consider imports as an additional product category, and to account for informal and
formal distribution channels. Third, we address methodological challenges such as the potential
endogeneity of income and the nonlinearity of Engel curves. This has been done before, but not in
the context of the informal sector.
The remainder of the paper is structured as follows. Chapter 2 introduces the dataset employed in
the empirical analysis and presents descriptive evidence on whether there are demand-side linkages
between the formal and informal sector. Chapter 3 derives some hypotheses concerning the demand
elasticities, describes the Engel curve methodology and discusses the estimated elasticities. Chapter
4 summarizes our main results.
2
2. Data and Descriptive Analysis
The Dataset
We use data provided by the “Enquêtes 1-2-3”. This survey was carried out between 2001 and 2003
in seven economic capitals of the West African Economic and Monetary Union (WAEMU). It
consisted of three integrated phases for a representative set of households. The first phase of the
survey was constructed as a general labor force survey, interviewing formal and informal workers
5. and entrepreneurs. It provides detailed information about individual socio-demographic
characteristics and employment. In identifying informal activities, the 1-2-3 surveys follow
international statistical guidelines, which suggest that informal sector employment should be
defined in terms of characteristics of the enterprise or production unit such as size and different
legislative criteria (Hussmans 2004).1 Specifically, the 1-2-3 surveys define informal enterprises as
small production units that (a) do not have written formal accounts and/or (b) are not registered
with the tax administration.
The second phase of the survey interviewed a sub-sample of the informal production units
identified in phase one. The focus of this phase was on characteristics of the entrepreneurs and their
production units. It also contains information on input use, investment, sales, profit as well as the
unit’s forward and backward linkages.
The third phase, on which the subsequent analysis will mainly rely, collected data on household
expenditure including the point of sale. Expenditures were recorded based on a classification of 315
different products and services. The technique of registration varied according to the periodicity of
the purchase. While food expenditures were registered on a daily basis for 15 days, for other types
of expenditure such as clothing, housing, health, transport and education a retrospective module
was used. All expenditure aggregates are recorded at the household level, annualized and given in
local currency units. A two-stage random sample design was applied based on an updated general
population census of each country (Amegashie et al. 2005). Area codes were used as the primary
sampling unit, of which 125 were selected for each city. Households were the secondary sampling
unit, of which 20 (24 in Benin) were drawn from each primary unit. Data was then collected for
each household member. The 4200 households included in phase three constitute a representative
subsample drawn from the 15300 households of phase one.
The data collected in phase one permitted an additional stratification based on income and sector of
activity of the household head in phase three. This constitutes one major advantage of using the
integrated 1-2-3 survey, because it allows us to distinguish formal and informal households and thus
to test whether these two groups differ in their demand patterns as suggested by Fortin et al. (2000).
A further strength of the 1-2-3-surveys is that they used exactly the same questionnaire and were
conducted more or less simultaneously in the seven economic capitals of the WAEMU, rendering
the datasets fully comparable. Finally, being coordinated by AFRISTAT and DIAL and financially
supported by the European Commission, the French Ministry of Foreign Affairs and the World
3
1 For a survey of different definitions of the informal sector, see Gërxhani (2004).
6. Bank, the surveys were elevated into the status of official data, which should add to the credibility
of the results based on them.
Table 1 shows summary statistics of selected socio-demographic household characteristics for the
six West African capitals under consideration.2 Most interestingly in the context of this paper,
between 40% and 60% of the household heads receive their primary income from informal sector
activities, classifying the respective households as informal. The share is lowest in Dakar, the
capital of Senegal, the richest country in the sample. Regarding the sectoral distribution of informal
activities we find that about one quarter is located in the manufacturing sector and between 2% and
12% in the primary sector. Between 62% and 76% of informal activities are dedicated to trade and
services. Only 7.8% to 11.2% of informal employment is remunerated by a fixed salary.
The other major household characteristics listed in Table 1 also exhibit a considerable degree of
variation across countries. Average household size is by far highest in Dakar due to a strikingly
large number of adult members. In addition, household heads in Dakar are markedly older on
average than those in the other five capitals. The mainly Christian capitals of Togo and Benin are
characterized by high rates of primary school completion among household heads and a rather high
share of female-headed households, whereas the opposite is true for the mainly Muslim capitals of
Burkina Faso, Mali and Niger.
4
Structure of Demand
To analyze the structure of demand, we aggregate annual expenditures in two different ways. First,
we apply a conventional sectoral classification, where expenditures are allocated to eleven different
categories: (1) Food and Non-Alcoholic Beverages, (2) Alcoholic Beverages and Tobacco, (3)
Clothing and Shoes, (4) Housing, (5) Gas, Electricity and Water, (6) Furniture and Household
Maintenance, (7) Health and Education, (8) Transport and Communication, (9) Leisure and Culture,
(10) Hotels and Restaurants and (11) Diverse Goods and Services. While the first two categories
consist only of consumption goods, all other categories are composed of a variety of consumption
goods, durables as well as services. Being a residual the last category is the most heterogeneous.
This classification has the advantage that it can directly be matched with the survey information and
closely resembles what has been done in previous studies. This has to be weighed against one
important disadvantage, namely that the sectors only roughly correspond with the distinction
2 Political tensions in Côte d’Ivoire prevented the execution of the third phase in Abidjan. Hence, Abidjan is
not included in the present analysis.
7. between formal and informal goods we are interested in. One can argue, for example, that Food and
Non-Alcoholic Beverages includes mainly informal products, whereas Furniture and Maintenance,
Health and Education, and Transportation and Communication supply mainly formal goods.
Second, we distinguish four types of expenditures: on formal goods, informal goods, imported
goods and services. In principle, this option is superior to the sectoral classification, but in a number
of cases the survey does not state whether a product is formal or informal. We therefore had to sort
products into the two different categories. Agricultural, artisan and traditional products were
assumed to be informally produced, which concerns mainly but not exclusively food products.
Capital intensive, technologically advanced and industrial products were assumed to be produced
formally. This category consists mainly of electricity, fuel, construction materials, household
articles, clothing and footwear, as well as certain food products. It has to be noted that this
classification is rather crude given that technologically advanced goods for example might not
exclusively be produced formally. In contrast to domestically produced goods, demand for imports
and services can readily be identified from the survey. Households can with an acceptable margin of
error name the country of origin of goods purchased due to the packing and labeling. One central
characteristic of services is the quasi-concurrence of production and purchase. For this reason the
distribution channel will be sufficient to distinguish between formal and informal services. This
concerns mainly reparation, transportation and communication, health and education, hotels and
restaurants as well as cultural services and entertainment.
The questionnaire asked consumers about the location of their purchases such as explicitly formal
enterprises, supermarkets and the public sector, which are assumed to be formal, and household
production, ambulant retailers and public markets, which are assumed to be informal. This allows
us to distinguish formal and informal distribution channels irrespective of which of the two
classifications we apply.
As can be seen in Table 2, food products and non-alcoholic beverages account for roughly 30% of
annual household expenditures throughout the sample. If non-frequent purchases are excluded, i.e.
only monthly expenditures are used this share rises to over 70% for all West African capitals.
Housing and Transport and Communication constitute the next-biggest positions, accounting for
10-18% and 10-16% of total expenditures respectively. The structure of demand does not seem to
vary in a systematic way across the sample countries. We do, for example, not find higher shares of
food expenditures in poorer countries such as Mali and Niger than in richer countries such as
Senegal and Benin.
5
8. Analyzed along quintiles, it turns out that in accordance with Engel’s law the fraction spent on Food
and Non-Alcoholic Beverages is falling considerably with rising expenditure, Lomé being the only
exception (see Table 3). The same is true for Hotels and Restaurants. By contrast, in all capitals the
share of expenditures on Housing3, Health and Education as well as Transport and Communication
increases substantially with growing household expenditure.
From Table 4 it appears that the informal sector is the dominant point of sale.4 The only notable
exception is Health and Education where services are almost exclusively distributed through formal
channels. For Gas, Electricity and Water and Transport and Communication we see a rather
balanced relationship between formal and informal expenditure shares. Households turn to the
formal sector for purchases of capital intensive products such as cars and for the use of public
transportation, and to the informal sector for rather inexpensive transportation-related goods such as
bicycles and spare parts. In the food and beverages sector, formal outlets such as supermarkets
appear to be virtually non-existent.
Turning to the classification by expenditure categories, a clear pattern emerges where the informal
distribution channel predominates for all four types of expenditures (Table 5). This is most
obviously the case for informal goods, which are hardly ever sold via formal distribution channels.
Comparing the six capitals, demand for formal goods is found to be highest in Dakar, but even there
the bulk of products are distributed informally. Put more generally, the capitals do not appear to
differ systematically regarding formal-informal demand relationships, which may reflect that cross-country
differences in per capita income are not sufficiently pronounced. Import shares vary
considerably across countries, ranging from 15% in Dakar to 38% in Niamey. Around 30% of all
imported goods in Cotonou, Ouagadougou and Bamako are produced in other (mainly neighboring)
African countries, while this figure is substantially higher in Niamey (46%) and substantially lower
in Dakar (9%).
Table 6 reveals that expenditures by informal households as defined above are by no means
restricted to informal goods and informal distribution channels. In Cotonou, for example, these
households account for more than a third of total expenditures on formally distributed formal goods
(36.8%) and formally distributed imports (34.6%). Irrespective of product category, distribution
3 Housing expenditures include imputed rents for owner-occupied housing.
4 The results of Table 4 remain comparable or become even more pronounced when we focus on the
frequency of purchases.
6
9. channel and city, their expenditure share is in no case lower than 20%. Conversely, the fact that the
expenditure share of informal households in no case exceeds 60% implies that formal households
are important buyers of informal goods and goods distributed through informal channels, which
points to a strong overlapping customer base.
Overall, this section has shown that significant formal-informal linkages exist in the six West
African capitals. They may well be strong enough to affect the pattern of estimated demand
elasticities, to which we will turn in the next section, in a way that eludes the notion of a simple
formal-informal sector dichotomy.
7
3. Estimation of Engel Curves
Hypotheses
While demand estimation is often primarily concerned with quantities, consumers also face a
quality choice (Deaton 1988, Blundell and Stoker 2005). Consequently the observed expenditure
patterns will be conditioned by price, quantity and quality of the available products. Merella (2006)
has shown that Engel Curves depend on the assumption of constant quality. With increasing quality
of a product the marginal utility of this same product would not decline. Based on this assumption
the author asserts that increasing income will first affect the quantity of products bought and only
thereafter the shift between products due to quality differences. More generally, poor households
will be concerned primarily with subsistence and therefore quantity while rich households’
consumption is driven by quality differences in goods. This theory has implicitly been corroborated
in prior studies (e.g. Wan 1996) where food and shelter – which are necessities and are expected to
show an elasticity coefficient that is greater than zero but less then unity – have been found to be
treated as a luxury by extremely poor households.
Recently, Banerji & Jain (2007) introduced a new perspective by arguing that the dynamics of the
informal sector are also driven by changes in consumer demand. At the core of their argument
stands the observation that there is a marked quality difference between formal and informal goods
and services. Accordingly, the informal sector caters to a consumer base that is not able to pay high
prices for high quality.
10. From these theoretical considerations two testable hypotheses can be derived. First, if Banerji &
Jain (2007) are correct and formal and informal goods and services differ markedly in their quality,
we have to expect significantly different income elasticities for the same goods produced or sold by
formal and informal enterprises. If Merella (2006) is right then we should observe smaller income
elasticities for low quality products, i.e. informal sector products.
8
Methodology
To answer the question of whether customers behave differently vis-á-vis formal and informal
products and distribution channels we estimate demand elasticities for different aggregated
production sectors and different types of expenditures as defined above. As predicted by
neoclassical consumer theory private demand for goods and services is a function of disposable
income and prices. Since the data we work with is cross-sectional, estimations have to be simplified
assuming prices to be constant across observations. The corresponding specifications, known as
Engel curves, represent Marshallian demand functions for a particular good or service category
holding the prices for all goods constant.
From a theoretical point of view, the Engel curves should preferably be estimated using a
simultaneous equation approach to account for the restrictions required by utility-based demand
theory such as the adding-up criterion. Furthermore, the Breusch and Pagan test of independence in
all cases rejects the null hypothesis of no correlation among the error terms of different equations.
We nonetheless decided to present equation-by-equation estimates of the system.5 This approach
has the disadvantage that our results are less efficient then they would be when using simultaneous
estimation methods, but they remain consistent. It has the advantage that mis-specified equations do
not affect overall results, which is especially relevant considering the possible differences of
functional forms between countries and categories (see below).
Explorative non-parametric estimations led us to adopt a simple linear double-logarithmic model as
our base specification. The equation fitted takes the following form:
ݔ ൌ β βଵݔ βଶܪ βଷܦ γሺ݉ሻ
ୀଵ
ݑ ݅ ൌ 1, … ܯ ܽ݊݀ ݆ ൌ 1, … ܰ
5 We also estimated demand systems for both sectors and expenditure categories. Since these estimates do not
change the main conclusions of the paper, we decided not to report them. They are of course available from the
authors upon request.
11. 9
with:
ே
ݔ ൌ ݔ
ୀଵ
where xij is the log of expenditure of household i on product category j, xi is the log of household
income, Hi is the log of household size, mi are L different household characteristics including age,
sex and religion of the household head, an indicator of primary schooling of the household head,
and sector of employment of the household head, and Di are district dummies.
While we include the additional control variables primarily to account for household heterogeneity,
the occupation variable also allows us to test the hypothesis (e.g. Fortin et al. 2000) that being
employed in the informal sector raises the likelihood of consuming informal goods and services.
Concerning household size, we performed robustness checks using equivalence scales and squared
household size as predictor variables, which hardly affected our results.
When estimating the Engel curves two main challenges occur: omitted variables and measurement
error. First, observed income might not be the main driver of expenditure behavior. More
specifically, we have to consider the possible seasonal volatility of employment and earnings which
casts doubt on the appropriateness of monthly income as a representation of disposable annual
income. Thus, we use total expenditure as a proxy of income, even though our data contains
information about declared monthly income from primary and secondary employment as well as
income from other sources such as remittances and assets for all household members. The basic
justification for using total expenditure instead of total income is based on the permanent-income
hypothesis. Accordingly, expenditure will be conditional upon long-run income rather than
transitory income, even though it has to be conceded that consumption smoothing in West Africa is
likely to be far from perfect as a result of liquidity constraints. 6 While it has been argued that the
use of total expenditure can lead to biased or even inconsistent estimation results given that it is
only a proxy of income, various authors (e.g. Lewbel 1996; Gibson 2002) have argued that this bias
tends to be small compared to the bias introduced by using transitory income. Nevertheless, using
total expenditure introduces a possible burden, namely the possible correlation of the independent
variable with the error term since by definition our dependent variable, the expenditure on different
6 For a general discussion of whether income or expenditure constitutes the preferred welfare indicator in the context
of developing countries, see for example Deaton (1997).
12. product categories and types, will always be part of the explanatory variable. This possible
simultaneity bias motivates the use of instrumental variables.
Second, the problem of measurement error in household survey data, which is well-known in
demand estimation (Liviatan 1961, Griliches 1974, Theil 1979, Keen 1986, Lewbel 1996, Hausman
2001) can also be mitigated by using instrumental variables. Based on the classical errors-in
variables assumption that presumes a correlation between the observed variable and the error term
one would expect the OLS estimator to be closer to zero than the true estimator represented by a
valid IV coefficient. Several authors have pointed to exceptions to this rule in the context of
demand analysis. Keen (1986) has shown that the inconsistent estimator one observes in OLS
estimations must not necessarily be downward biased but will depend on the probability of
purchases in the case of infrequent expenditures. Liviatan (1961) has shown that if expenditure
changes are not caused by income changes but are for instance financed by savings one would also
observe upward biased OLS estimations as compared to the IV results. More recently Gibson and
Bonggeun (2007:479) have asserted that “[…] only some form of correlated error could cause” the
coefficient “to be biased downwards”.
In the context of consumer behavior most of the previous studies have instrumented total
expenditure by monthly income (e.g. Lewbel 1996, Kedir and Girma 2007). We also did so, but
additionally employed a wealth index, given that it seems plausible to assume that household wealth
will also influence the observed expenditure patterns, perhaps even more so than current income.
We constructed a wealth index, using a principal components analysis along the lines of, for
example, McKenzie (2003) and Filmer and Pritchett (2001). One of the main advantages of such an
index is that the measurement error is reduced since the elements used to construct it can be
observed directly. We converted our qualitative categorical variables into binary ones and employed
the full household sample of phase 1 to construct this index including housing characteristics,
access to infrastructure and durable asset ownership (see Table A1). The index achieves to explain
more than a quarter of variation in the household data in all countries. We did not adjust for
household size considering that the data has been collected on the household level and because our
wealth and asset variables have been converted into binary values except for the number of rooms
in each household.
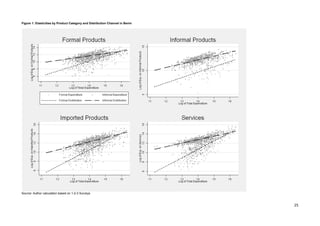
We started by employing ordinary least-squares (OLS) estimation techniques. The explanatory
power of this simple model is rather good; in almost all cases up to one half of the observed
variation can be explained. A non-parametric analysis of the data pointed to a non-linear
10
13. relationship in some cases7. These findings were confirmed by a Ramsey RESET test. Specifically,
we had to reject the null hypothesis of no omitted variables and therefore our linear specification for
food and non-alcoholic beverages at the 1% level and for transport and communication at the 5%
level for all countries in favour of a more flexible specification. To take account of these results we
included a quadratic term of the log of total expenditure for these categories.
Using a Hausman test we can reject the null hypothesis of endogeneity of the log of total
expenditure for all sectors apart from Food and Non-alcoholic Beverages and Electricity, Gas and
Water. By contrast, the Hausman test points to potential endogeneity for all four expenditure
categories at least in some of the countries. Accordingly, we proceeded with a two-stage least-squares
(2SLS) estimation for our linear specifications. We found no evidence of endogeneity in
11
our non-linear specifications and therefore did not employ 2SLS for this setup.
To evaluate the strength of our proposed instruments we applied the test suggested by Staiger and
Stock (1997) and Stock and Yogo (2003). These tests confirmed the relevance of total income as
well as the wealth index as instrumental variables even though the wealth index consistently
showed signs of somewhat higher relevance throughout all countries.
Estimation Results
Our OLS estimates at the sectoral level displayed in Table 7 are in line with the findings of prior
studies for East Africa (Massel and Heyer 1969, Ostby and Gulilat 1969, Humphrey and Oxley
1976, Okunade 1985, Teklu 1996) and for other developing coumtries such as India and China (e.g.
Tiwari and Goel 2002, Chern and Wang 1994). In particular, we find Food and Non-alcoholic
Beverages as well as Alcoholic Beverages and Tobacco to be inferior goods as suggested by
Engel’s law. An increase of one percent in disposable income would on average lead to an increase
of expenditure on food and non-alcoholic beverages of 0.77% in the six countries.8 Clothing and
Shoes, Furniture, Health and Education, Transport and Communication as well as Leisure and
Culture turn out to be luxury goods in all countries under consideration. The low demand
elasticities for hotels and restaurants may appear somewhat surprising, but the previous literature is
inconclusive as to whether recreation constitutes an inferior or superior good.
7 See Blundell and Duncan (1998) for a detailed discussion of household expenditure and non-parametric
kernel regressions.
8 We get virtually the same result when pooling the data from the six capitals (see last column of Table 7).
14. In the lower part of Table 7 we report selected results for the linear 2SLS estimations using the
wealth index as an instrumental variable. According to the tests performed, Food and Non-alcoholic
Beverages, as well as Electricity, Gas and Water are the only sectors where we are advised to
perform an instrumental variable estimation. For these sectors, differences between OLS and 2SLS
estimates turn out to be substantial. Food and Non-alcoholic Beverages are shown to follow Engel’s
law even more clearly when using 2SLS as indicated by lower budget elasticities in all countries
under consideration, while Electricity, Gas and Water switches from being inferior to being
superior.
Among the additional control variables, household size uniformly has a positive and significant
influence on food expenditures. Its impact on expenditures is significantly negative throughout for
Transport and Communication and in some countries also for Shoes and Clothing as well as
Furniture and Household Maintenance. These findings are in line with economies of scale
concerning these commodities. In several cases, the gender of the household head turns out to be
another important determinant of expenditures, pointing to gender-specific preferences and intra-household
bargaining. All else being equal, households headed by a male tend to spend less on
Food as well as Health and Education, and more on Transport and Communication as well as
Leisure and Culture.
As for the distinction between formal and informal goods and distribution channels shown in Table
8, a very clear pattern emerges for formal goods and services: In all countries the demand elasticity
is substantially above unity for formal provision and substantially below unity for informal
provision. Imported goods are also uniformly seen as luxury goods when distributed via formal
retailers, and the demand elasticity stays close to unity even in case of informal distribution. Results
for informal goods are less clear-cut, but it can still be concluded that formal (informal) distribution
channels tend to show elasticities above (below) unity. Graphically these results are illustrated for
Benin in Figure 1. The steep slope of the fitted values of formal distribution represents clearly the
higher elasticity of this distribution channel compared to the informal channel. In all countries
except Senegal informal goods are considered inferior. Using a simple Chow test we find
differences in slopes and intercepts between formal and informal distribution channels to be
significant throughout, for informal goods at the 10% level and for all other categories at the 1%
level of significance. Regarding the household characteristics, we cannot observe clear tendencies
of influence, which may at least partly reflect the high level of aggregation. Most notably,
employment of the household head in the informal sector is in almost all cases statistically
insignificant. This corroborates the above finding that informal households reveal no particularly
12
15. strong preference for informal goods and services. Looking at the instrumented estimates (2SLS) of
the expenditure categories (lower part of Table 8), we find that all major results remain qualitatively
unaffected when employing the 2SLS estimation technique. Differences between formal and
informal distribution channels even tend to be somewhat more pronounced compared to the OLS
estimates.
The quadratic OLS estimations are shown in Table 9. Recall that the RESET test points to a non-linear
specification only in the case of Food and Beverages as well as Transport and
Communication. We find that the elasticity function for Food and Beverages is concave, which is in
line with the saturation hypothesis. We also observe that the turning point (the maximum) is located
in the 10th expenditure decile in all countries; it is comparatively higher in Benin and Senegal than
in the other countries. For Transport and Communication the elasticity function is first falling with
income and after a certain threshold point increasing again.9 In this case the turning point is a
minimum, which is lowest in Benin and Togo and highest in Niger, but practically irrelevant as it is
located outside the observable income range.
Up to now, we have considered the four expenditure categories only in the aggregate. This is
because a further disaggregation dramatically reduces the number of observations. We nonetheless
specifically looked at Food and Beverages as well as Transport and Communication, for which the
number of observations is largest.10 But even in these two categories we partly run into data
problems. For Food and Non-Alcoholic Beverages, only between 1% and 7% of all purchases
where located in the formal sector, i.e. products that have been distributed by formal vendors (see
Table 10). The data restriction becomes even more severe if one focuses on a single expenditure
category such as formally produced domestic products. The corresponding results thus have to be
interpreted very cautiously. For all three expenditure categories considered (services are not
recorded), the estimated expenditure elasticities for formally distributed food products reveal a very
mixed picture, which arguably reflects to a large part the lack of sufficient data. By contrast, a
stable pattern of elasticities below unity appears for informal distribution channels, which
corroborates the findings obtained at the aggregate level. Aggregated over distribution channels, the
three product categories are found to be inferior in all but two cases.
13
9 See Diaz et al. (2008) for a survey of transport expenditures in Sub‐Saharan Africa.
10 Ideally, one would want to disaggregate even further so as to arrive at fairly homogenous items (e.g. single goods
such as maize or millet) where quantity and quality aspects can be disentangled. This would, however, render the
distinction between formal and informal distribution channels meaningless as one of them prevails.
16. For Transport and Communication, we disentangle different types of products and their distribution
channels. While formal and imported goods are composed mainly of capital intensive items such as
cars and other vehicles, services are composed of public and private transport modes such as public
buses and taxies. Imports and services account for the bulk of expenditures in this category (see
Table 11). If significant, estimated demand elasticities at formal points of sale tend to exceed unity.
Most notably, formally distributed formal products such as cars turn out to be strong luxuries in the
two richest countries, Benin and Senegal. In contrast to Food and Beverages, even the elasticities
for informal distribution channels are partly above unity, suggesting that informal sales will not
necessarily fall with rising incomes.
14
4. Concluding Remarks
In this paper, we have offered a descriptive overview of demand in six capitals of the West African
Economic and Monetary Union as well as an analysis of budget elasticities for different sectors and
distribution channels. Our main findings are that
(i) there is support for linkages between the formal and informal sector regarding the
channels through which goods are distributed, with the exception that informal goods are
hardly bought through formal distribution channels;
(ii) there appears to be a strongly overlapping customer base between the formal and
informal sector;
(iii) in general, rising incomes lead to a lower propensity to consume informal sector goods
and to use informal distribution channels.
The last result implies that the development of the informal sector in West Africa will most likely
be constrained from the demand side, which is in accordance with the hypothesis of quality
dualism, with the informal sector being characterized by low quality. However, the pattern is not
uniform, underscoring the notion of a heterogeneous informal sector put forward in studies of the
supply side. At the sectoral level, the large differences between Food and Transport and
Communication in the estimated demand elasticities of the informal distribution channel stand out.
Along expenditure categories, elasticities of the informal distribution channel are much higher – in
some cases even above unity – for imports and services than for domestically produced informal as
well as formal goods. By contrast, we find no systematic variation in demand elasticities across
countries.
17. The overall demand bias against the informal sector suggests that the majority of poor informal
households, for example those who produce or sell food, would be affected less than
proportionately by recessions. The implications for their welfare in the longer run depend on how
easily they can switch to more productive activities. As long as the high entry barriers previously
identified for West Africa (Grimm et al. 2011) continue to limit the adjustment possibilities of
informal entrepreneurs, the growth process of the urban economy is unlikely to be pro-poor. In the
food sector, which accounts for a large share of informal activities in all six capitals, future
competition by supermarkets may even further reduce the room of maneuvering for informal
households.
As concerns future research, the next step would ideally involve a further disentangling of the
relation of quality and quantity by using more homogenous goods and panel data. This would allow
us to mitigate the well known difficulties caused by the aggregation of broad product groups.
15
18. Literature
Amegashie, F. / Brilleau, A. / Coulibaly, S. / Koriko, O. / Ouedraogo, E. / Roubaud, F. / Torelli, C
(2005): La conception et la mise en oeuvre des enquêtes 1-2-3 en UEMOA, les enseignements
méthodologiques. Stateco, 99, 21-42.
Banerji, Arup & Jain, Sanjay (2007) Quality dualism. Journal of Development Economics, Volume
84, Issue 1, September 2007, Pages 234-250.
Blundell, R. and Duncan, A. (1998): Kernel regression in empirical microeconomics. Journal of
Human Resources, 33, 1, 62-87.
Cervero, R. and Golub, A. (2007): Informal transport: A global perspective. Transport Policy, 14, 6,
445-457.
Chern, W. and Wang, G. (1994): The Engel function and complete food demand system for Chinese
urban households. China Economic Review, 5, 1, 35-57.
Deaton, A. (1988): Quality, Quantity, and Spatial Variation of Price. The American Economic
Review, 78, 3, 418-430.
Deaton, A. (1997). The Analysis of Household Surveys: A Micro-Econometric Approach to
Development Policy. Baltimore: Johns Hopkins University Press.
Diaz, L. and Plat, D. and Pochet, P. (2008): Household transport expenditure in Sub-Saharan
African cities: measurement and analysis. Journal of Transport Geography, 16, 1, 1-13.
D'Haese and Van Huylenbroeck (2005): The rise of supermarkets and changing expenditure
patterns of poor rural households case study in the Transkei area, South Africa. Food Policy, 30, 1,
97-113.
De Mel, S., McKenzie, D. and Woodruff, C. (2008): Returns to Capital in Microenterprises:
Evidence from a Field Experiment. Quarterly Journal of Economics, 123, 4, 1329-1372.
Filmer, D. and Pritchett, L. (2001): Estimating Wealth Effects without Expenditure Data-or Tears:
An Application to Educational Enrollments in States of India. Demography, 38, 1, 115-132.
Fortin, B., Laxroix, G. and Montmarquette, C. (2000): Are Underground Workers More Likely to
Be Underground Consumers? The Economic Journal, 110, 466, 838-860.
Gërxhani, K. (2004): The Informal Sector in Developed and Less Developed Countries: A
Literature Survey. Public Choice, 120, 3/4, 267-300.
Gibson, J. (2002): Why Does the Engel Method Work? Food Demand, Economies of Size and
Household Survey Methods. Oxford Bulletin of Economics and Statistics, 64, 4, 341-359.
Griliches, Z. (1974): Errors in Variables and Other Unobservables. Econometrica, 42, 6, 971-998.
Gibson, J. and Bonggeun, K. (2007): Measurement Error in Recall Surveys and the Relationship
between Household Size and Food Demand. American Journal of Agricultural Economics, 89, 2,
473-489.
16
19. Grimm, M. and Günther, I. (2006): Inter- and intra-household linkages between the informal and
formal sector. A case study for urban Burkina Faso. In B. Guha-Khasnobis and R. Kanbur (Eds.),
Informal Labor Markets and Development, pp. 155-179, London: Palgrave Macmillan.
Grimm, M., Krüger, J. and Lay, J. (2011): Barriers of Entry and Capital Returns in informal
Activities: Evidence from Sub-Saharan Africa. Mimeo.
Hausman, J. (2001): Mismeasured Variables in Econometric Analysis: Problems from the Right and
Problems from the Left. The Journal of Economic Perspectives, 15, 4, 57-67.
Humphrey, D. and Qxley, H.(1976): Expenditure and household-size elasticities in Malawi: Urban-rural
comparisons, demand projections and a summary of East African findings. Journal of
Development Studies, 12, 2, 252-269.
Hussmanns, R. (2004): Statistical Definition of Informal Employment: Guidelines Endorsed by 17th
ICLS (2003) in Delhi Group on Informal Sector, February. ILO, Geneva.
Kedir, A. and Girma, S. (2007): Quadratic Engel Curves with Measurement Error: Evidence from a
Budget Survey. Oxford Bulletin of Economics and Statistics, 69, 1, 123 – 138.
Keen, M. (1986): Zero Expenditures and the Estimation of Engel Curves. Journal of Applied
Econometrics, 1, 3, 277-286.
Koriko, O. and Torelli, C. (2005): La consommation et le rôle du secteur informel dans la
satisfaction des besoins des ménages, enquête 1-2-3 phase 3. Stateco, 99, 89-116.
Lachaud, J. (1990): The Urban Informal Sector and the Labour Market in Sub-Saharan Africa. in:
D. Turnham, B. Salomé and A. Schwarz (eds): The Informal Sector Revisited, OECD Publication,
Paris, pp. 111-130.
Lewbel, A. (1996): Demand Estimation with Expenditure Measurement Errors on the Left and
Right Hand Side. The Review of Economics and Statistics, 78, 4, 718-725.
Liviatan, N. (1961): Errors in variables and Engel curve analysis. Econometrica, 29, 3, 336-362.
Livingstone, I. (1991): A reassessment of Kenya's rural and urban informal sector. World
Development, 19, 6, 651-670.
Massell, B. and Heyer, J. (1969): Household Expenditure in Nairobi: A Statistical Analysis of
Consumer Behavior. Economic Development and Cultural Change, 17, 2, 212-234.
McKenzie, D. (2005): Measuring Inequality with Asset Indicators. Journal of Population
Economics, 18, 2, 229-260.
Merella, V. (2006): Engel’s curve and product differentiation: A dynamic analysis of the effects of
quality on consumer’s choice. International Review of Economics, 53, 2, 157-182.
Okunade, A. (1985): Engel Curves in Developing Nations: The Case of Africa. Eastern Africa
Economic Review, 1, 1, 13-22.
Ostby, I. and Gulilat, T. (1969): A statistical study of household expenditure in Addis Ababa.
Eastern Africa Economic Review, 1, 2, 63-74.
17
20. Reilly, B., Krstic, G. and Cominetta, M (2006): Purchasing form Informal Markets: Evidence from
Serbia. Applied Economics Quarterly, 52, 1, 239-264.
Sethuraman, S. (1997): Urban Poverty and the Informal Sector: A Critical Assessment of
Current Strategies (Geneva, International Labour Organization).
Staiger, D. and Stock, J.H. (1997): Instrumental Variables Regression with Weak Instruments.
Econometrica, 65, 3, 557-586.
Stock, J.H. and Yogo, M. (2003): Testing for Weak Instruments in Linear IV Regression. NBER
Technical Working Paper, 284.
Teklu, T. (1996): Food demand studies in Sub-Saharan Africa: A survey of empirical evidence.
Food Policy, 21, 6, 479-496.
Theil, H. (1979): The Effect of Measurement Errors in the Estimation of Demand Systems.
Economic Letters, 3, 4, 373-376.
Tiwari, R. S. and Goel, M. S. (2002) Migration pattern, poverty profile and consumption pattern : a
study of unregistered informal sector workers in cities of Agra and Kanpur in Uttar Pradesh and
Puri in Orissa The Indian Journal of Economics, 82, 3, 311-335.
Wan, G. (1996): Income elasticities of household demand in rural China: Estimates from cross-sectional
18
survey data. Journal of Economic Studies, 23, 3, 18-33.
Xaba, J., Horn, P. & Motala, S. (2002): The informal sector in sub-Saharan Africa. ILO Working
Paper on the Informal Economy, Employment Sector, ILO, Geneva, 848.
21. 19
Table 1: Summary statistics of sample households by country
Country Benin -
Cotonou
Burkina
Faso -
Ouaga
Mali -
Bamako
Niger -
Niamey
Senegal -
Dakar
Togo -
Lomé
Category coastal sahel sahel sahel coastal coastal
Mean number of household members
Infants (<6) 0.4 0.6 0.8 0.8 0.4 0.4
Children (6-15) 0.7 1.3 1.2 1.5 1.2 0.7
Adults (>15) 3.0 4.0 3.6 3.9 6.1 3.0
Mean age of householdhead 42.5 43.2 43.8 44.5 50.5 39.6
Sex of householdhead (male=1) 72.9% 87.0% 88.6% 86.3% 73.0% 72.1%
Completed primary education of
83.9% 54.2% 53.1% 48.0% 58.7% 83.3%
householdhead (%)
Household head earns primary income in
the informal sector (%)
54.1% 46.8% 50.1% 47.1% 38.2% 61.3%
Observations 573 936 956 575 567 569
Source: Authors’ calculation based on 1-2-3 Surveys
Table 2: Annual Household Expenditure Shares by Sector (%)
Country Benin -
Cotonou
Burkina
Faso -
Ouaga
Mali -
Bamako
Niger -
Niamey
Senegal -
Dakar
Togo -
Lomé
Food and Non-Alcoholic Beverages 29.0 29.6 35.0 36.2 36.4 33.4
Alcoholic Beverages and Tobacco 1.7 2.9 0.5 1.1 0.8 1.8
Clothing and Shoes 6.1 6.6 7.2 7.1 5.2 8.5
Housing 14.4 11.2 15.9 13.2 17.8 9.8
Gas, Electricity and Water 6.9 6.7 9.6 7.6 8.3 5.4
Furniture and Household Maintenance 3.8 4.6 5.3 5.7 6.0 4.4
Health and Education 8.5 9.4 5.3 5.7 6.4 7.9
Transport and Communication 14.7 16.3 13.5 12.4 9.8 10.8
Leisure and Culture 3.1 3.8 1.7 2.7 2.9 2.5
Hotels and Restaurants 7.0 4.9 1.7 4.6 2.2 9.3
Diverse Goods and Services 4.8 4.0 4.3 3.6 4.1 6.2
Source: Authors’ calculation based on 1-2-3 Surveys
24. 22
Table 5: Annual Household Expenditure Shares by Product Category (%)
Country Benin -
Cotonou
Burkina
Faso -
Ouaga
Mali -
Bamako
Niger –
Niamey
Senegal -
Dakar
Togo -
Lomé
Budget share goods
Budget share formal goods
Formal distribution channel 4.3 5.5 7.2 4.5 8.3 0.4
Informal distribution channel 9.5 11.9 15.1 9.3 22.2 7.2
Budget share informal goods
Formal distribution channel 0.7 0.5 0.3 0.1 0.5 0.1
Informal distribution channel 17.1 17.3 25.5 15.0 17.7 21.7
Budget share imported goods
Formal distribution channel 10.0 10.1 5.2 6.7 4.1 8.8
Informal distribution channel 18.3 21.9 16.5 31.6 11.3 24.5
Budget share services
Formal distribution channel 10.7 9.5 6.4 8.6 10.7 6.1
Informal distribution channel 29.4 23.2 23.7 24.1 25.1 31.3
Note: For each country, budget shares sum up to 100 percent.
Source: Authors’ calculation based on 1-2-3 Surveys.
Table 6: Share of informal households in overall expenditures (%)
Country Benin -
Cotonou
Burkina
Faso -
Ouaga
Mali –
Bamako
Niger -
Niamey
Senegal -
Dakar
Togo -
Lomé
Goods
Formal goods
Formal distribution channel 36.8 24.1 31.0 48.1 26.2 35.5
Informal distribution channel 50.0 39.7 43.7 50.5 34.6 56.3
Informal goods
Formal distribution channel 27.0 37.4 24.3 56.2 33.8 55.4
Informal distribution channel 49.6 42.1 46.1 49.1 35.2 57.5
Imported goods
Formal distribution channel 34.6 24.3 31.5 35.2 24.5 48.0
Informal distribution channel 48.5 38.2 41.8 51.8 34.5 56.7
Services
Formal distribution channel 36.0 24.8 34.3 43.2 20.8 48.6
Informal distribution channel 35.5 26.9 28.3 37.1 18.4 48.4
Note: Informal Households are defined as those for whom the informal sector is the primary income source. From each cell, expenditure
shares of formal households can be calculated as 100 percent minus the expenditure share of informal households. The expenditure
share of formal households on formal goods distributed through formal distribution channels in Benin, for example, is 100 - 36.8 = 63.2.
Source: Authors’ calculation based on 1-2-3 Surveys
25. 23
Table 7: Budget Elasticities for Sectors (Expenditure)
Country Benin -
Cotonou
Burkina
Faso -
Ouaga
Mali -
Bamako
Niger -
Niamey
Senegal
- Dakar
Togo -
Lomé Pooleda
Elasticities by Sector (OLS)
Food and Non-Alcoholic Beverages 0.79*** 0.77*** 0.76*** 0.73*** 0.80*** 0.96*** 0.79***
Alcoholic Beverages and Tobacco 0.87*** 0.85*** 0.47** 0.28 0.20 0.69*** 0.64***
Clothing and Shoes 1.08*** 1.14*** 1.17*** 1.17*** 1.23*** 1.29*** 1.17***
Housing 0.69*** 0.64*** 0.50*** 0.61*** 0.83*** 0.42*** 0.62***
Gas, Electricity and Water 0.86*** 0.86*** 1.19*** 0.89*** 0.79*** 0.85*** 0.93***
Furniture and Household Maintenance 1.23*** 1.18*** 1.20*** 1.25*** 1.36*** 1.14*** 1.20***
Health and Education 1.22*** 1.33*** 1.26*** 1.30*** 1.45*** 1.34*** 1.30***
Transport and Communication 1.38*** 1.75*** 1.67*** 1.71*** 1.83*** 1.39*** 1.63***
Leisure and Culture 1.13*** 1.17*** 1.23*** 1.32*** 1.37*** 1.19*** 1.23***
Hotels and Restaurants 0.56*** 0.39*** 0.41*** 0.49*** 0.38*** 0.57*** 0.45***
Diverse Goods and Services 0.83*** 1.07*** 1.12*** 1.02*** 1.14*** 0.88*** 1.02***
Elasticities by Sector (2SLS)
Food and Non-Alcoholic Beverages 0.59*** 0.53*** 0.50*** 0.37*** 0.55*** 0.51*** 0.52***
Gas, Electricity and Water 1.02*** 1.29*** 1.53*** 1.32*** 1.02*** 1.52*** 1.27***
Dependent Variable is log of total household expenditure on a specific product group; Independent Variable is log of total household
expenditure; Included Control Variables are log number of household members, gender of household head, age of household head,
completed primary education of household head, religion of household head (Muslim or Catholic Christian) and informal sector is
source of household head's primary income; *** p<0.01, ** p<0.05, * p<0.1 based on robust standard errors; a includes country
dummies -
Source: Authors’ calculation based on 1-2-3 Surveys
26. 24
Table 8: Budget Elasticities for Spending Categories (Expenditure)
Country Benin -
Cotonou
Burkina
Faso -
Ouaga
Mali -
Bamako
Niger -
Niamey
Senegal -
Dakar
Togo -
Lomé Pooleda
Elasticities by Product Category and Distribution Channel (OLS)
Elasticities of goods
Elasticities of formal goods 0.97*** 1.19*** 1.33*** 1.11*** 0.98*** 1.00*** 1.13***
Formal distribution channel 1.39*** 1.44*** 1.46*** 1.13*** 1.46*** 1.24*** 1.41***
Informal distribution channel 0.60*** 0.92*** 0.91*** 0.67*** 0.63*** 0.88*** 0.80***
Elasticities of informal goods 0.82*** 0.79*** 0.85*** 0.89*** 1.12*** 0.88*** 0.87***
Formal distribution channel 1.24*** 0.77*** 0.53 0.58 1.19*** 0.90 0.87***
Informal distribution channel 0.65*** 0.69*** 0.75*** 0.84*** 0.92*** 0.86*** 0.76***
Elasticities of imported goods 1.43*** 1.32*** 1.41*** 1.12*** 1.26*** 1.32*** 1.31***
Formal distribution channel 1.93*** 1.53*** 1.52*** 1.47*** 1.53*** 1.65*** 1.60***
Informal distribution channel 0.93*** 1.01*** 1.10*** 0.82*** 0.80*** 1.12*** 0.97***
Elasticities of services 1.06*** 1.09*** 0.96*** 1.18*** 1.20*** 0.96*** 1.07***
Formal distribution channel 1.79*** 1.59*** 1.60*** 1.85*** 2.00*** 1.45*** 1.68***
Informal distribution channel 0.75*** 0.76*** 0.69*** 0.84*** 0.82*** 0.72*** 0.76***
Elasticities by Product Category and Distribution Channel (2SLS)
Elasticities of goods
Elasticities of formal goods 0.86*** 1.38*** 1.32*** 1.21*** 0.95*** 0.59*** 1.12***
Formal distribution channel 1.66*** 2.24*** 2.03*** 1.86*** 2.09*** 1.67*** 2.00***
Informal distribution channel 0.20** 0.63*** 0.50*** 0.30*** 0.40*** 0.46*** 0.45***
Elasticities of informal goods 0.66*** 0.57*** 0.44*** 0.64*** 0.94*** 0.35*** 0.61***
Formal distribution channel 1.12*** 0.86*** 1.17* -0.33 1.11*** 1.22*** 0.92***
Informal distribution channel 0.40*** 0.44*** 0.35*** 0.62*** 0.66*** 0.31** 0.47***
Elasticities of imported goods 1.35*** 1.13*** 1.44*** 0.97*** 0.92*** 1.53*** 1.21***
Formal distribution channel 1.95*** 1.71*** 1.97*** 2.24*** 1.60*** 2.95*** 1.98***
Informal distribution channel 0.73*** 0.66*** 1.04*** 0.45*** 0.33** 0.92*** 0.69***
Elasticities of services 1.27*** 1.41*** 1.32*** 1.53*** 1.57*** 1.25*** 1.39***
Formal distribution channel 2.01*** 1.88*** 1.80*** 2.17*** 2.05*** 2.15*** 1.95***
Informal distribution channel 0.99*** 1.00*** 1.11*** 1.20*** 1.25*** 0.86*** 1.06***
Dependent Variable is log of total household expenditure on a specific product group; Independent Variable is log of total household
expenditure which is instrumented by a wealth index; Included Control Variables are log number of household members, gender of
household head, age of household head, completed primary education of household head, religion of household head (Muslim or
Catholic Christian) and informal sector is source of household head's primary income; *** p<0.01, ** p<0.05, * p<0.1 based on robust
standard errors; a includes country dummies - Source: Authors’ calculation based on 1-2-3 Surveys
27. 25
Figure 1: Elasticities by Product Category and Distribution Channel in Benin
Source: Author calculation based on 1-2-3 Surveys
28. 26
Table 9: Budget Elasticities for Sectors, Quadratic Specification (OLS)
Country Benin - Cotonou Burkina Faso -
Ouaga Mali - Bamako Niger - Niamey Senegal - Dakar Togo - Lomé
Elasticities by Sector EXP EXP2 EXP EXP2 EXP EXP2 EXP EXP2 EXP EXP2 EXP EXP2
Food and Non-Alcoholic Beverages 4.51*** -0.13*** 7.17*** -0.23*** 8.19*** -0.26*** 7.86*** -0.25*** 5.79*** -0.17** 6.00*** -0.19***
Marginal Effects 0.83 0.81 0.79 0.80 0.79 0.99
Standard Errors 0.06 0.03 0.04 0.06 0.05 0.06
Observations 568 933 953 571 567 568
R² 0.68 0.67 0.65 0.53 0.65 0.59
Transport and Communication -3.09* 0.16** 0.50 0.04 -5.07** 0.23*** -9.78*** 0.41*** -5.96* 0.27** -3.39* 0.18**
Marginal Effects 1.33 1.73 1.64 1.61 1.83 1.35
Standard Errors 0.07 0.05 0.07 0.08 0.08 0.08
Observations 560 880 868 531 563 560
R² 0.66 0.64 0.46 0.55 0.56 0.49
Dependent Variable is log of total household expenditure on a specific product group; Independent Variable is log and squared log of total household expenditure; Included Control Variables are log number
of household members, gender of household head, age of household head, completed primary education of household head, religion of household head (Muslim or Catholic Christian) and informal sector is
source of household head's primary income; *** p<0.01, ** p<0.05, * p<0.1 based on robust standard errors
Source: Authors’ calculation based on 1-2-3 Surveys
29. 27
Table 10: Annual Household Expenditure Shares and Budget Elasticities for Food Products and Non-Alcoholic Beverages
Country Benin -
Cotonou
Burkina
Faso -
Ouaga
Mali -
Bamako
Niger -
Niamey
Senegal -
Dakar
Togo -
Lomé Pooleda
Expenditure Shares in %
Budget share formal goods
Formal distribution channel 1.6 0.7 0.1 0.2 0.6 0.3 0.5
Informal distribution channel 12.8 12.0 13.8 6.0 30.5 10.0 15.9
Budget share informal goods
Formal distribution channel 2.4 1.7 0.8 0.3 1.0 0.2 1.1
Informal distribution channel 57.4 56.3 72.2 41.0 48.2 66.2 57.9
Budget share imported goods
Formal distribution channel 2.8 1.2 0.3 0.8 1.1 0.6 1.0
Informal distribution channel 23.0 28.0 12.8 51.7 18.6 22.7 23.5
Budget Elasticities (OLS) Estimates
Elasticities of formal goods 0.83*** 1.00*** 0.75*** 0.76*** 0.80*** 0.80*** 0.86***
Formal distribution channel 1.04* 0.95*** 1.26** 2.03* 0.86*** 1.24 1.07***
Informal distribution channel 0.63*** 0.89*** 0.71*** 0.69*** 0.66*** 0.73*** 0.75***
Elasticities of informal goods 0.80*** 0.82*** 0.84*** 0.94*** 1.13*** 0.90*** 0.88***
Formal distribution channel 1.25*** 0.77*** 0.61 0.55 1.15*** 0.83 0.89***
Informal distribution channel 0.62*** 0.72*** 0.74*** 0.91*** 0.93*** 0.87*** 0.78***
Elasticities of imported goods 1.20*** 0.88*** 0.72*** 0.78*** 0.78*** 1.37*** 0.91***
Formal distribution channel 1.15*** 0.56** 1.39*** 0.83** 0.58 0.79 0.91***
Informal distribution channel 0.90*** 0.72*** 0.64*** 0.66*** 0.61*** 1.23*** 0.75***
Dependent Variable is log of total household expenditure on food and non-alcoholic beverages in a specific product group; Independent
Variable is log of total household expenditure; Included Control Variables are log number of household members, gender of household
head, age of household head, completed primary education of household head, religion of household head (Muslim or Catholic
Christian) and informal sector is source of household head's primary income; *** p<0.01, ** p<0.05, * p<0.1 based on robust standard
errors; a includes country dummies
Source: Authors’ calculation based on 1-2-3 Surveys
30. 28
Table 11: Annual Household Expenditure Shares and Budget Elasticities for Transport and Communication
Country Benin -
Cotonou
Burkina
Faso -
Ouaga
Mali -
Bamako
Niger -
Niamey
Senegal
- Dakar
Togo -
Lomé Pooleda
Expenditure Shares in %
Budget share formal goods
Formal distribution channel 1.6 2.4 2.0 4.5 16.0 0.2 4.4
Informal distribution channel 1.1 4.0 7.1 3.2 4.1 0.0 4.1
Budget share imported goods
Formal distribution channel 17.5 33.1 17.3 24.0 8.0 20.4 20.6
Informal distribution channel 19.3 23.6 19.9 13.1 1.5 11.8 16.6
Budget share services
Formal distribution channel 24.3 15.2 21.0 25.5 41.7 7.0 23.0
Informal distribution channel 36.2 21.7 32.7 29.7 28.8 60.5 31.3
Budget Elasticities (OLS) Estimates
Elasticities of formal goods 1.12*** 0.85*** 0.84*** 1.23** 2.60*** 0.96 1.08***
Formal distribution channel 2.25*** 1.04*** 0.23 0.94 2.71*** 0.98 1.27***
Informal distribution channel 1.68* 0.69*** 1.07*** 0.93 2.11* - 0.83***
Elasticities of imported goods 1.48*** 1.53*** 1.23*** 1.48*** 0.71 1.59*** 1.43***
Formal distribution channel 1.42** 1.25*** 0.99*** 0.69* 1.53 0.92*** 1.17***
Informal distribution channel 1.16*** 1.00*** 1.17*** 1.07*** 0.53 0.73*** 1.01***
Elasticities of services 1.32*** 1.69*** 1.33*** 1.52*** 1.68*** 1.27*** 1.49***
Formal distribution channel 1.66*** 1.47*** 1.60*** 1.36*** 1.69*** 0.88** 1.51***
Informal distribution channel 0.66*** 1.11*** 0.88*** 0.94*** 1.17*** 1.05*** 0.97***
Dependent Variable is log of total household expenditure on transport and communication in a specific product group; Independent
Variable is log of total household expenditure; Included Control Variables are log number of household members, gender of household
head, age of household head, completed primary education of household head, religion of household head (Muslim or Catholic
Christian) and informal sector is source of household head's primary income; *** p<0.01, ** p<0.05, * p<0.1 based on robust standard
errors; a includes country dummies
Source: Authors’ calculation based on 1-2-3 Surveys