Download to read offline


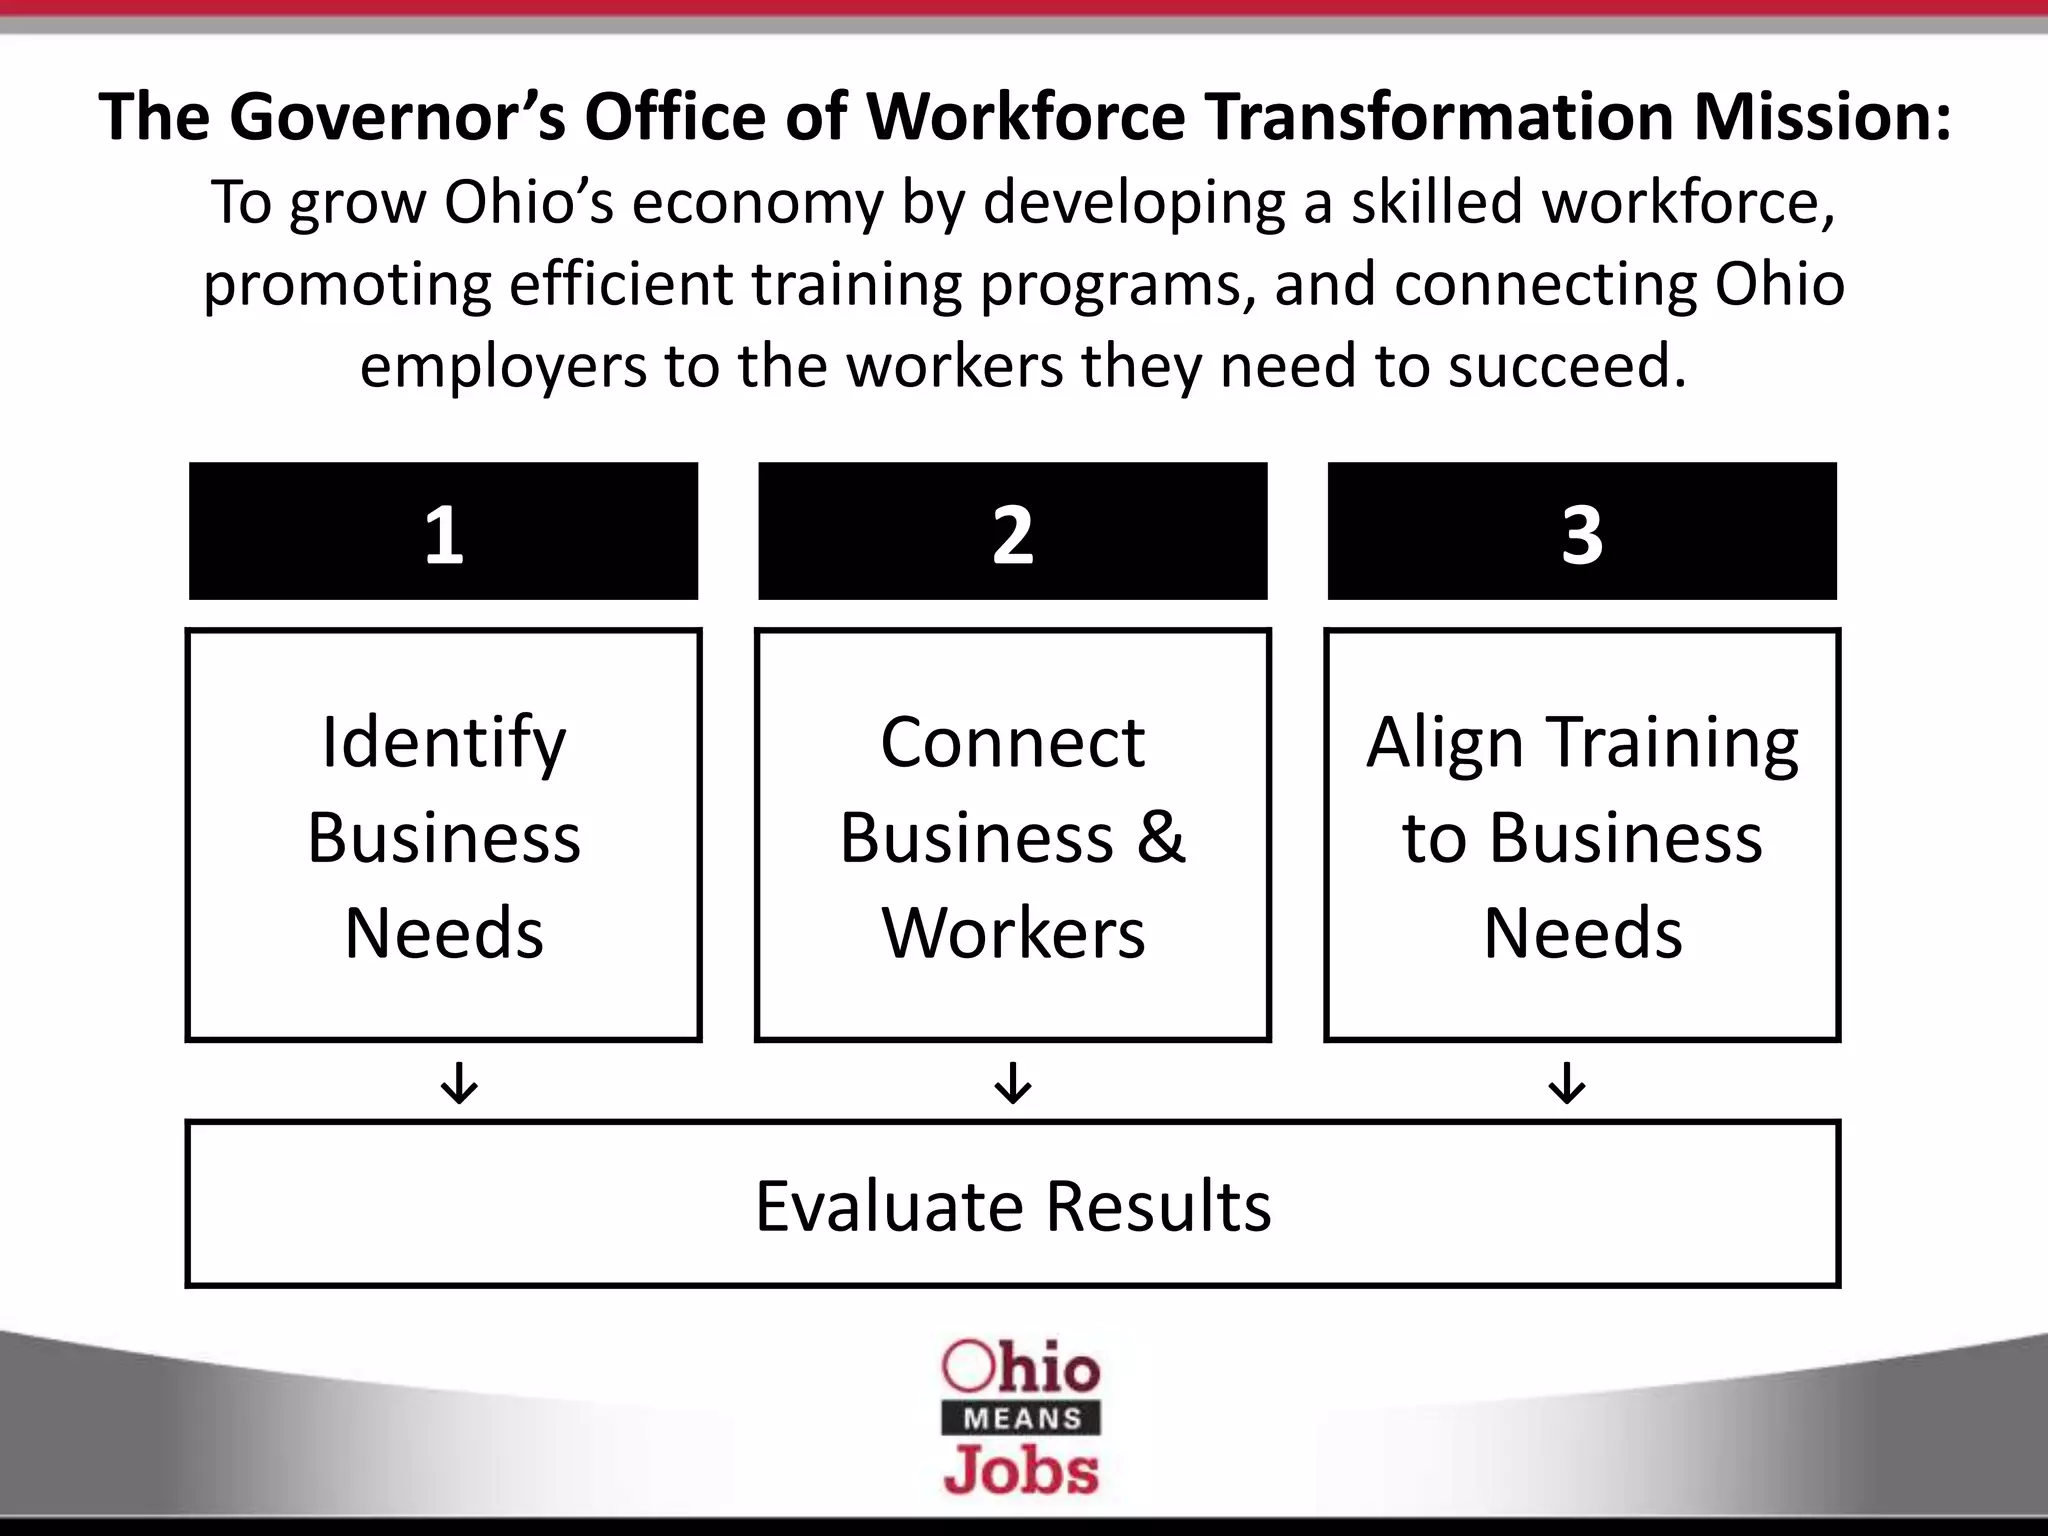

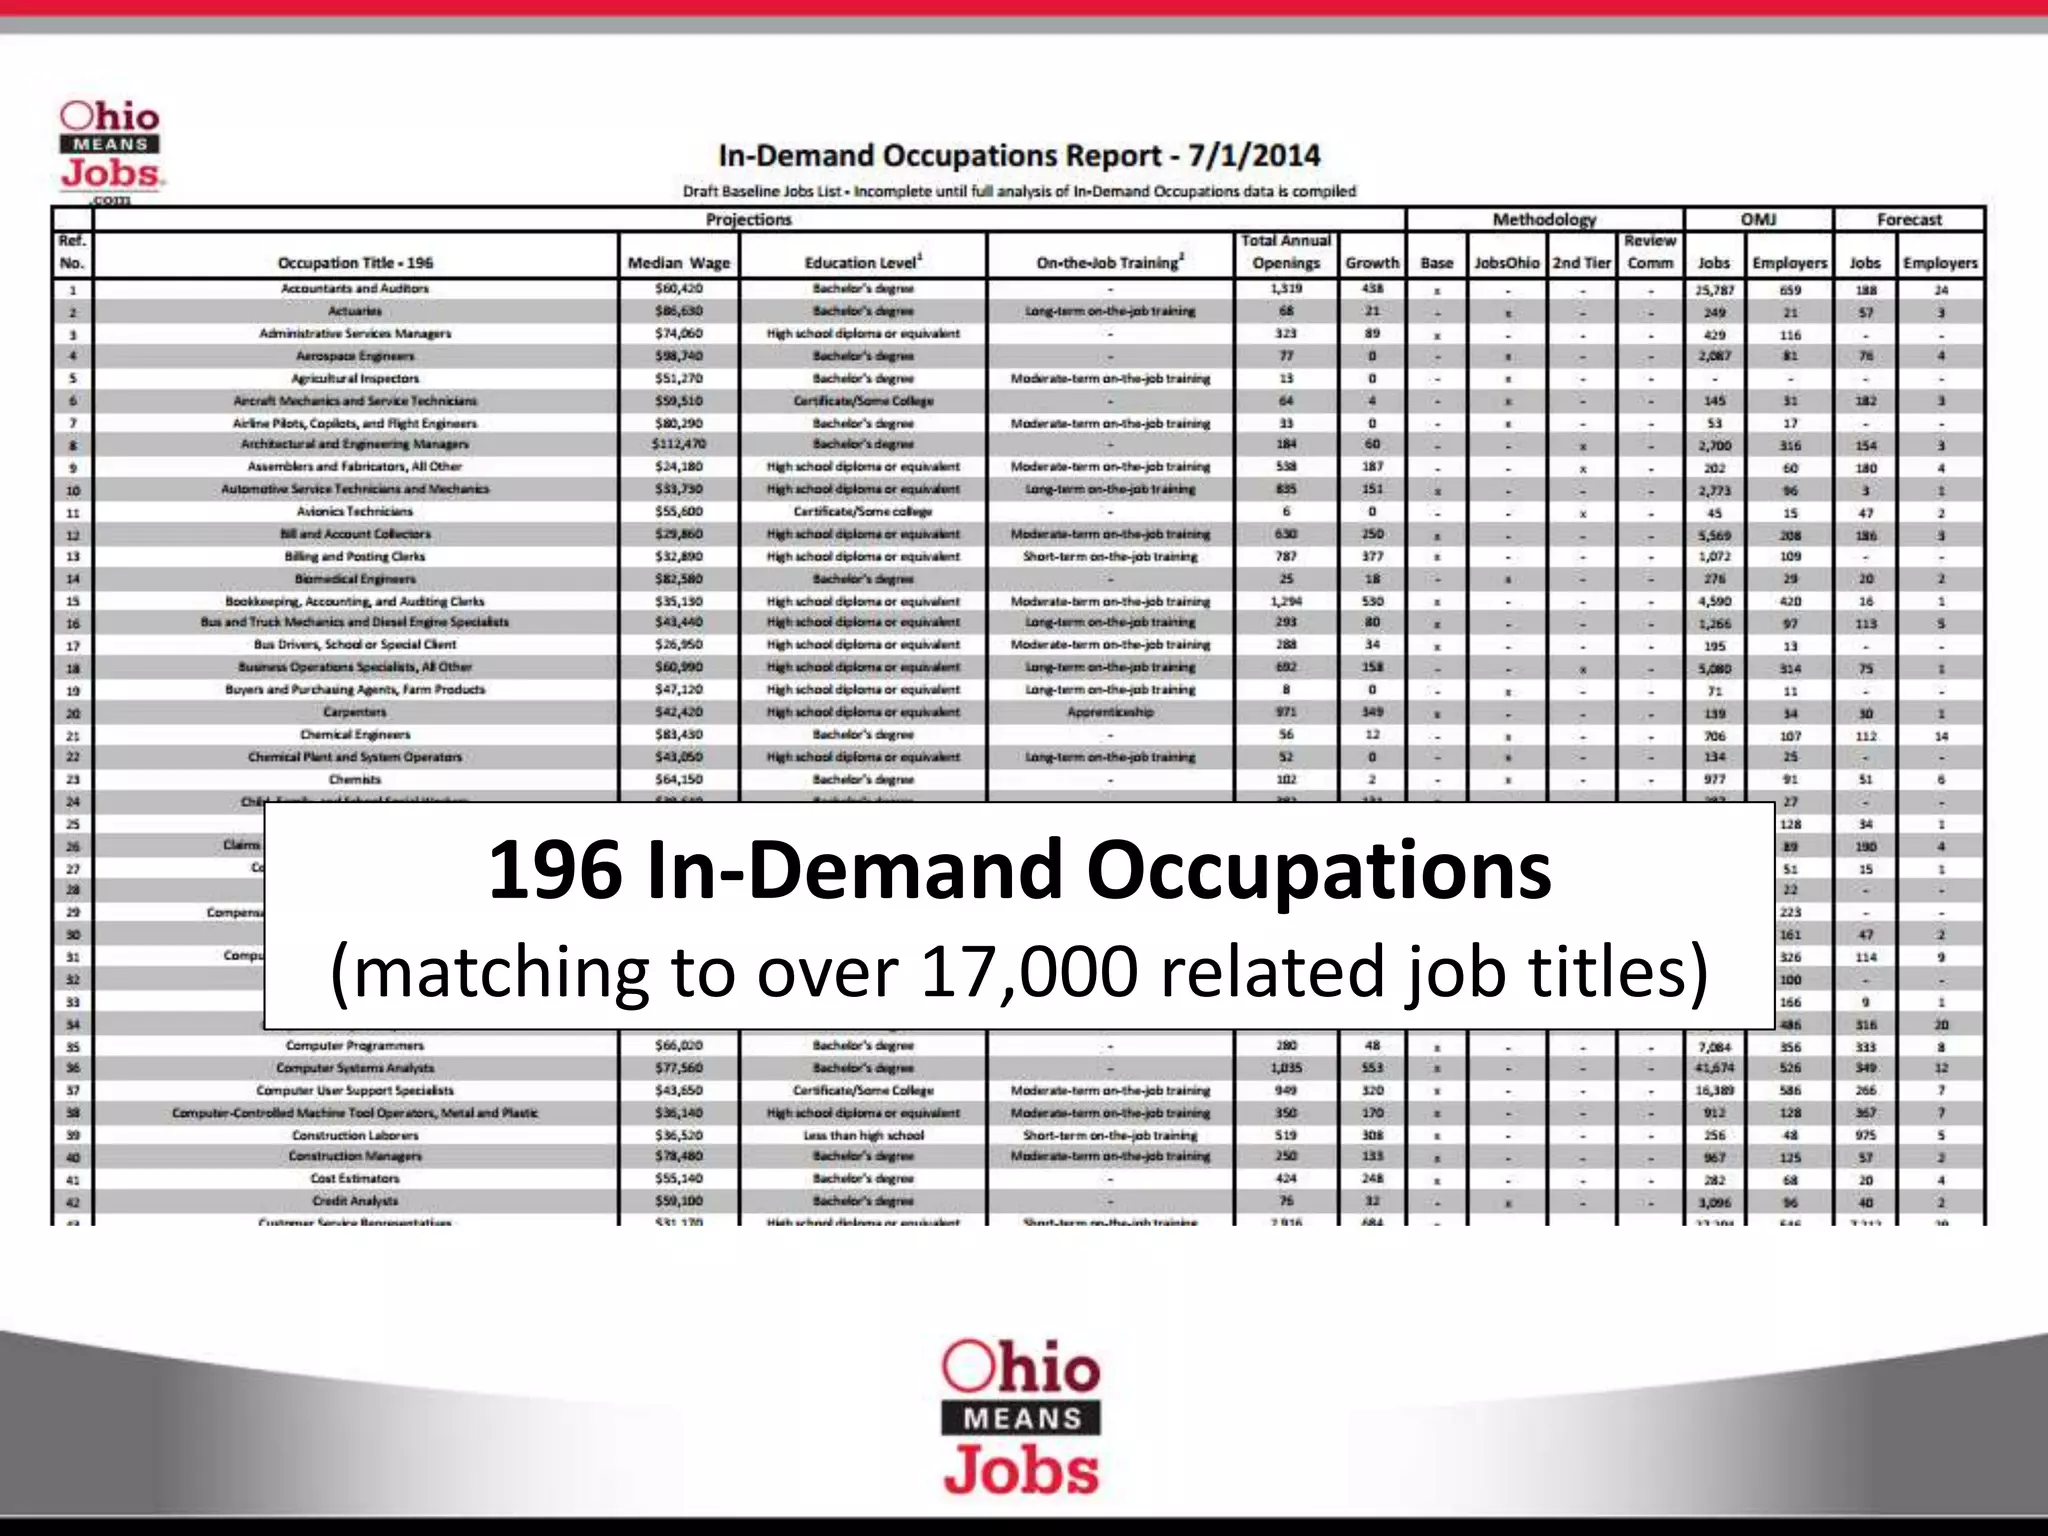
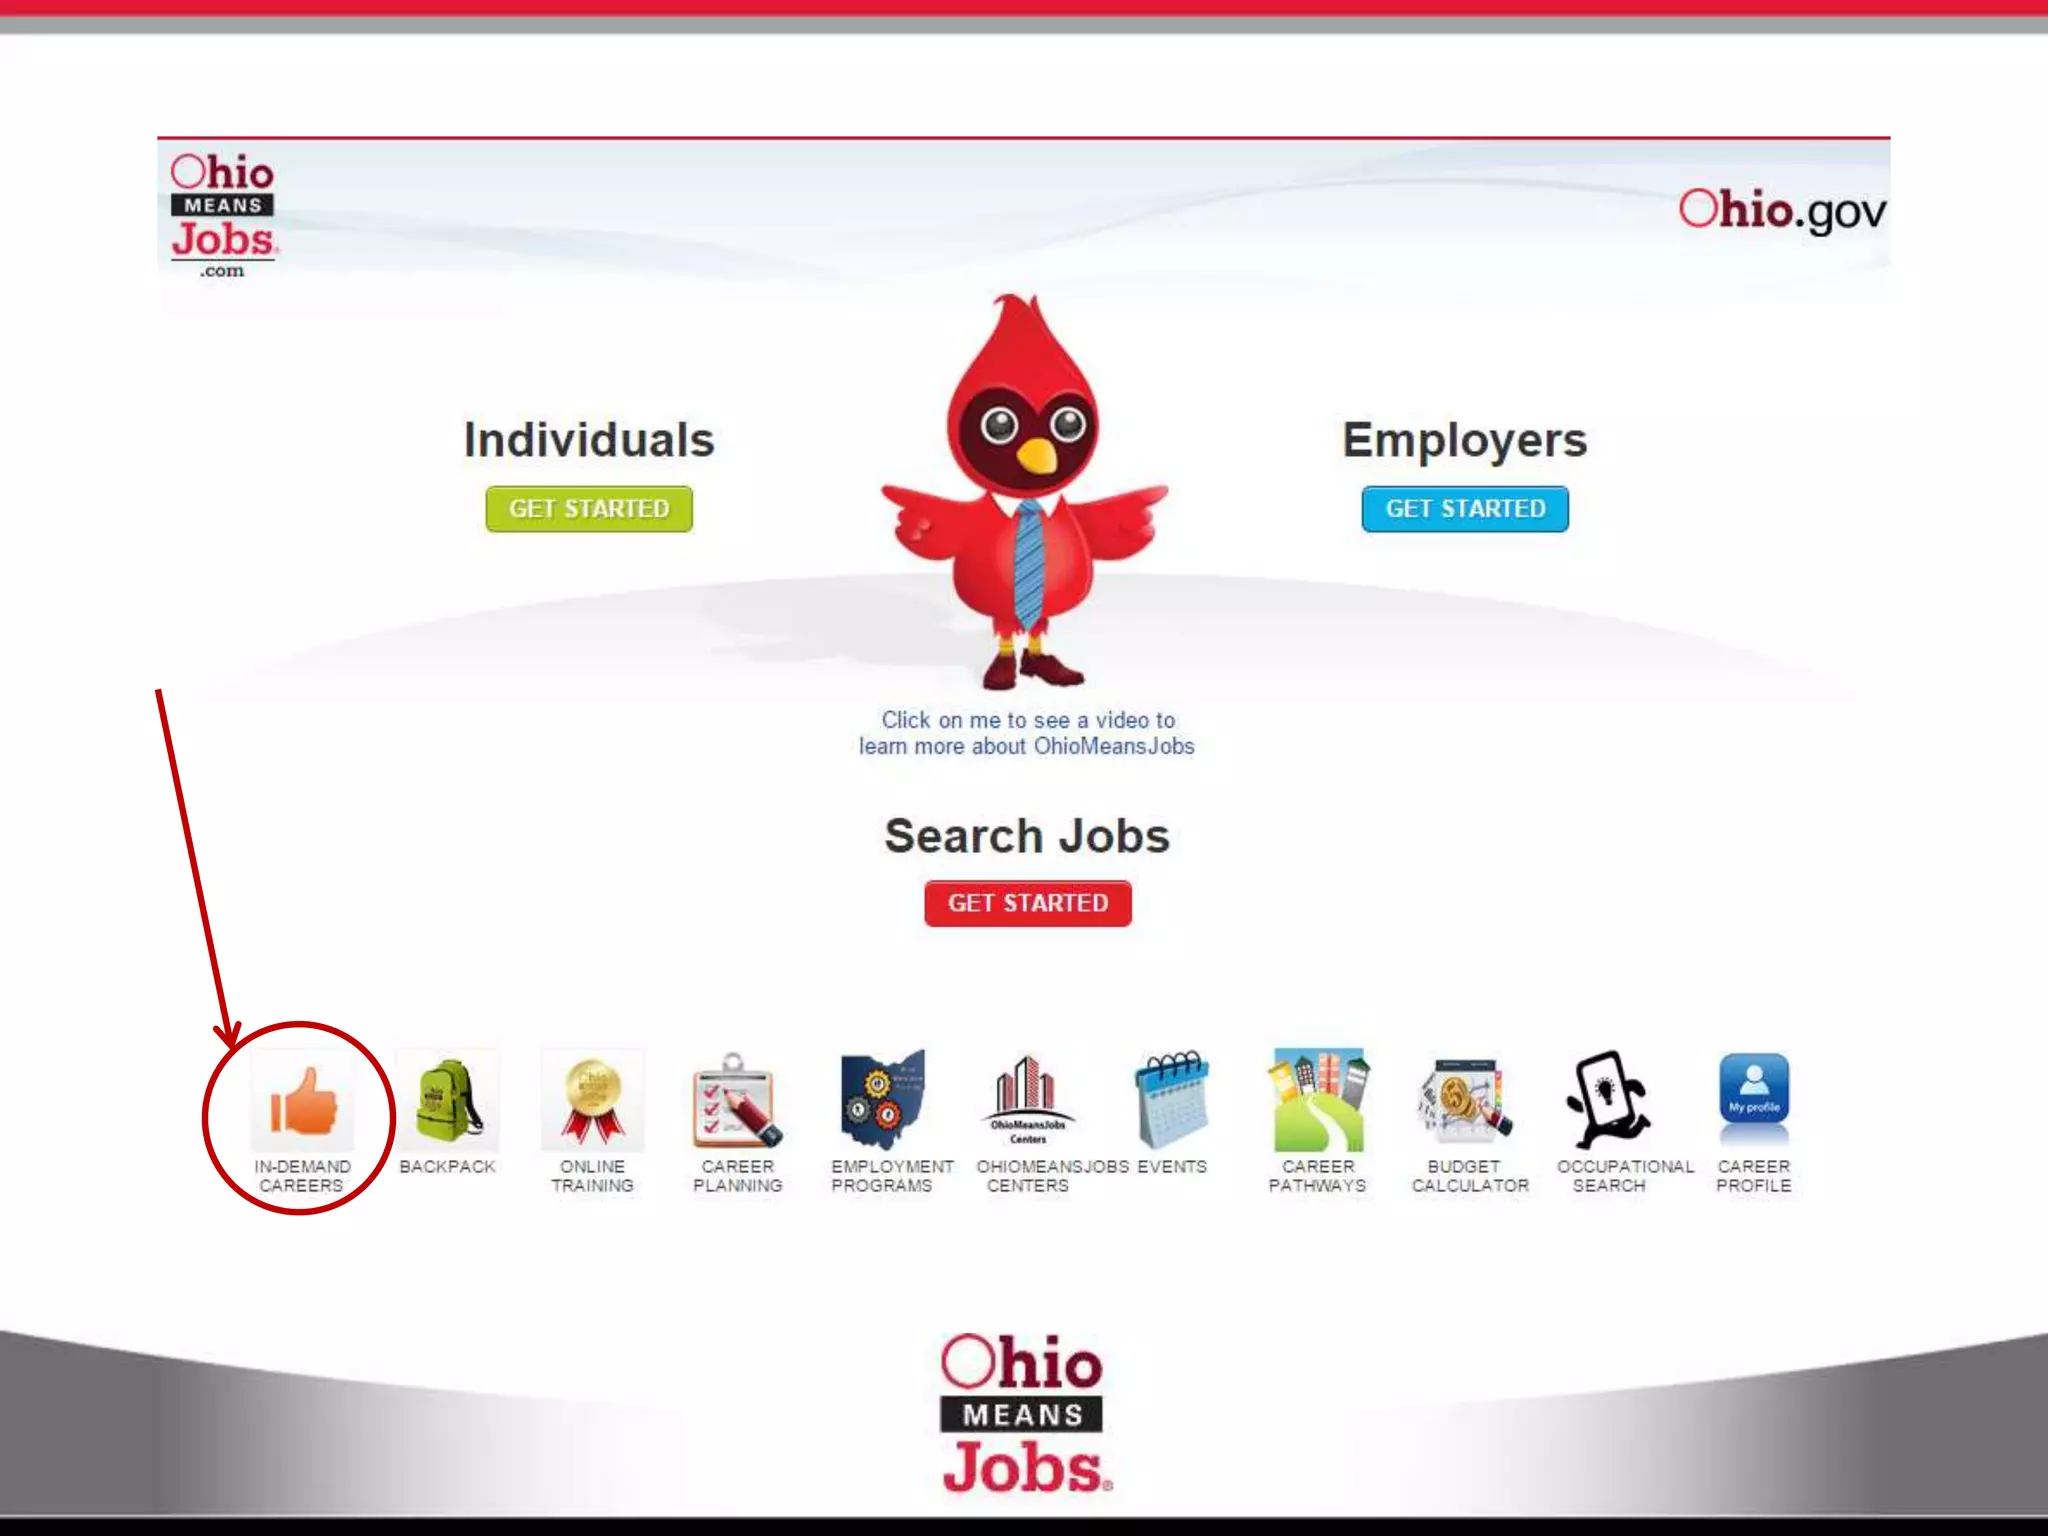


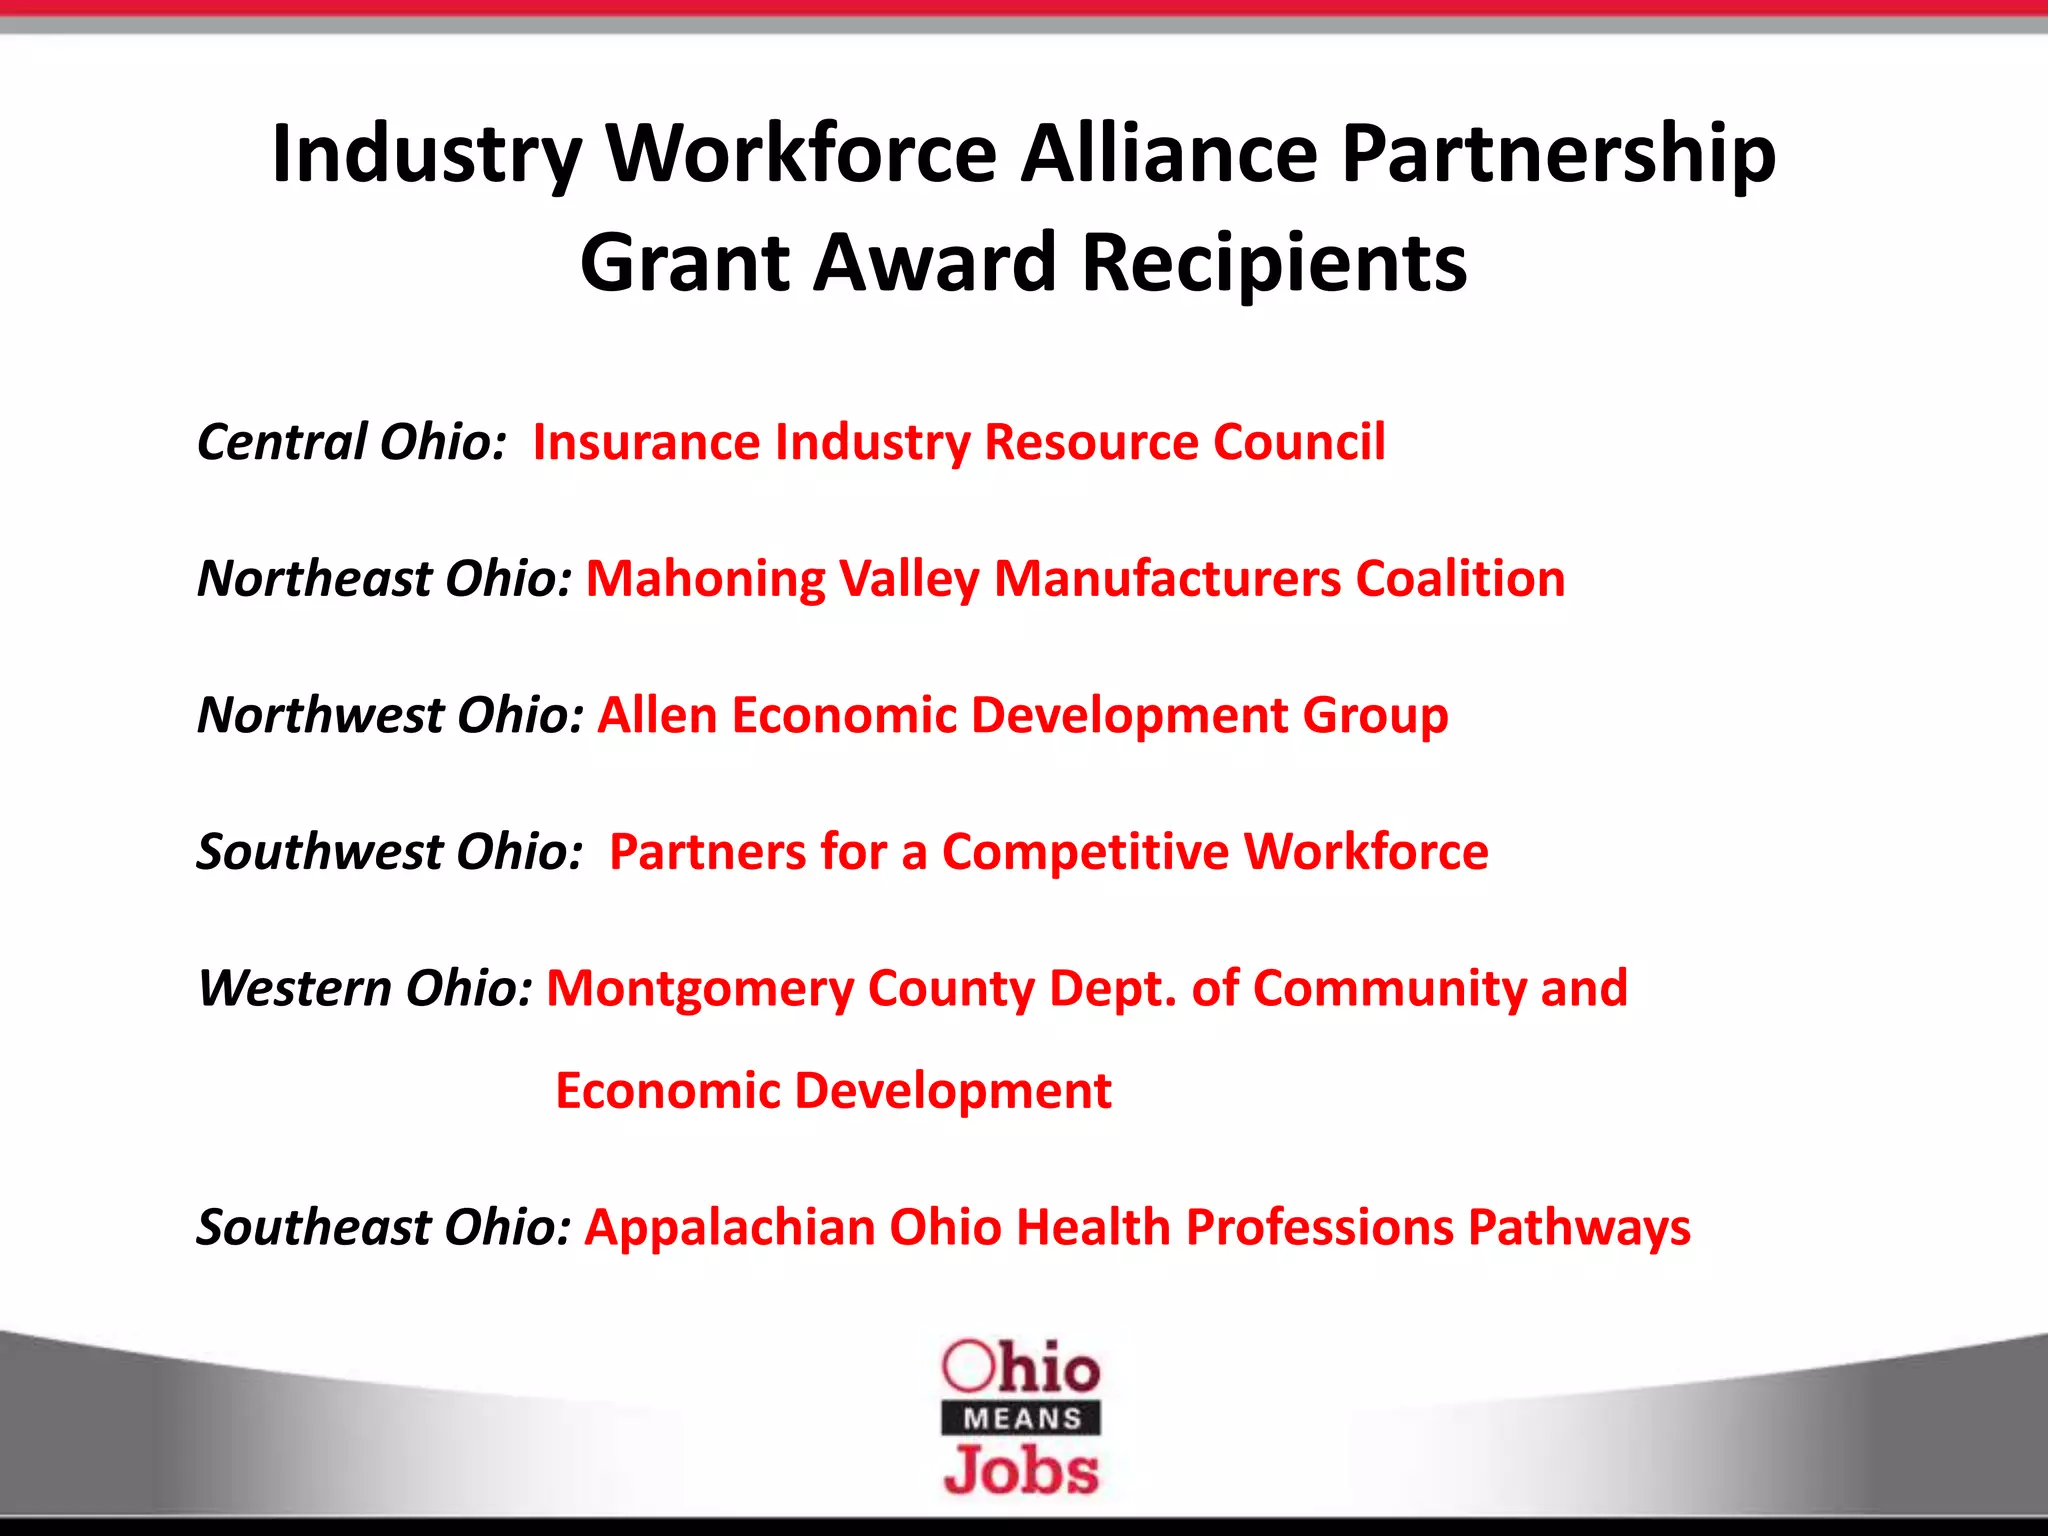

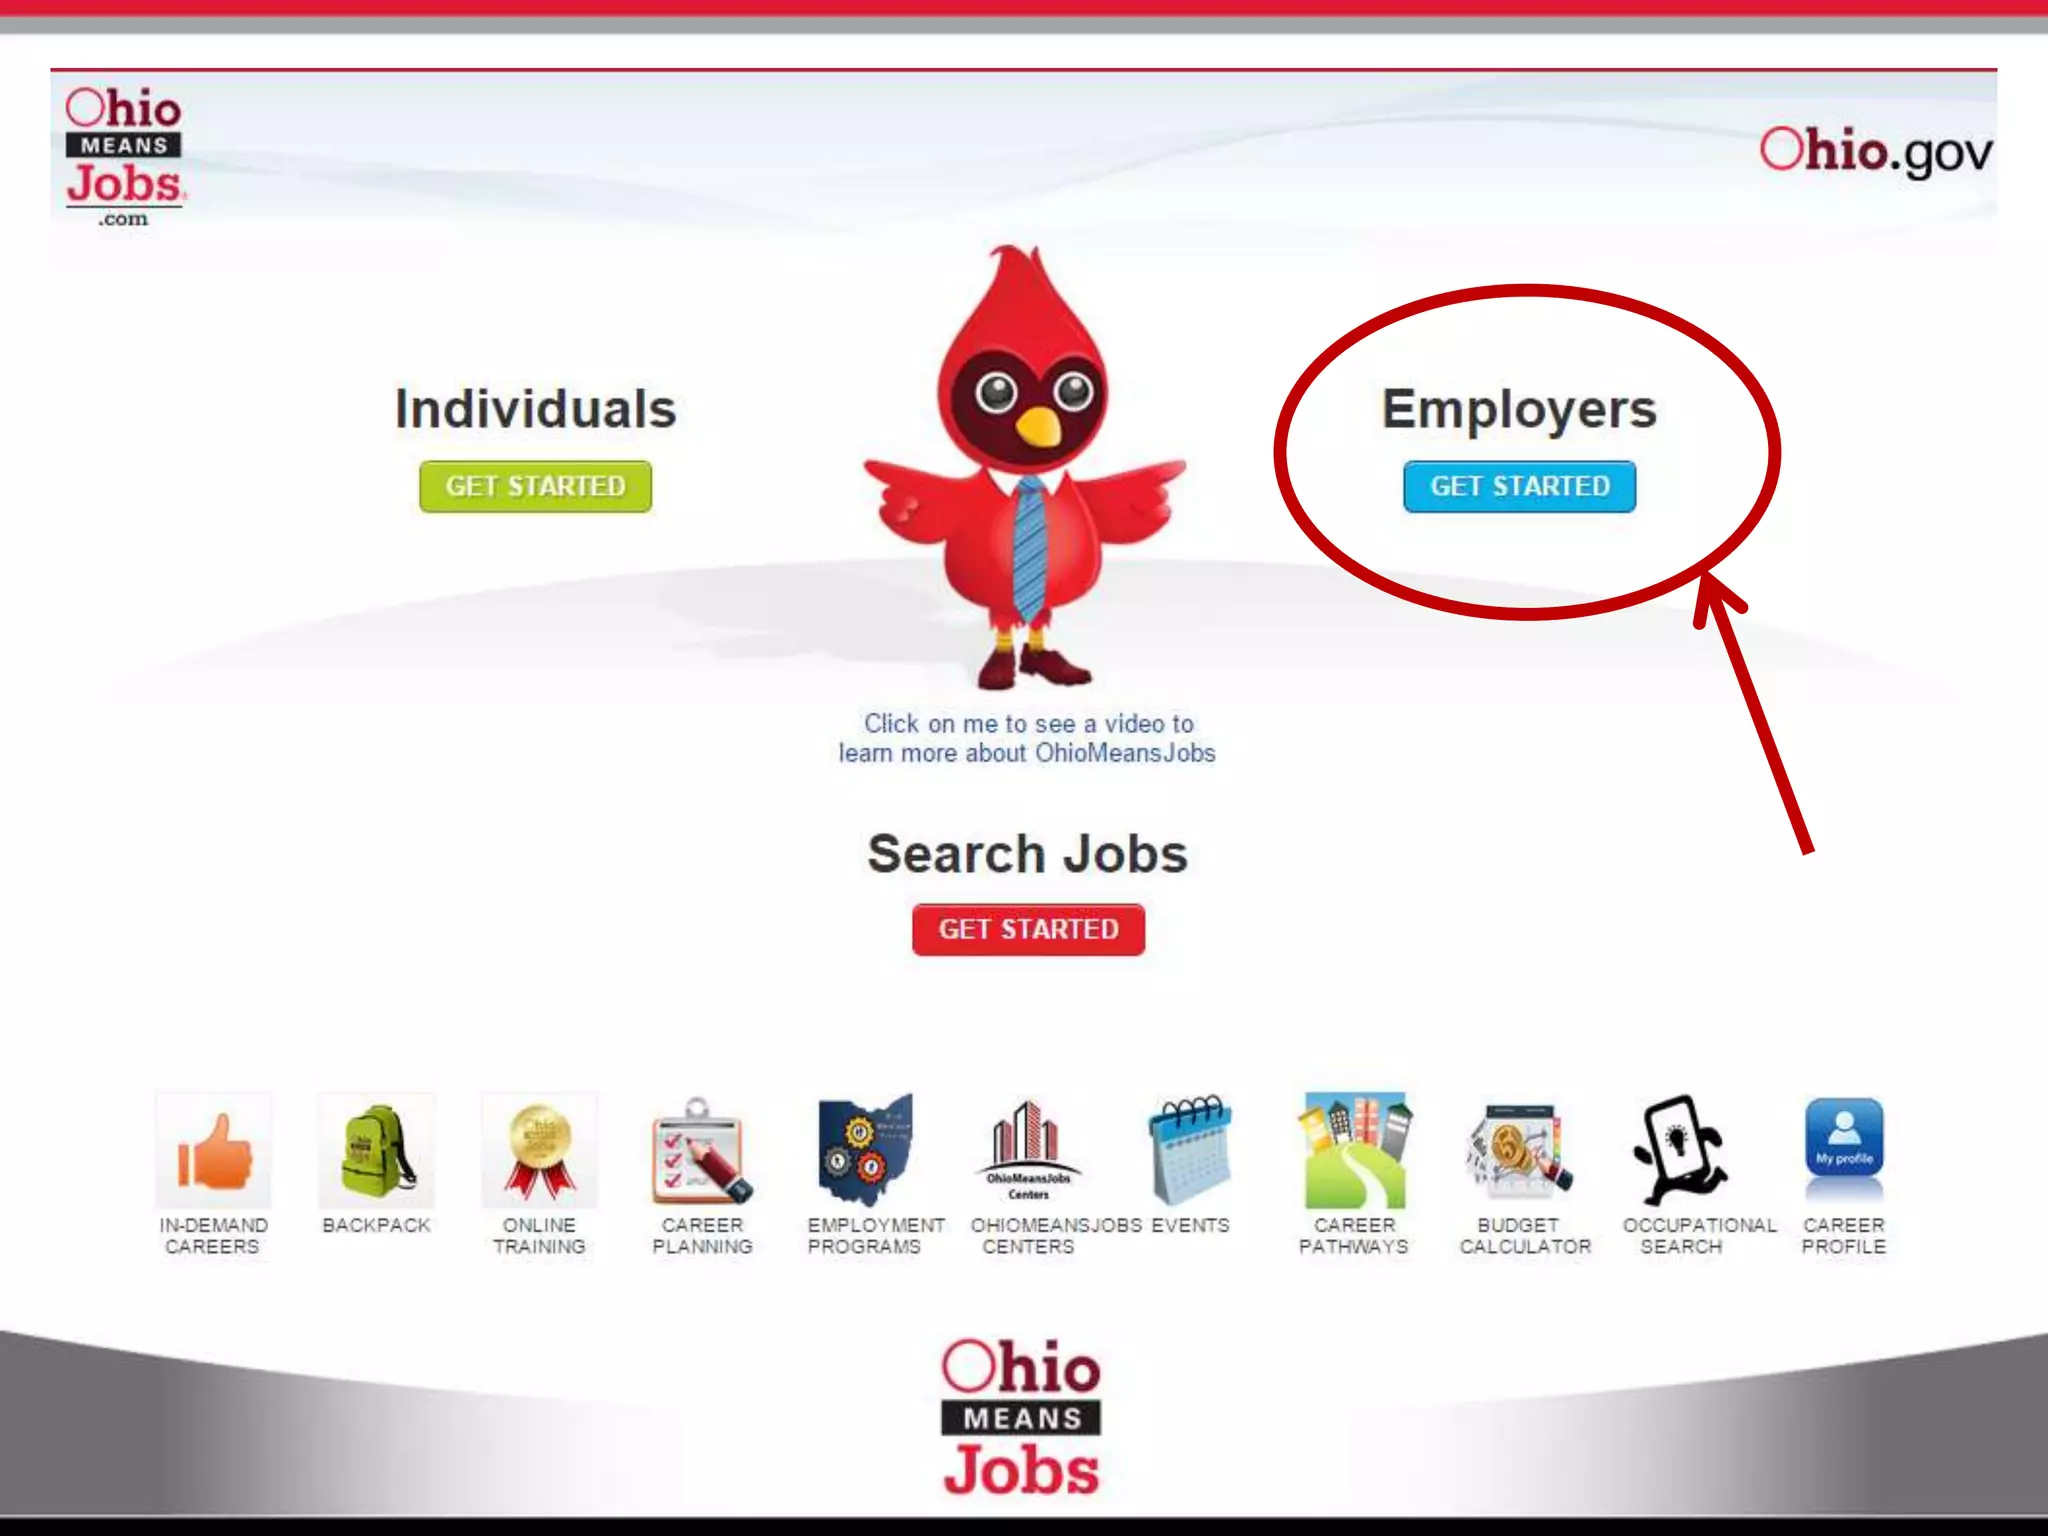
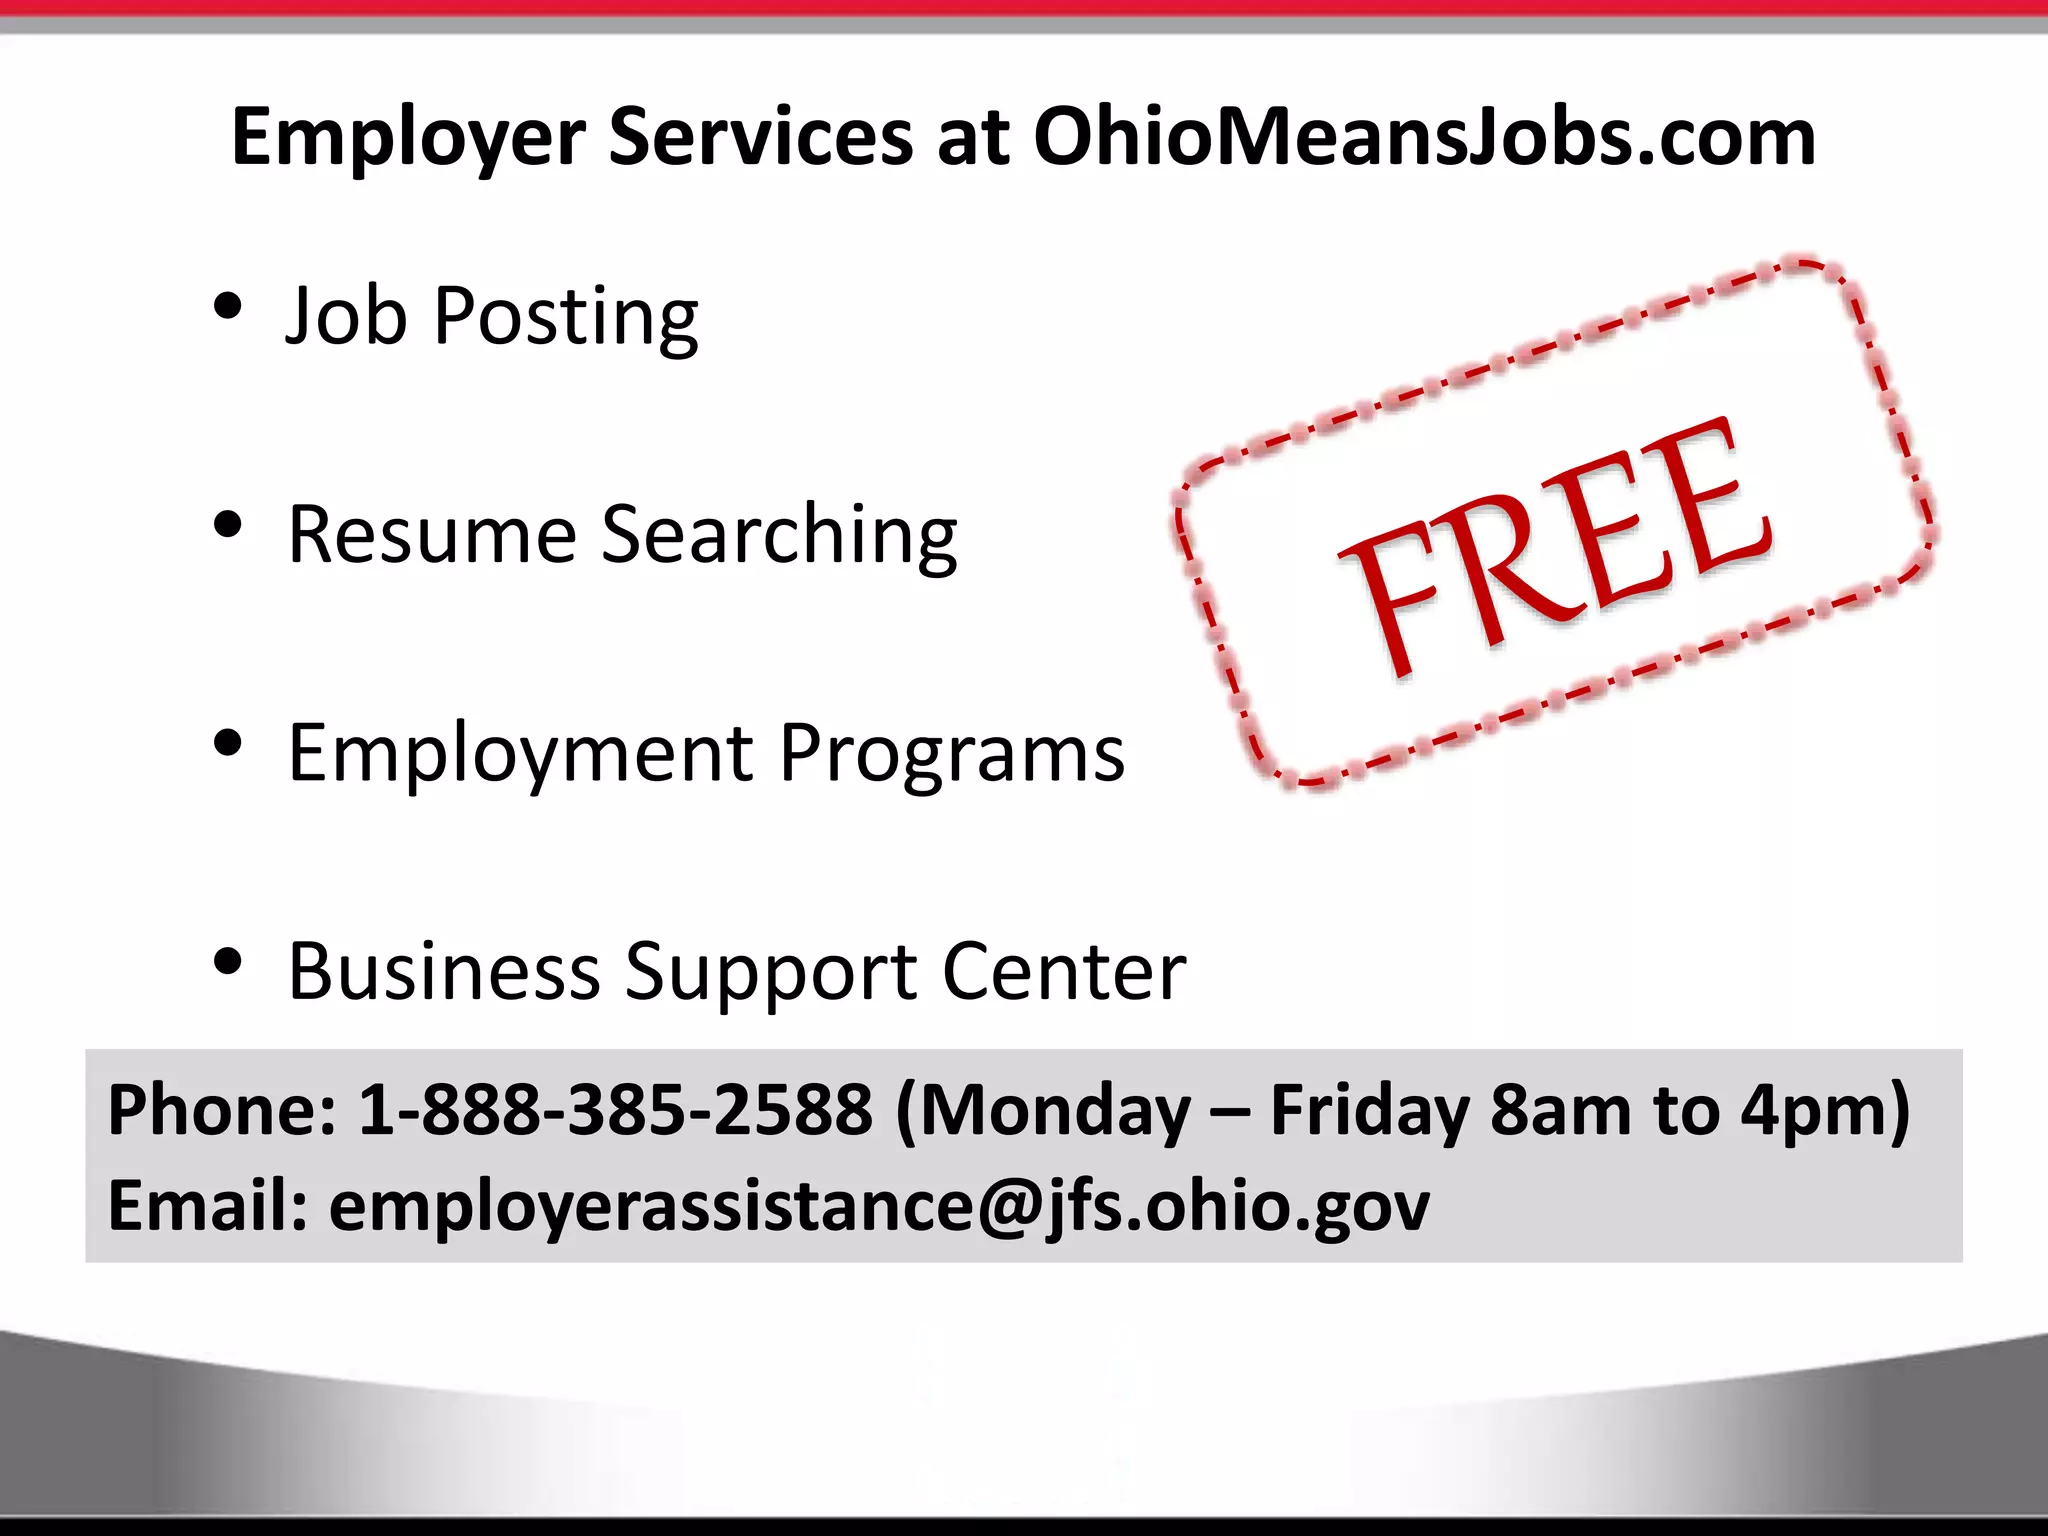

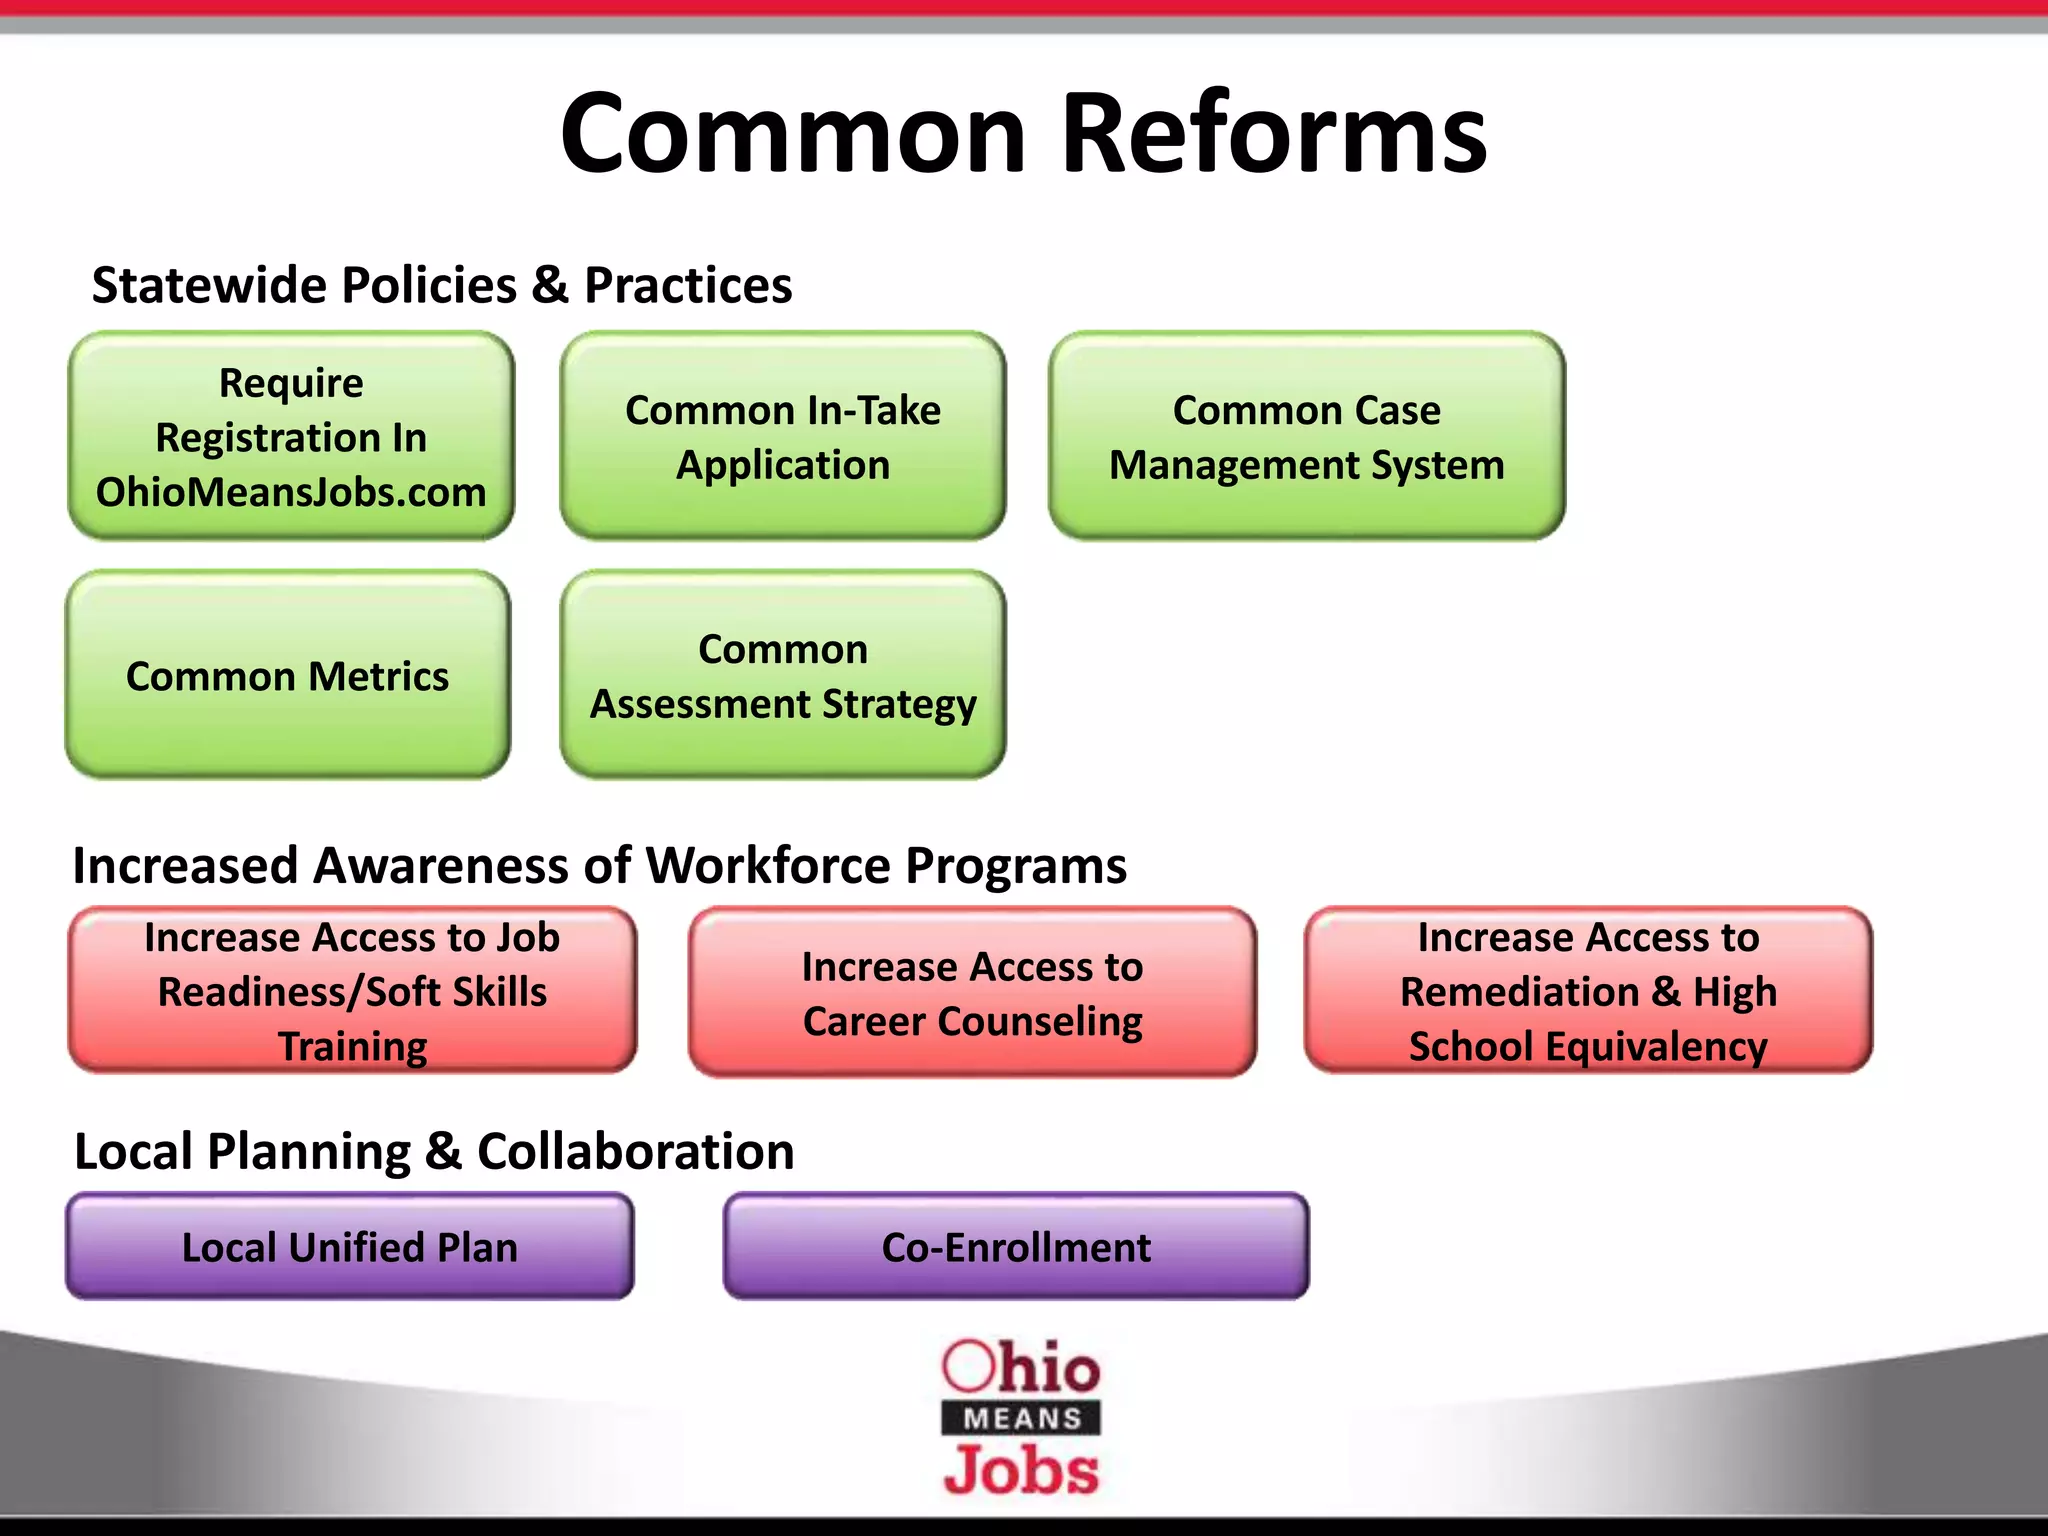
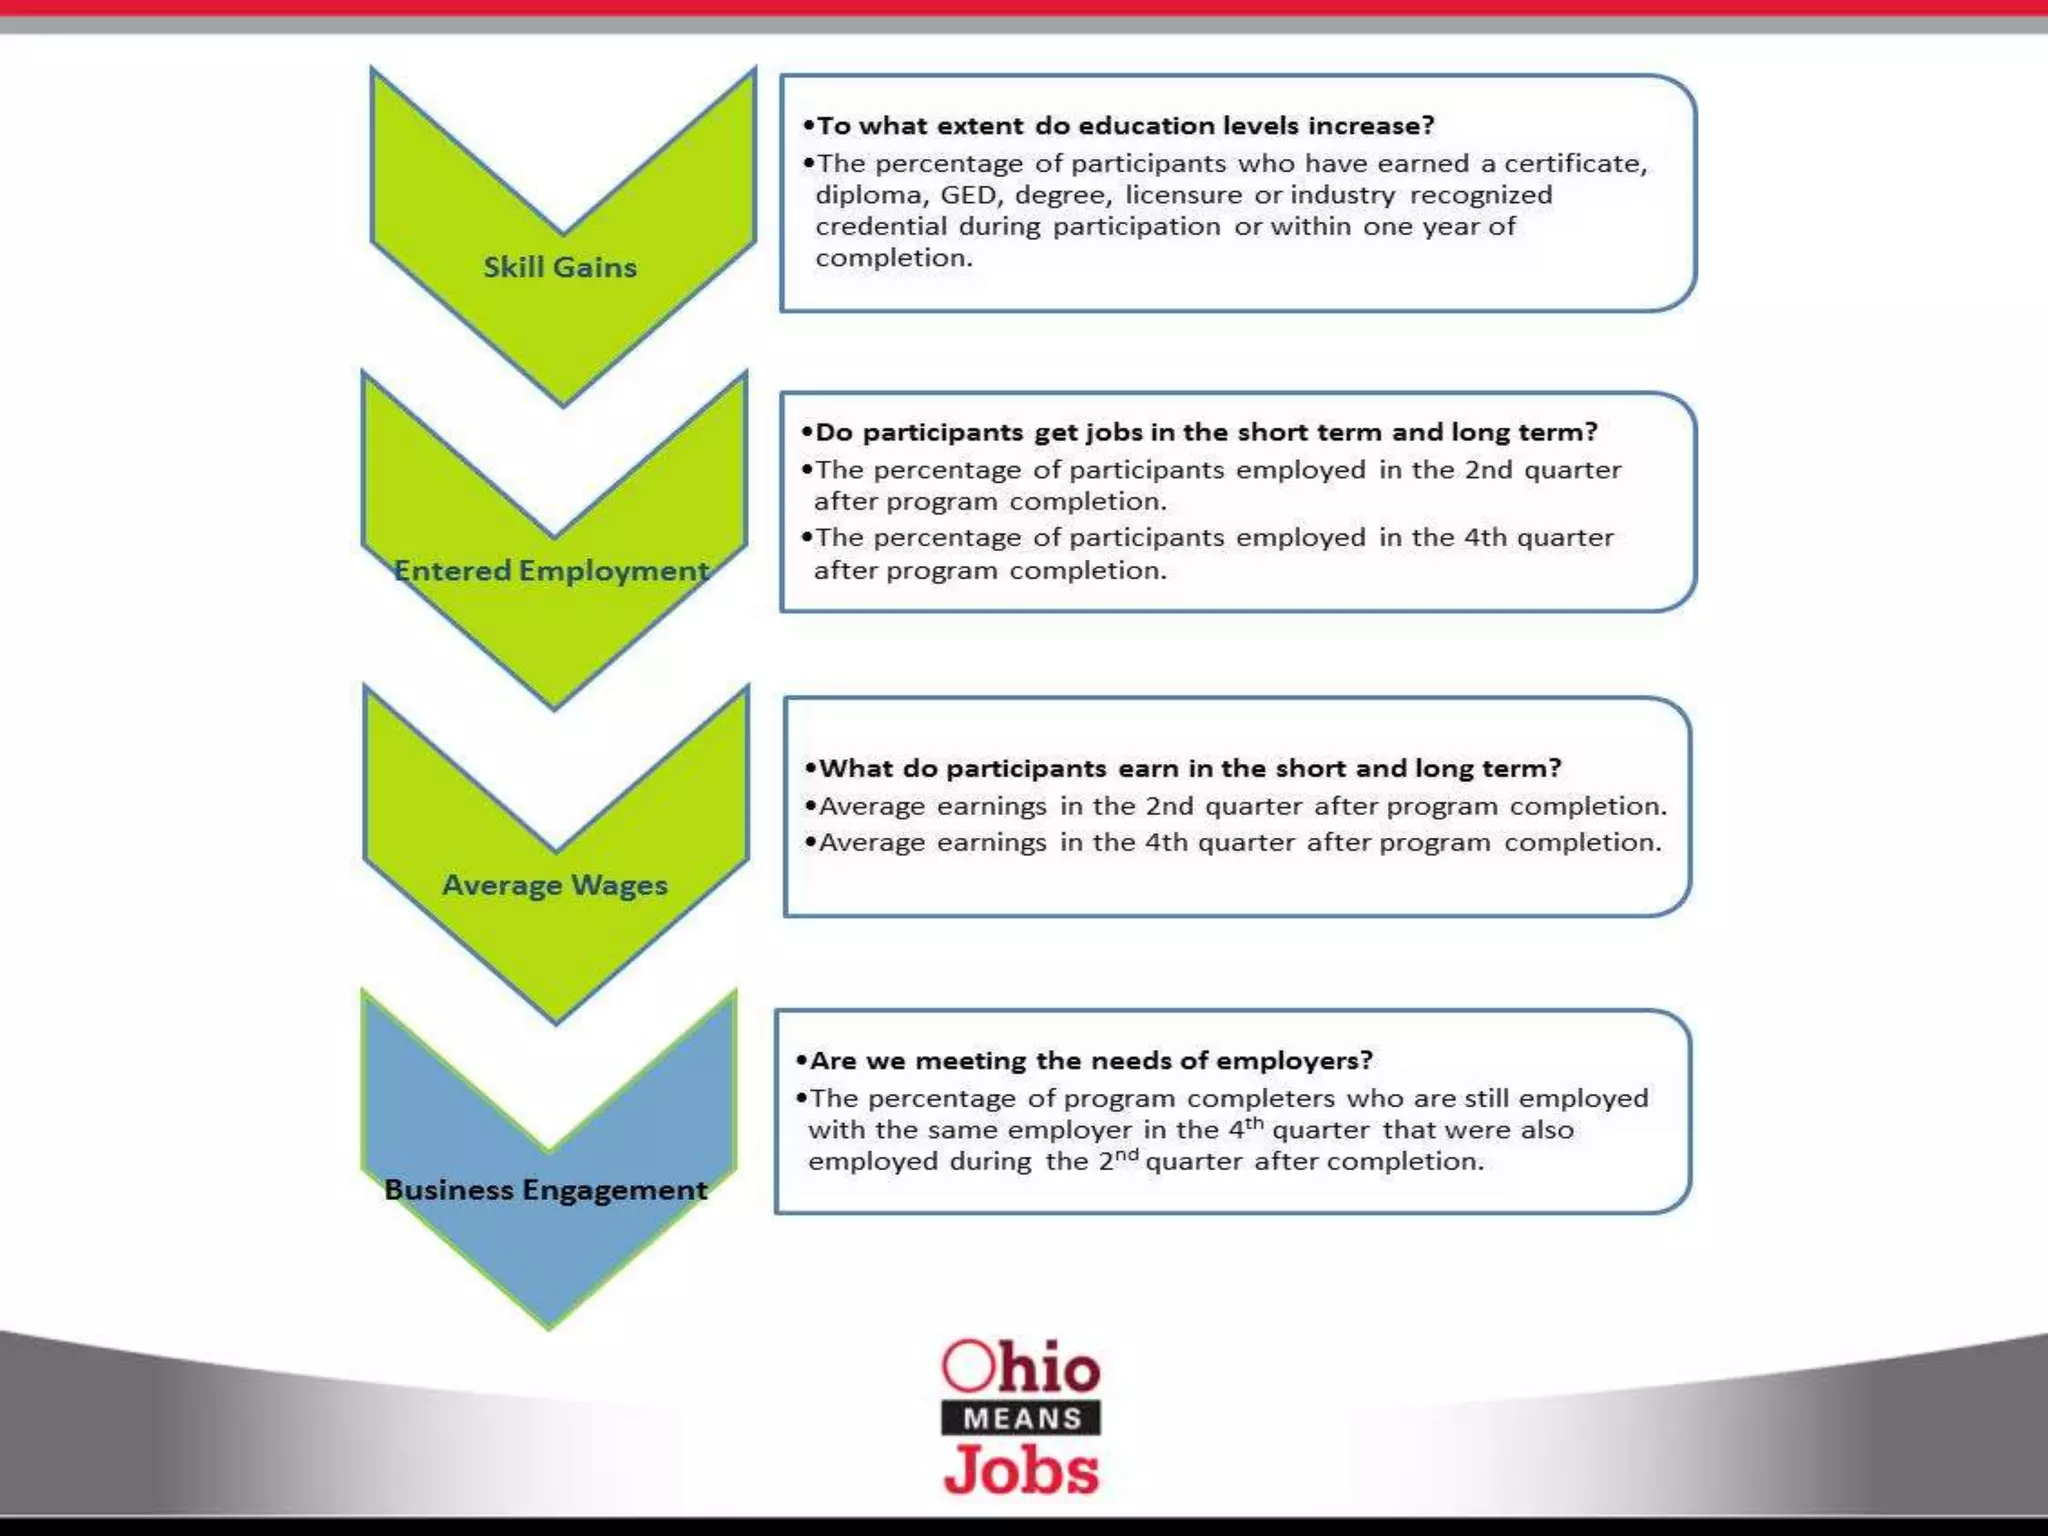
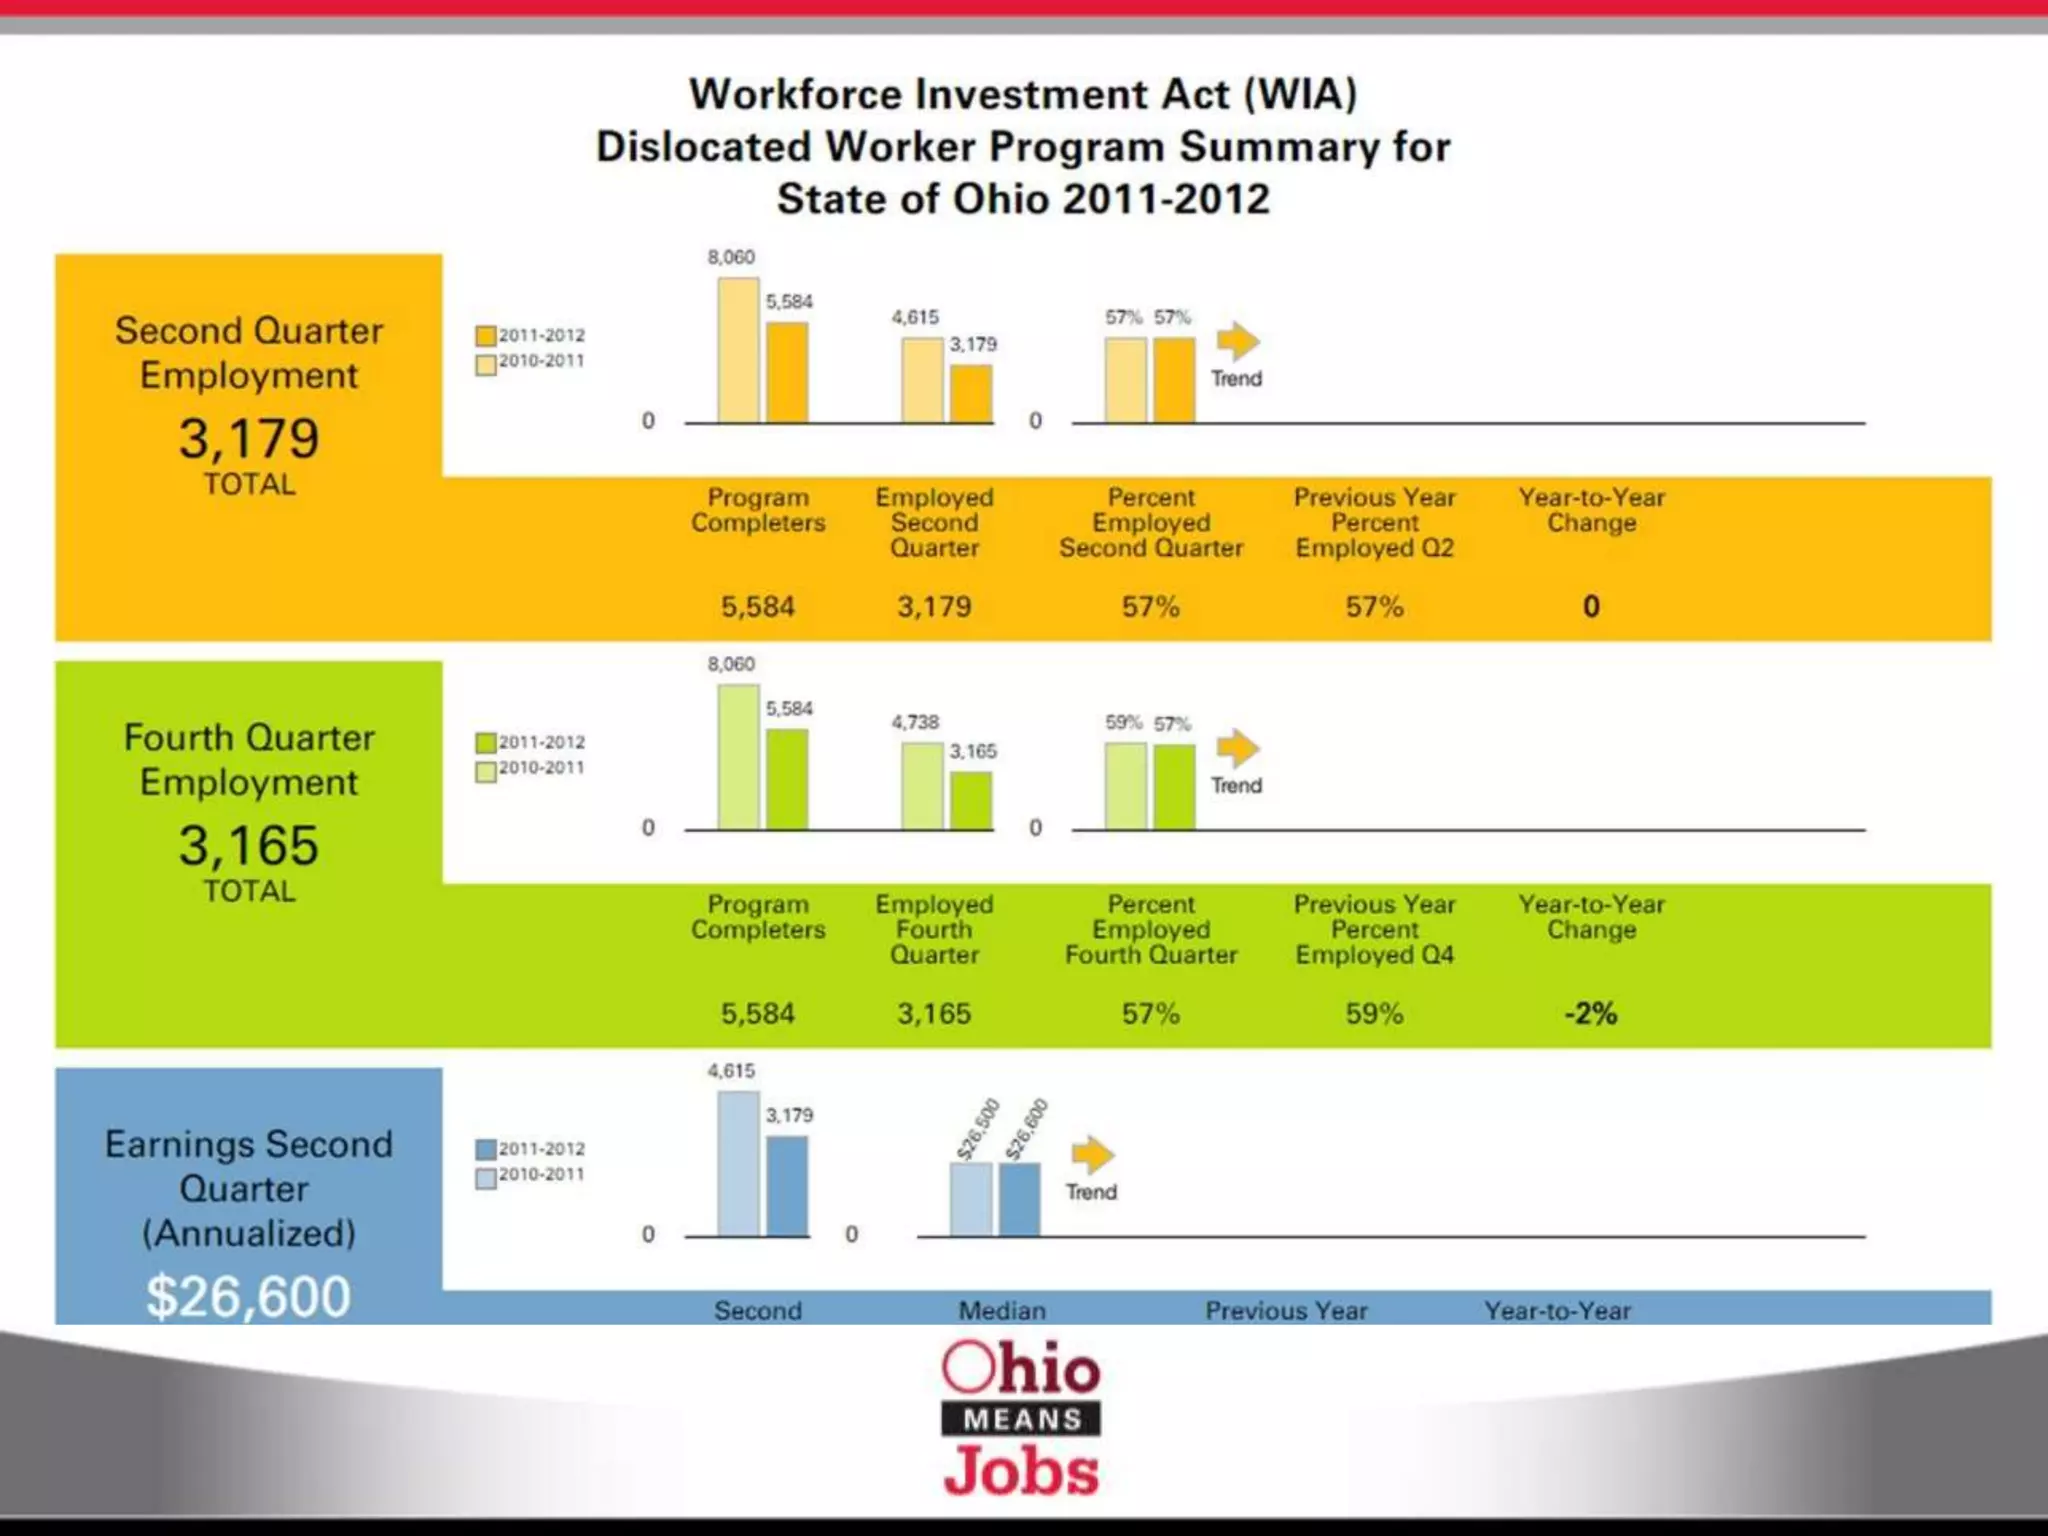
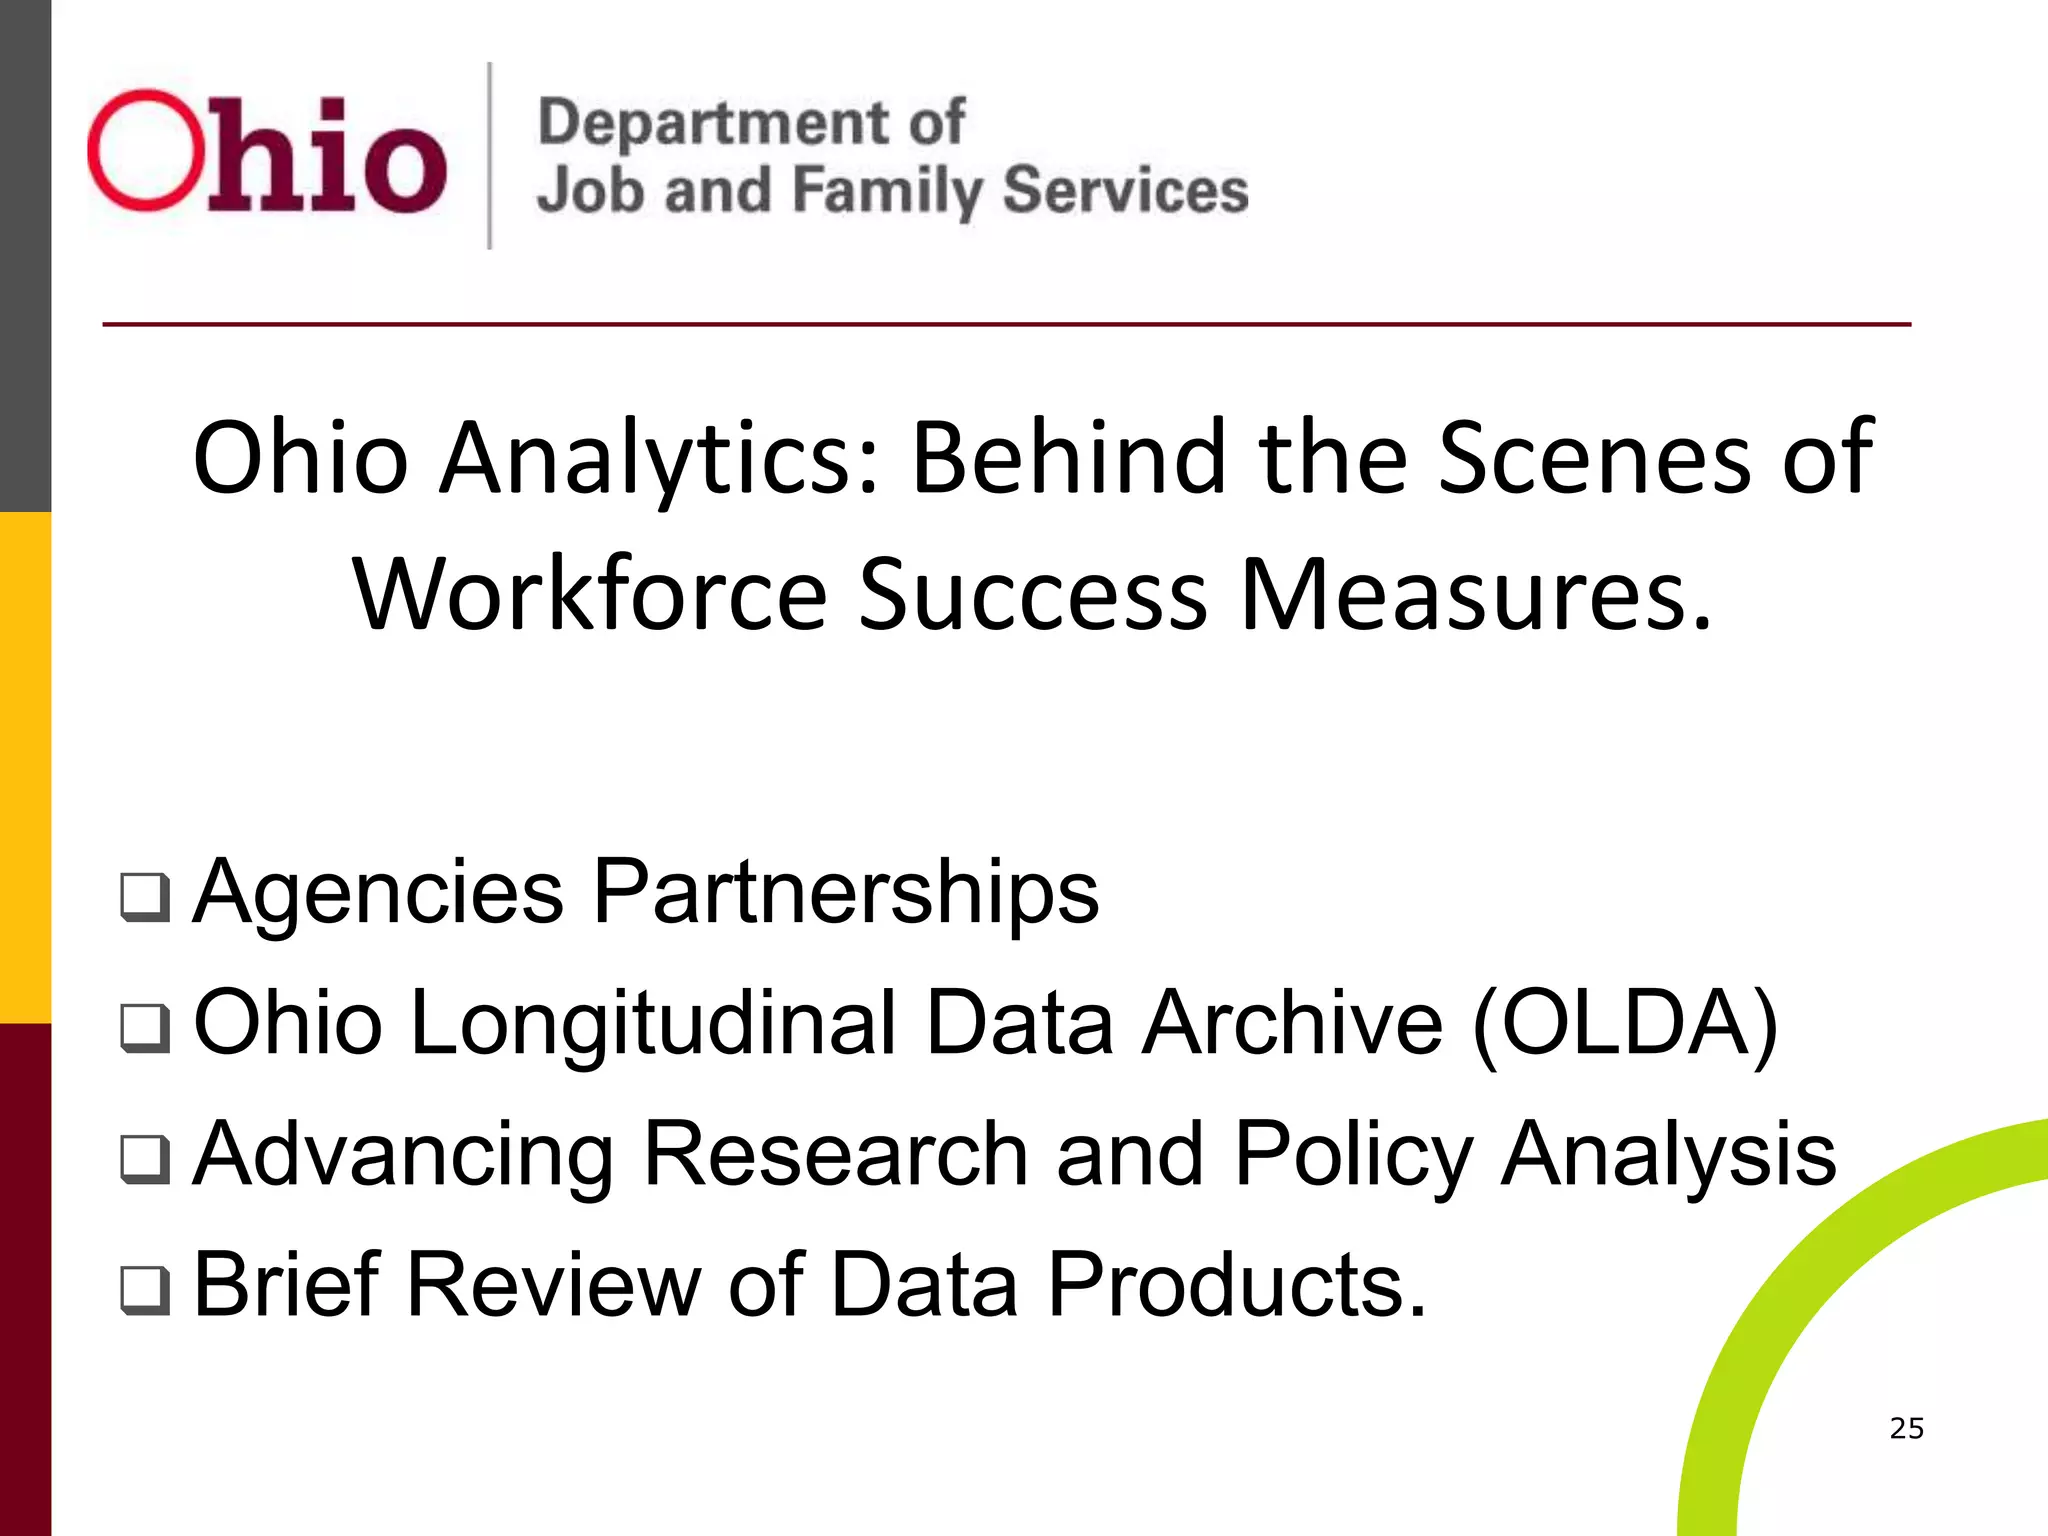
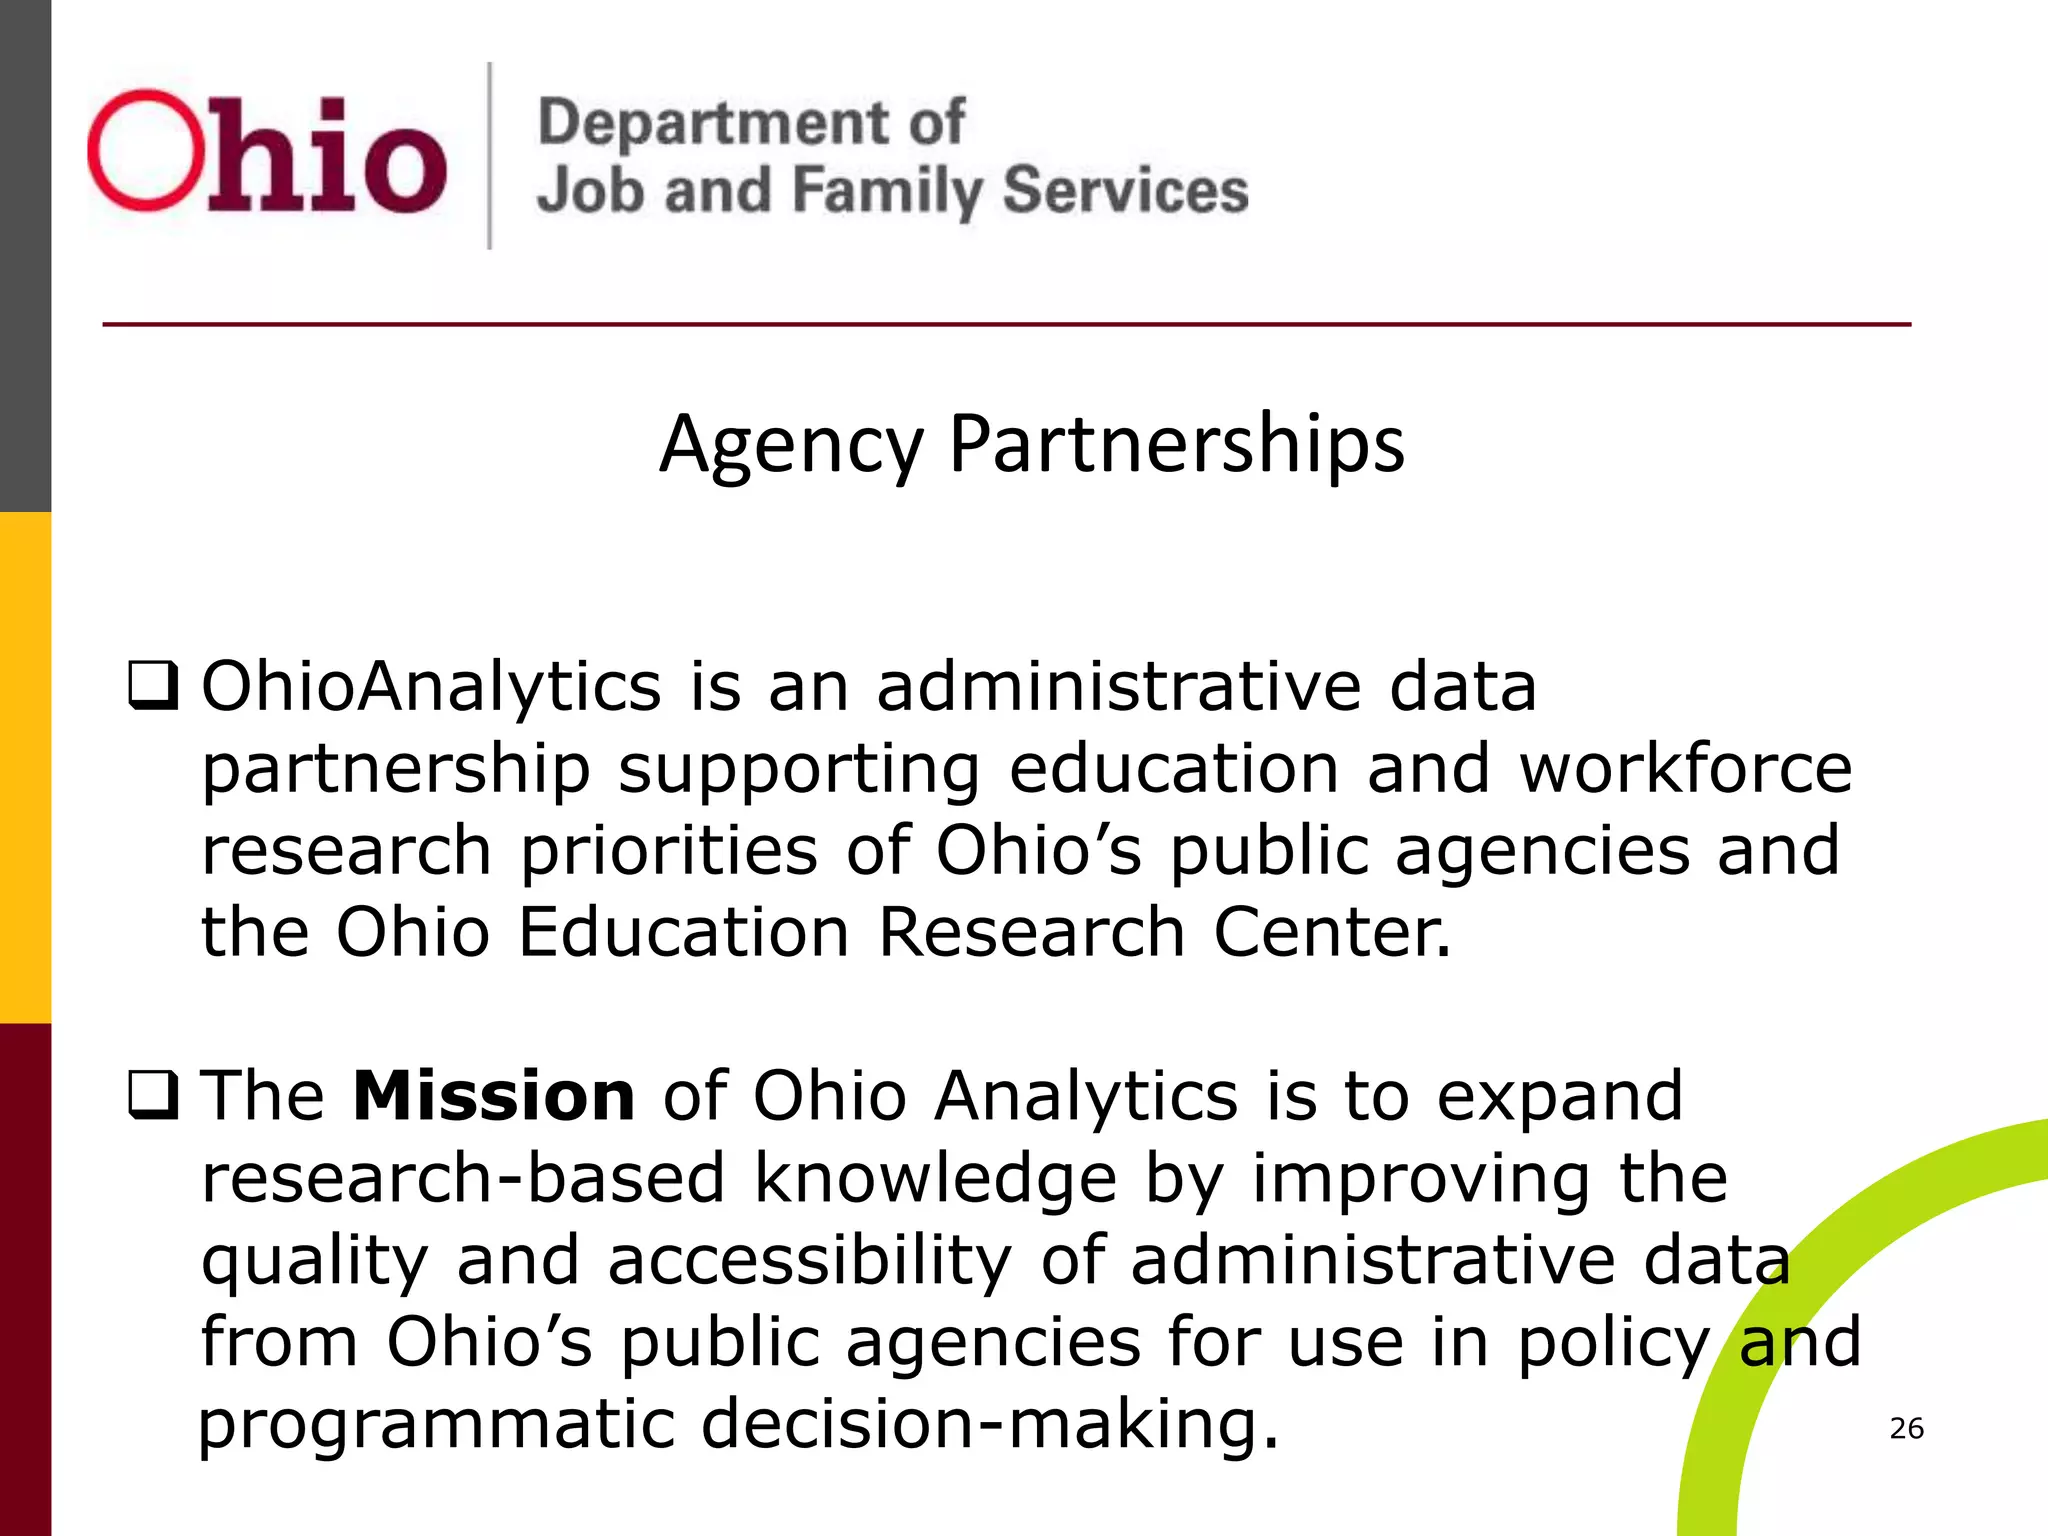
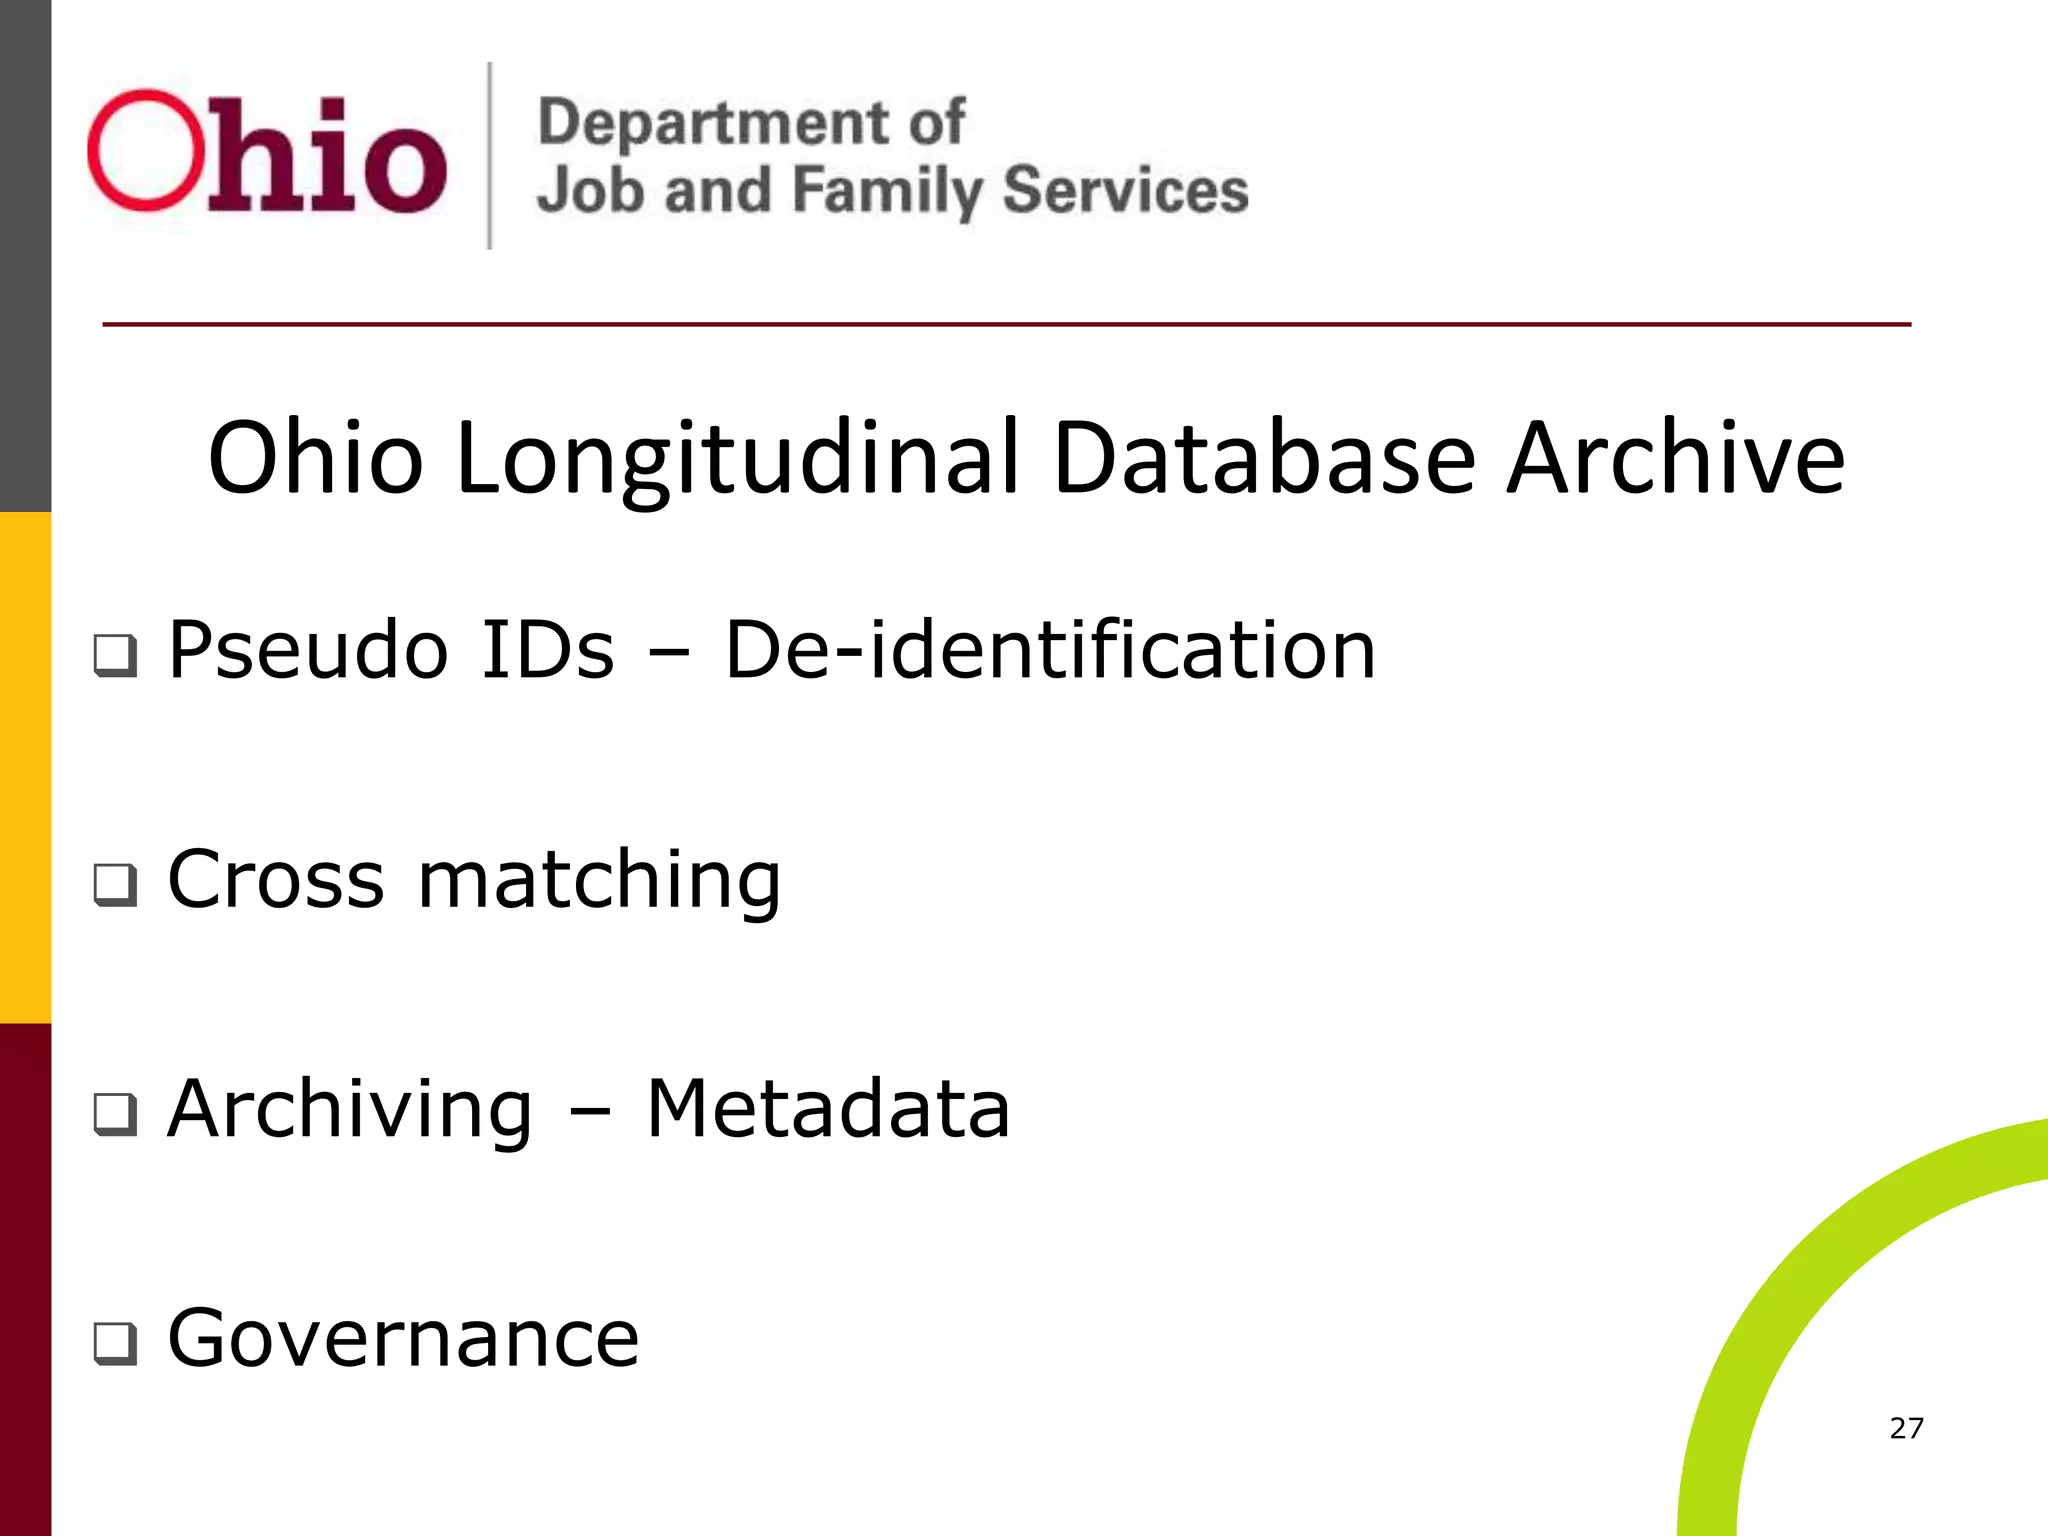
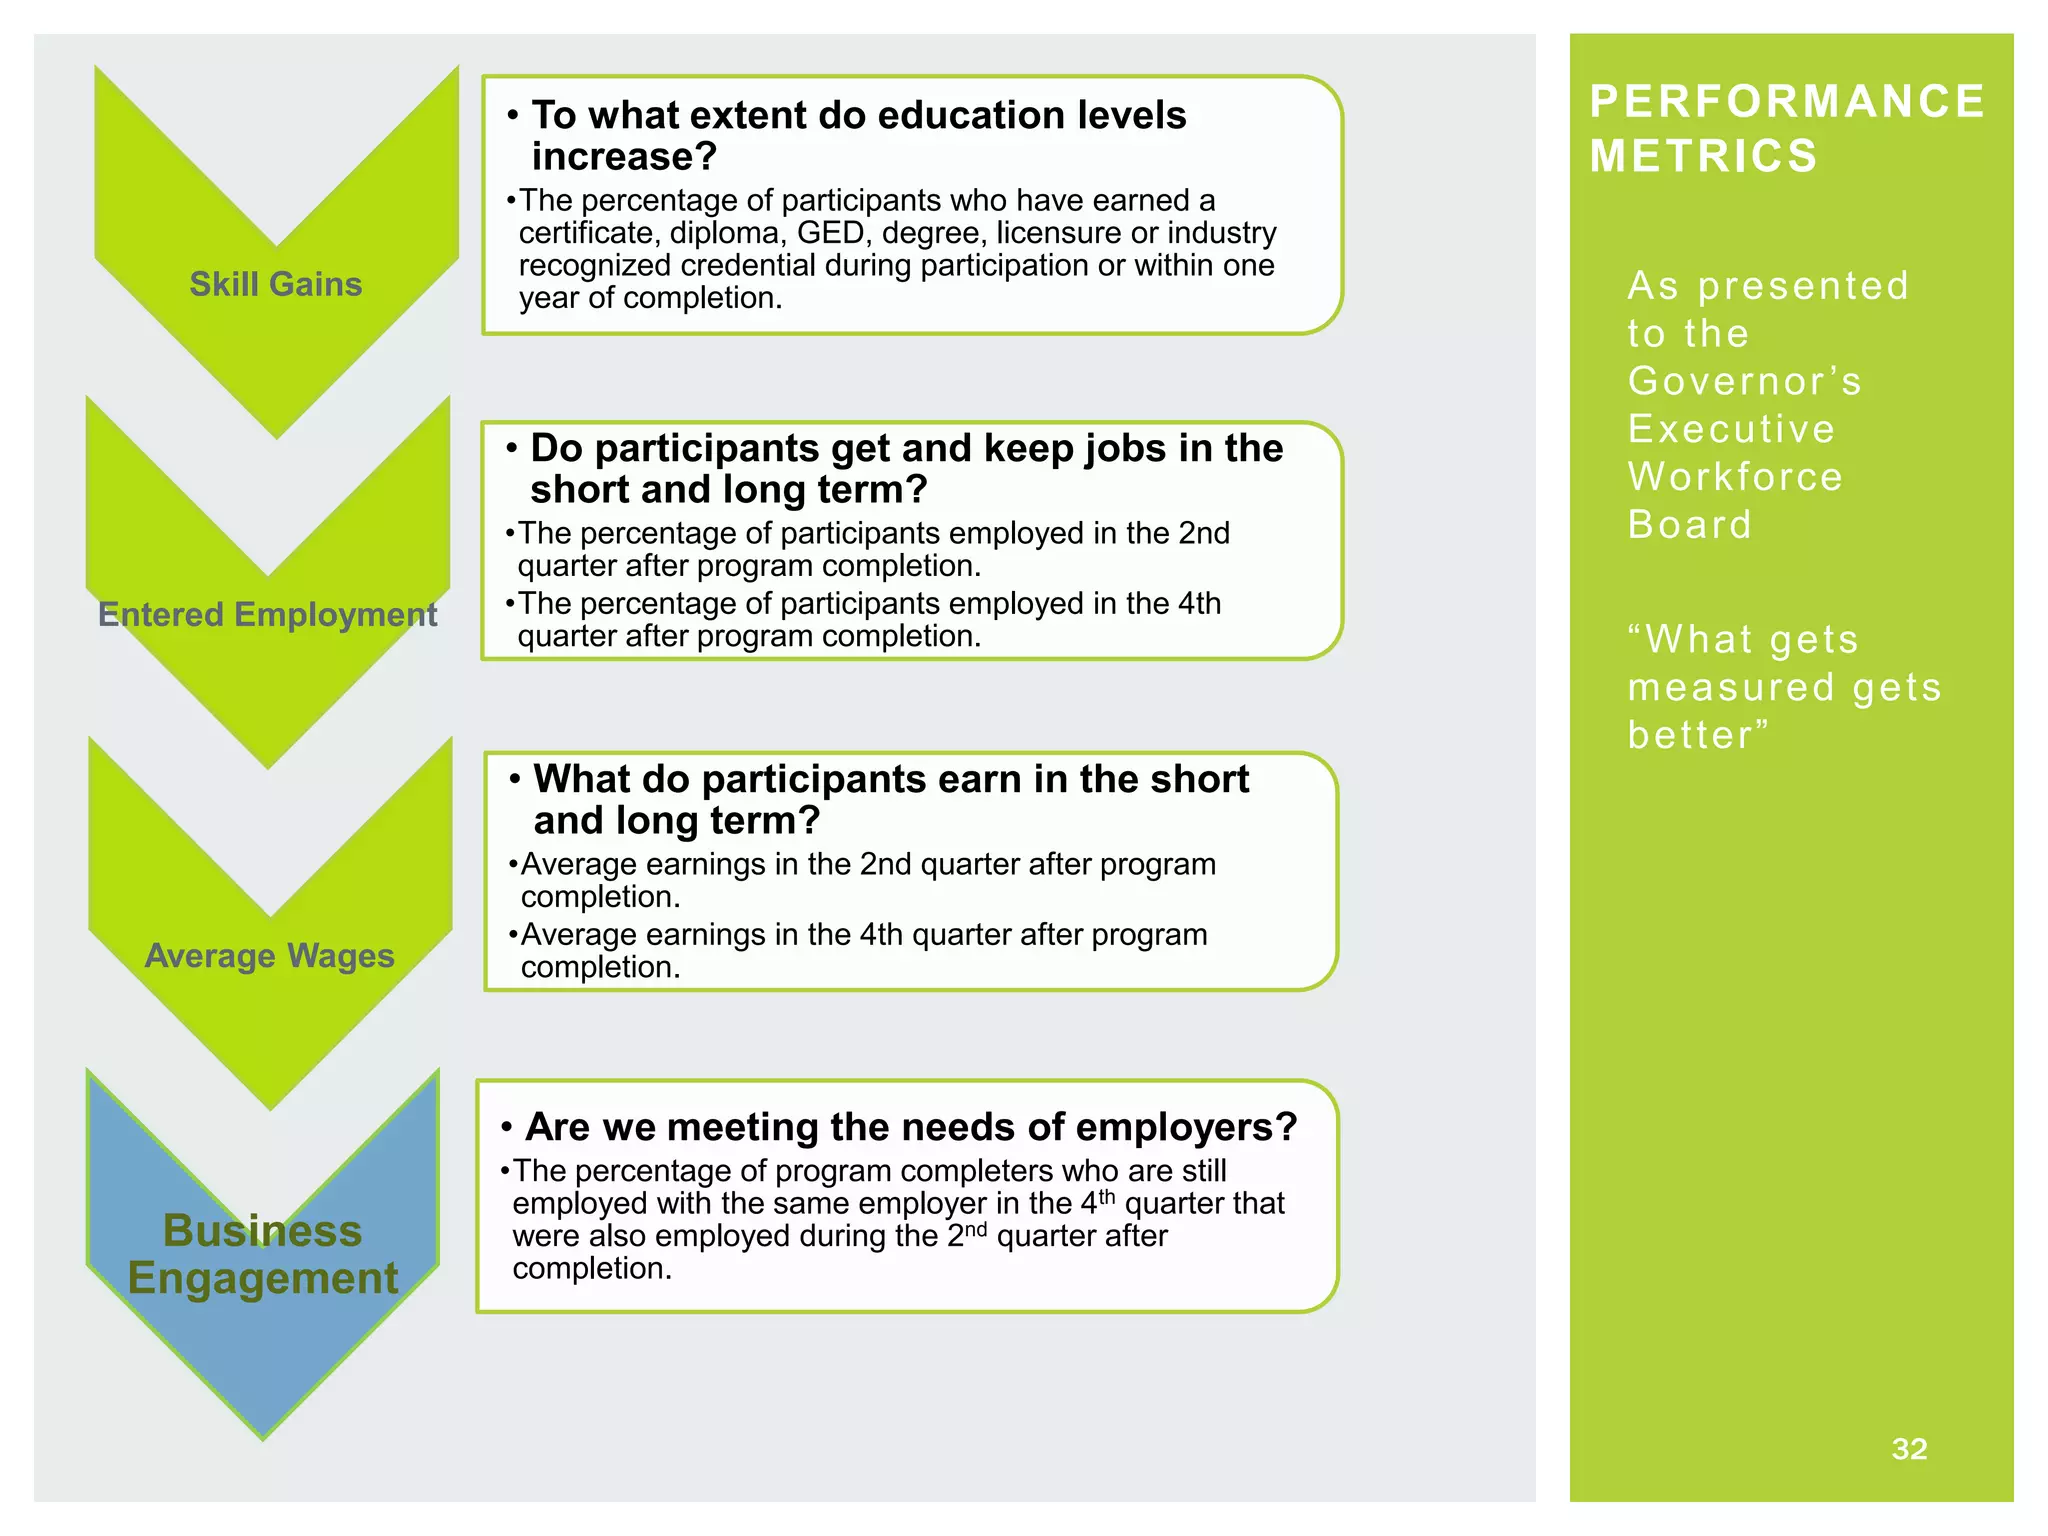


The document summarizes a presentation given at the ODJFS Conference on May 5, 2015 about the Governor's Office of Workforce Transformation (OWT) and their Workforce Success Measures project. The presentation covered an overview of OWT, their strategic framework for identifying business needs, connecting workers to businesses, and aligning training programs. It also discussed the data partnership called OhioAnalytics that supports research using administrative data to evaluate workforce program outcomes. Examples of outcome metrics and data products from the Workforce Success Measures dashboard were demonstrated.


