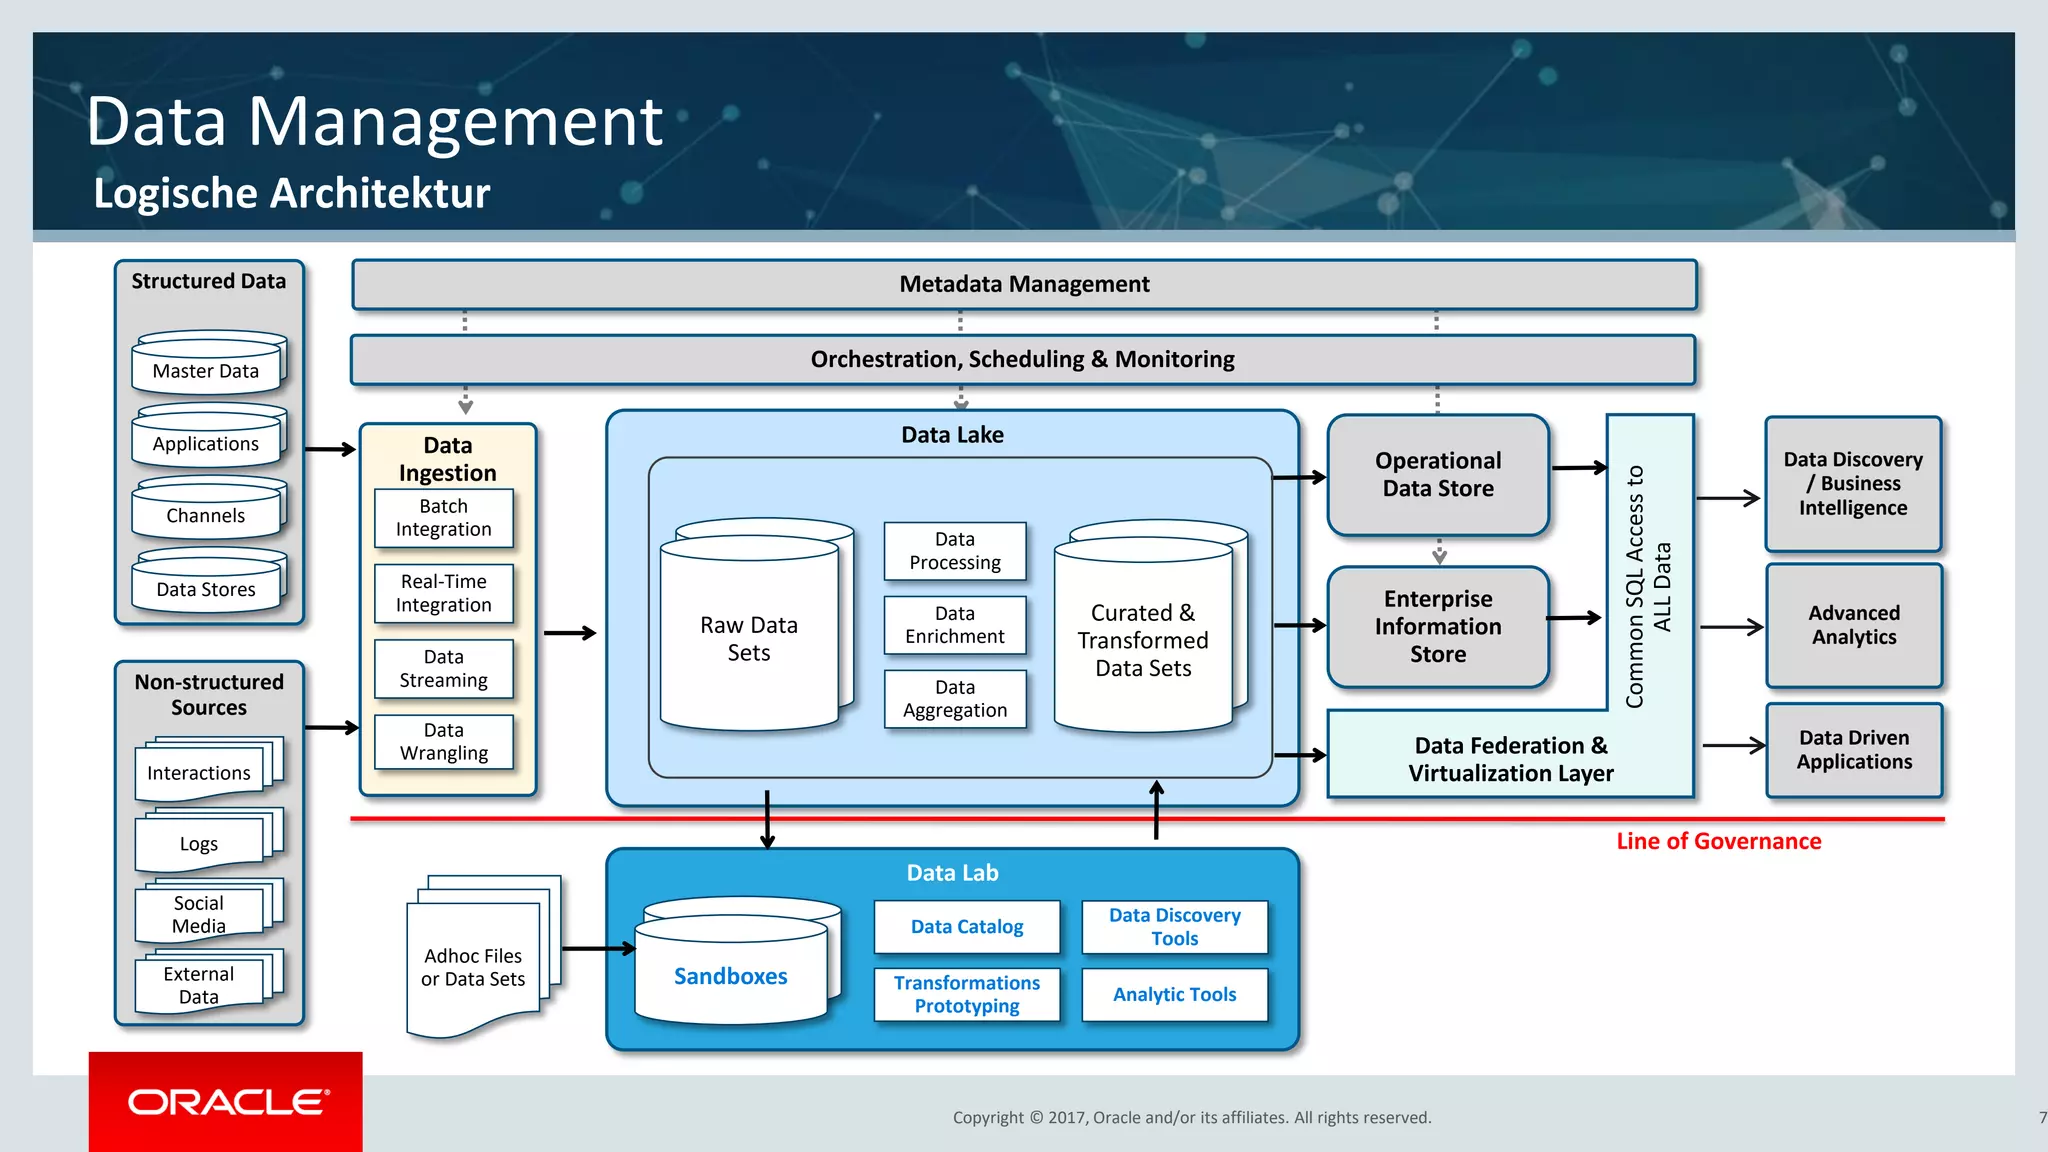
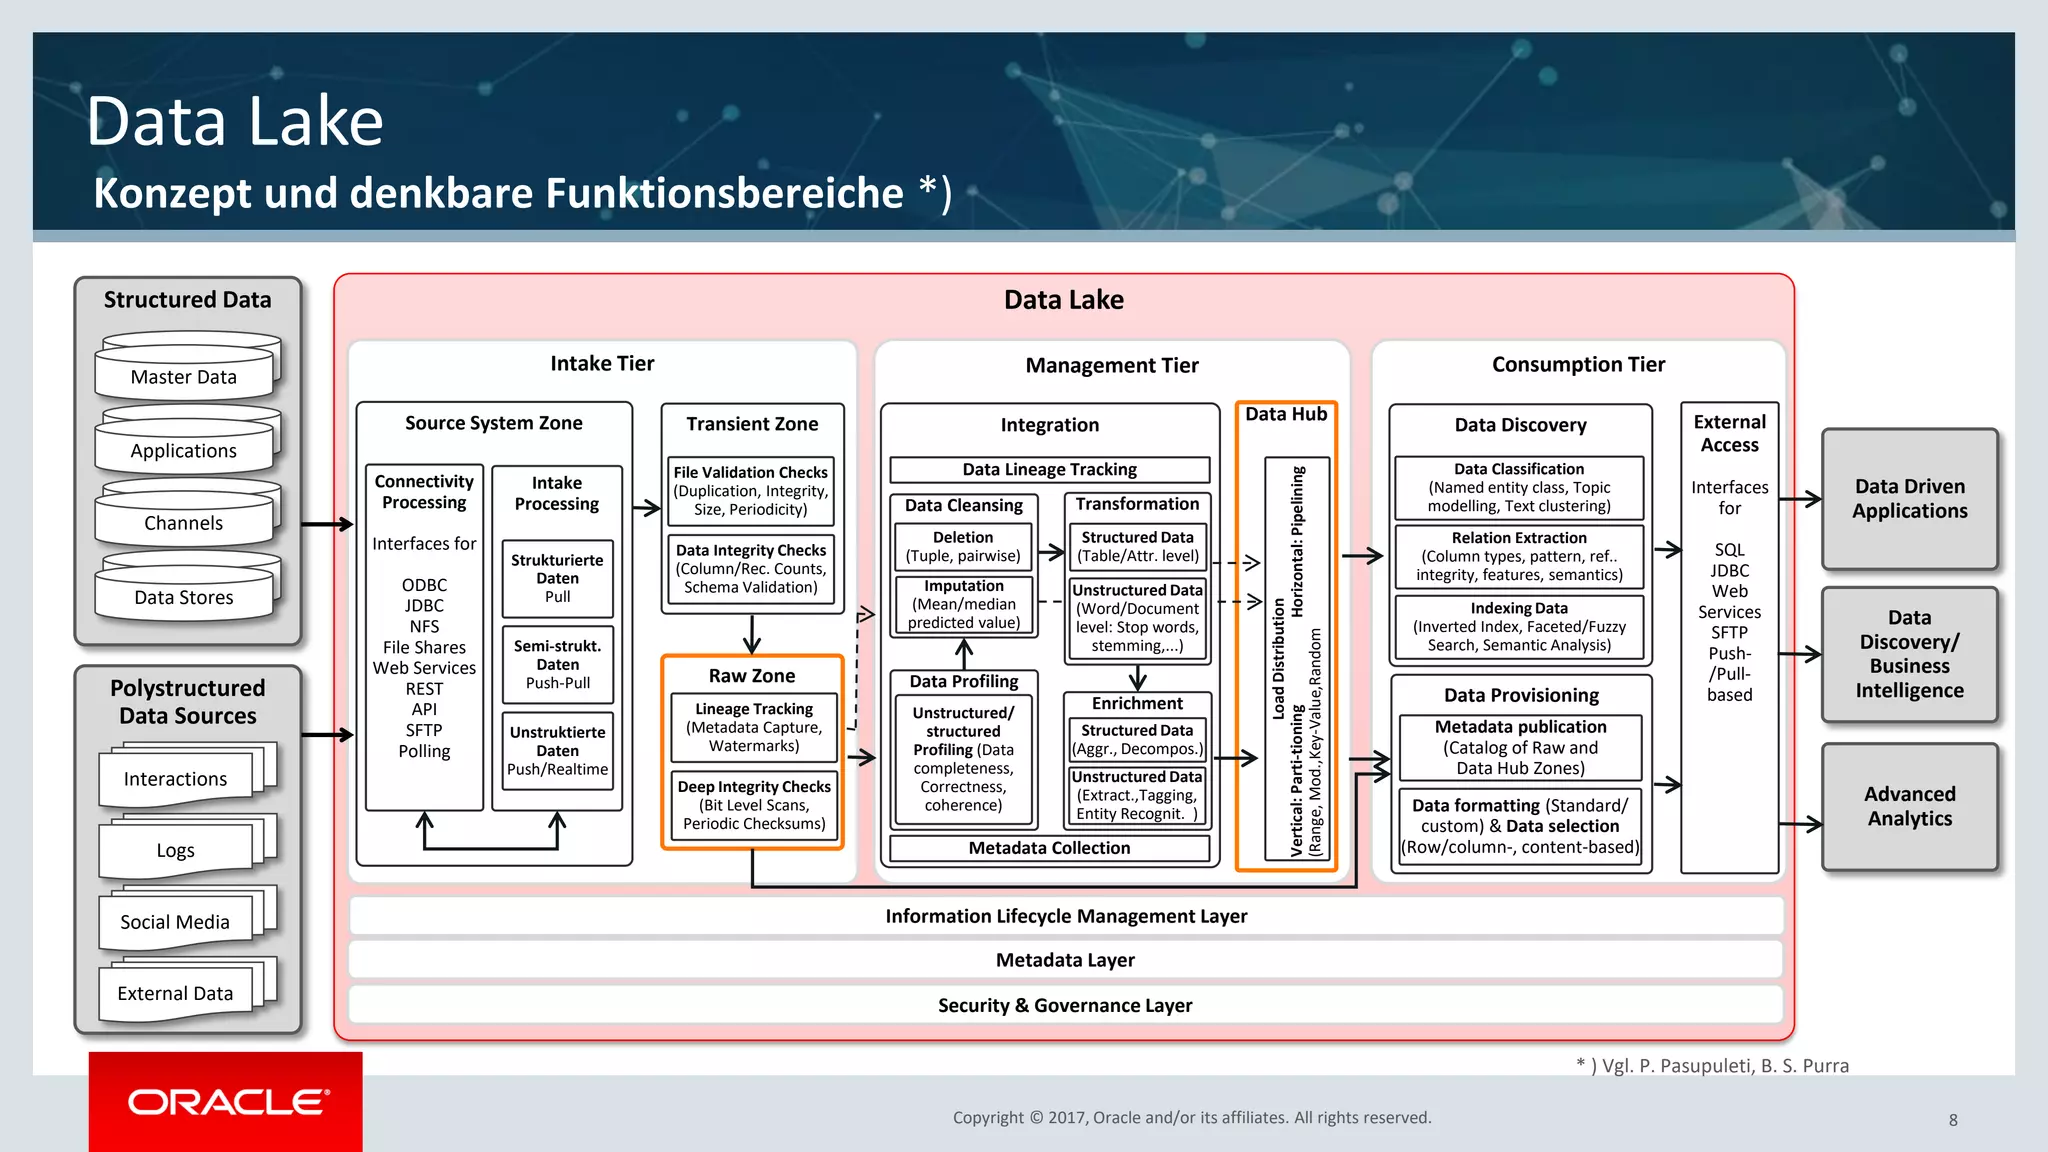
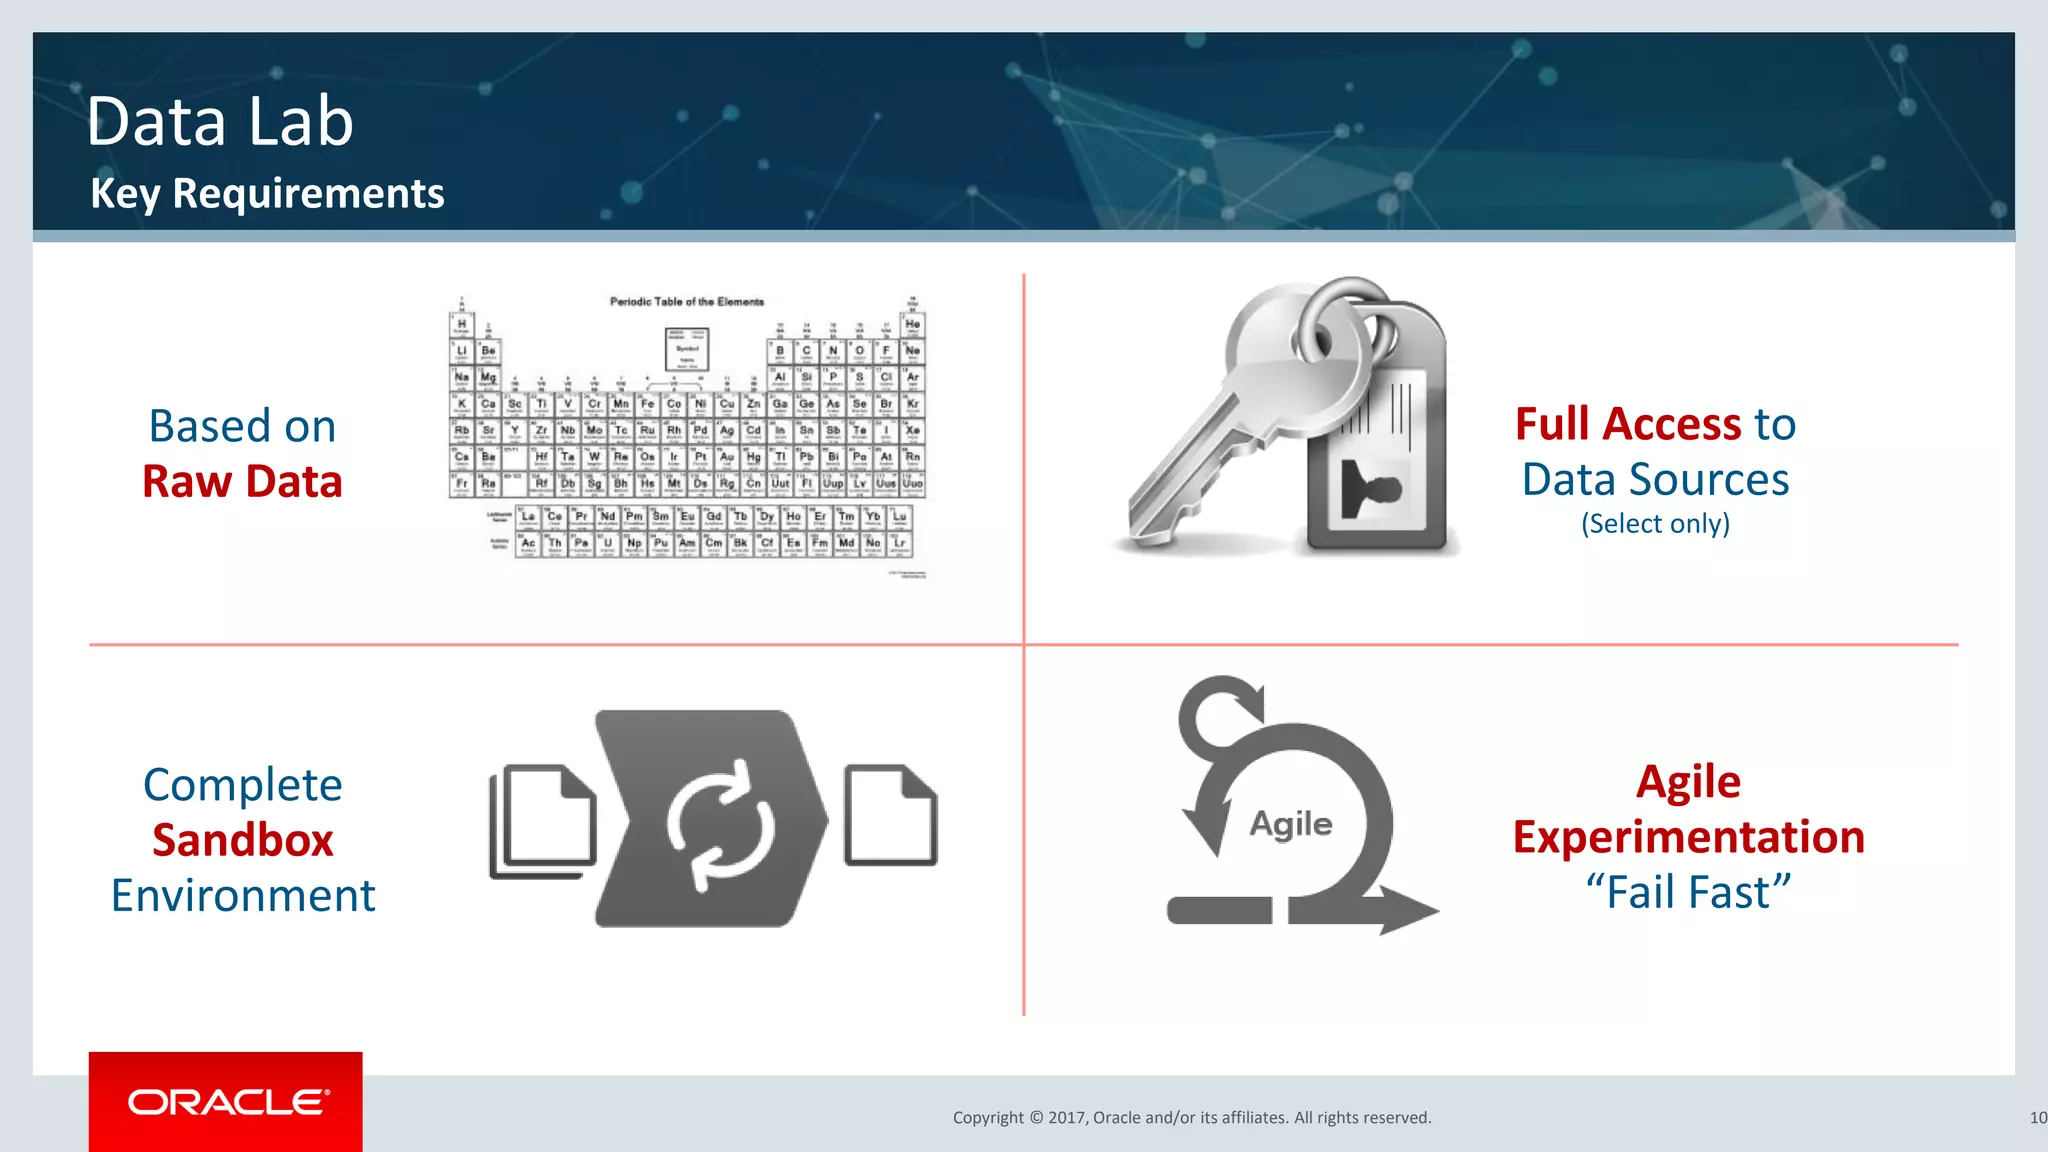
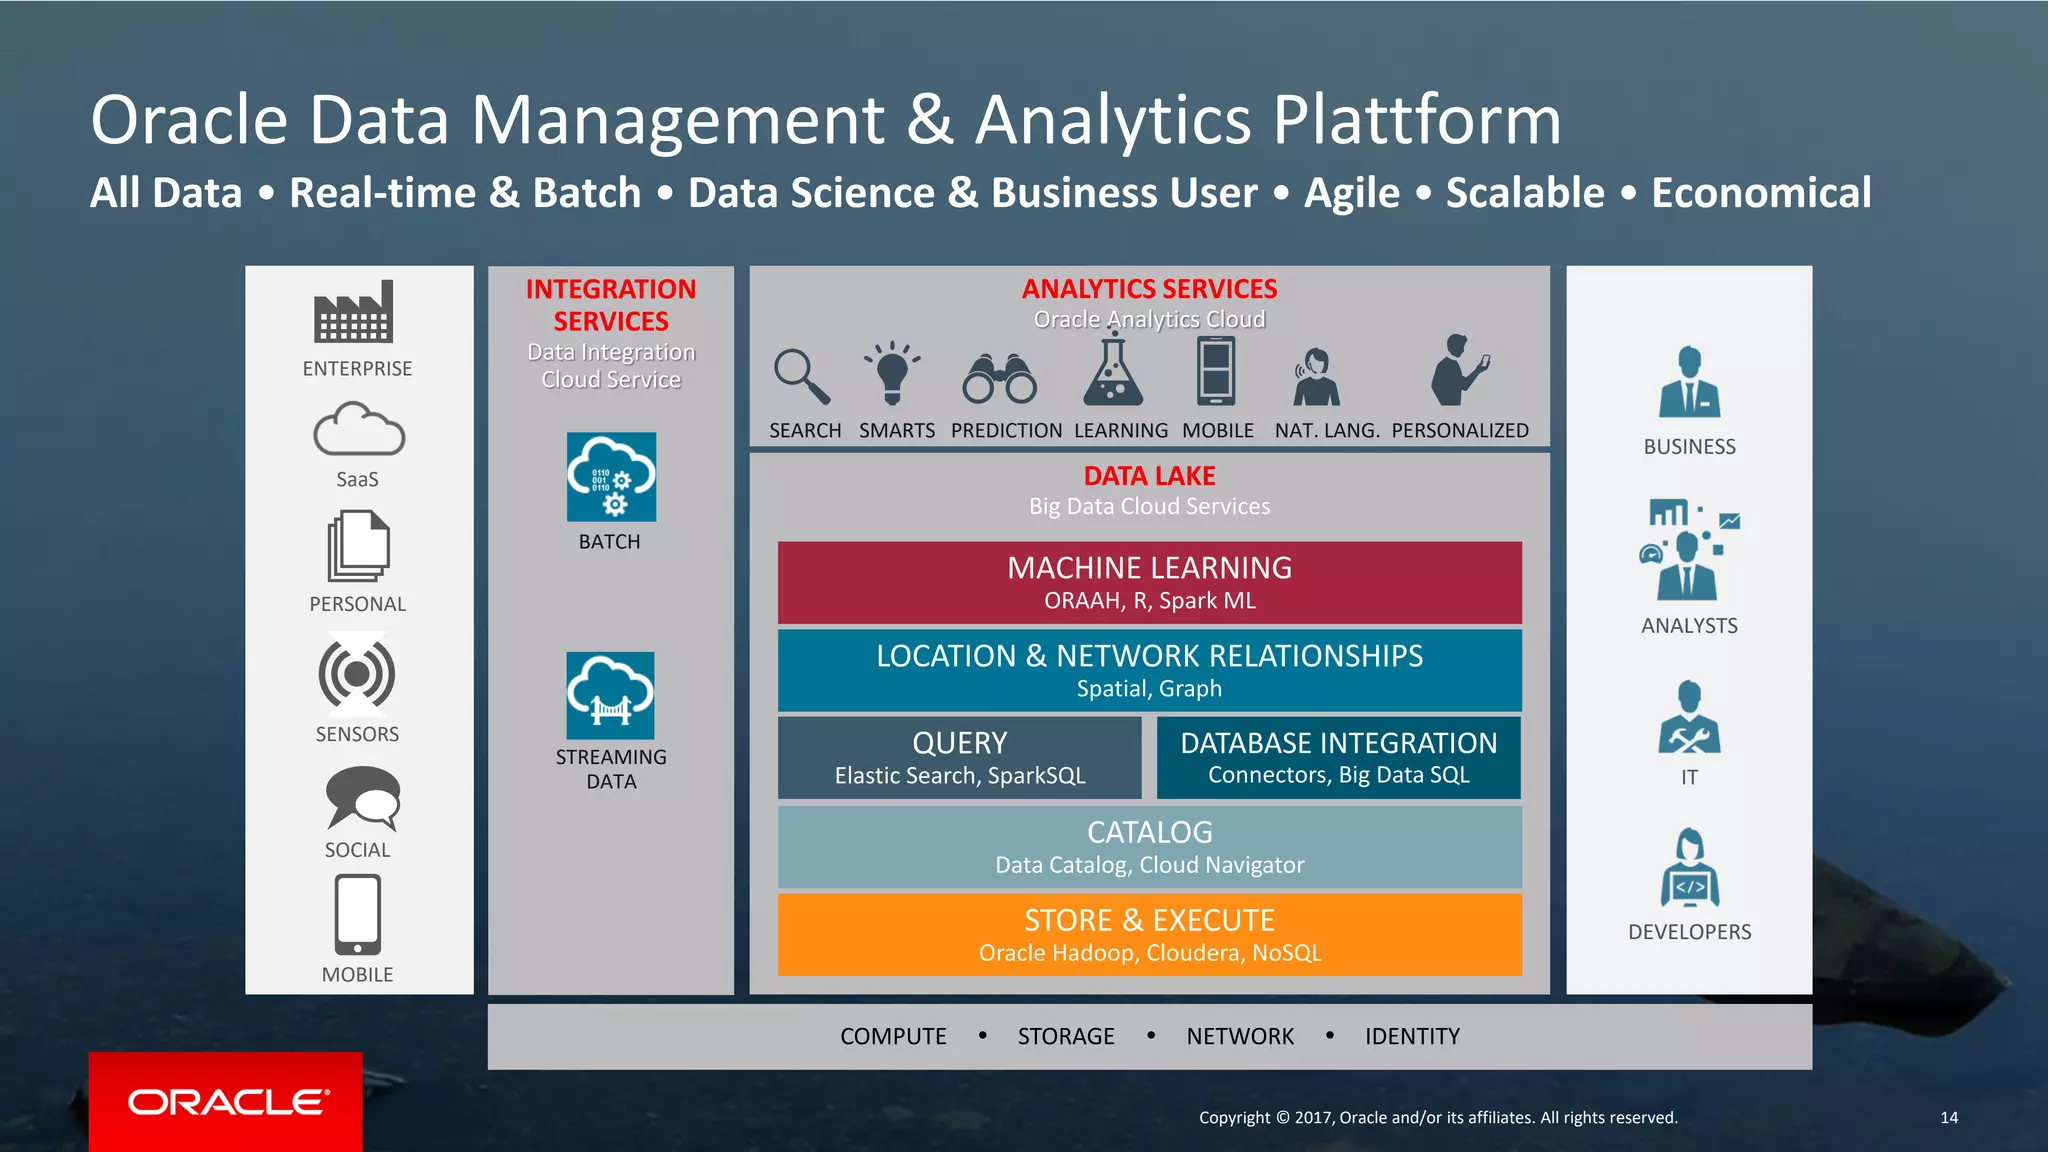
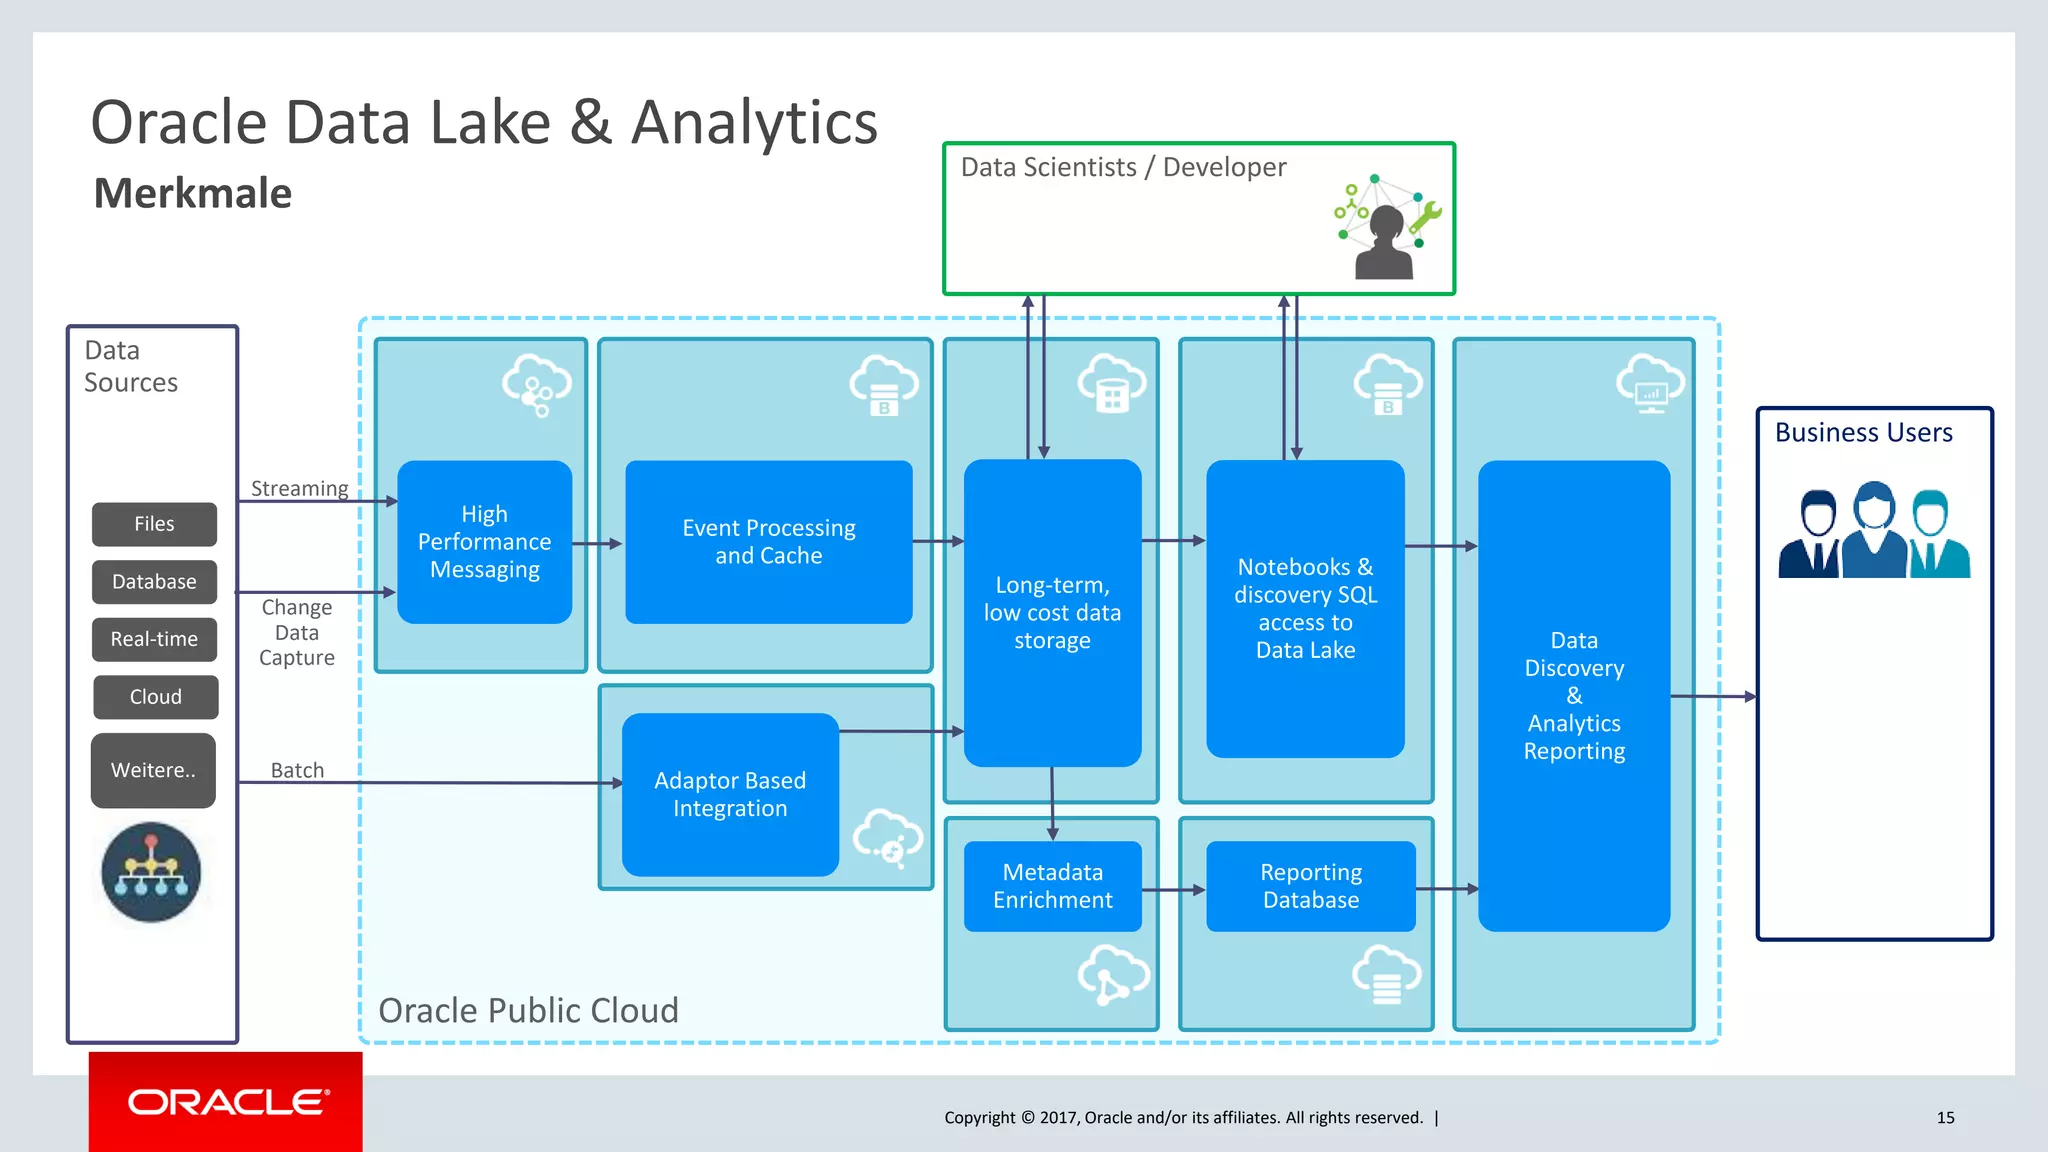
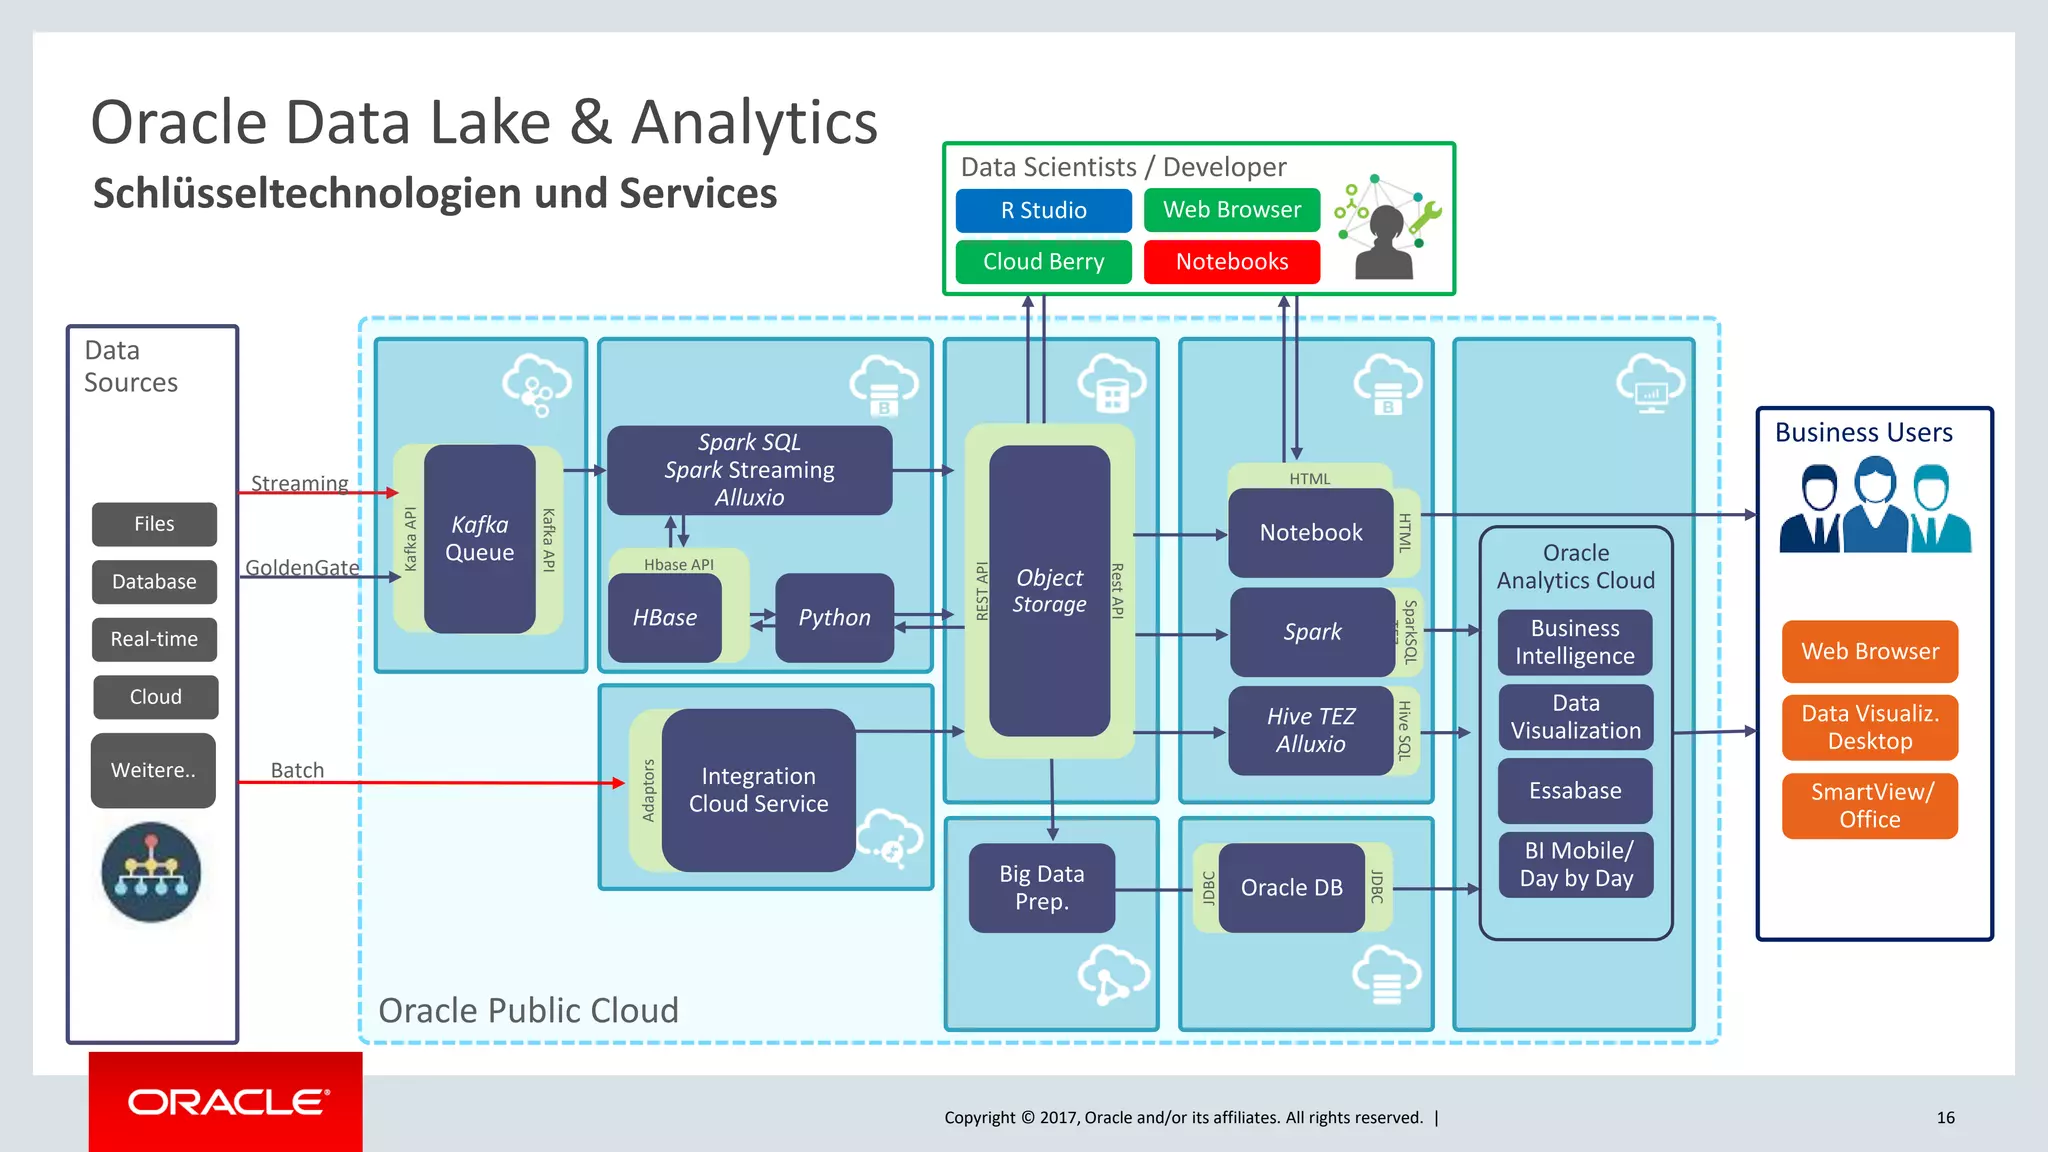
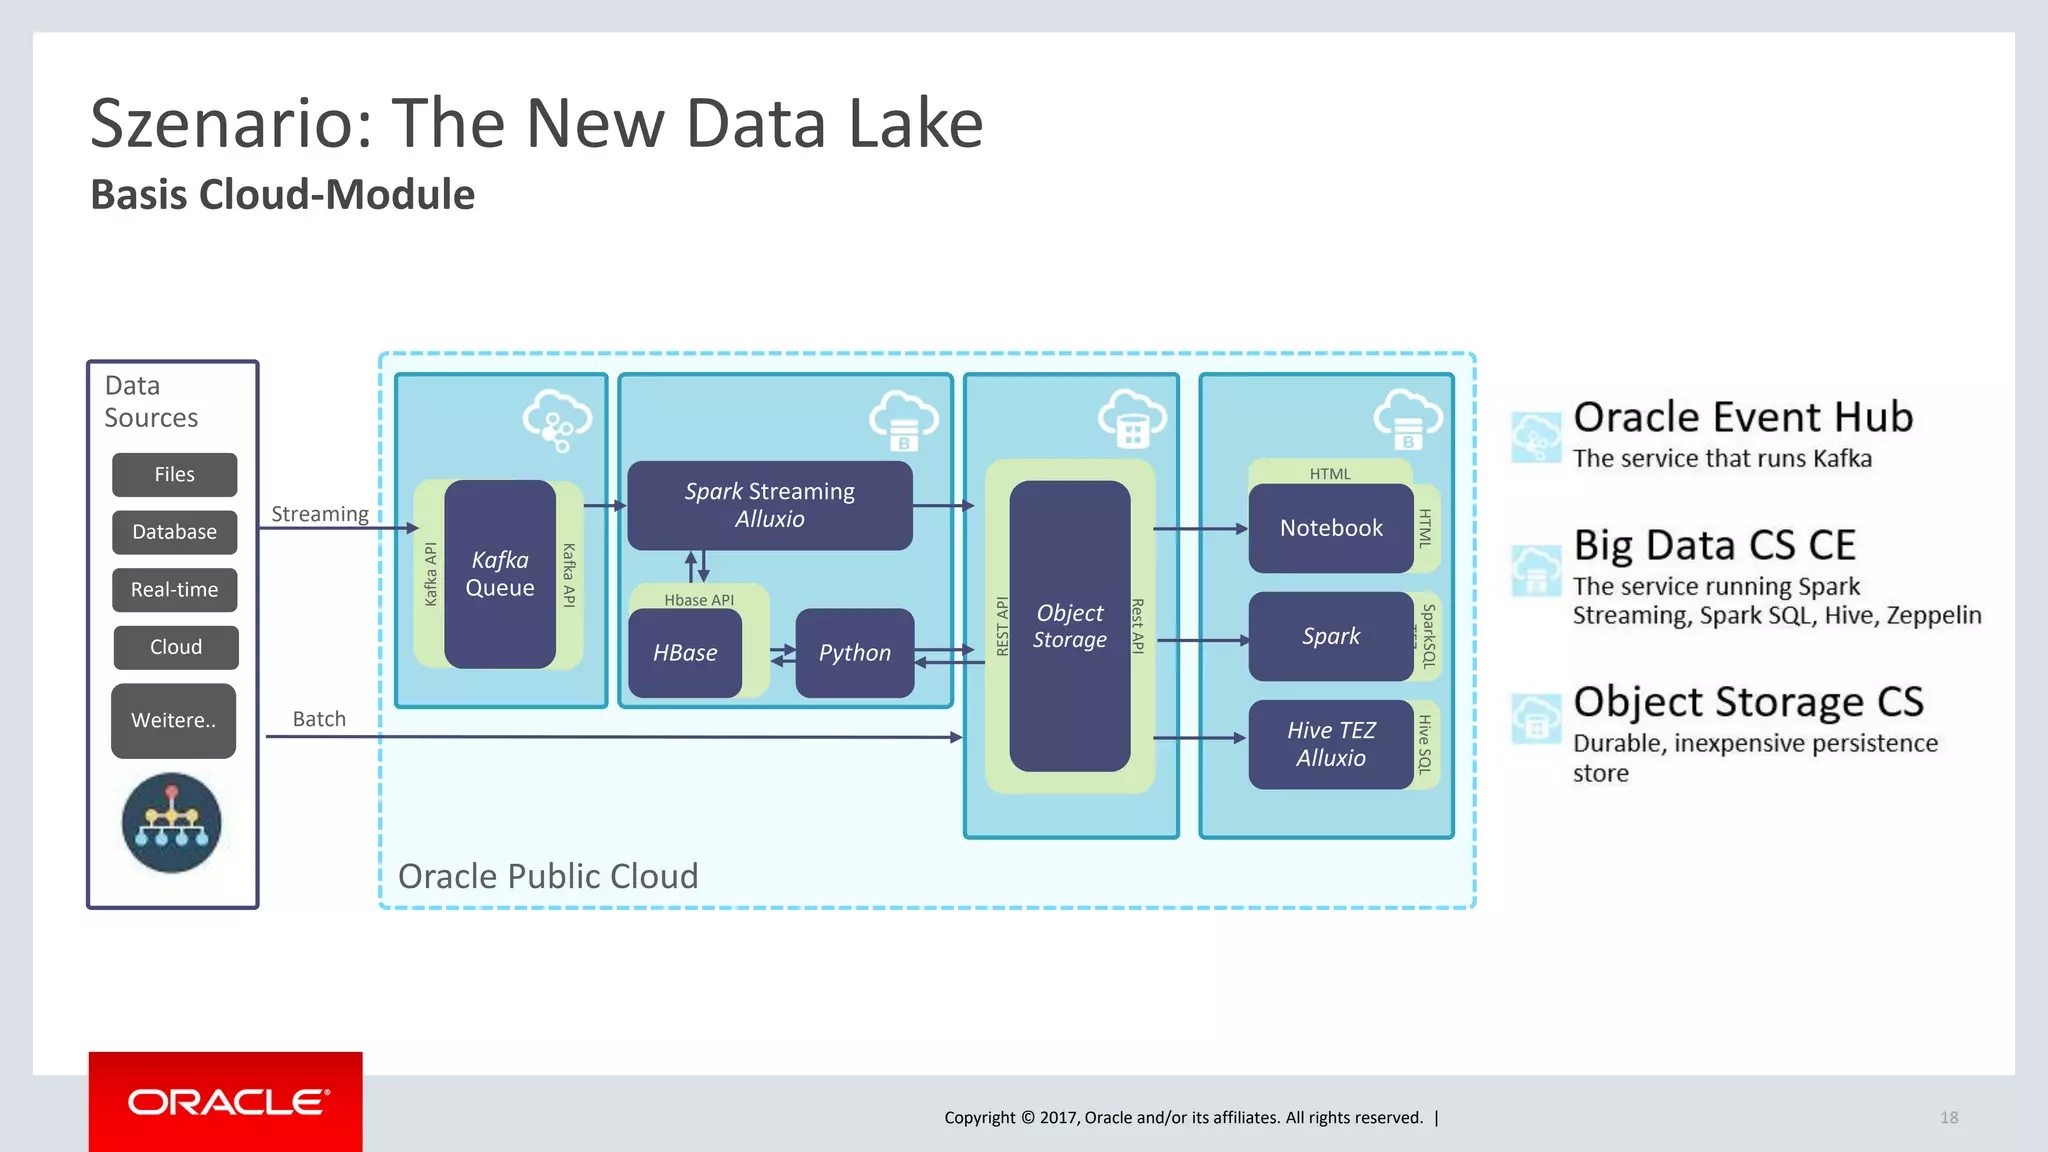
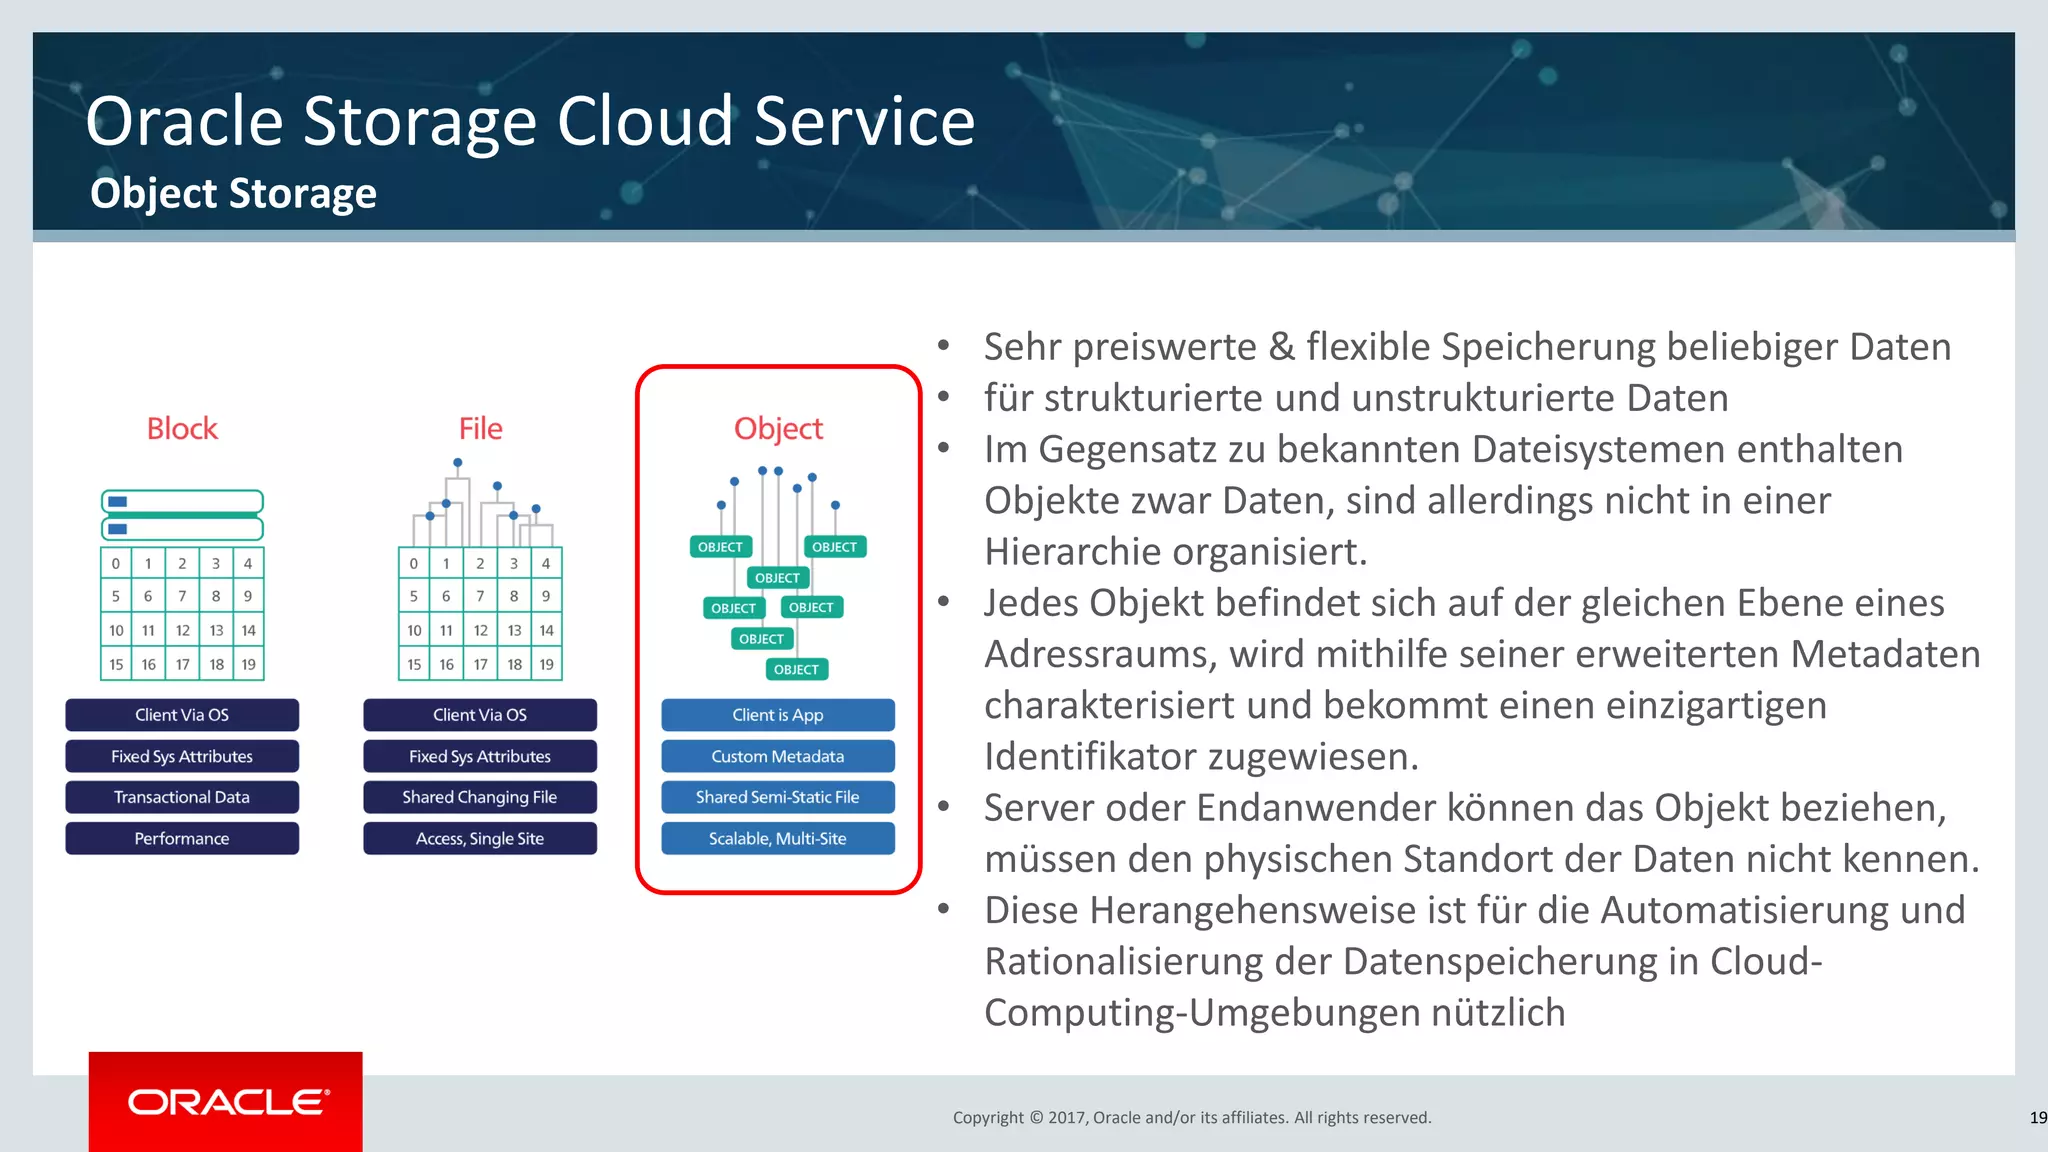
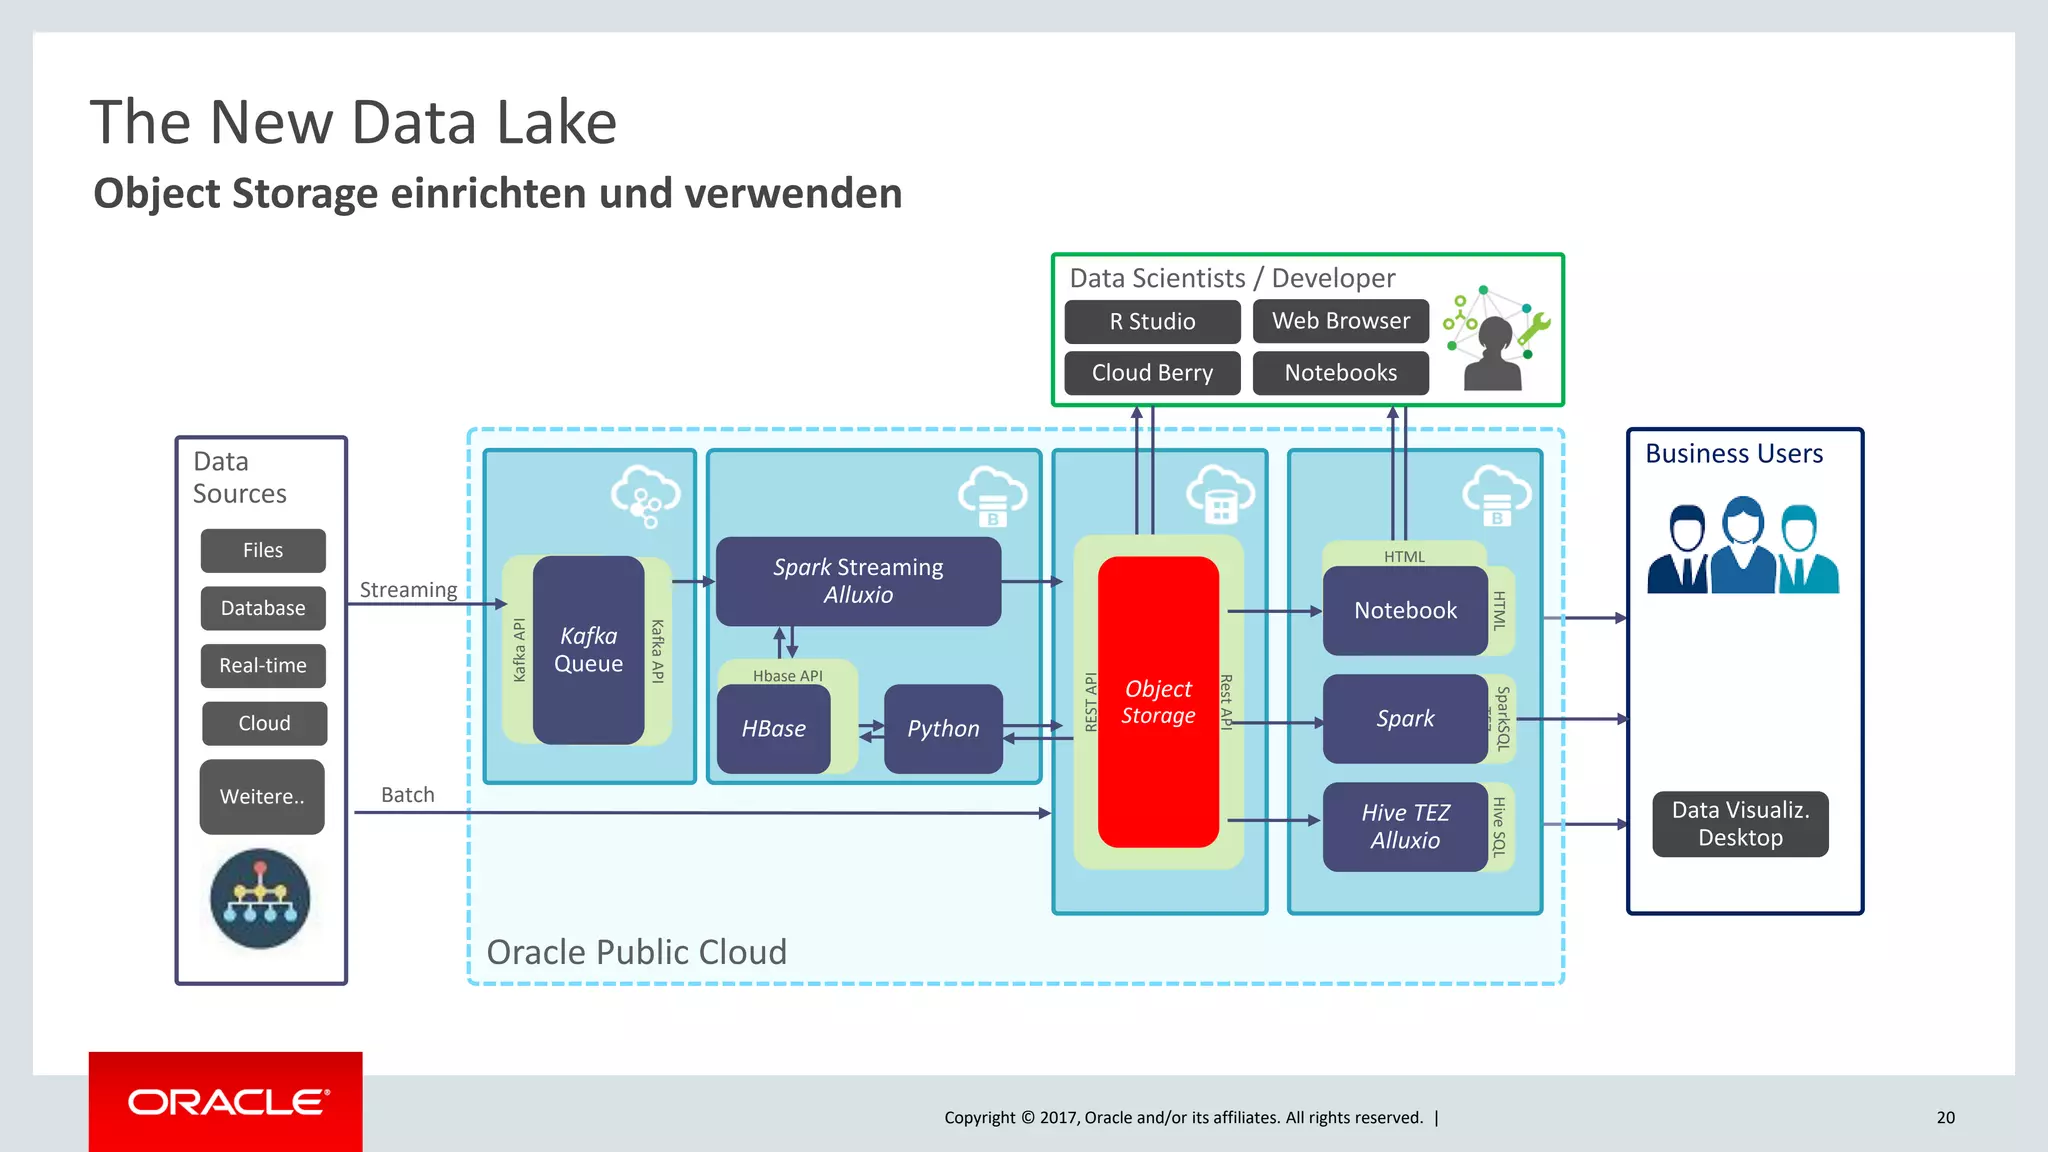
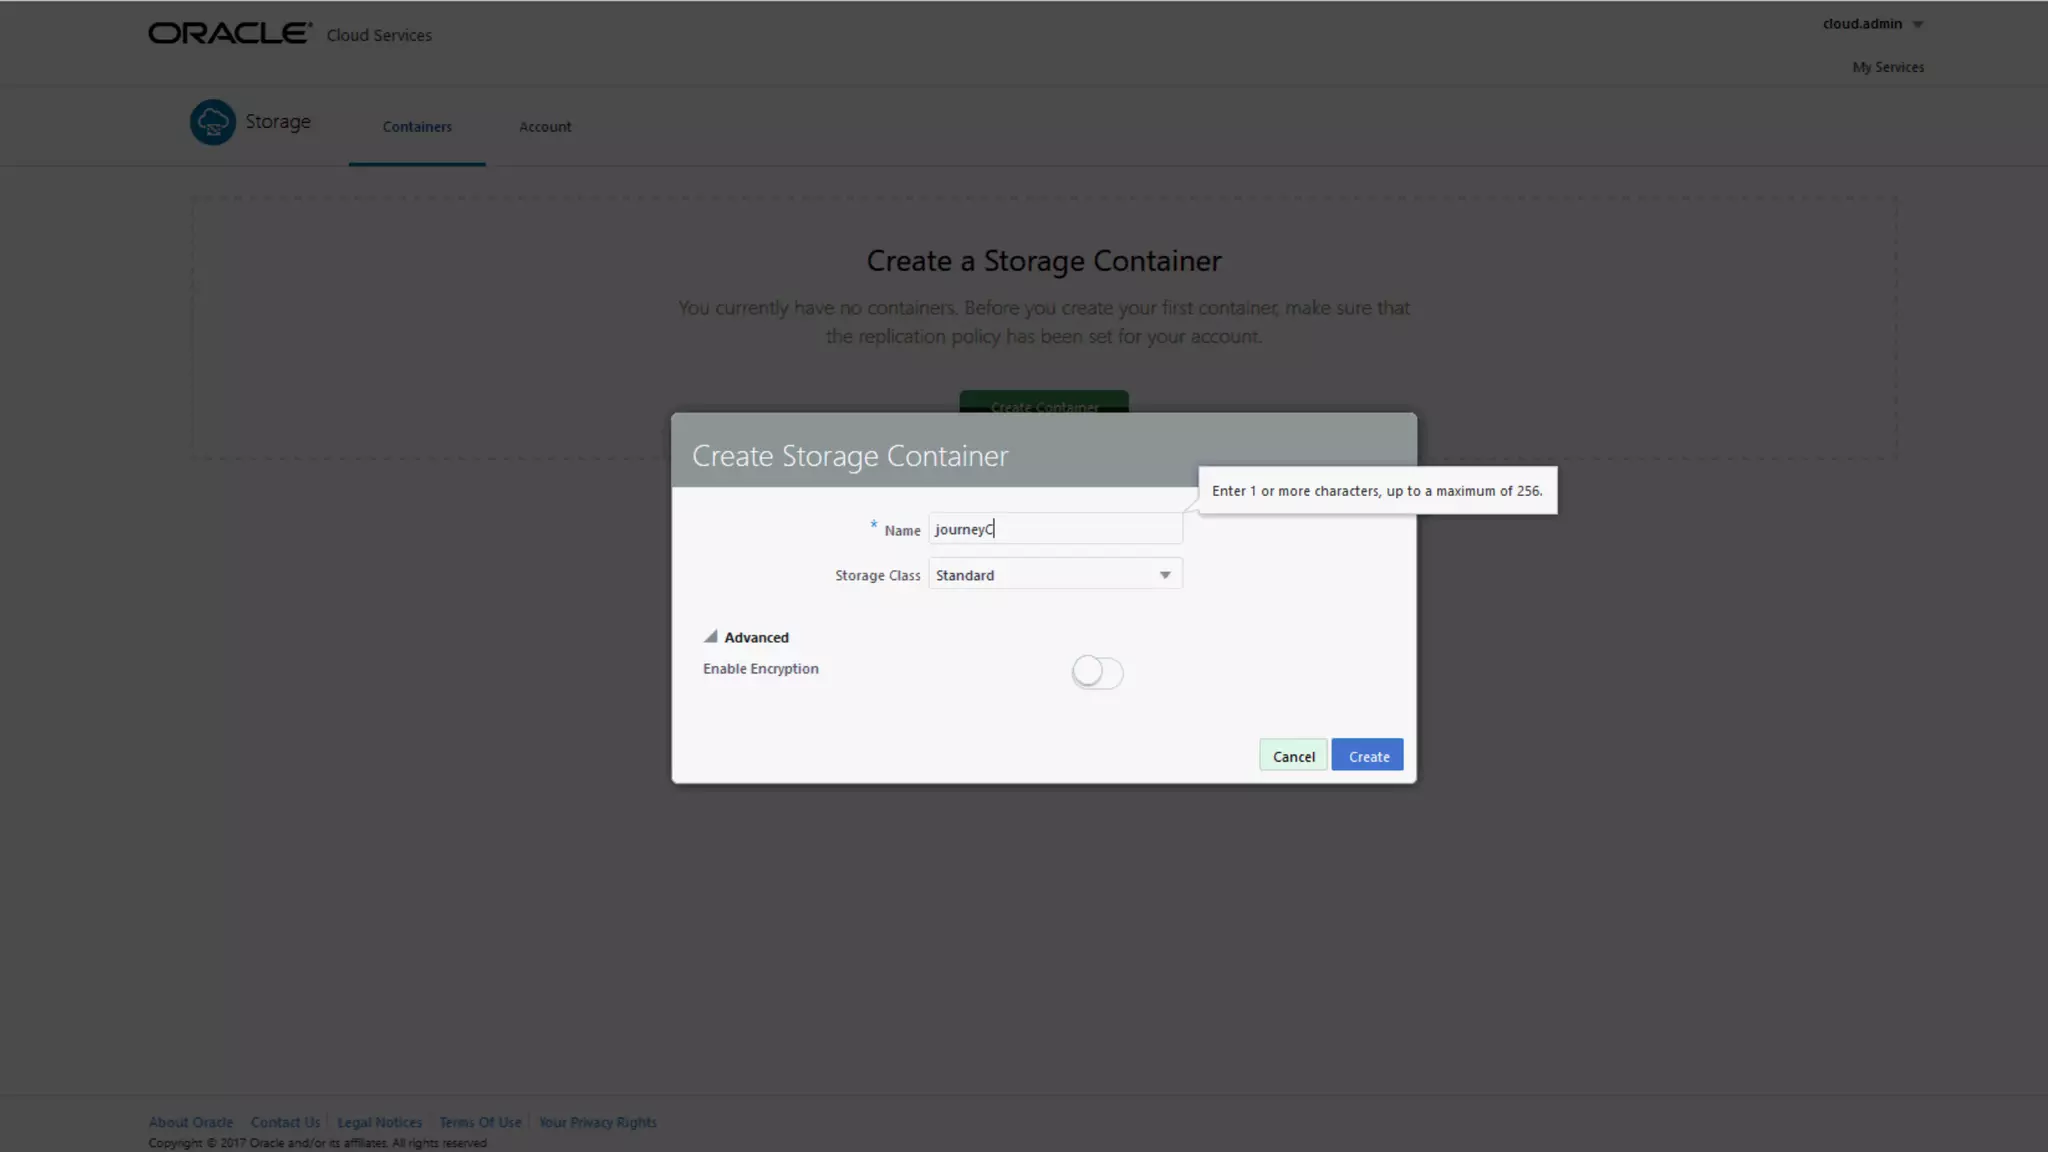
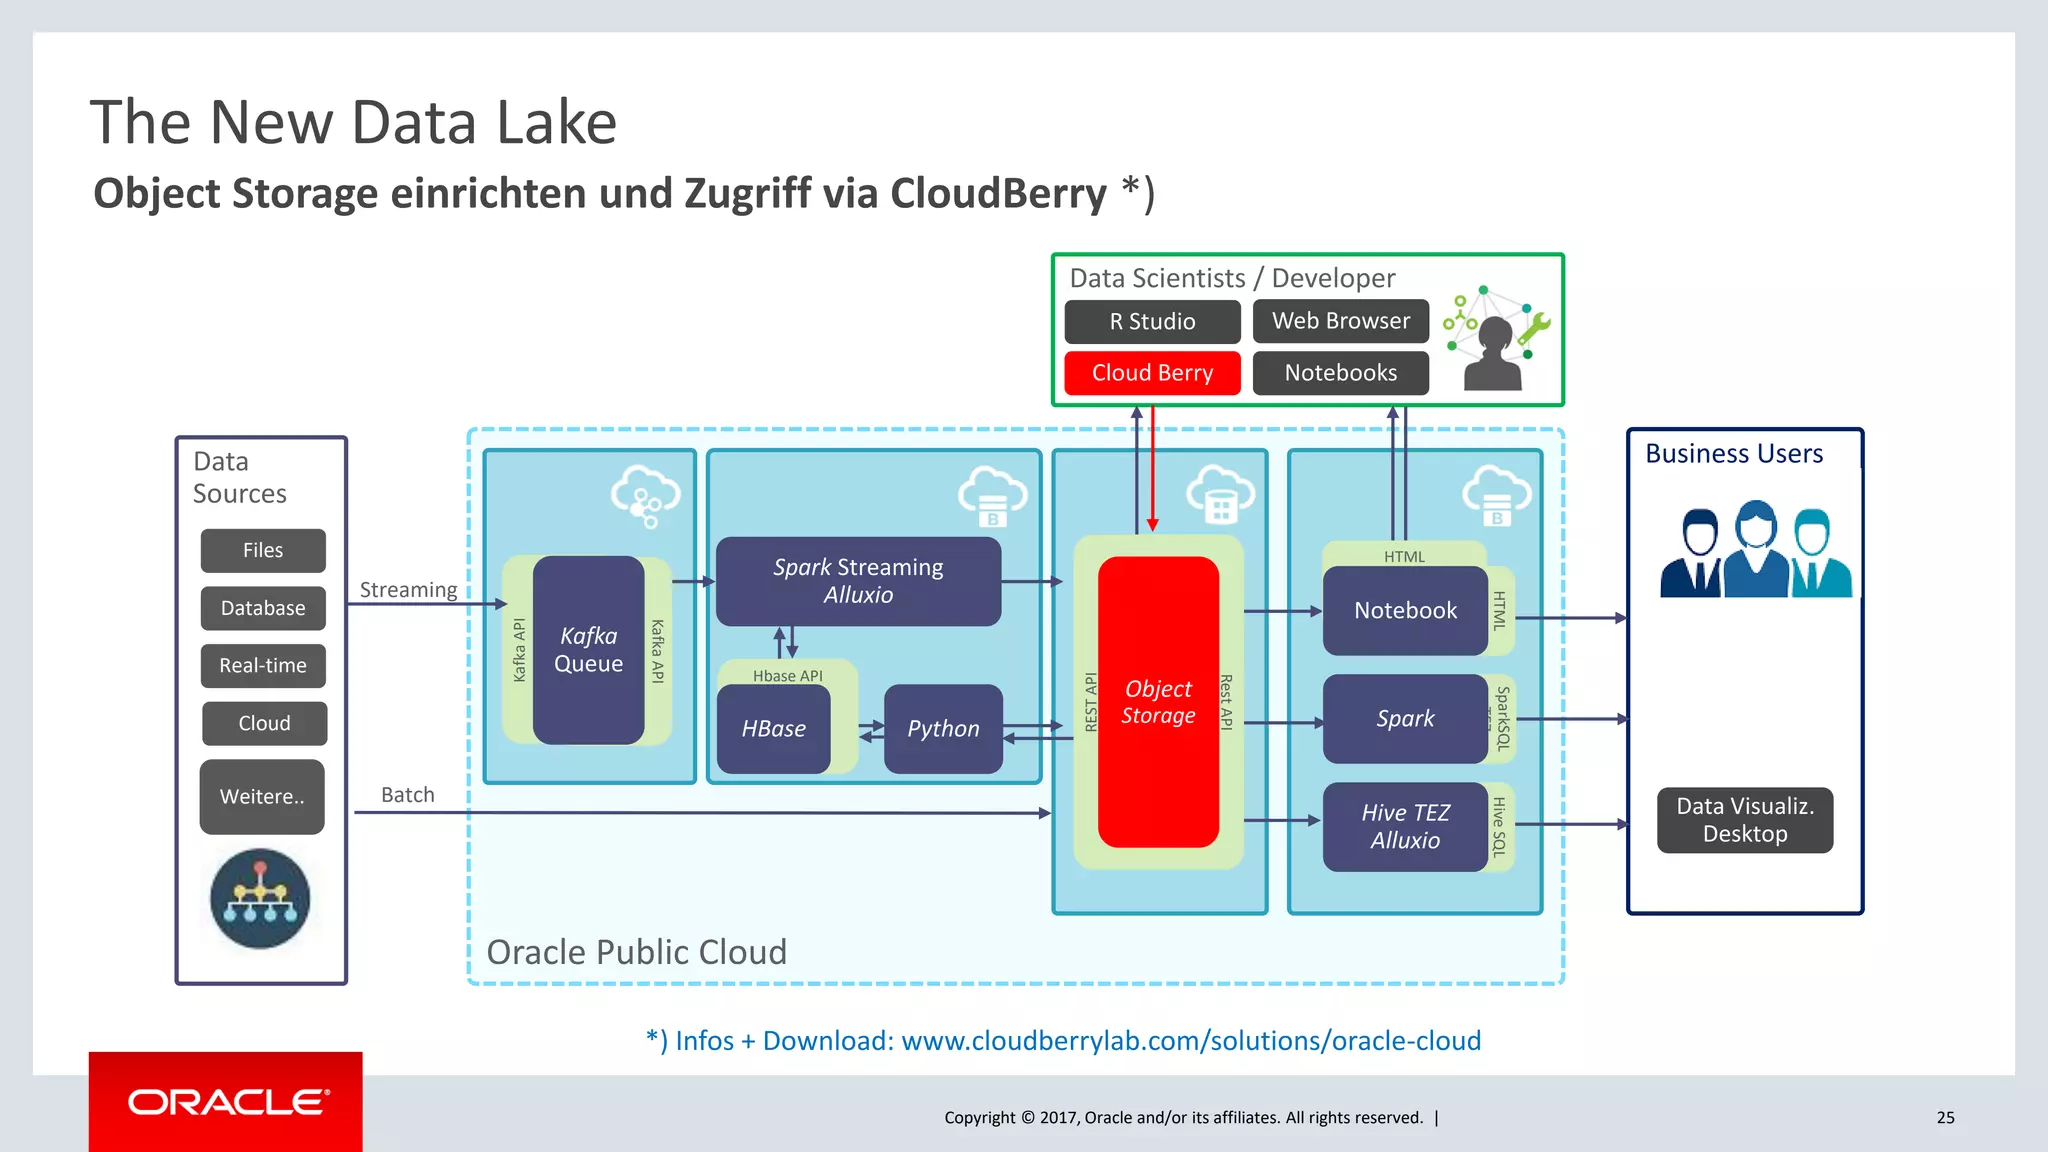
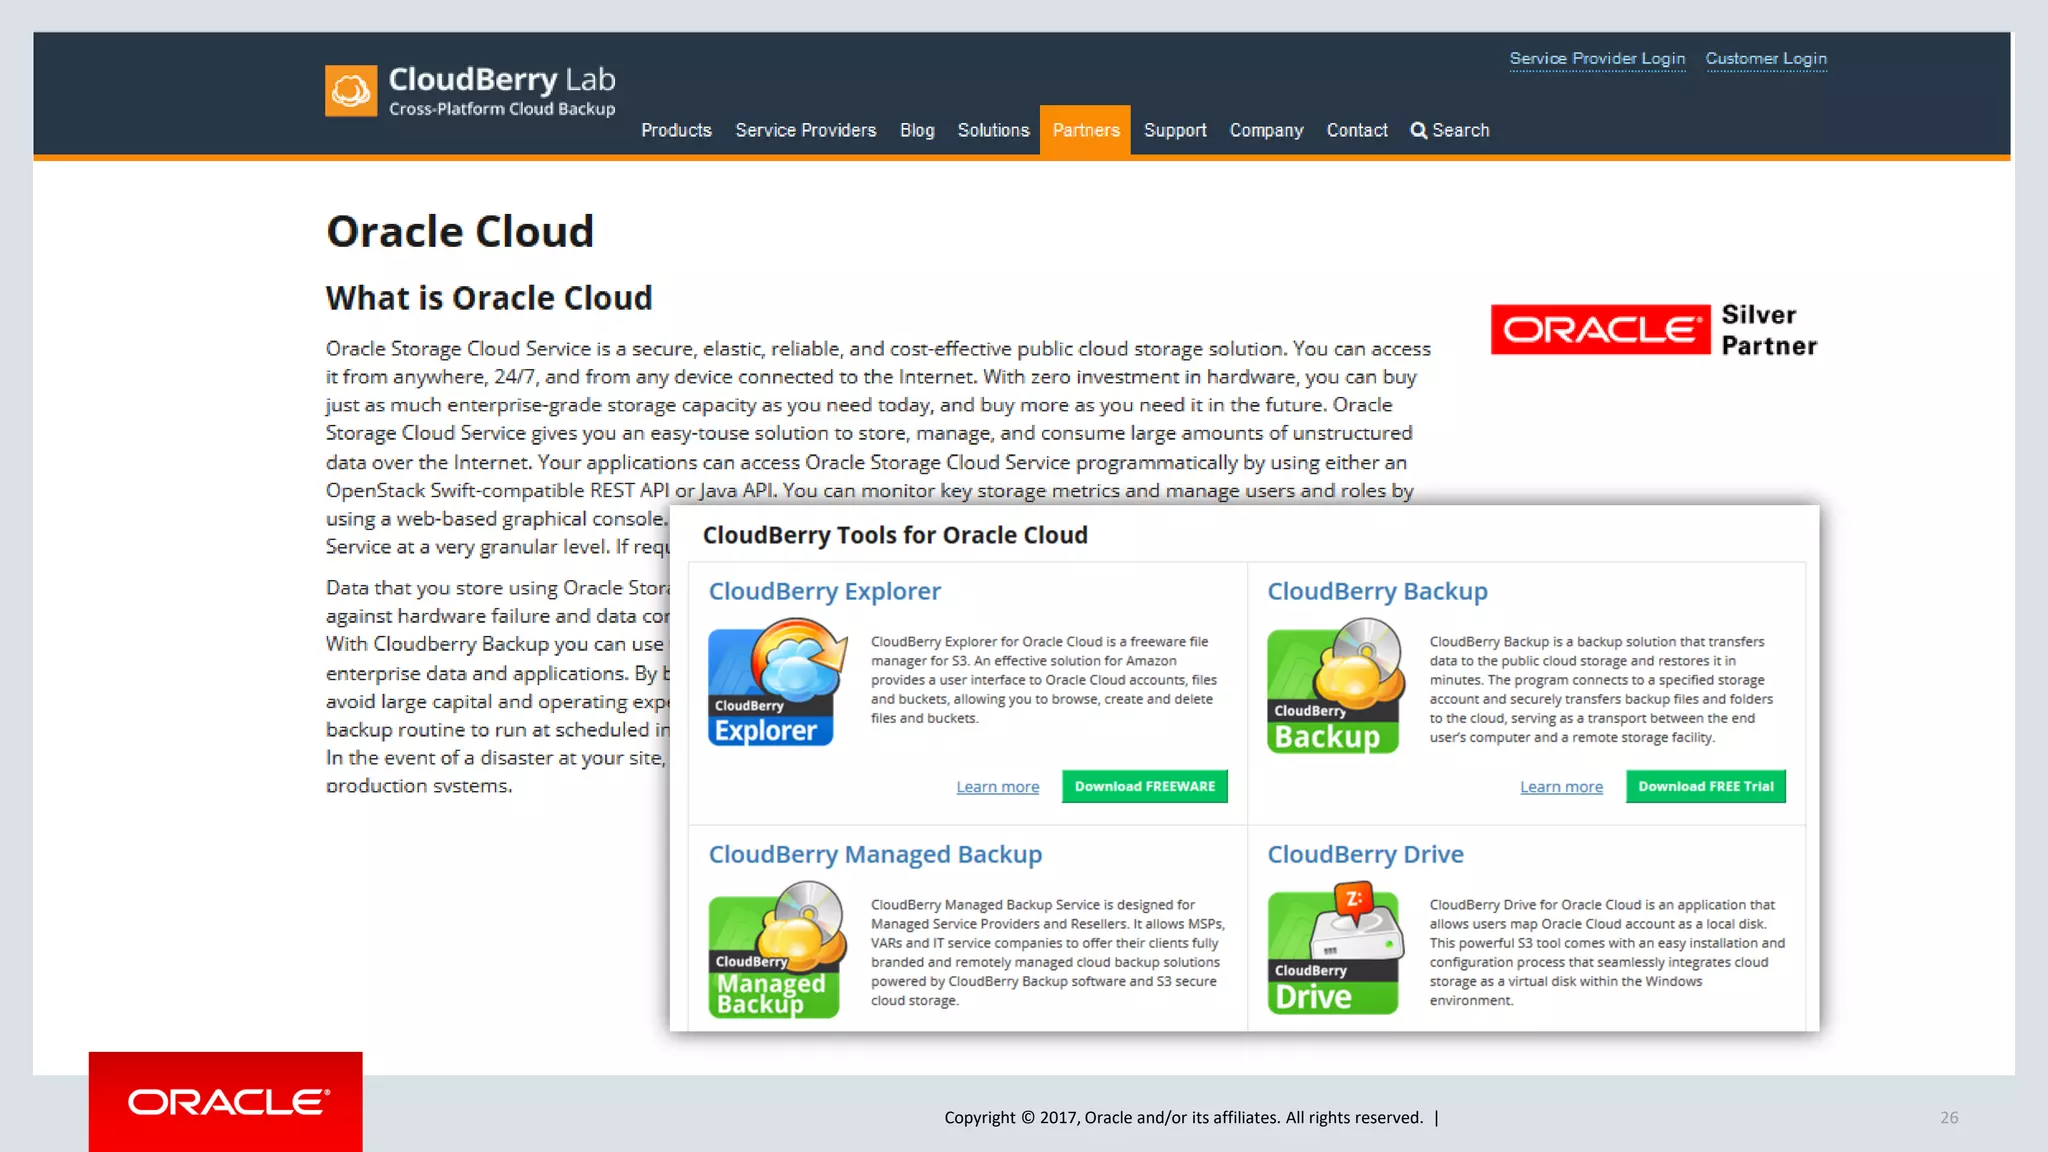
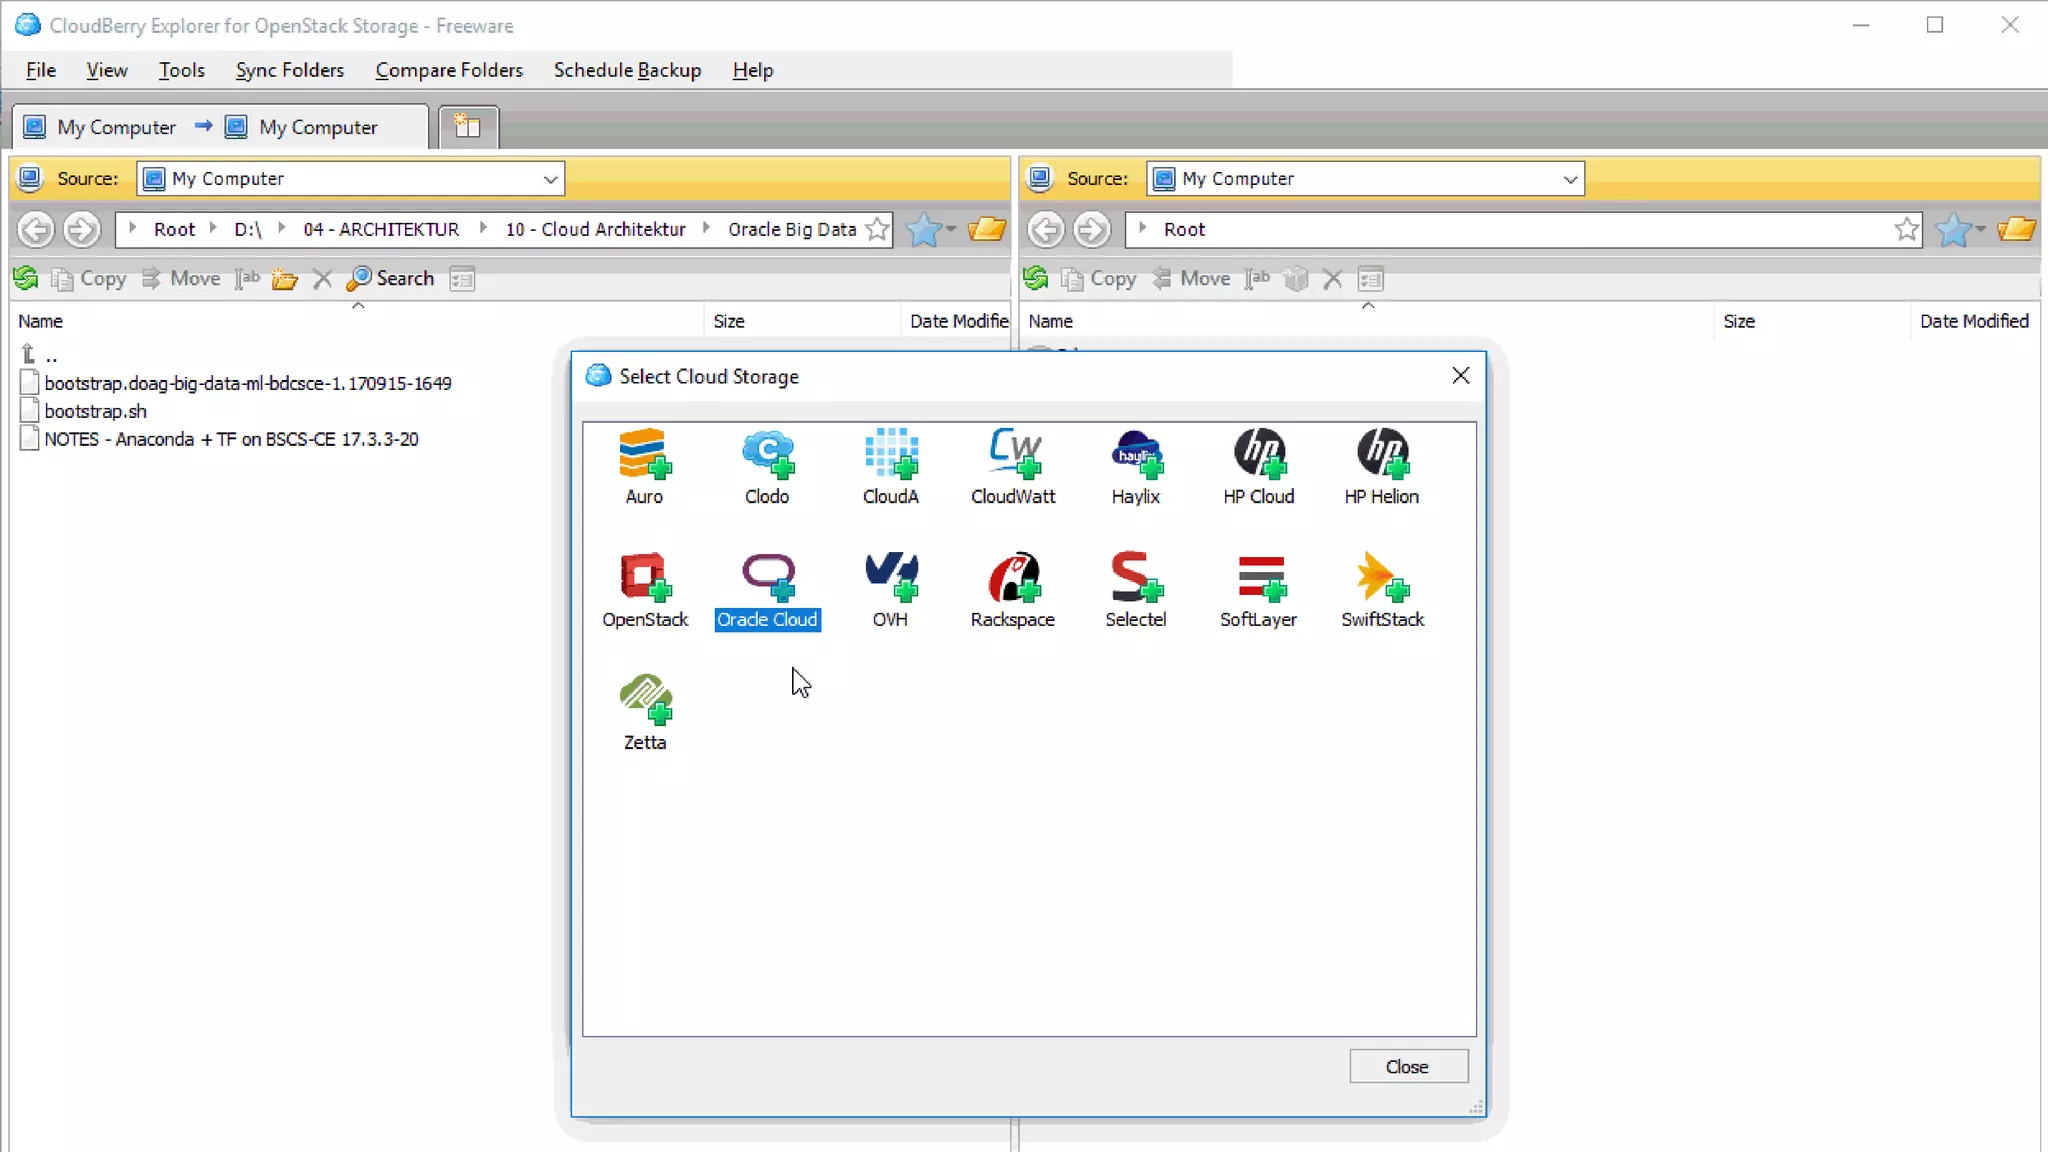
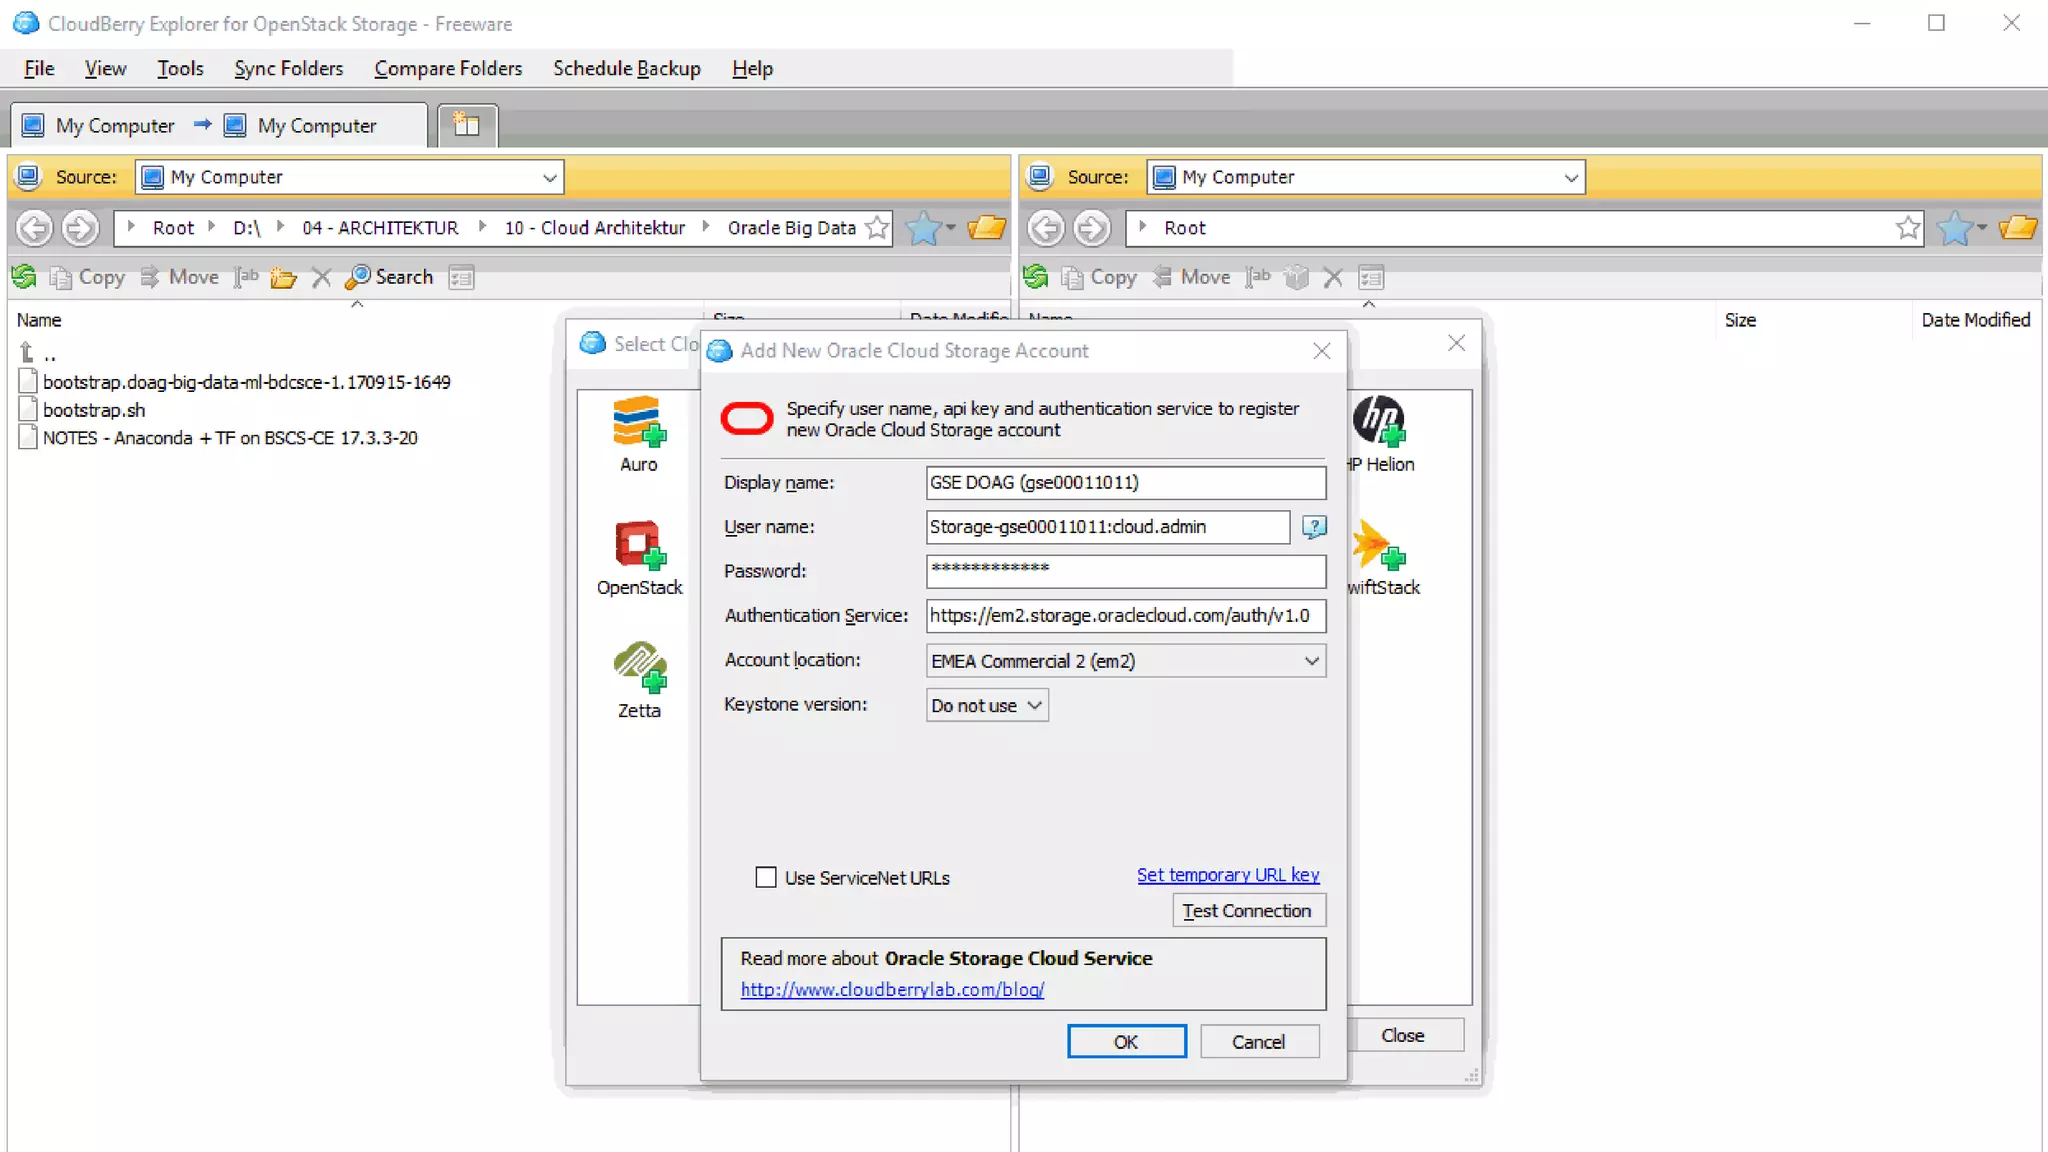
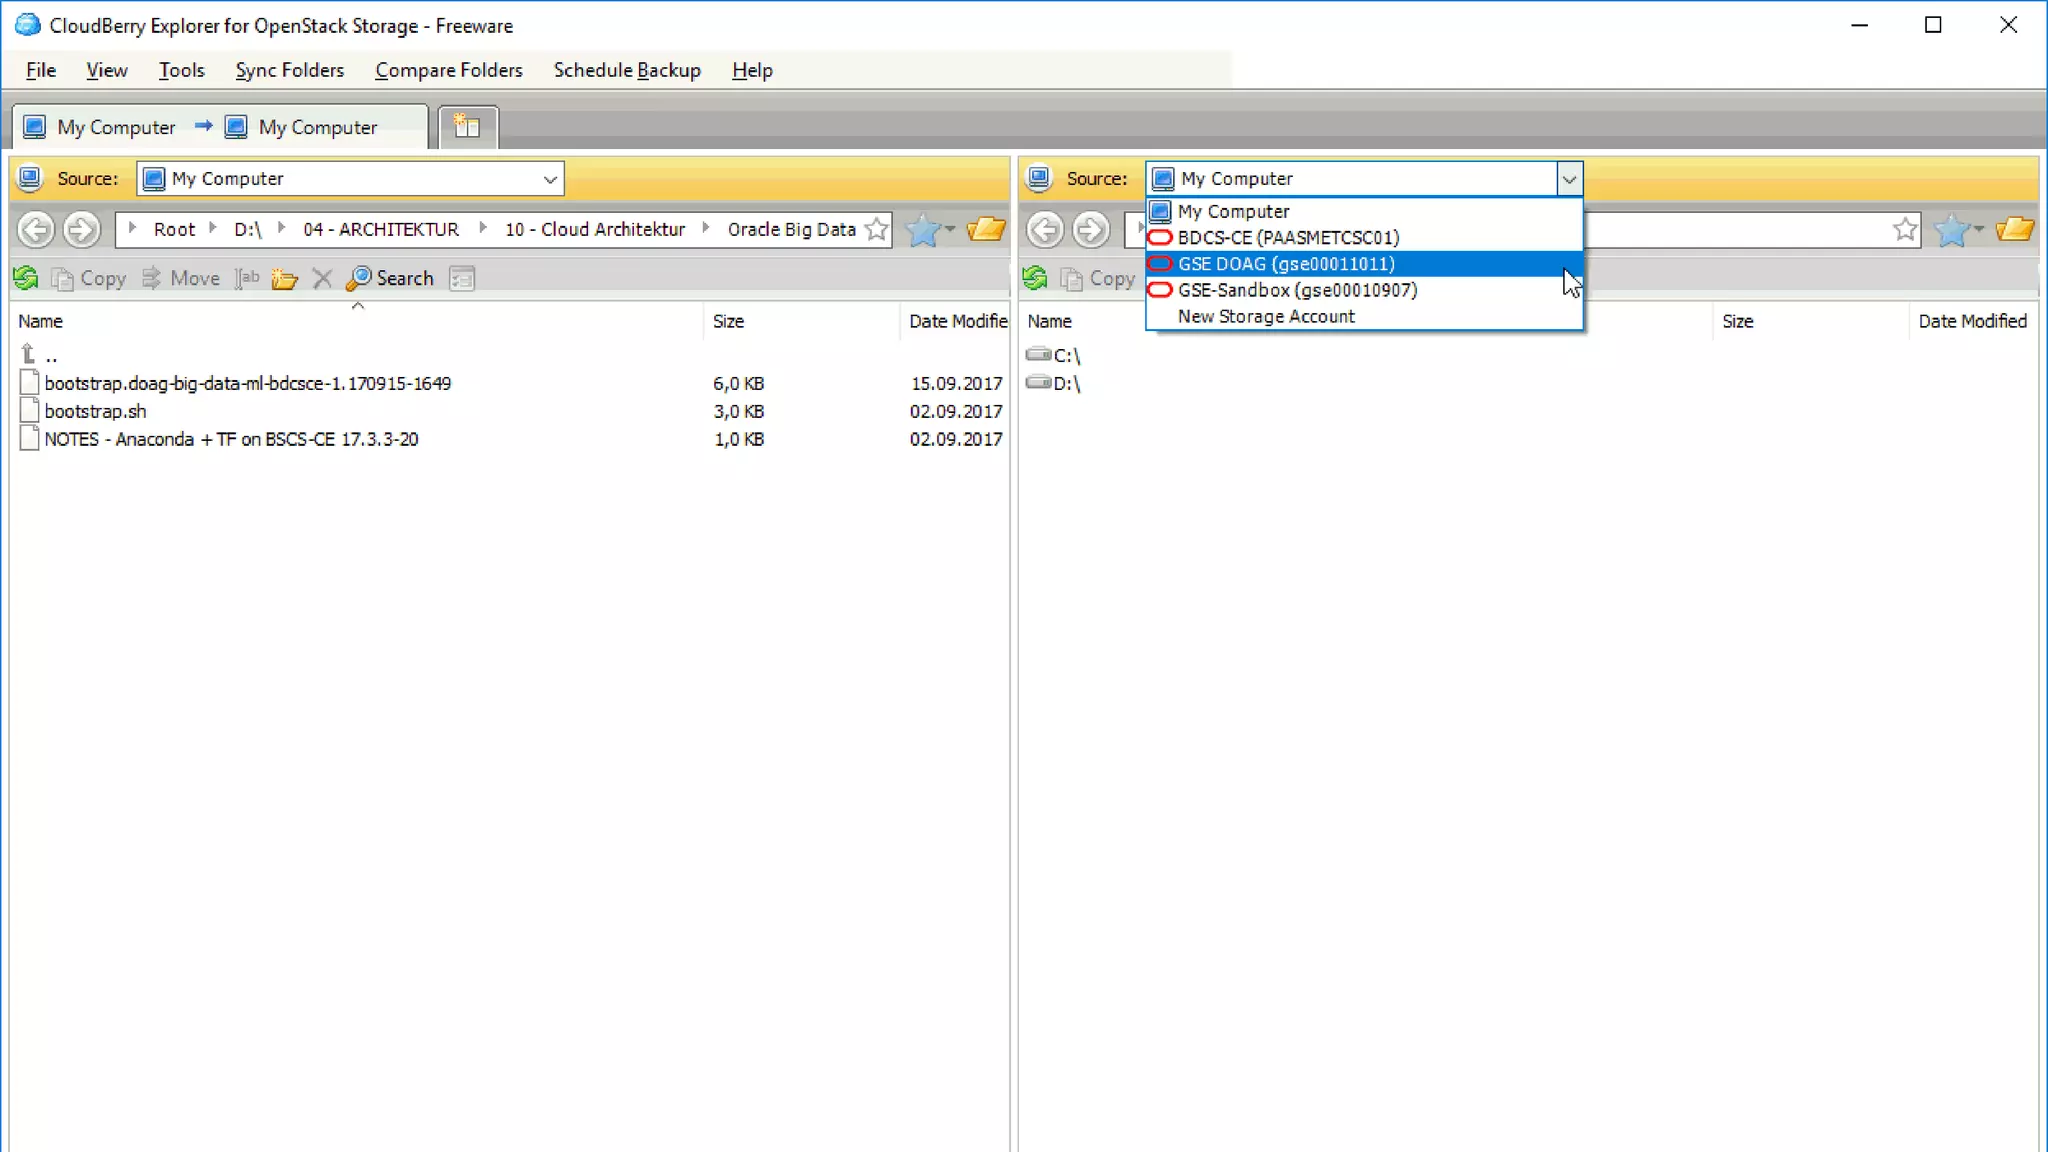
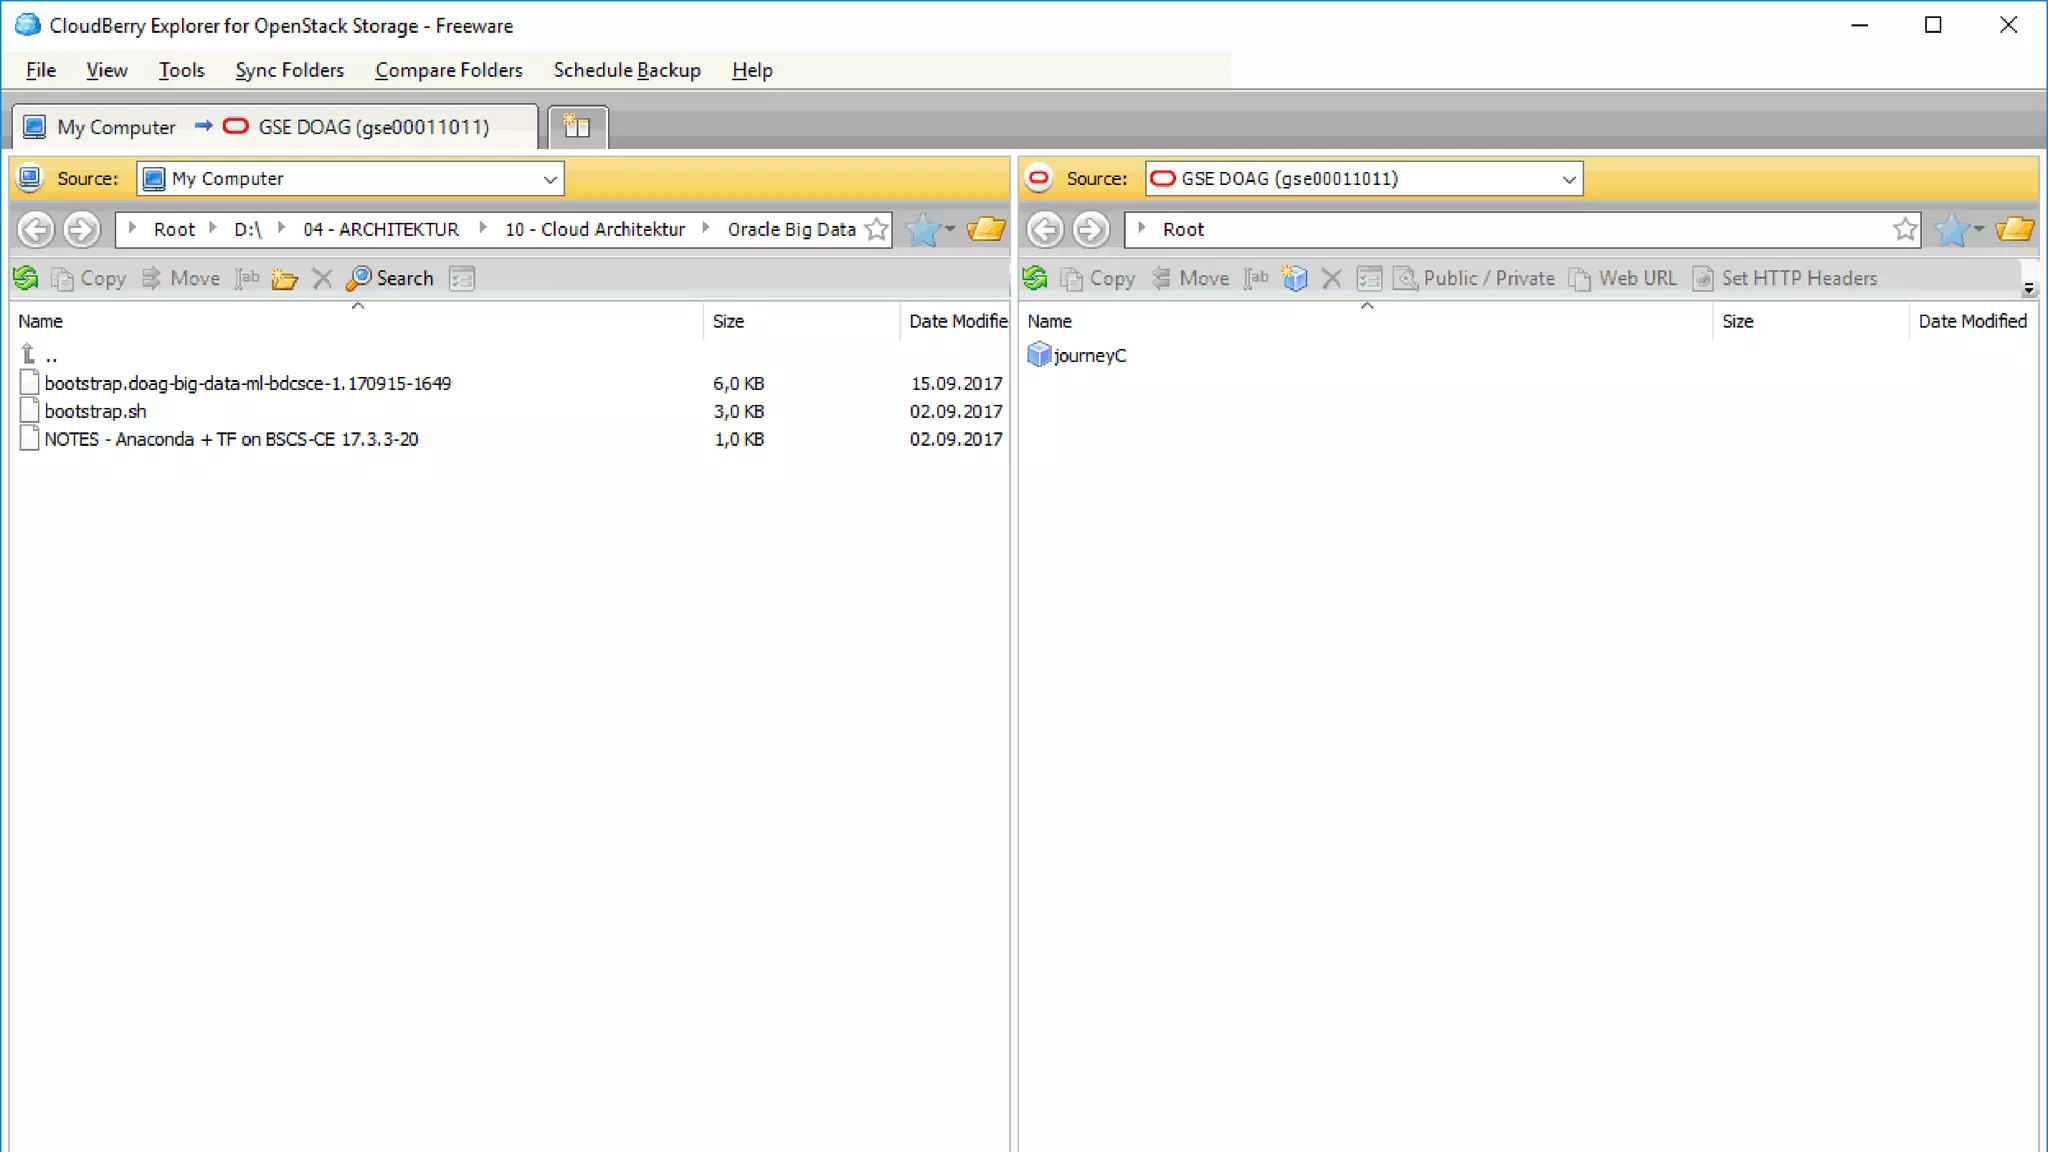
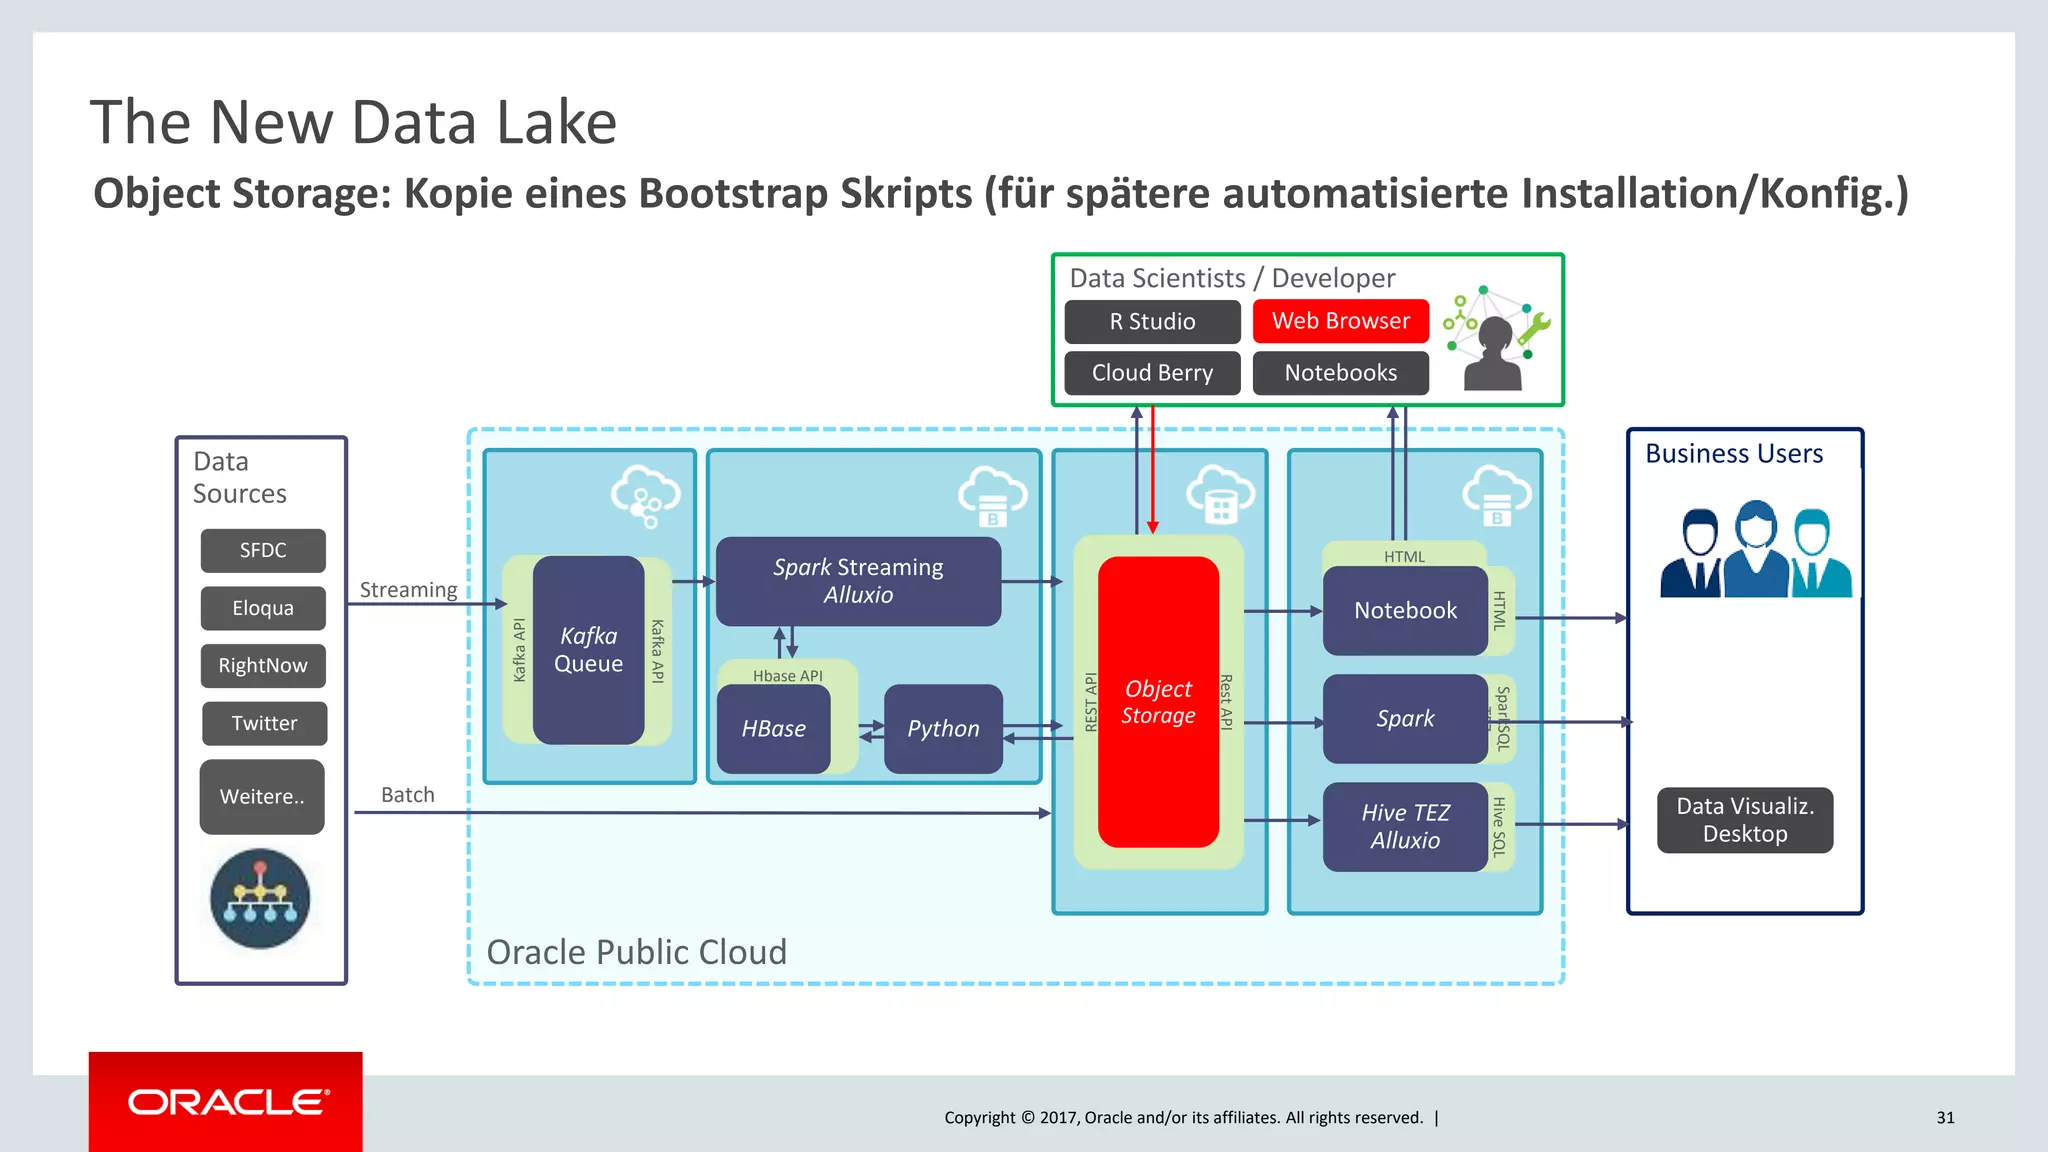
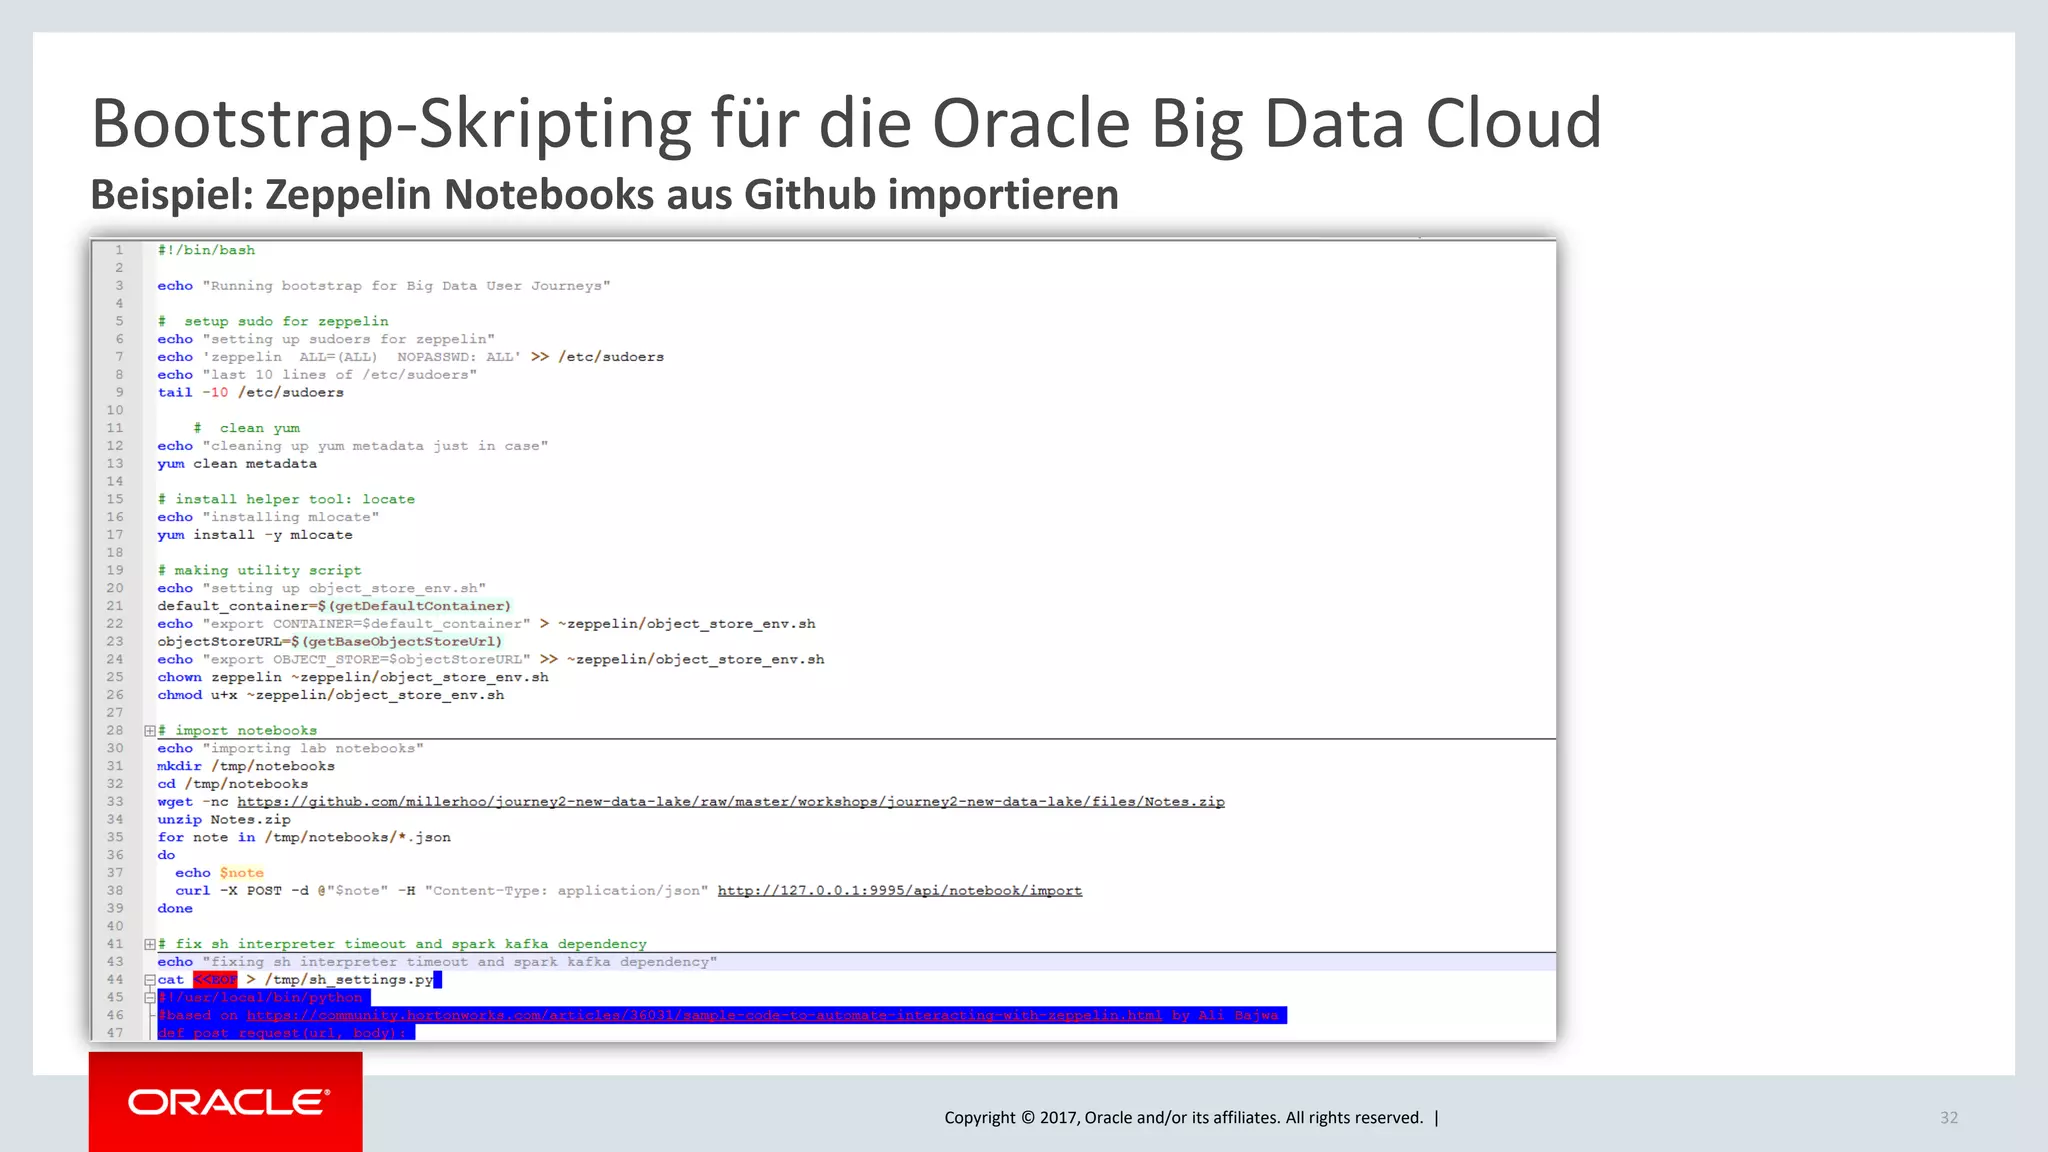
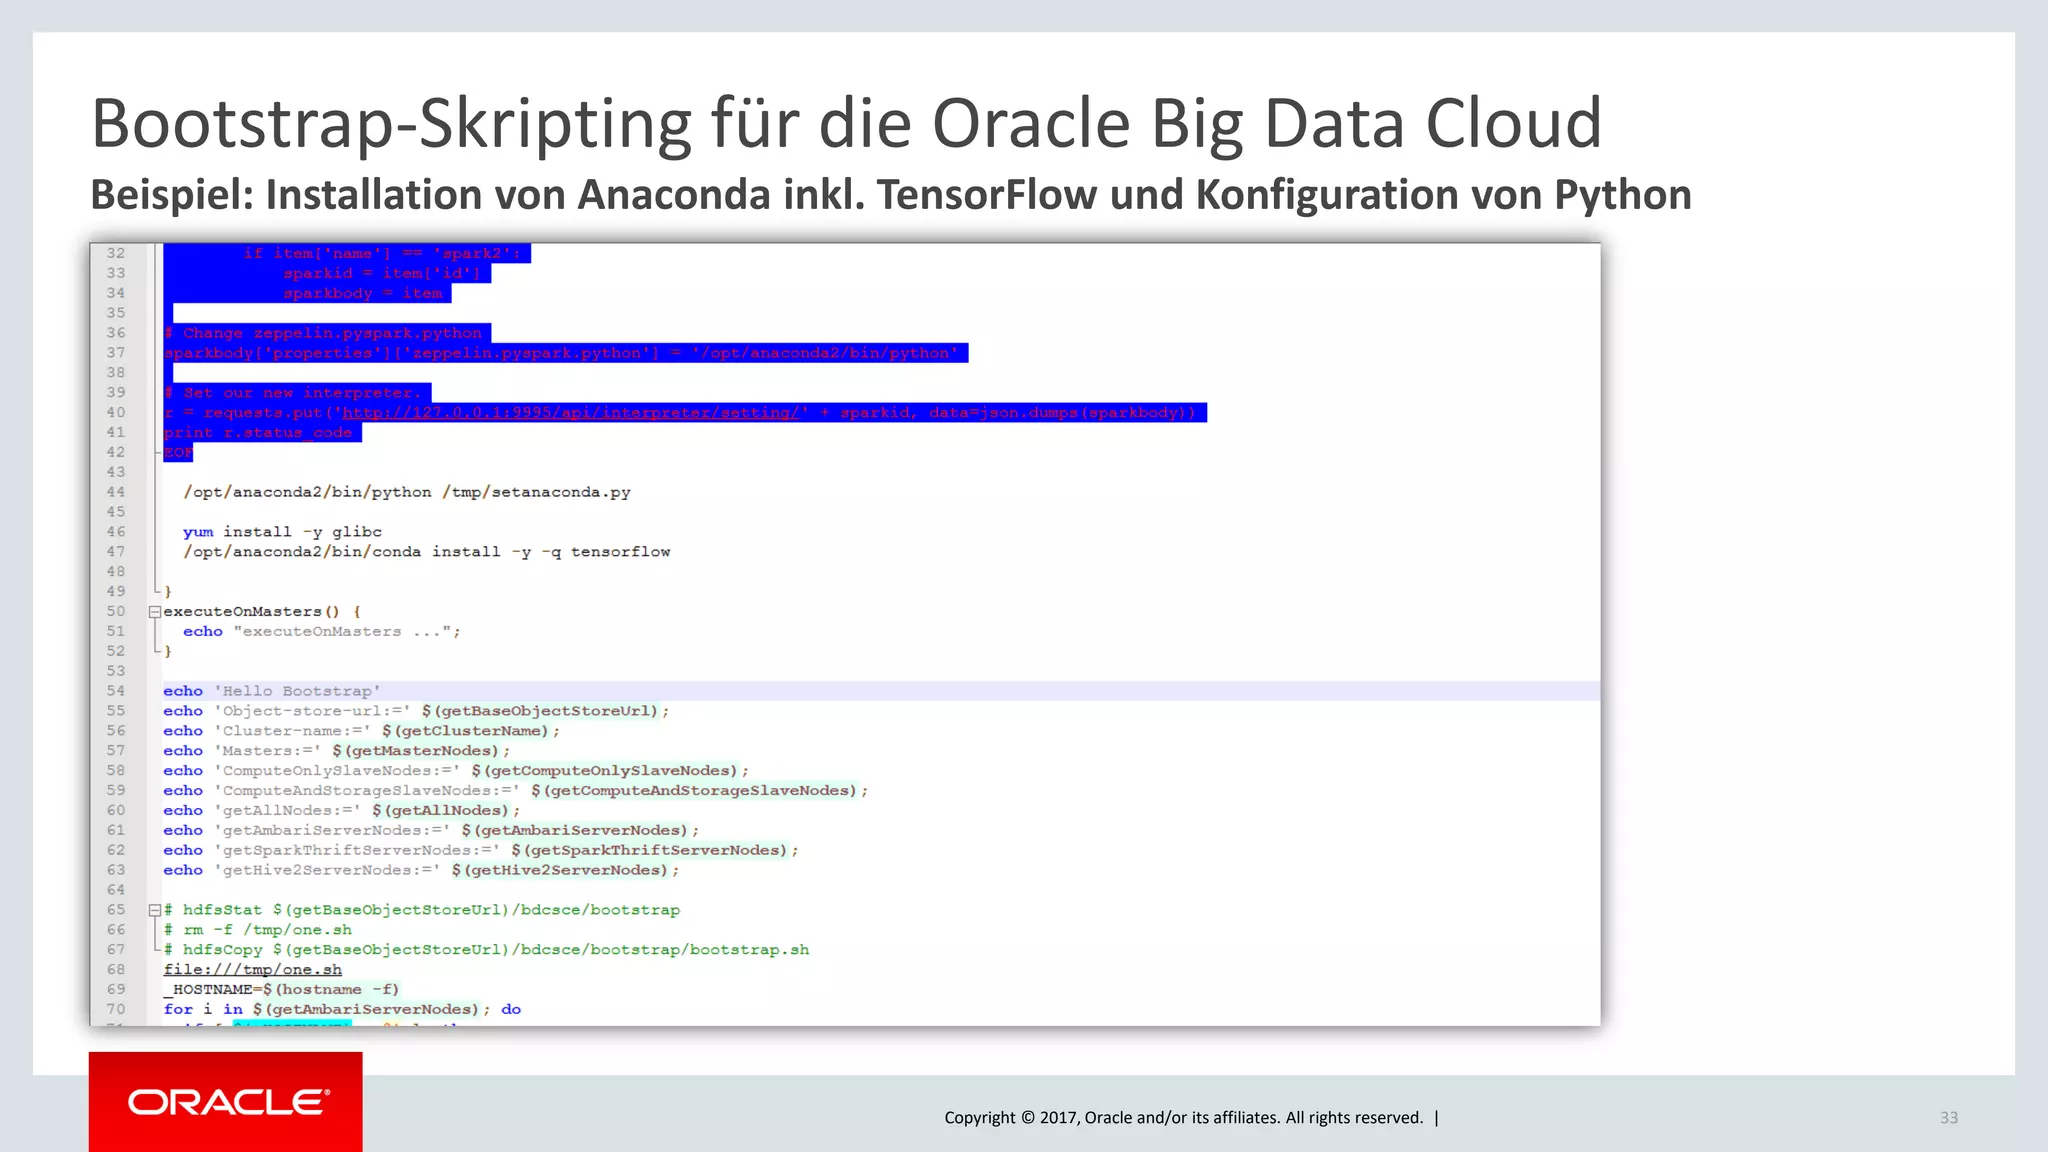
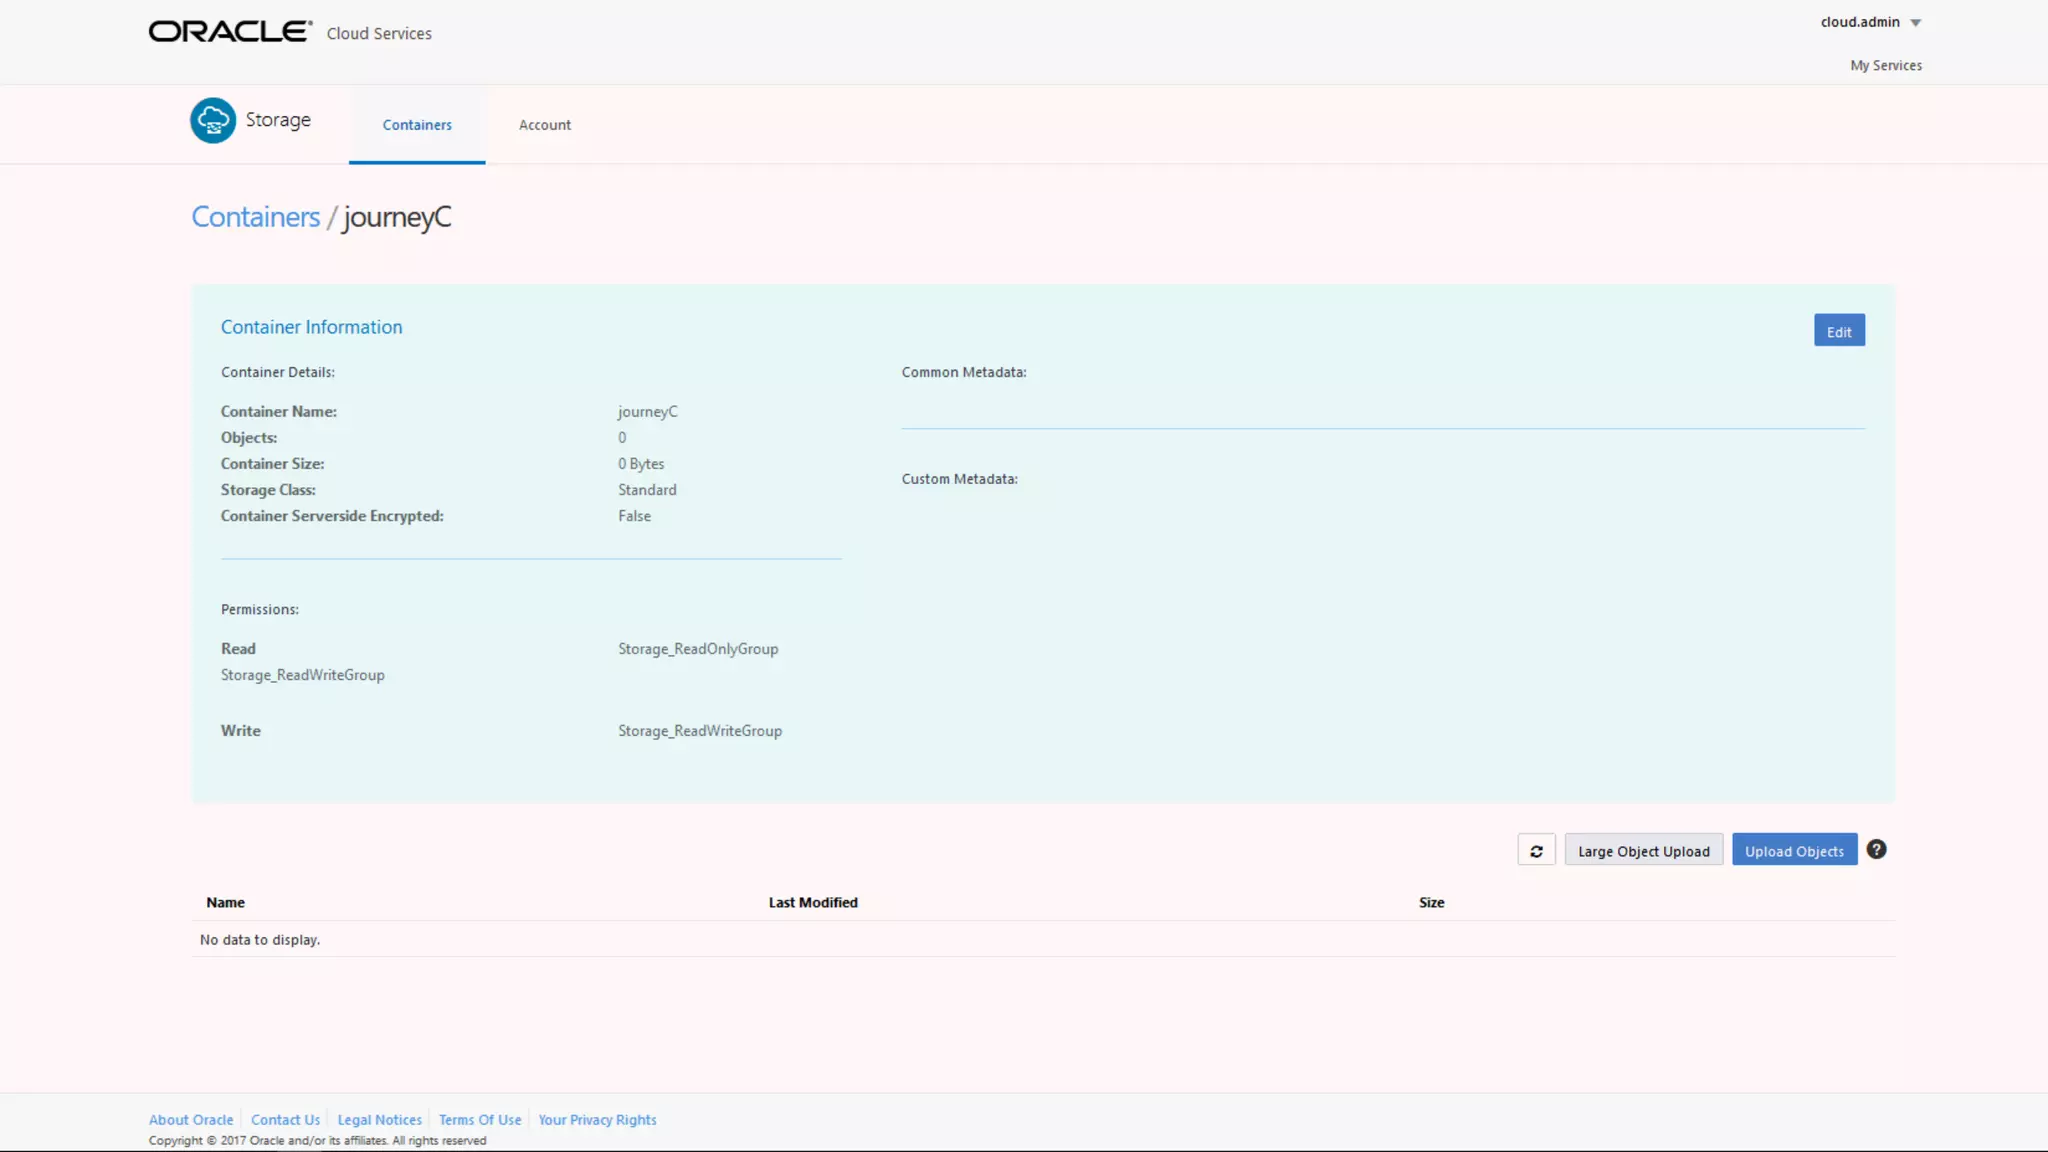
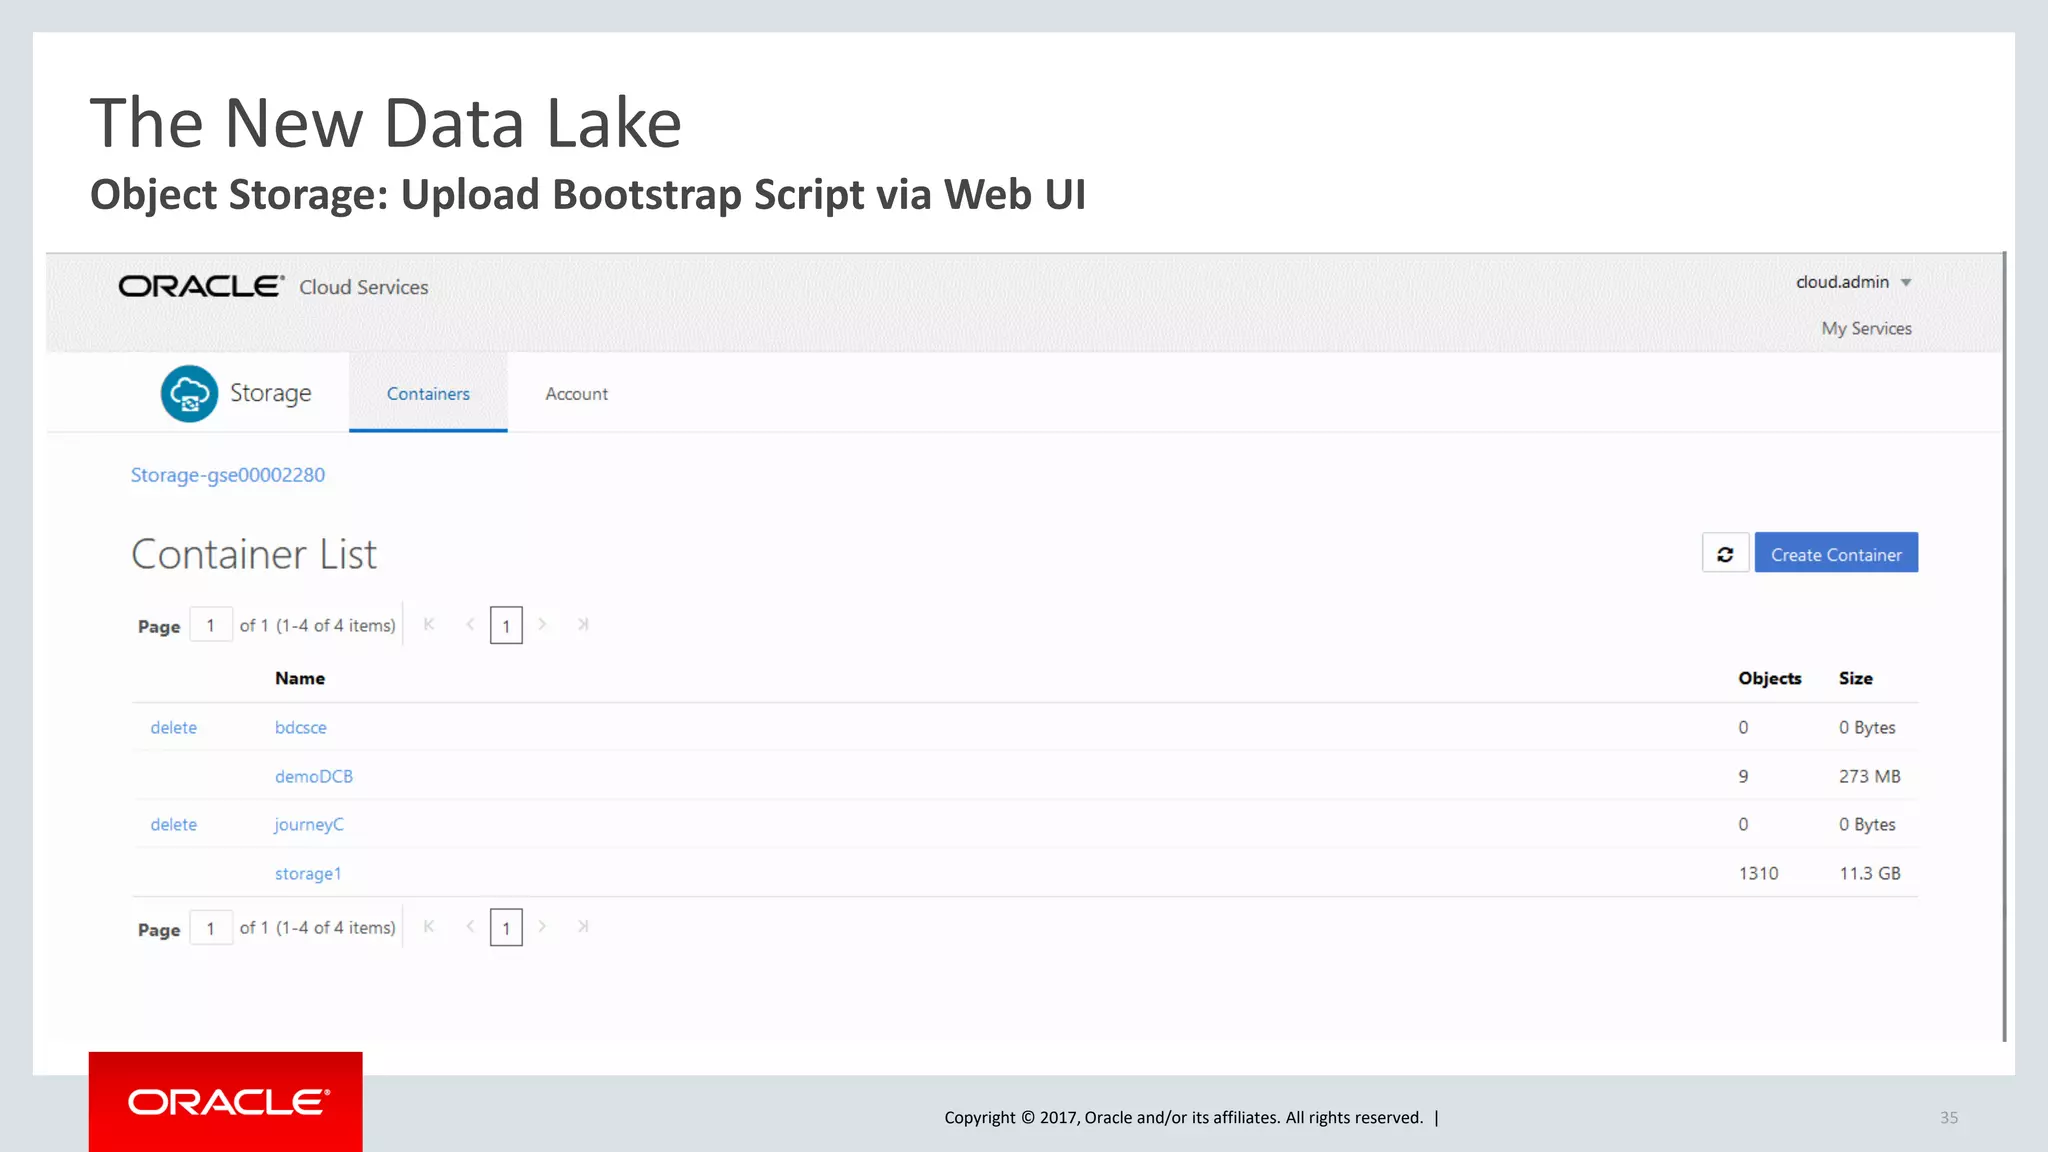
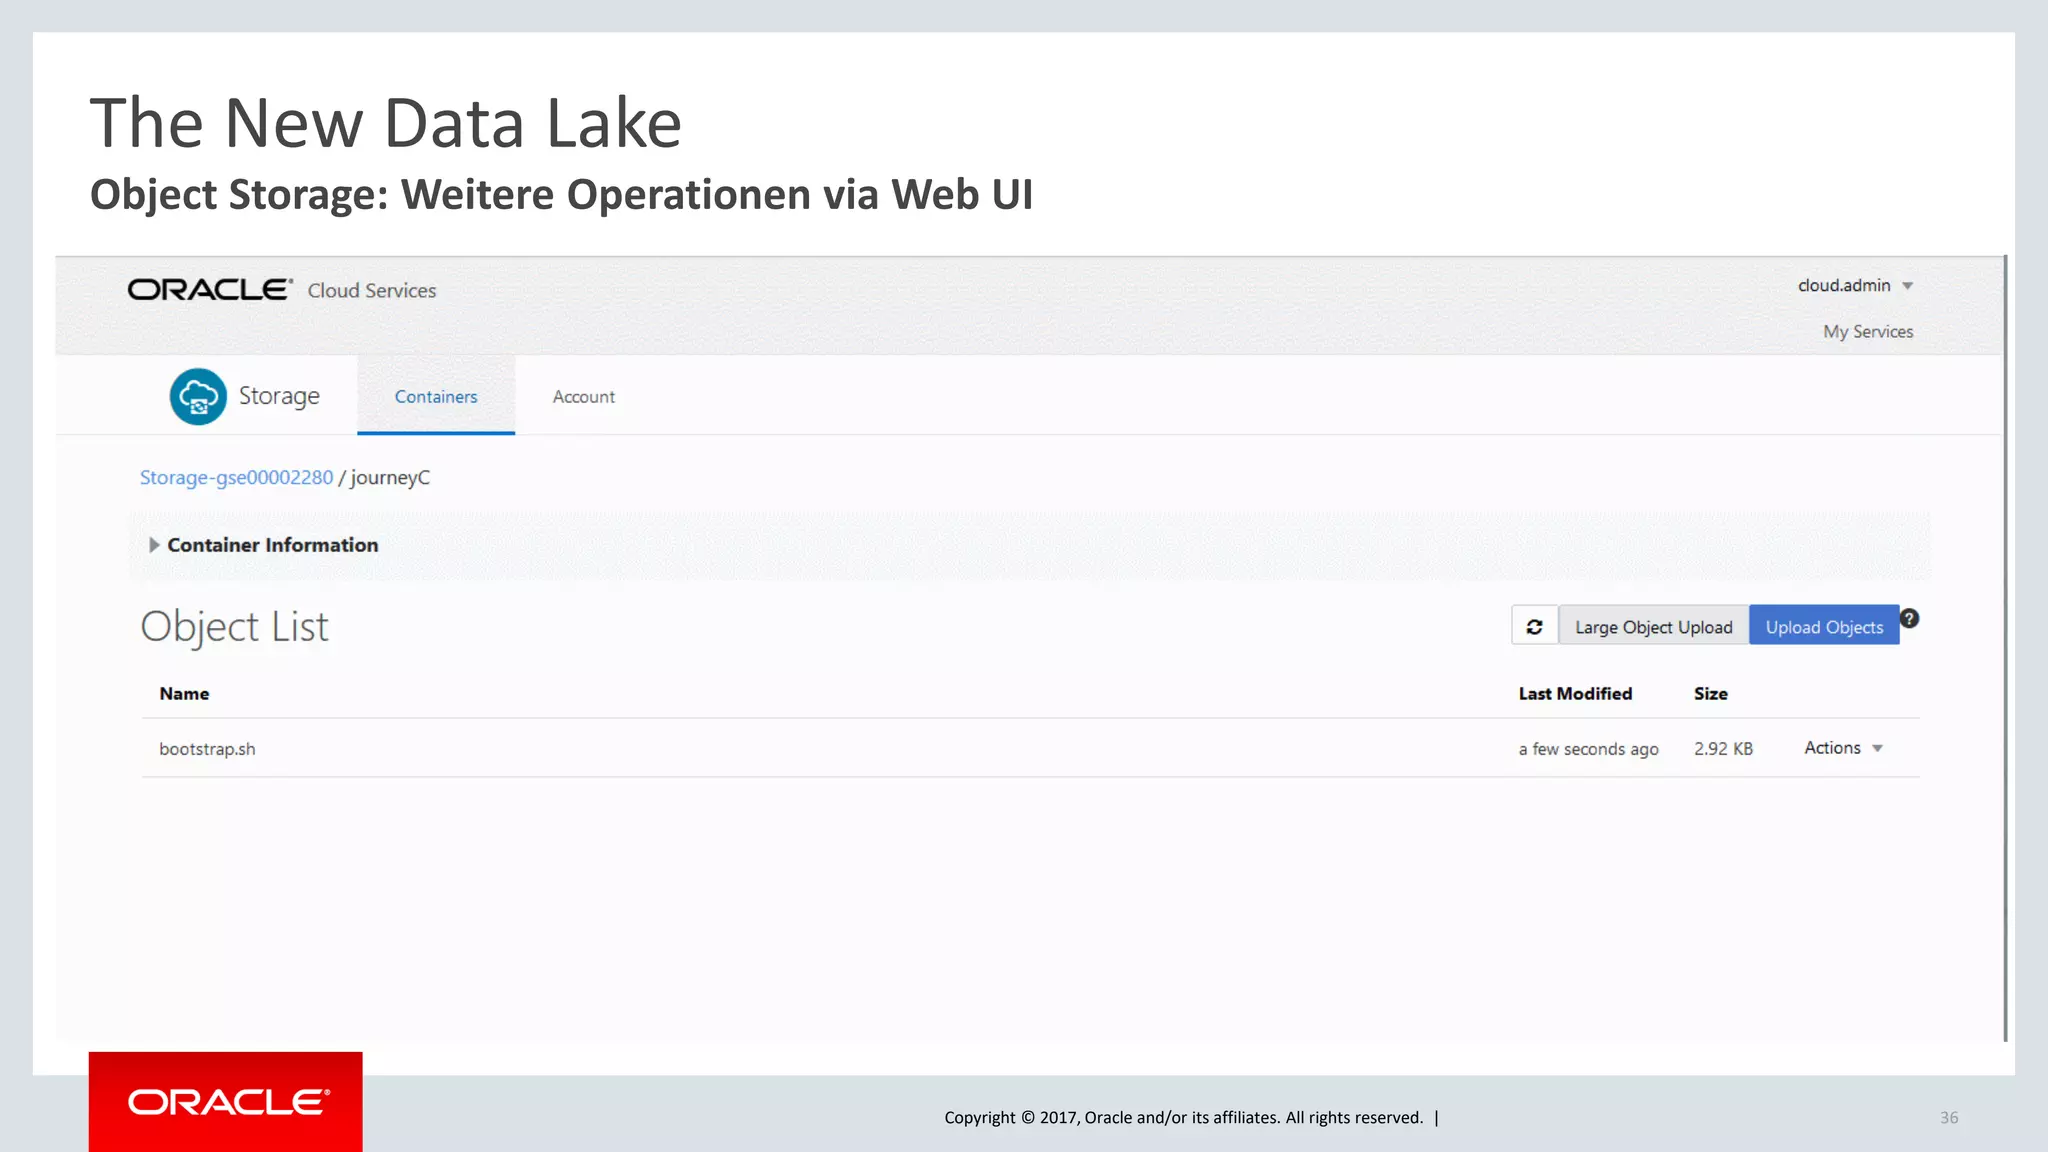
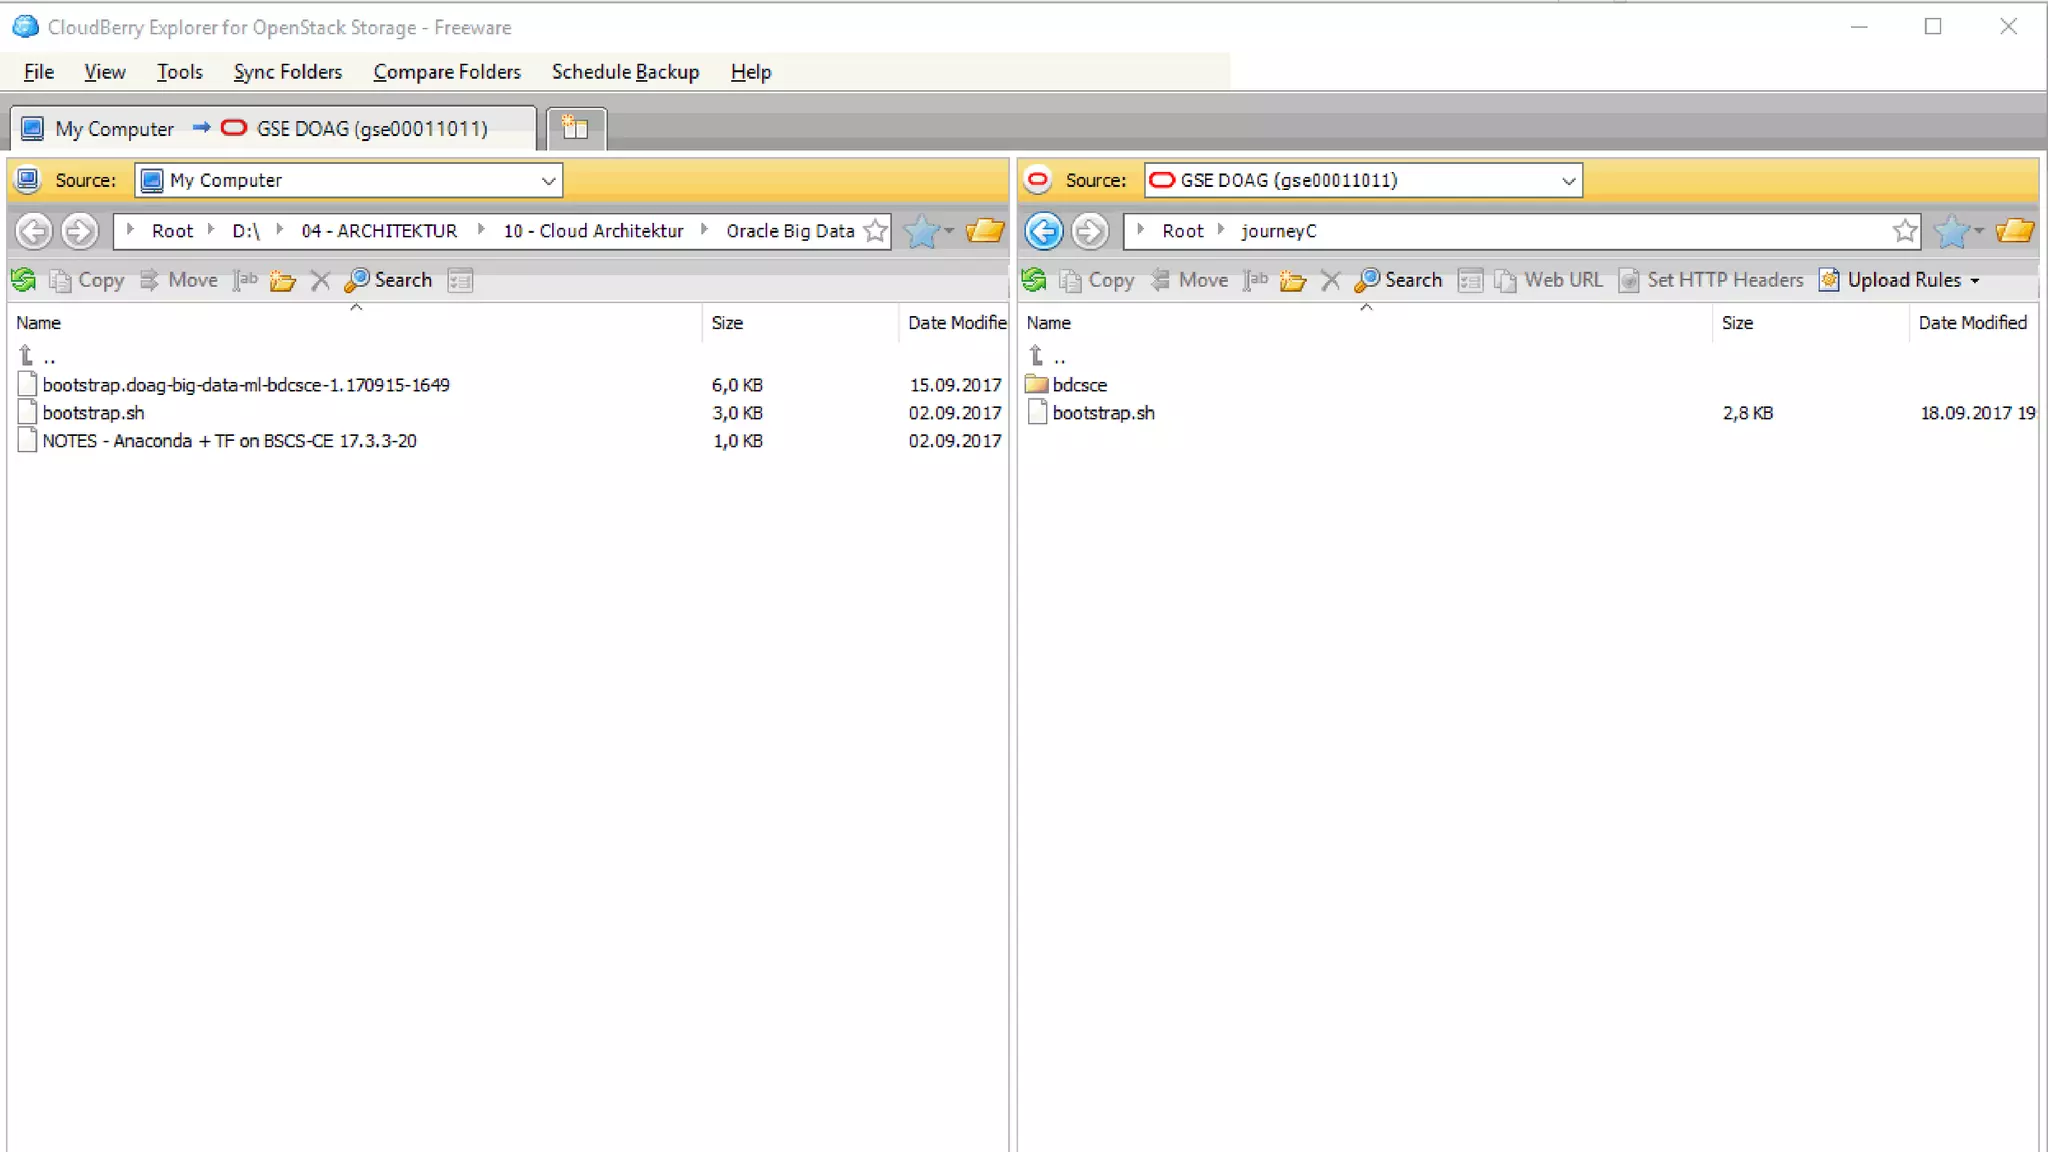
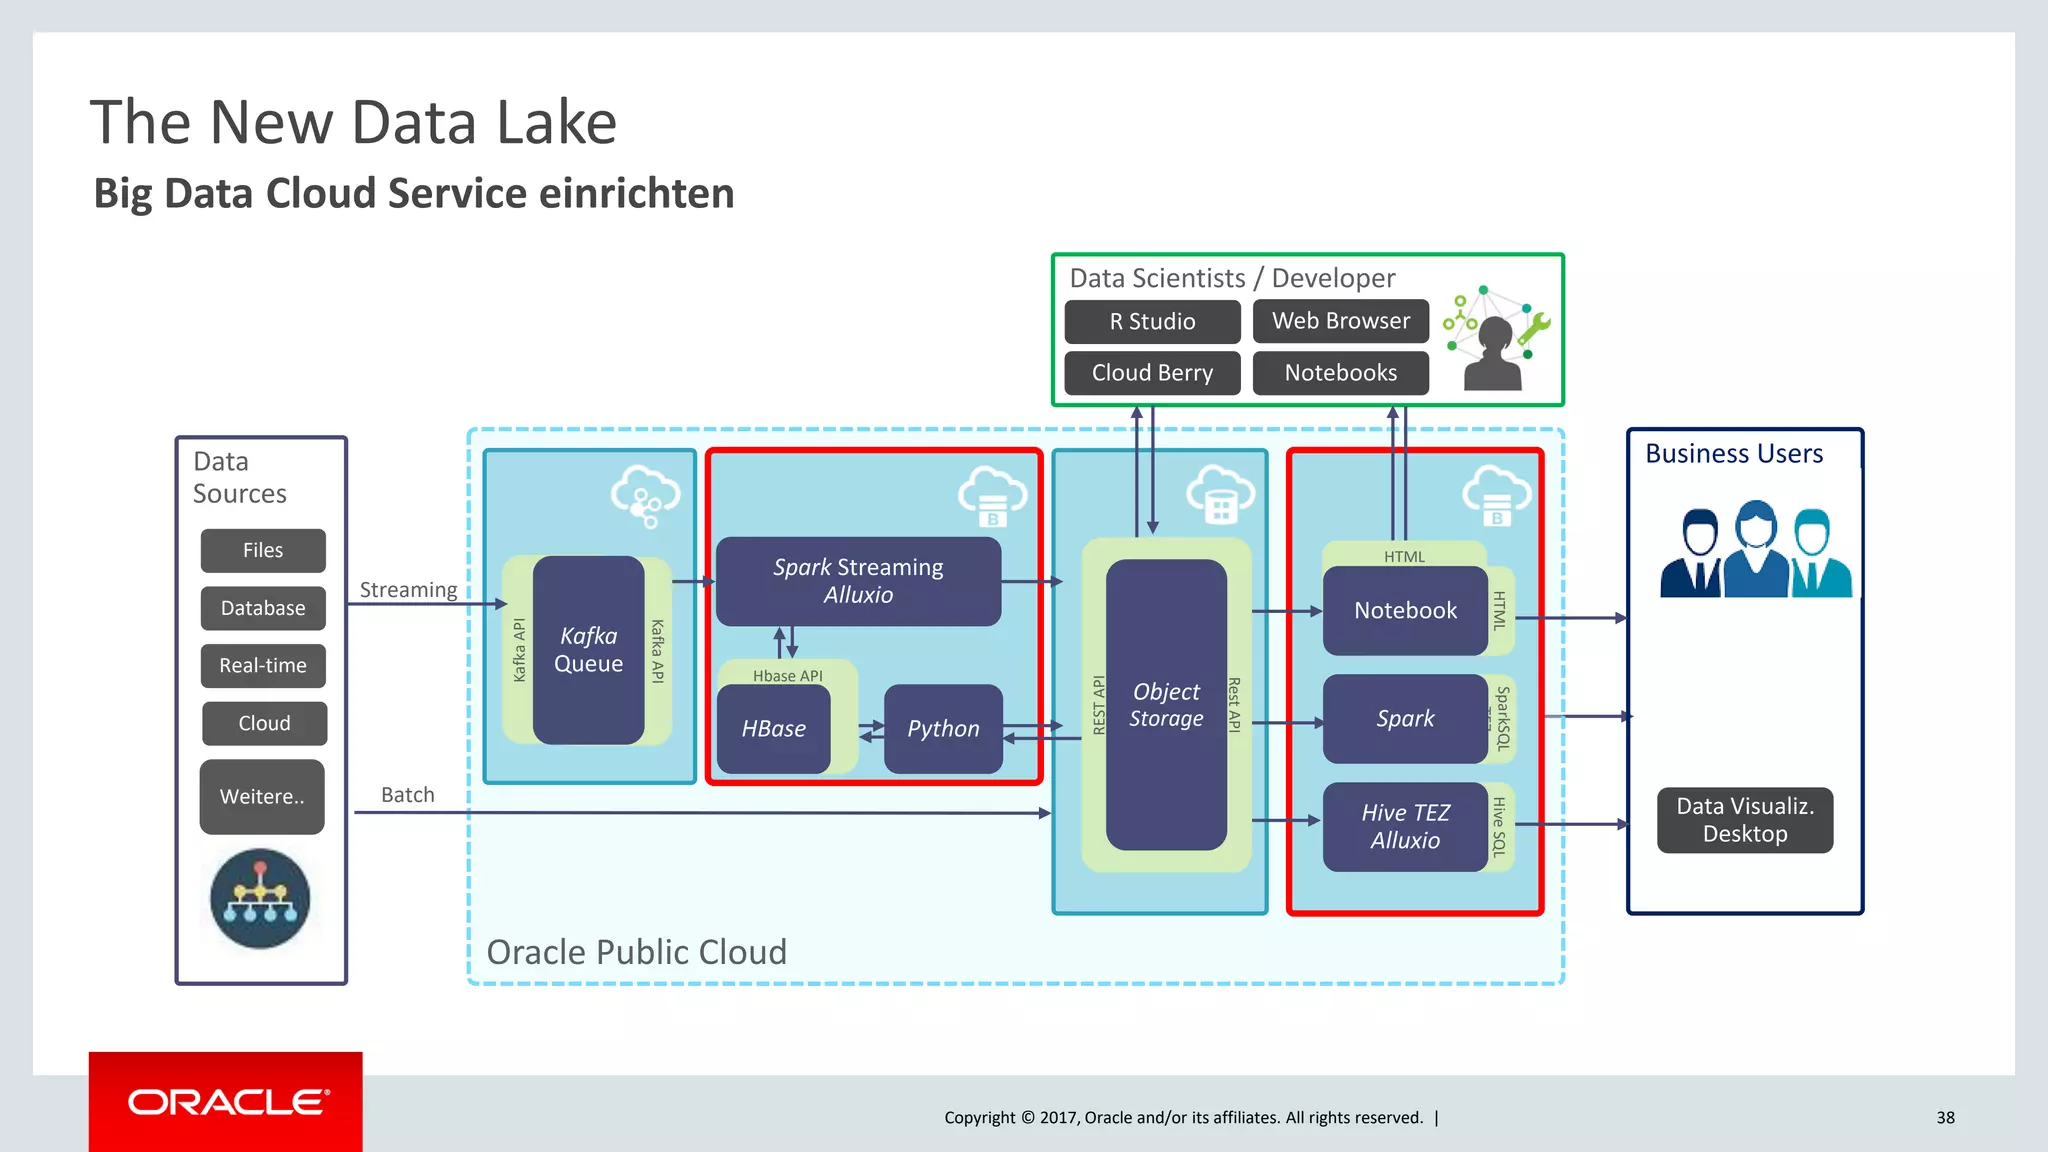
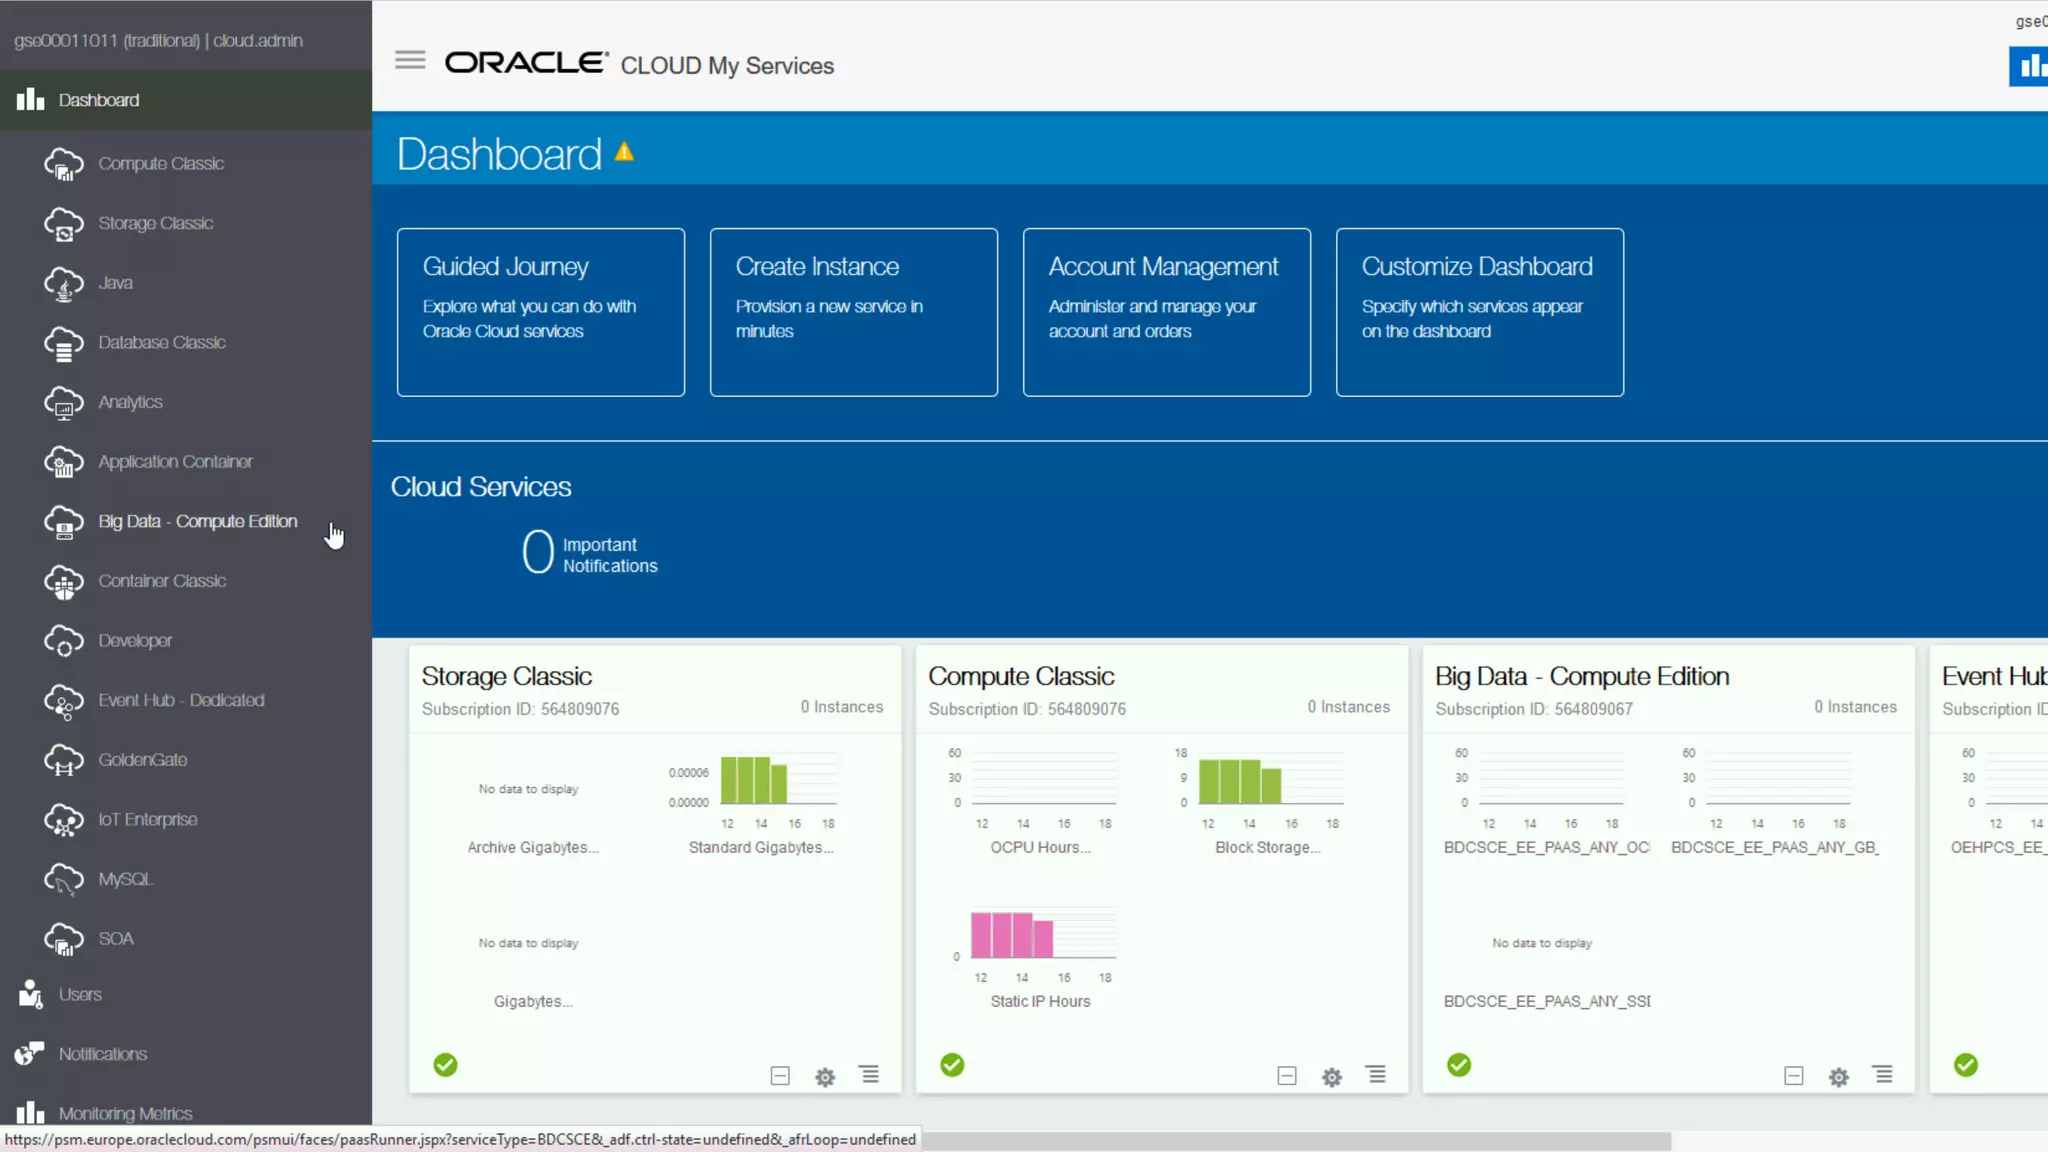
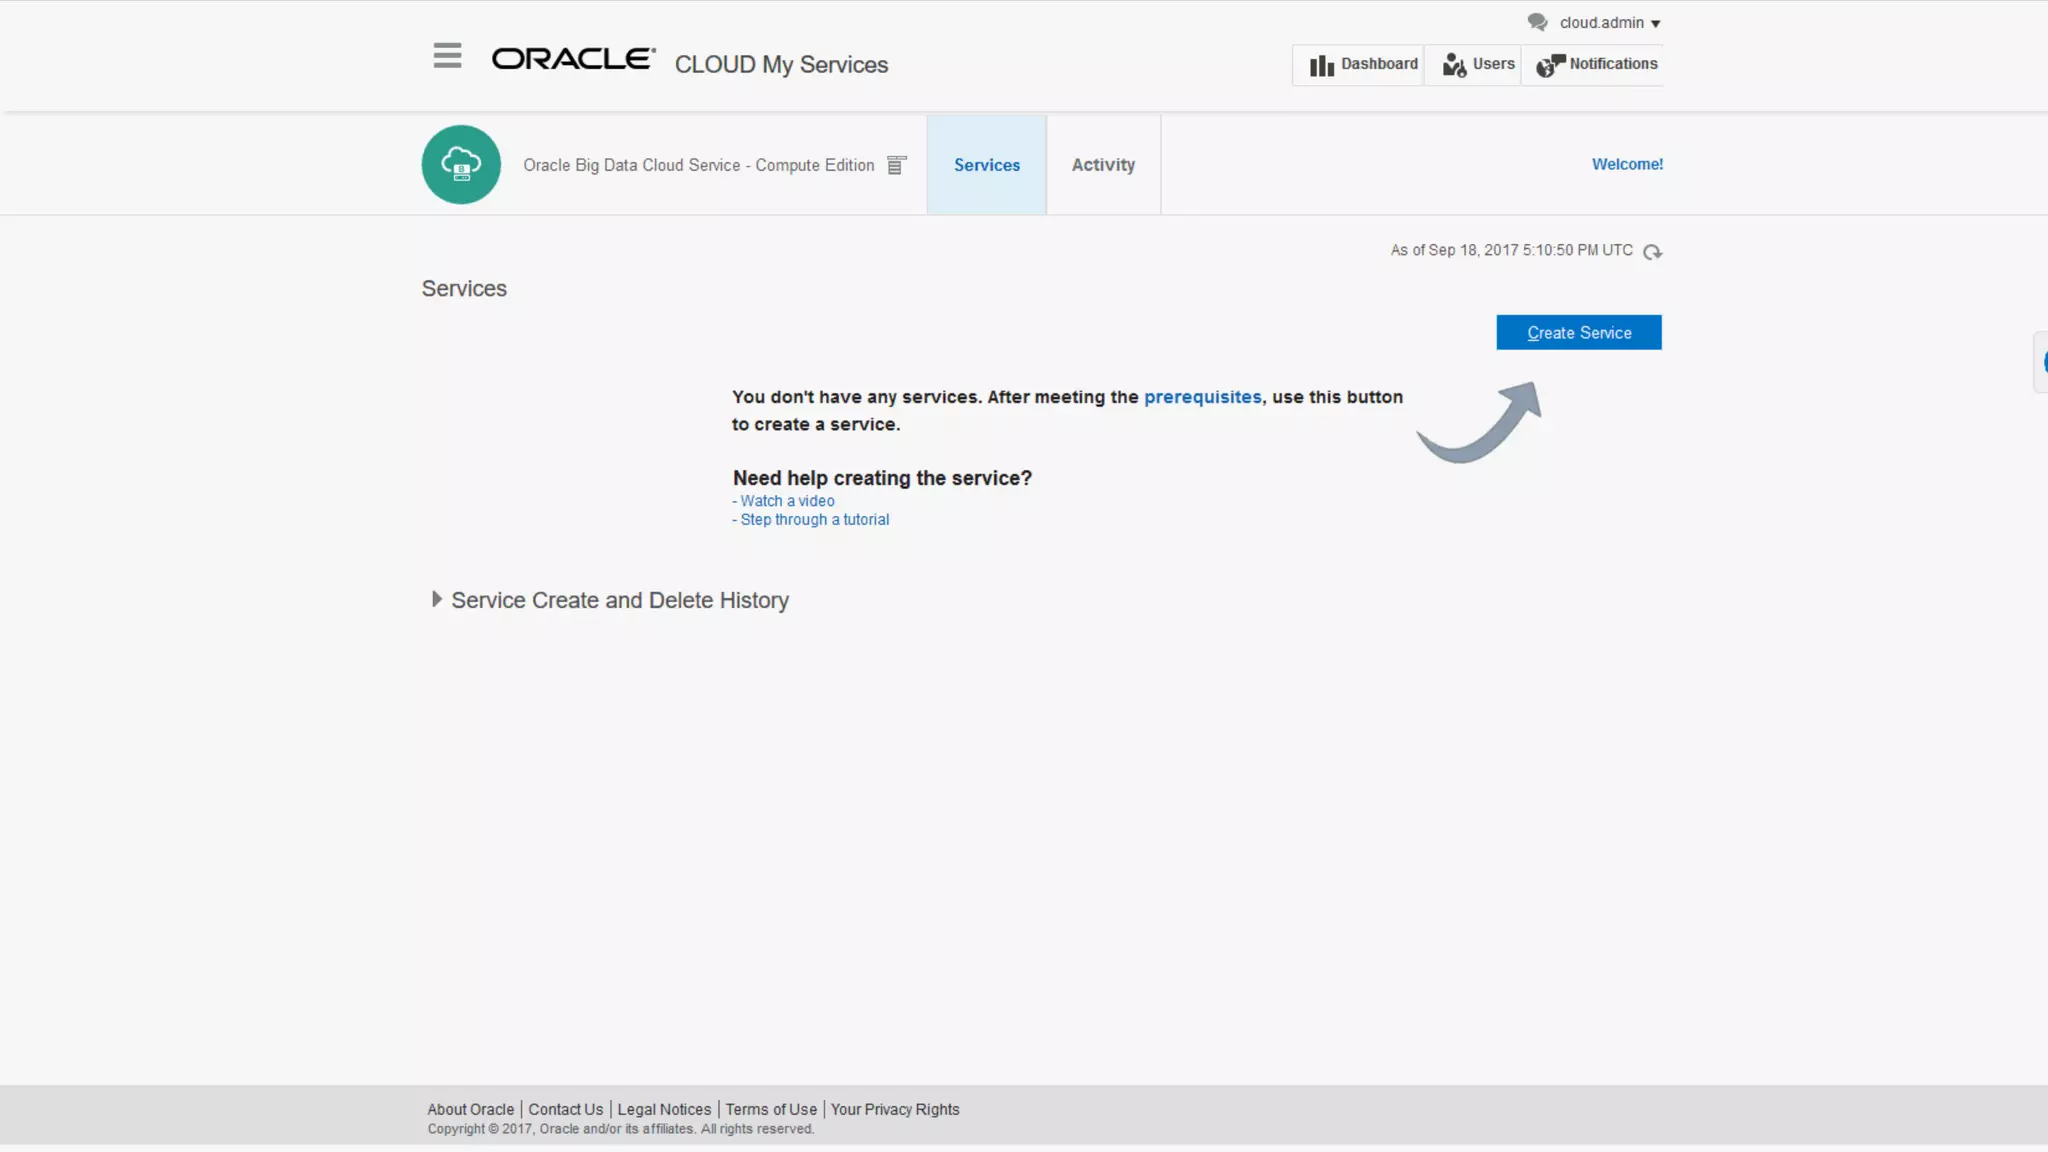
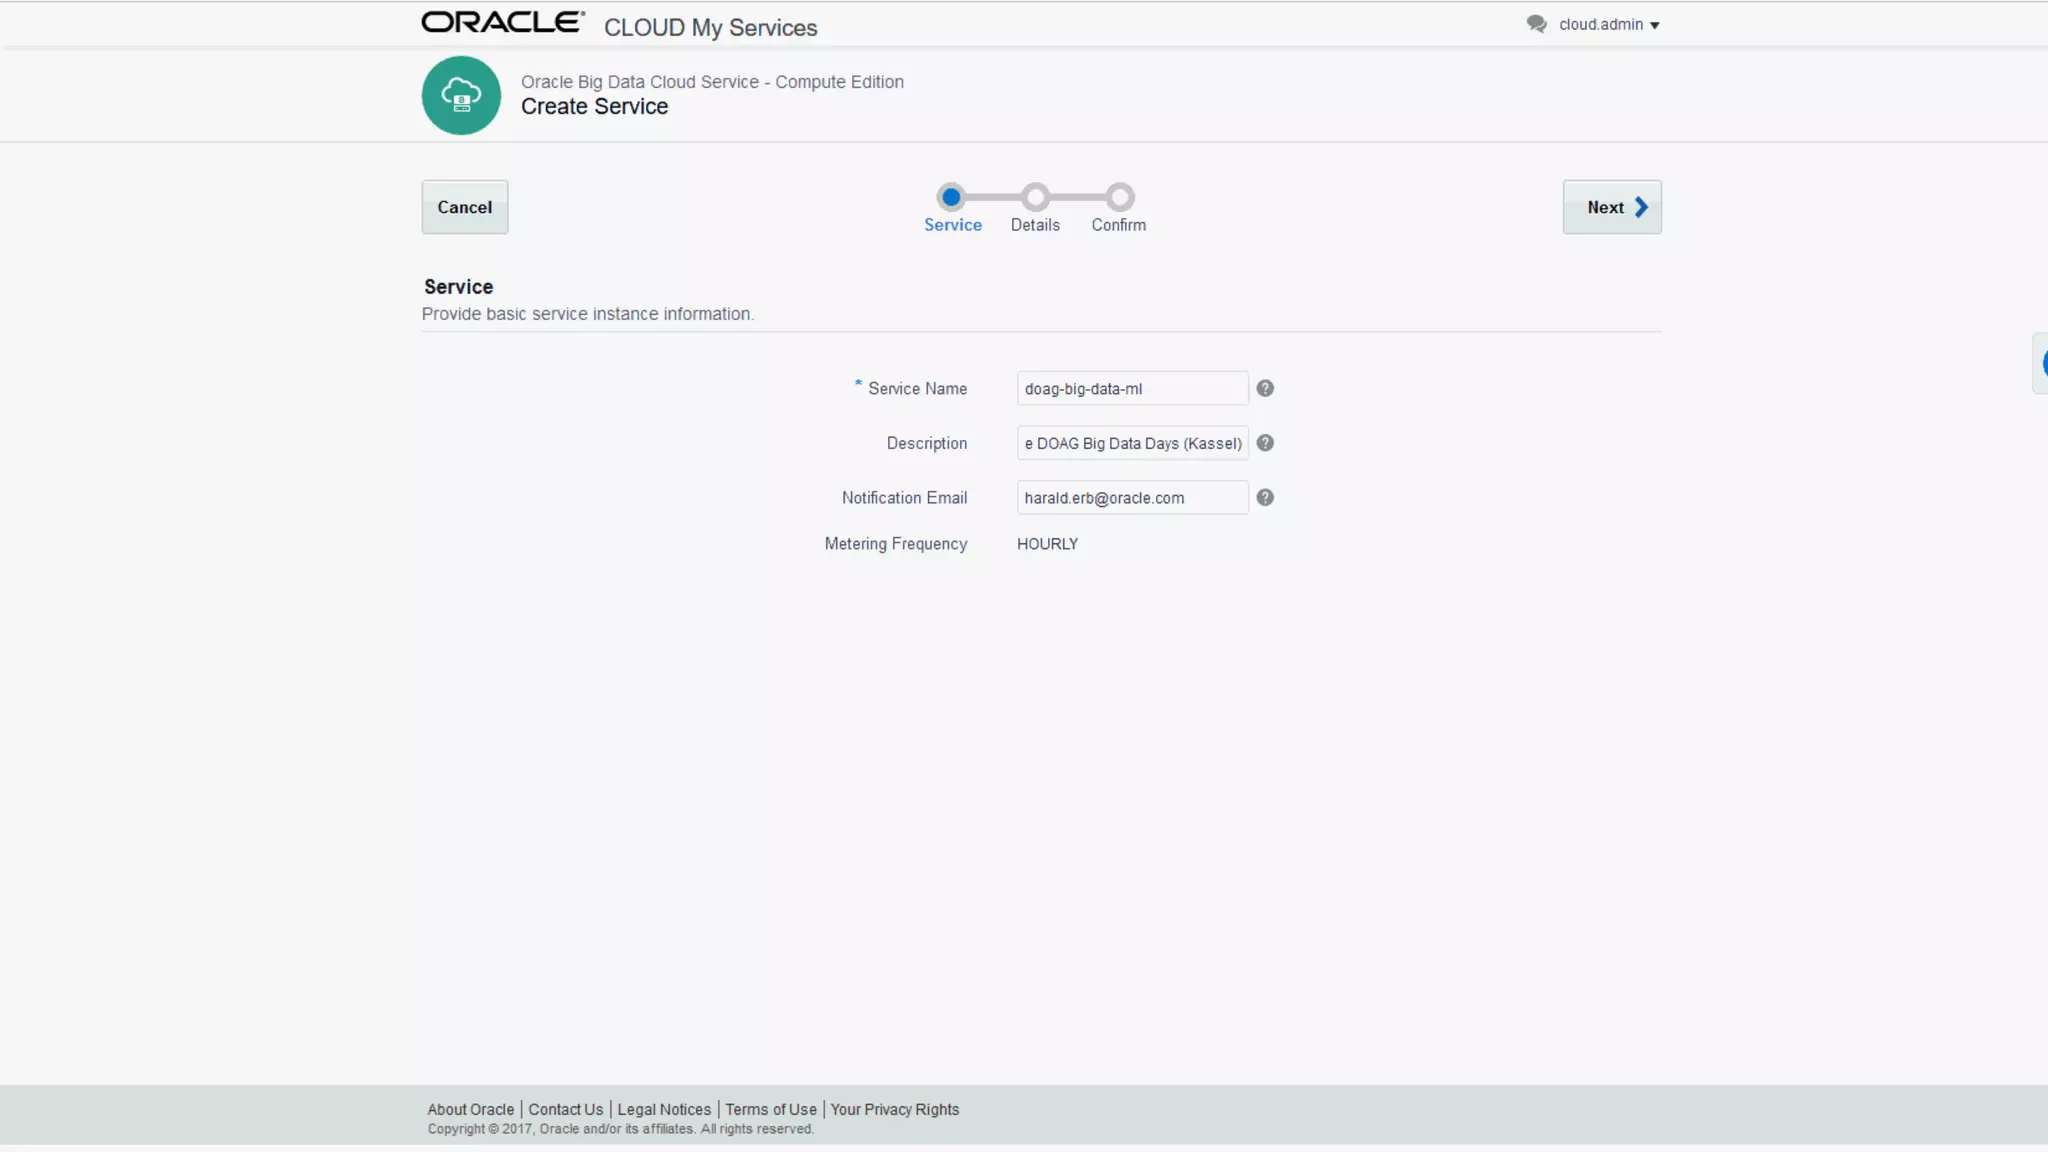
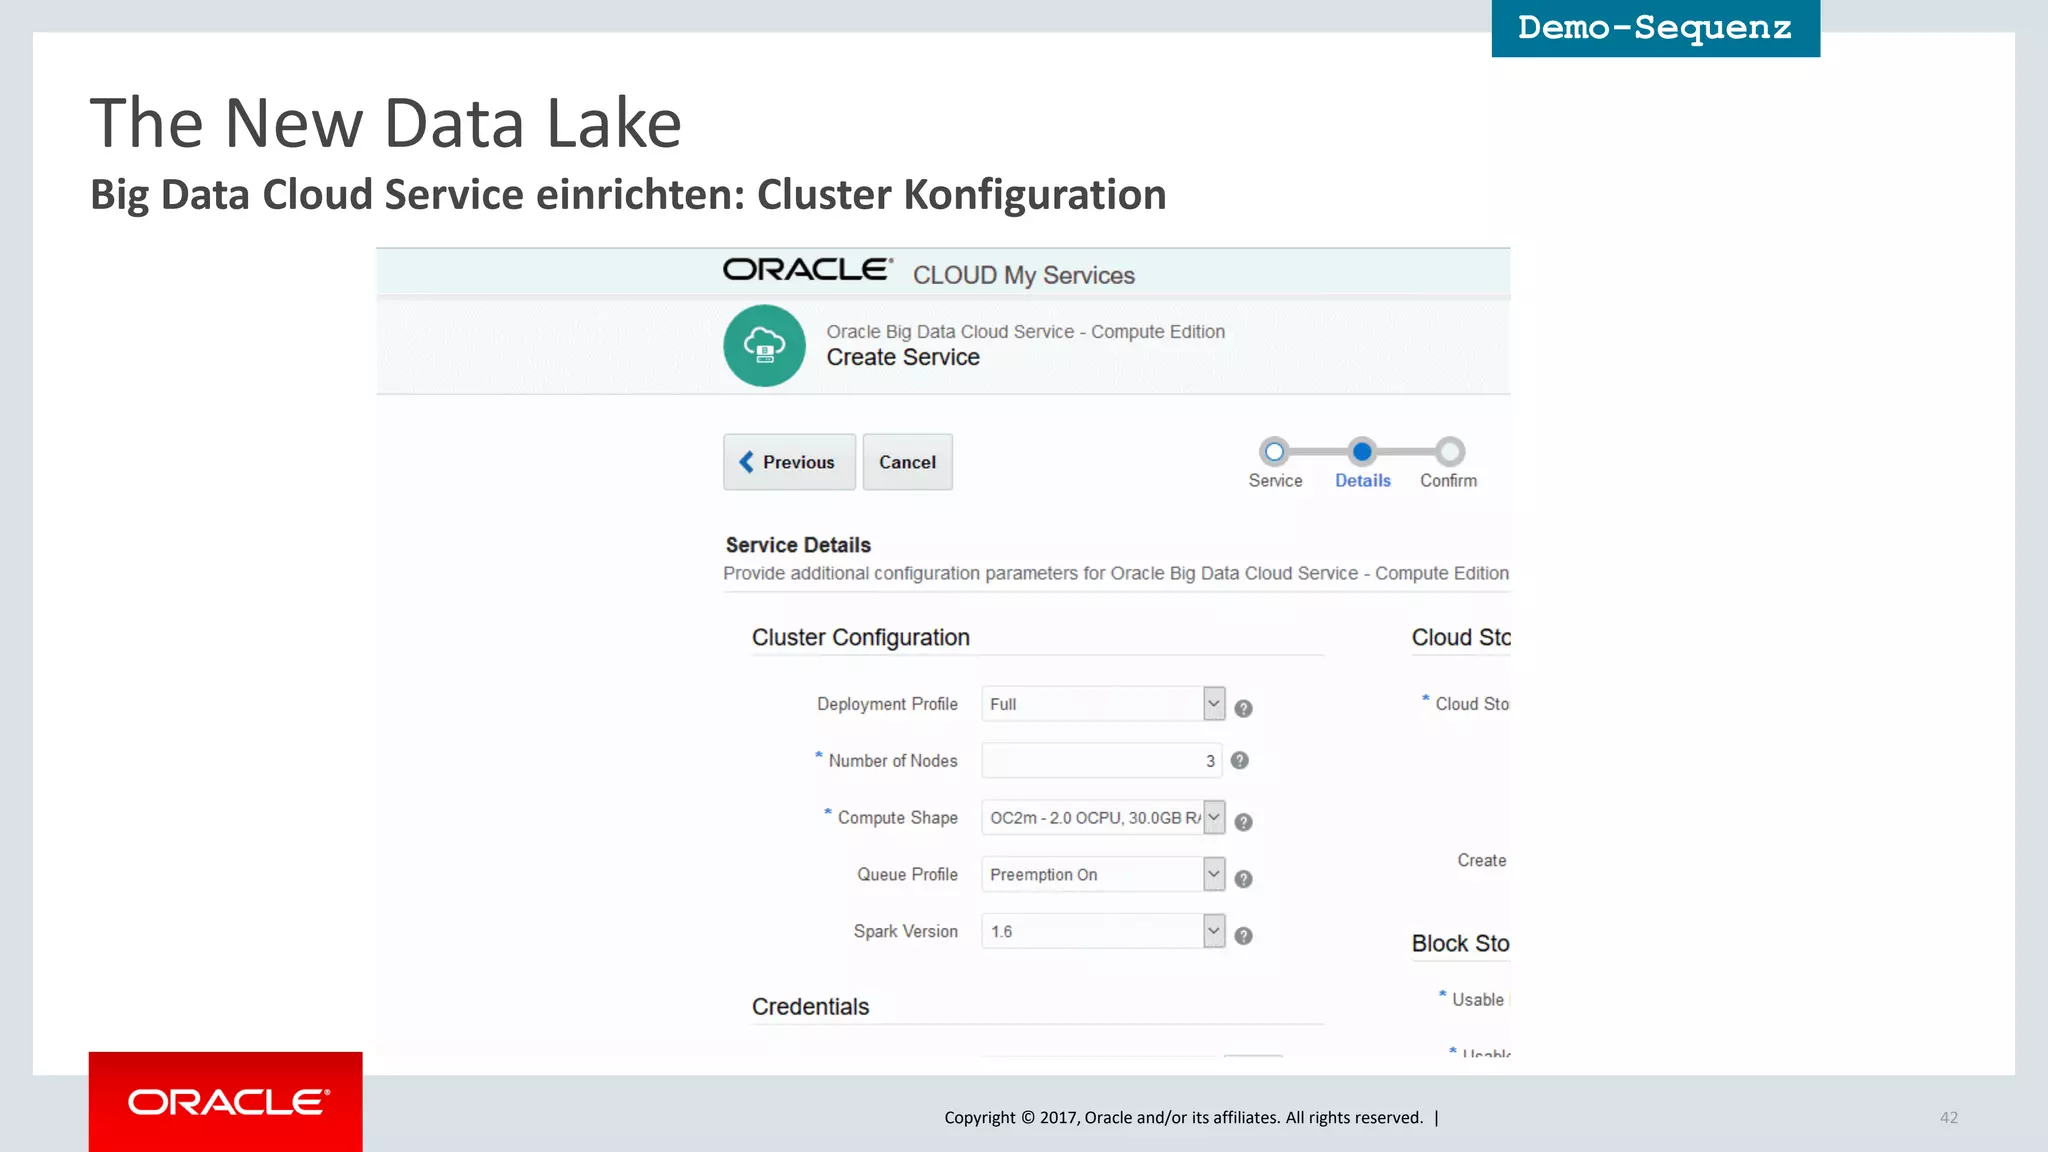
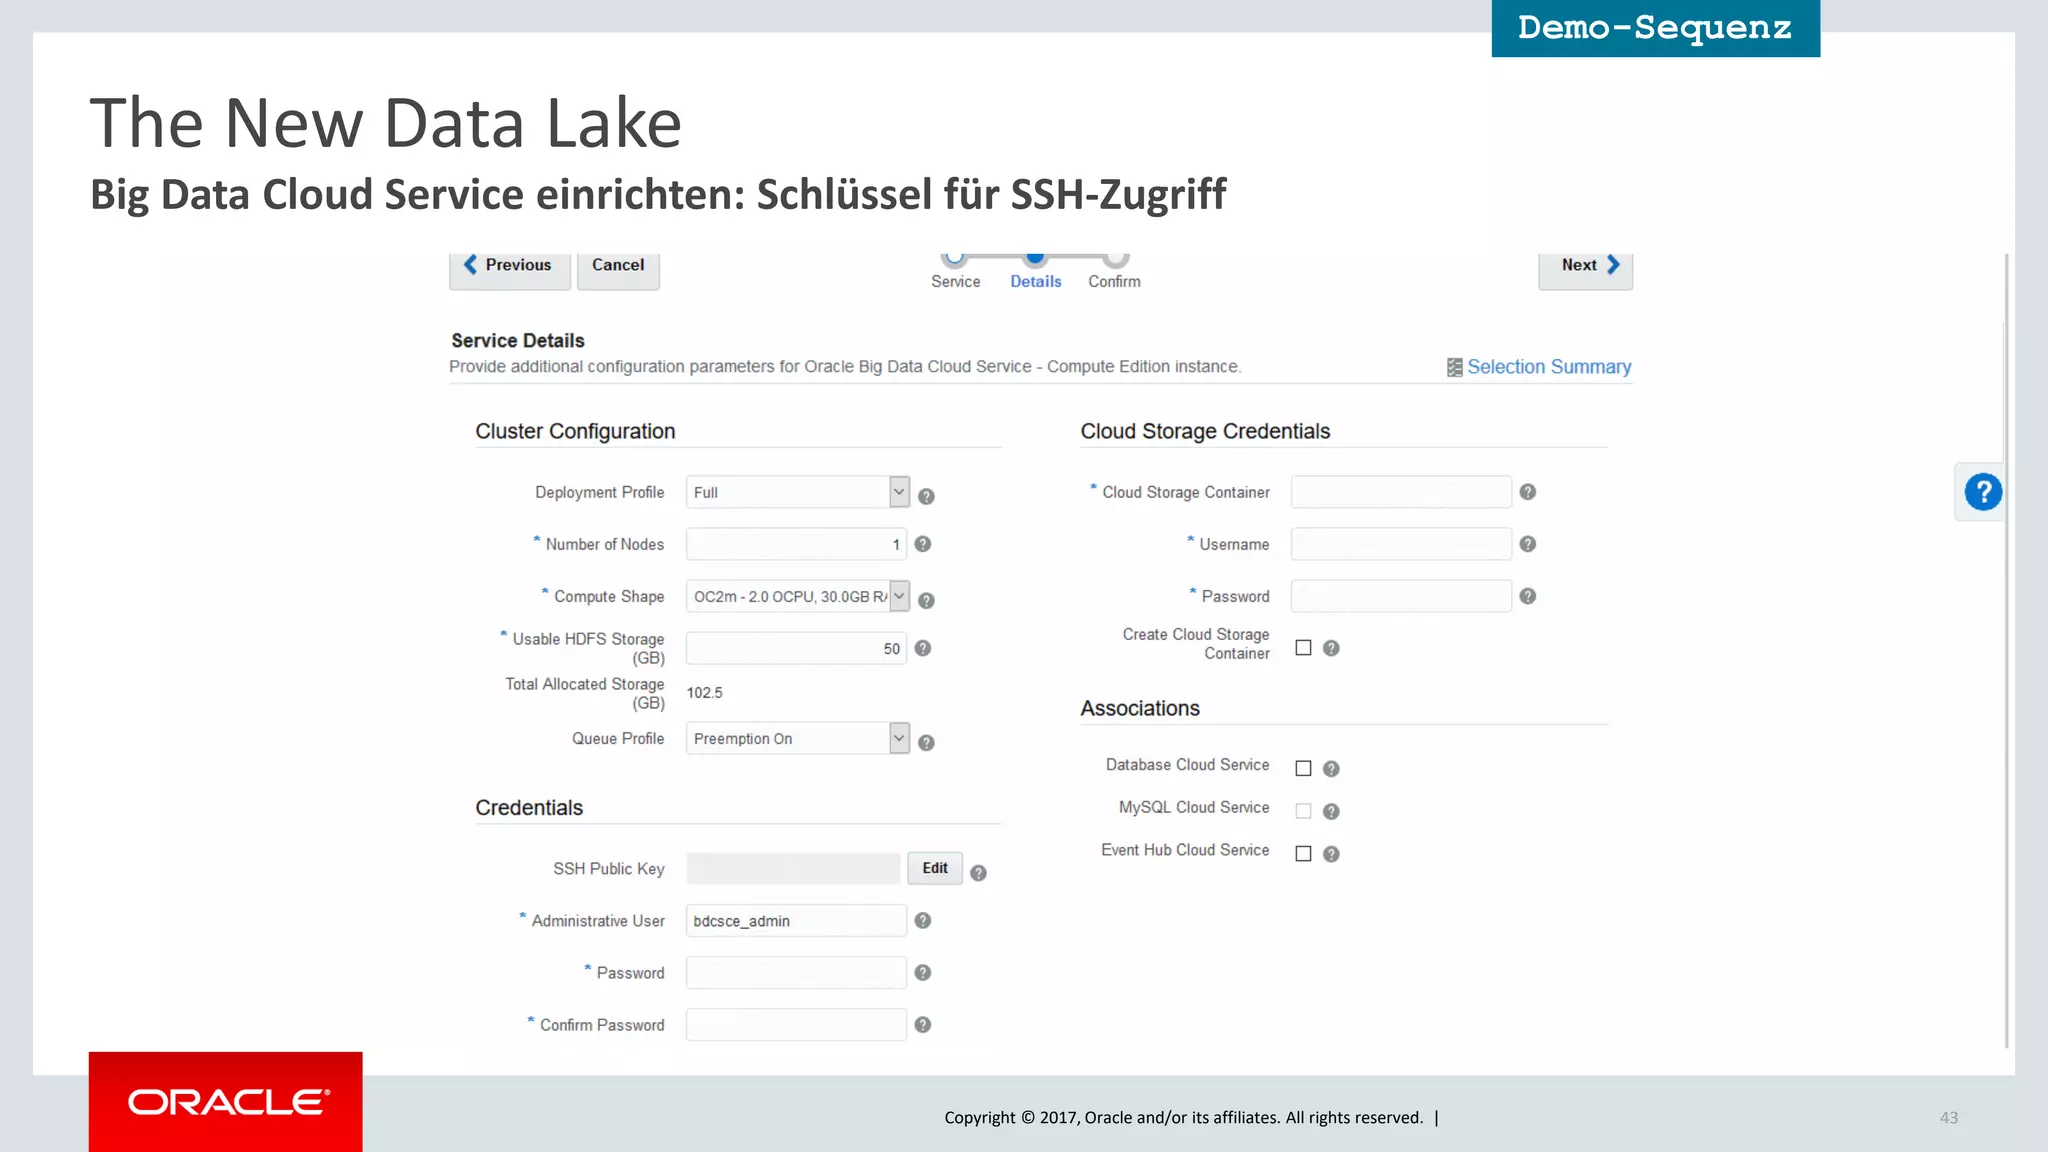
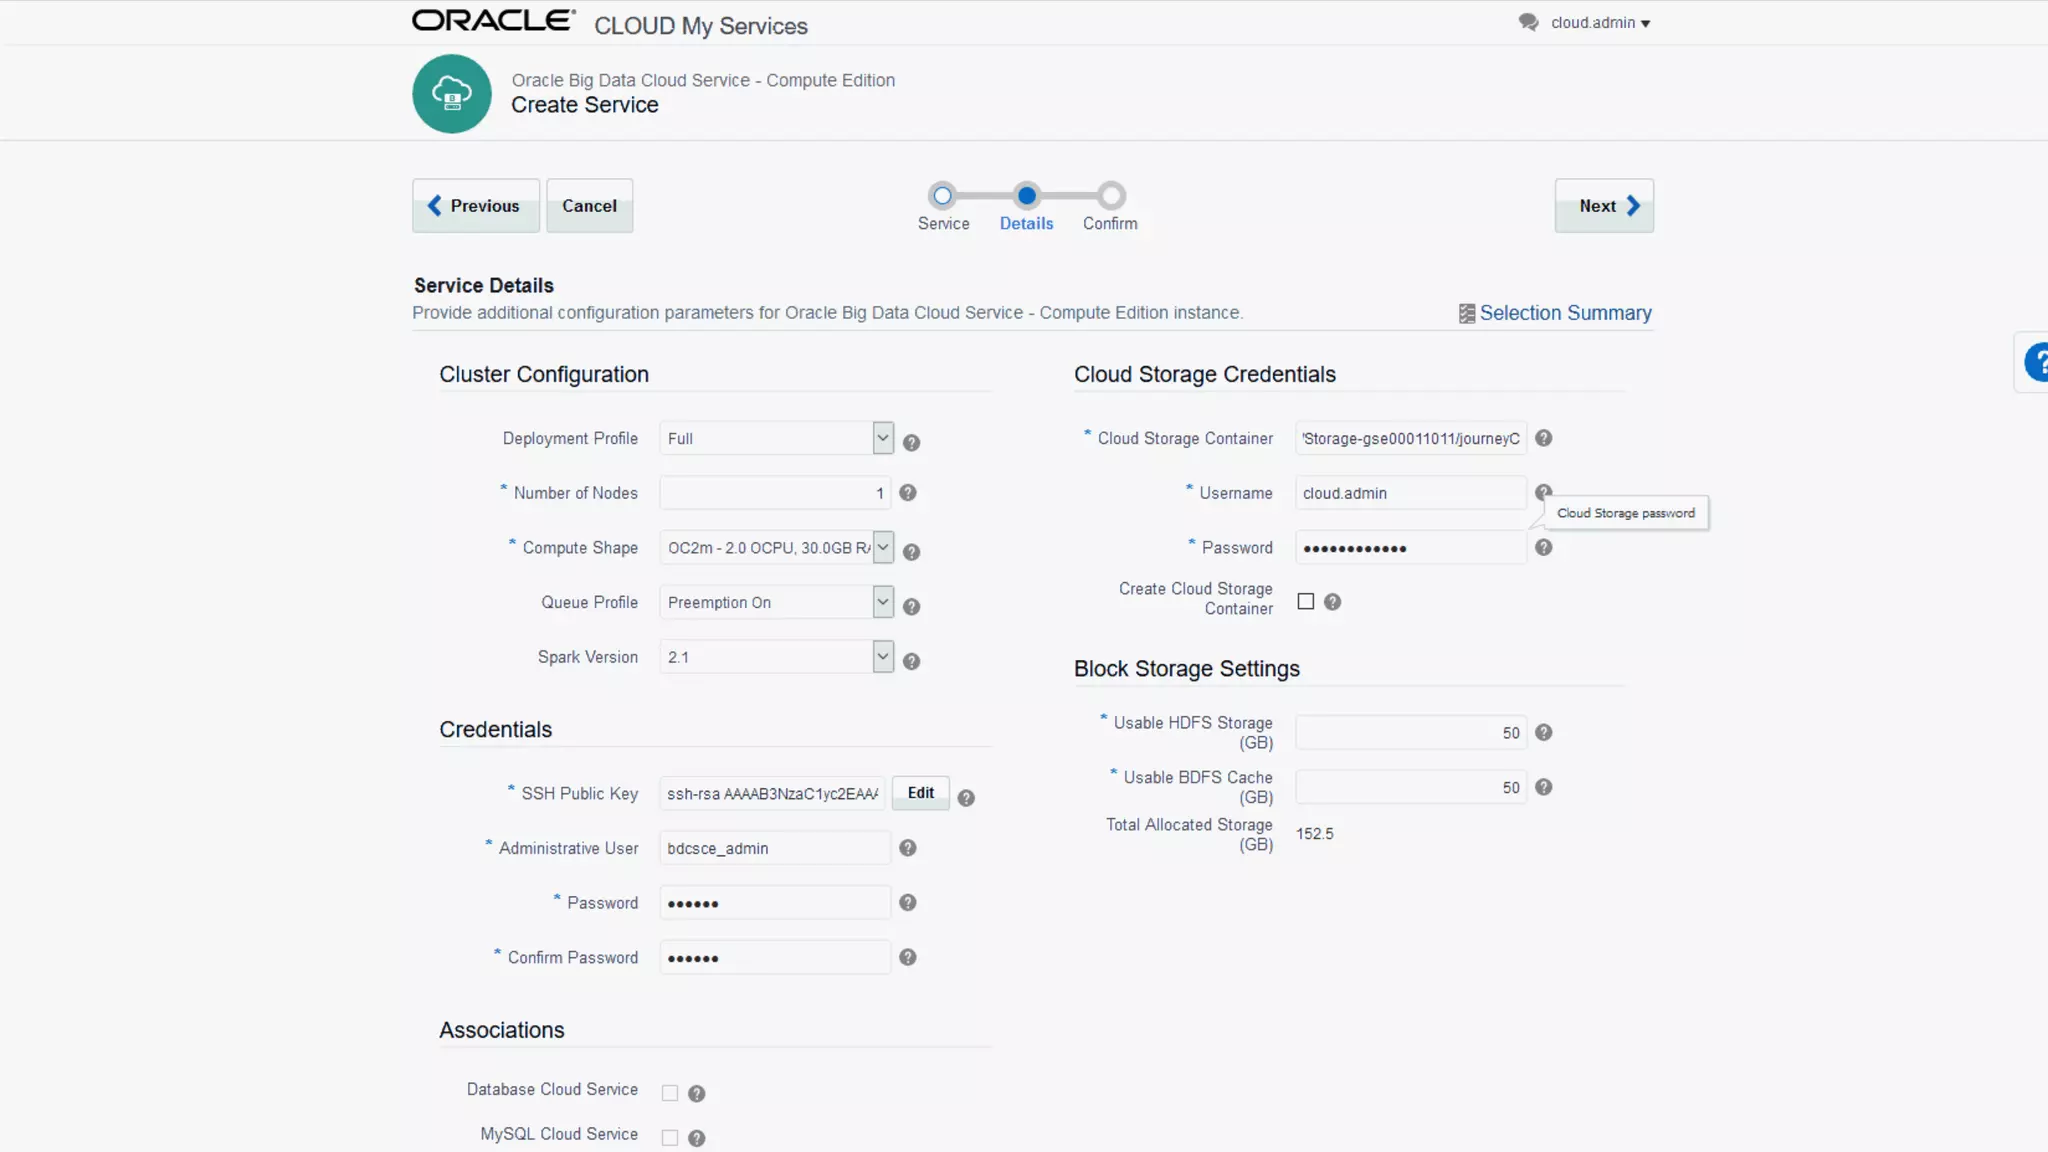
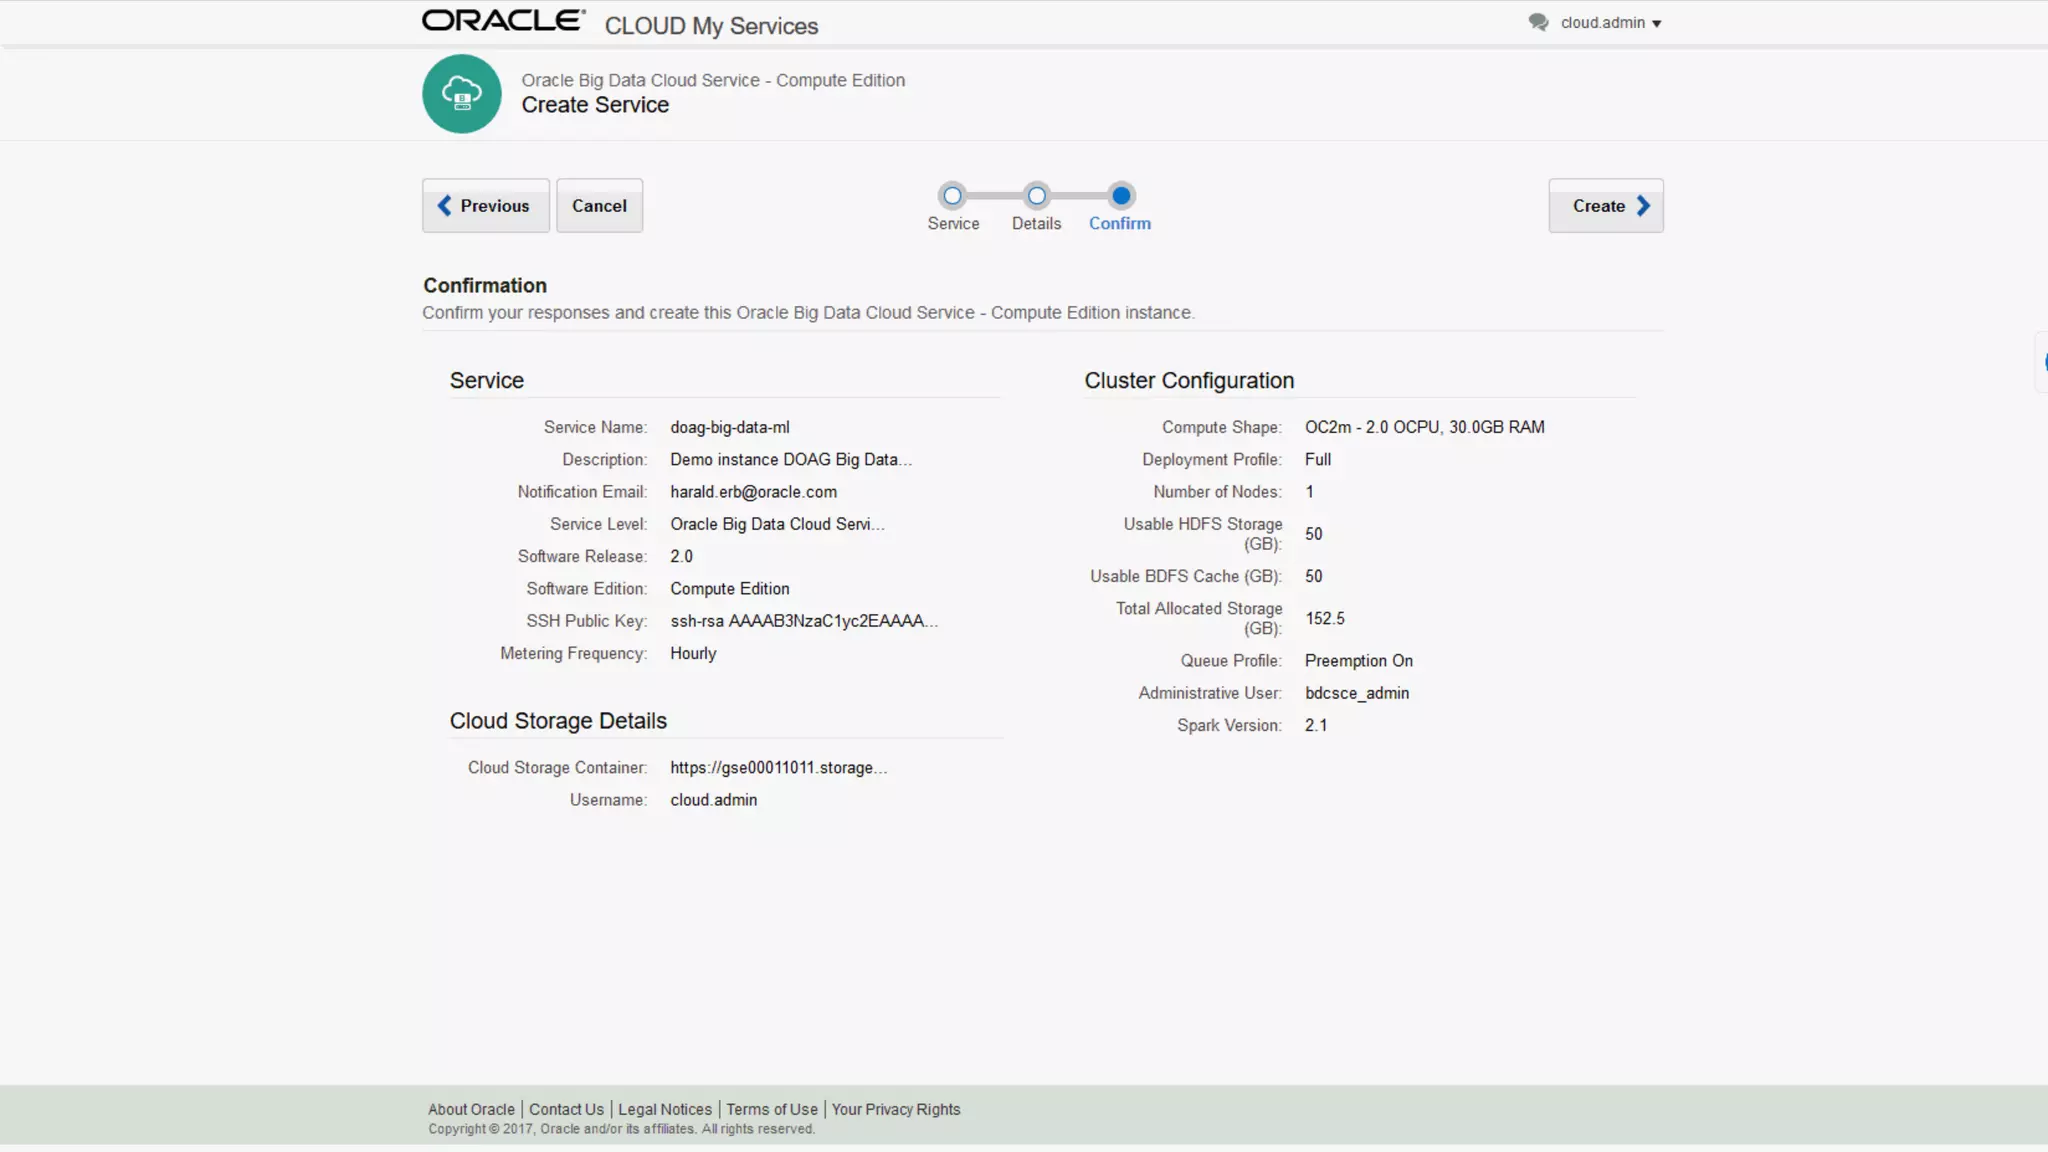
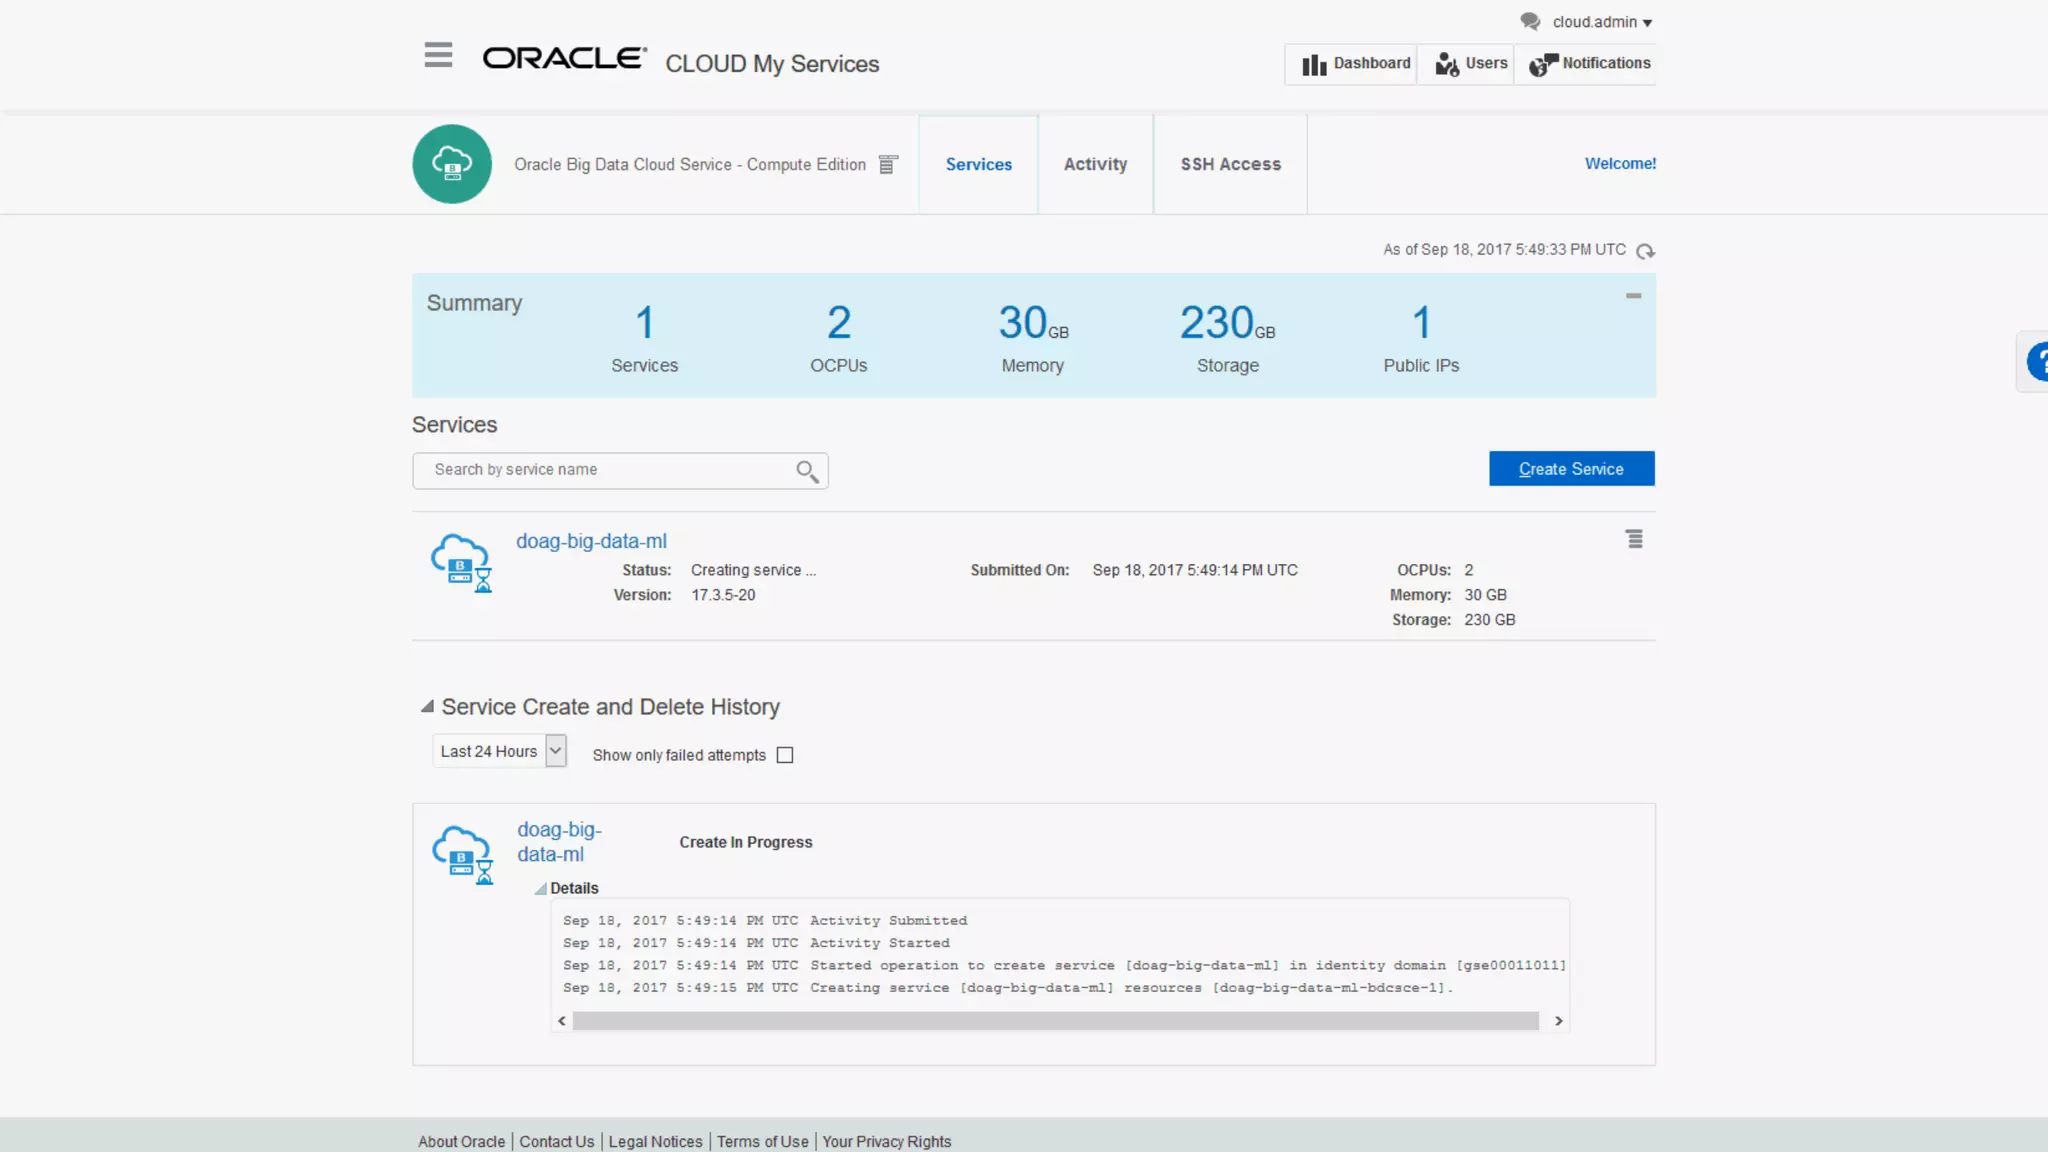
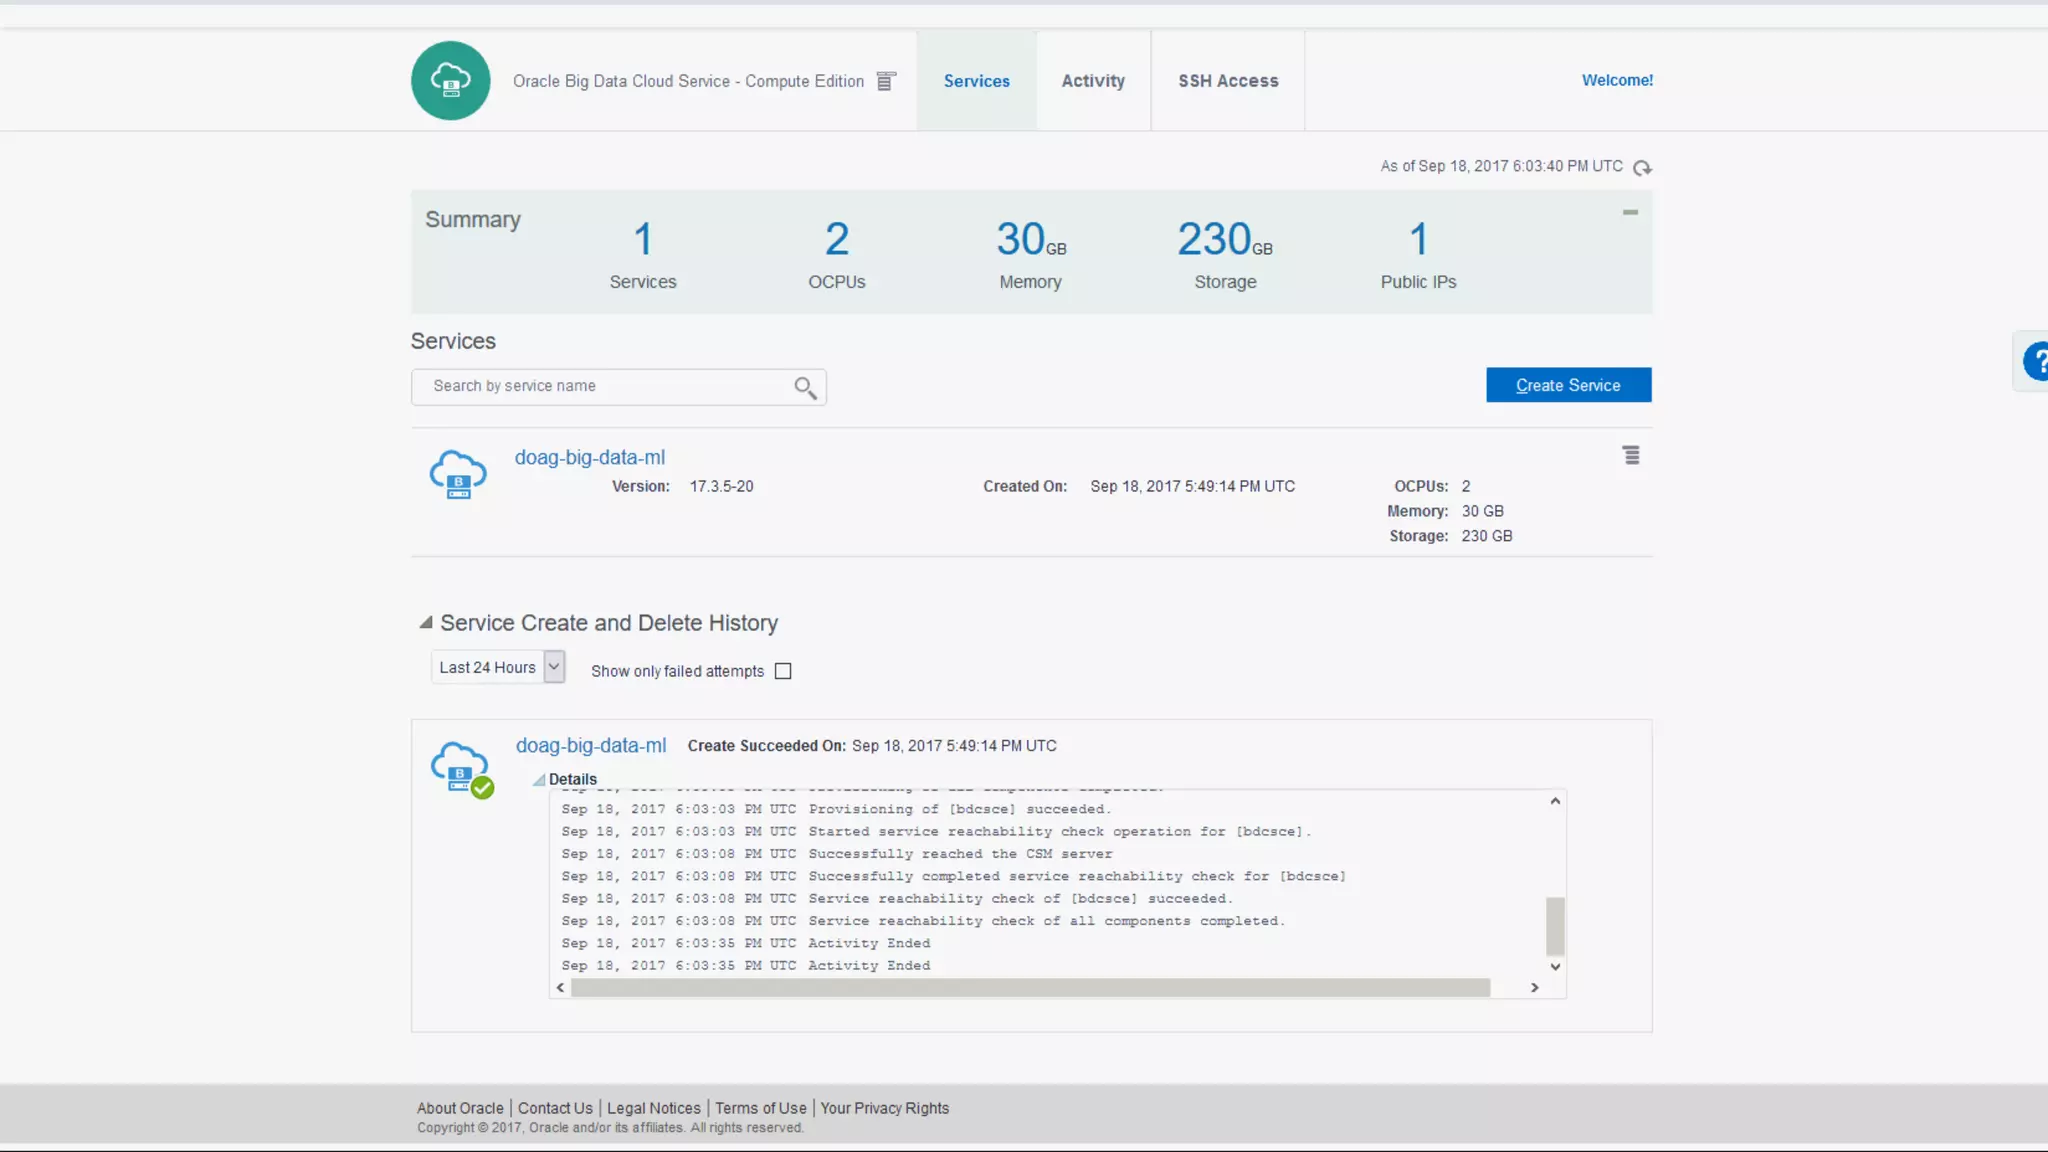
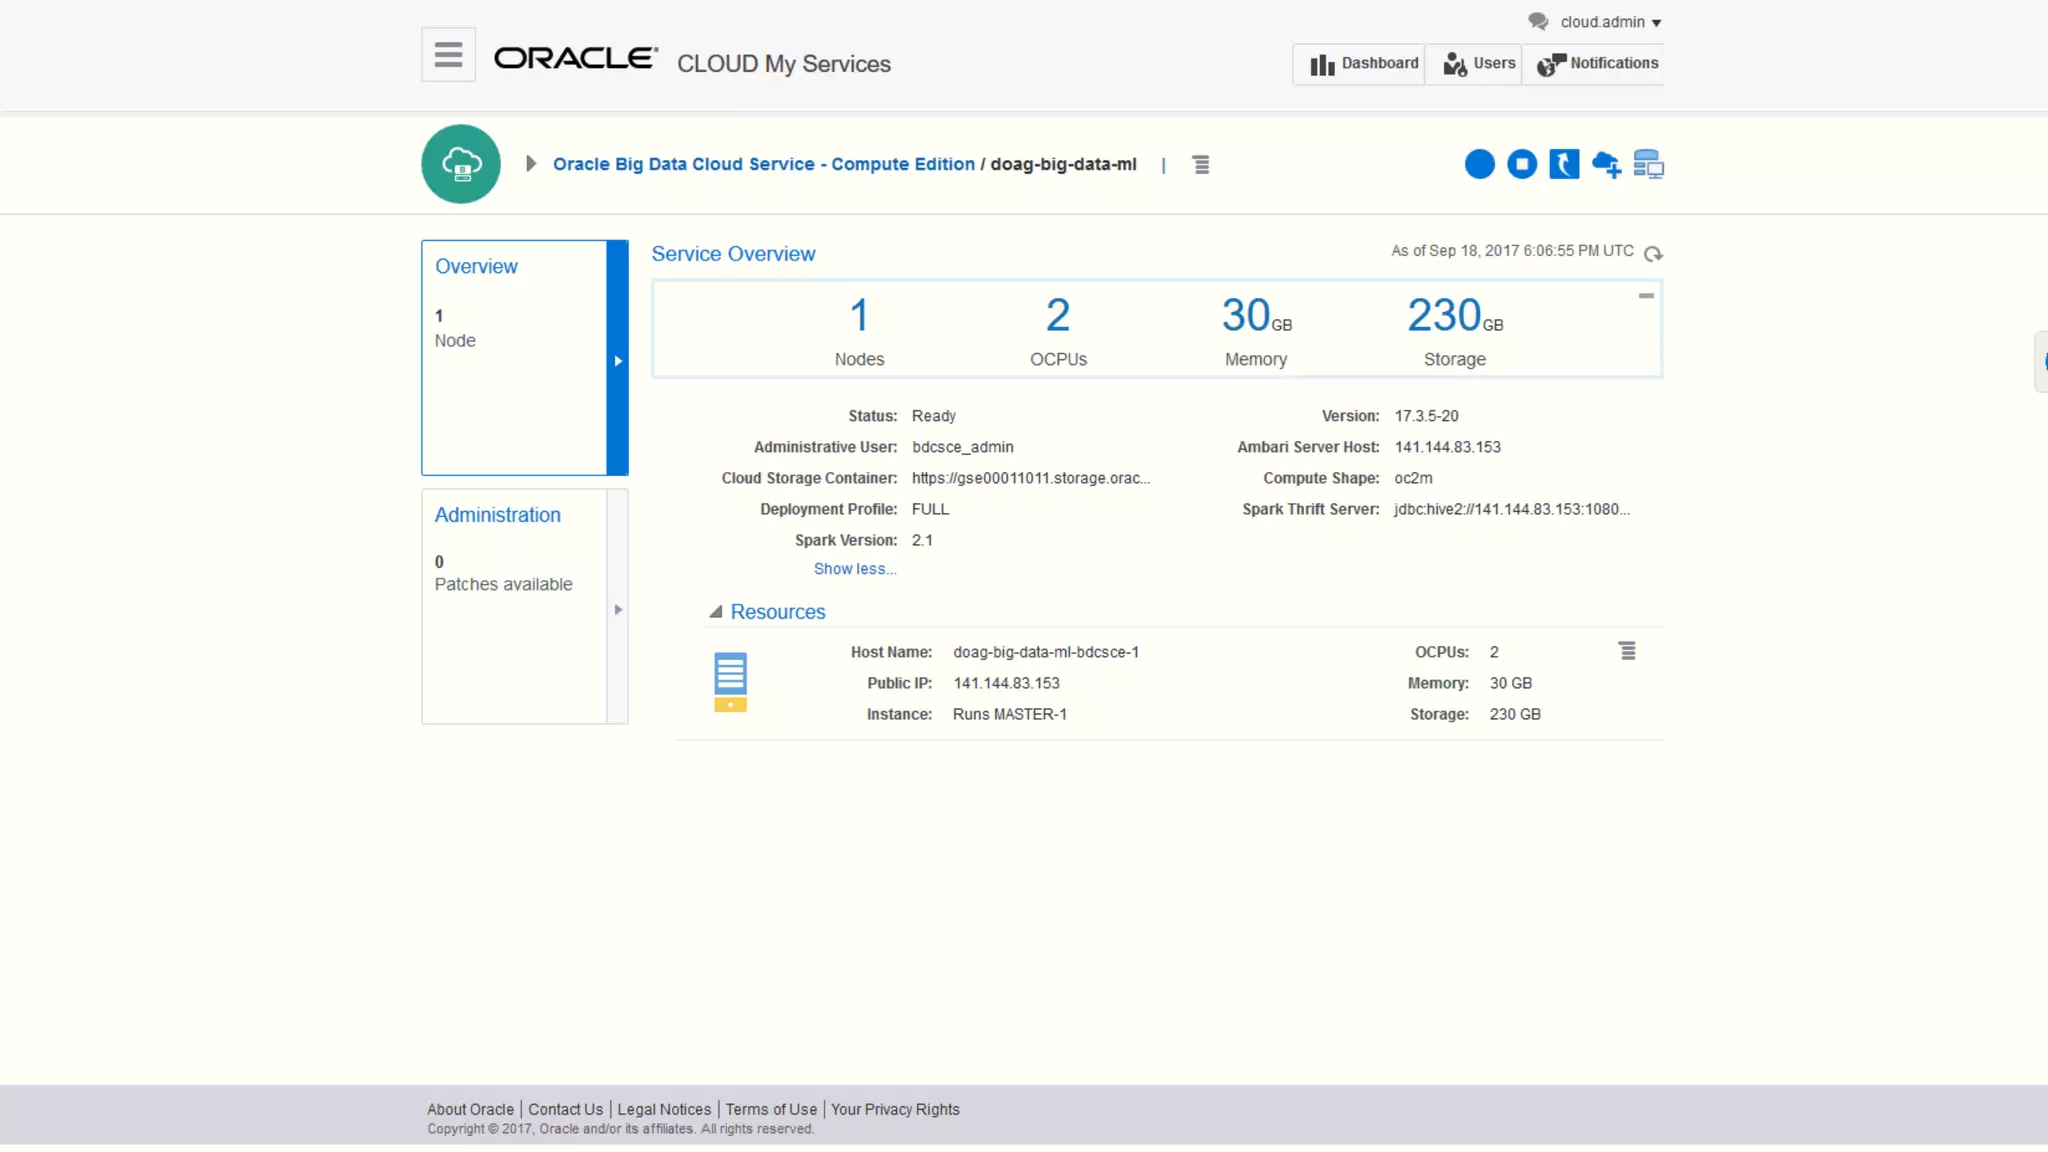
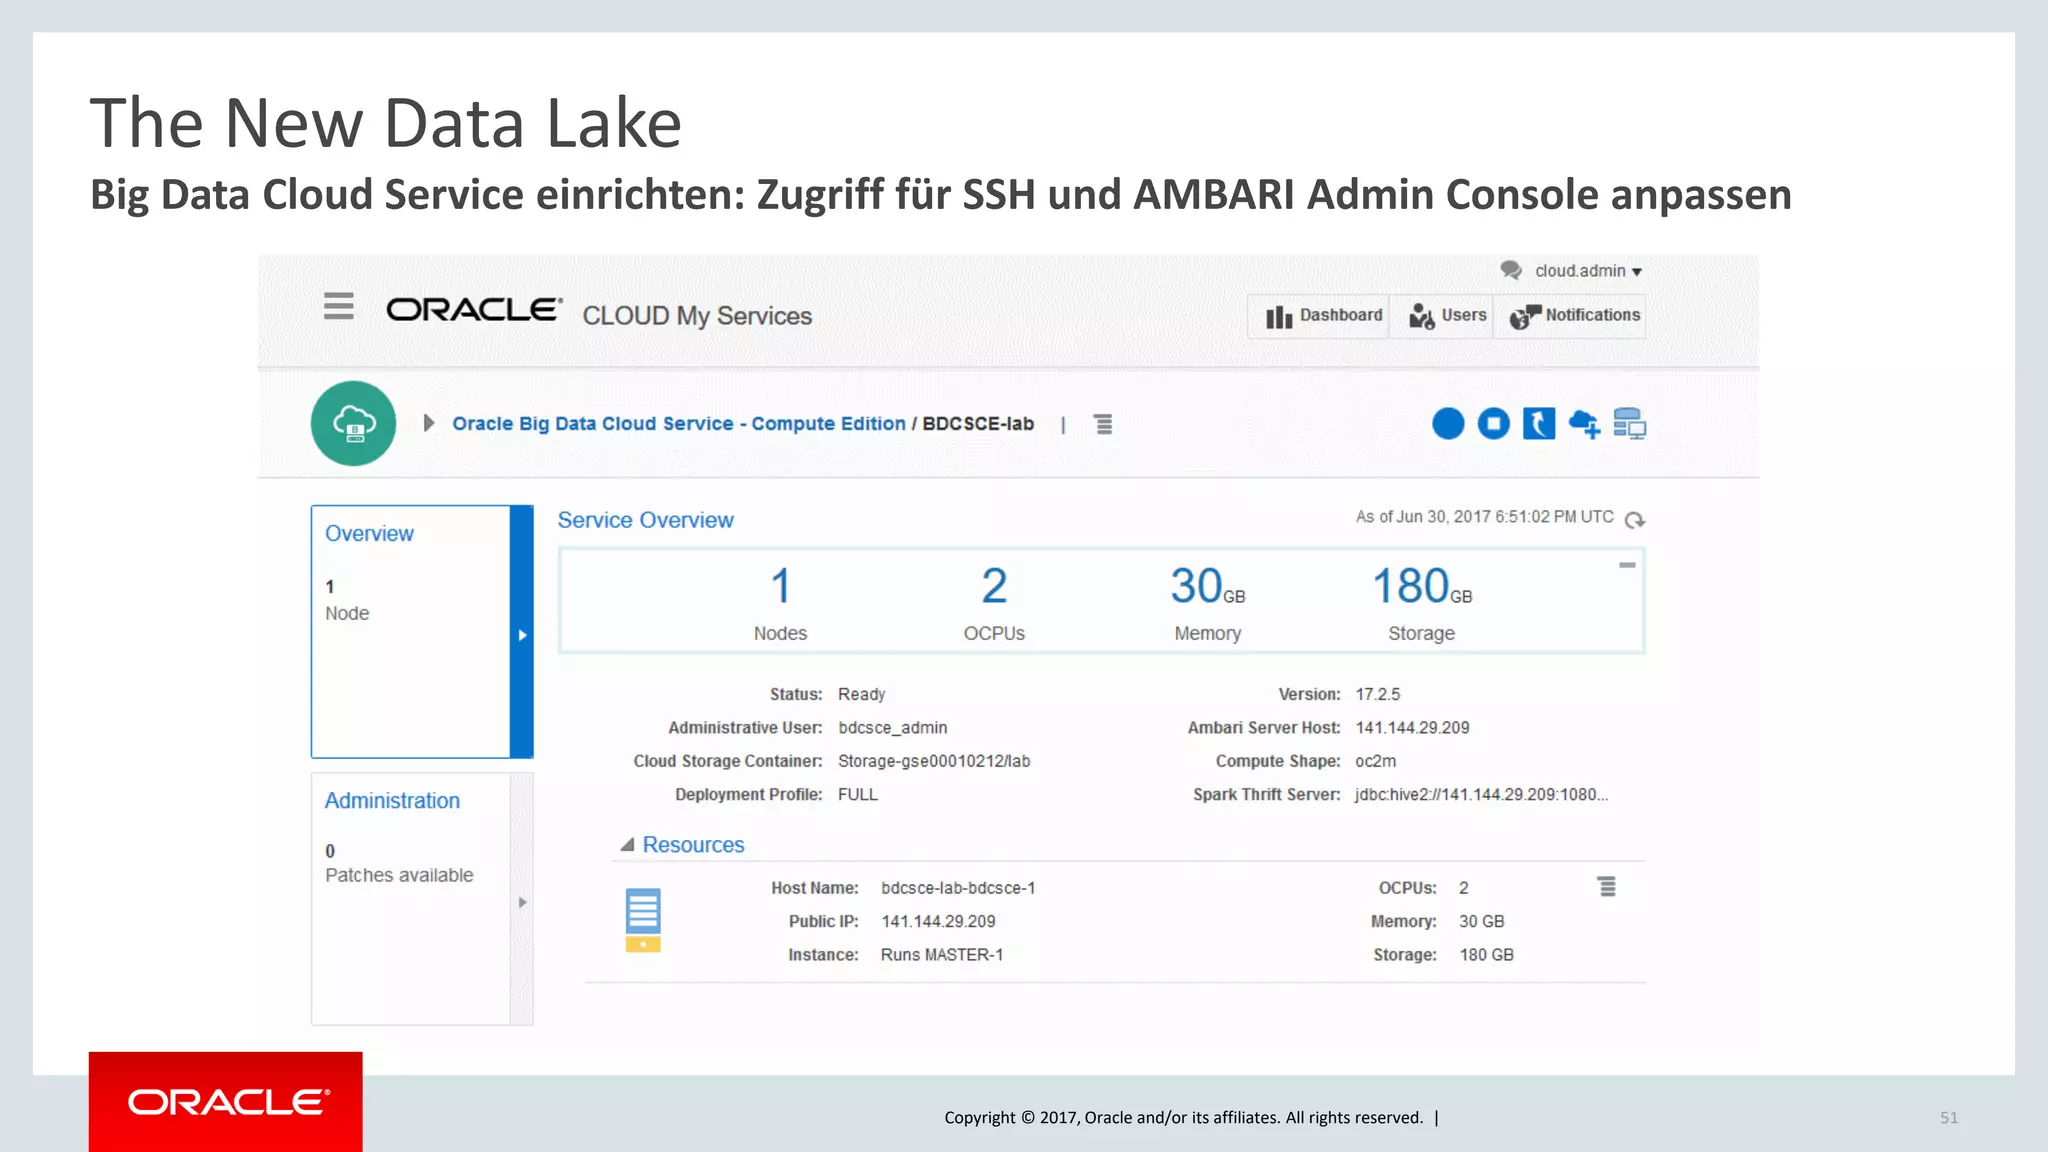
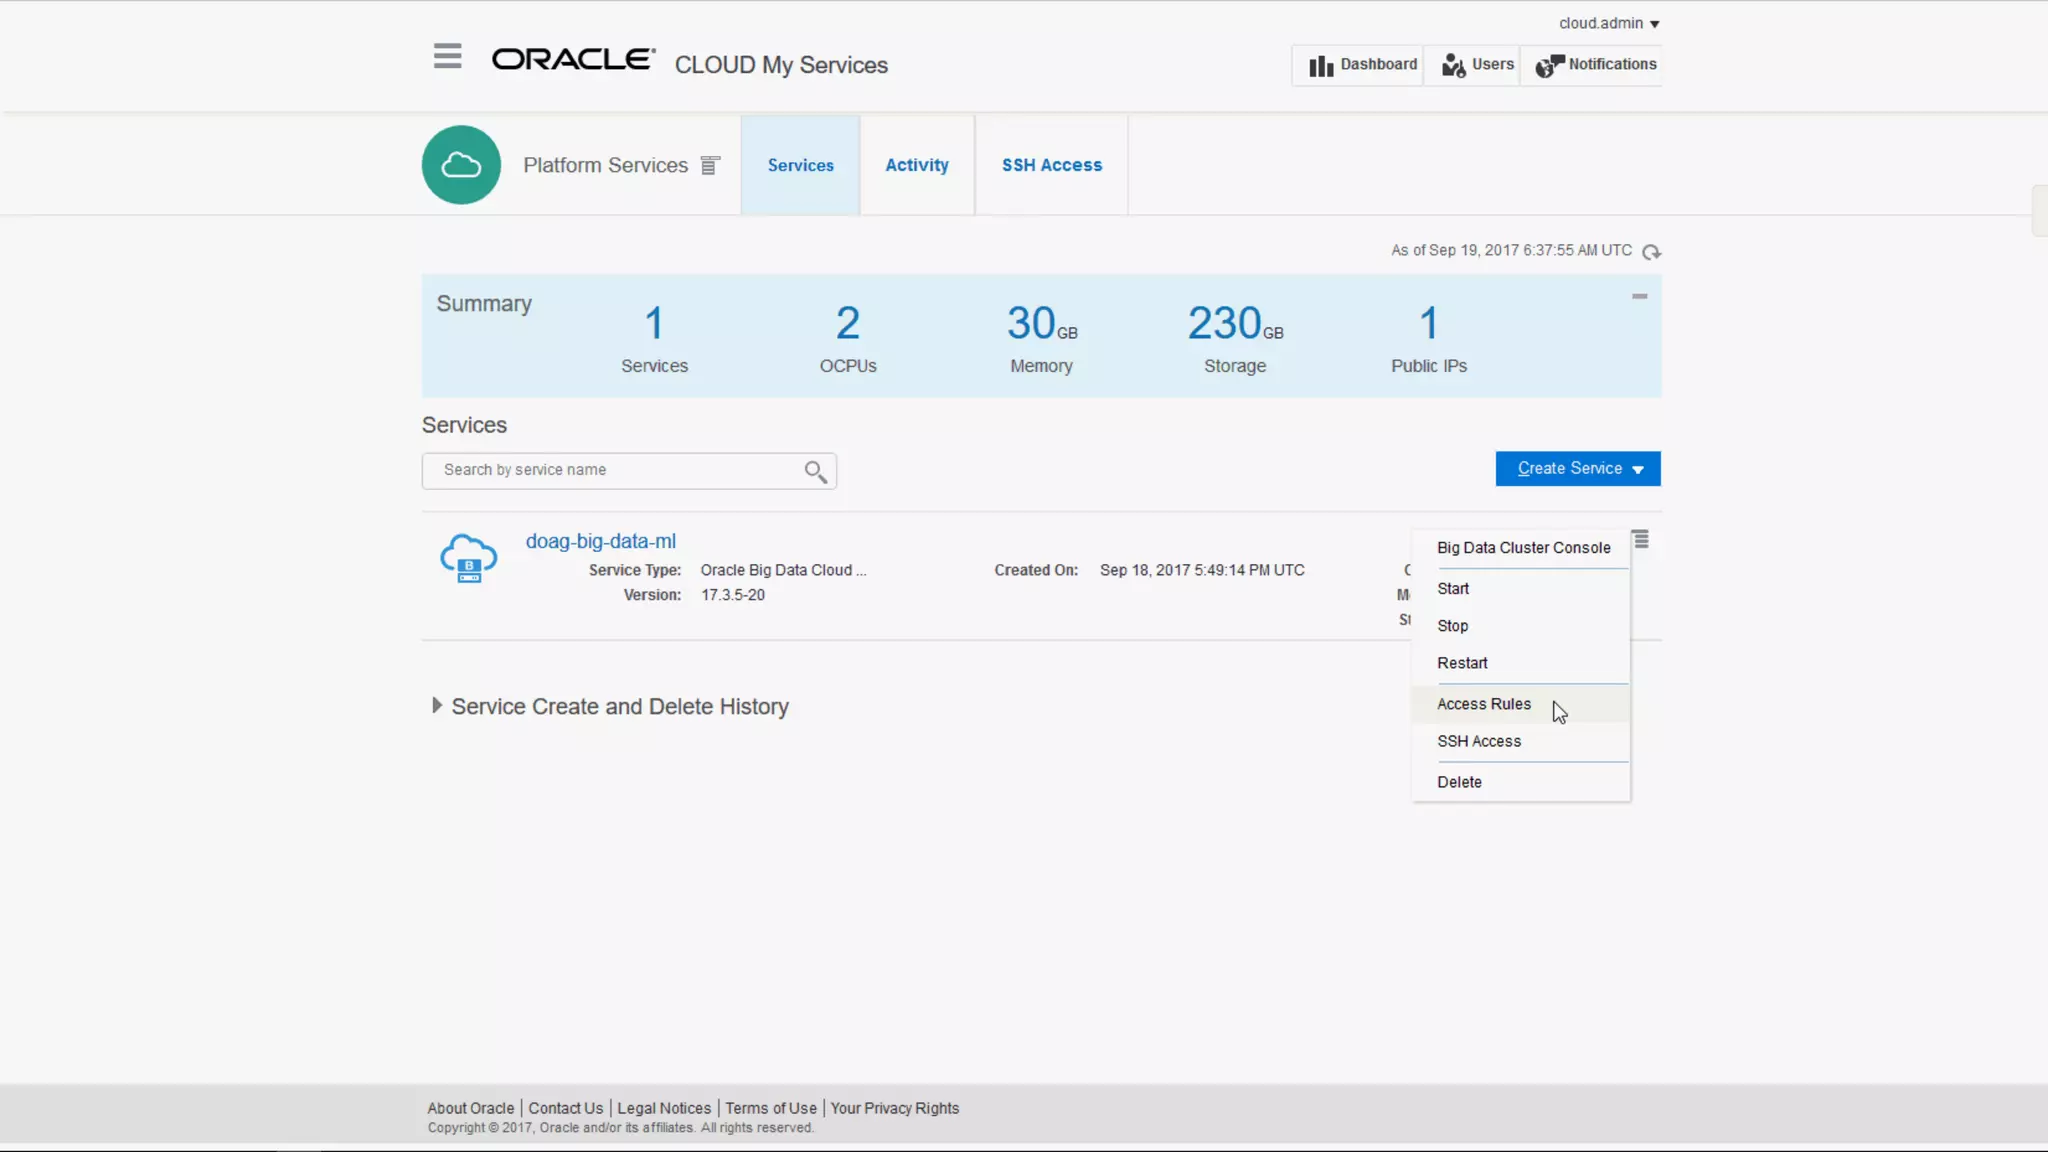
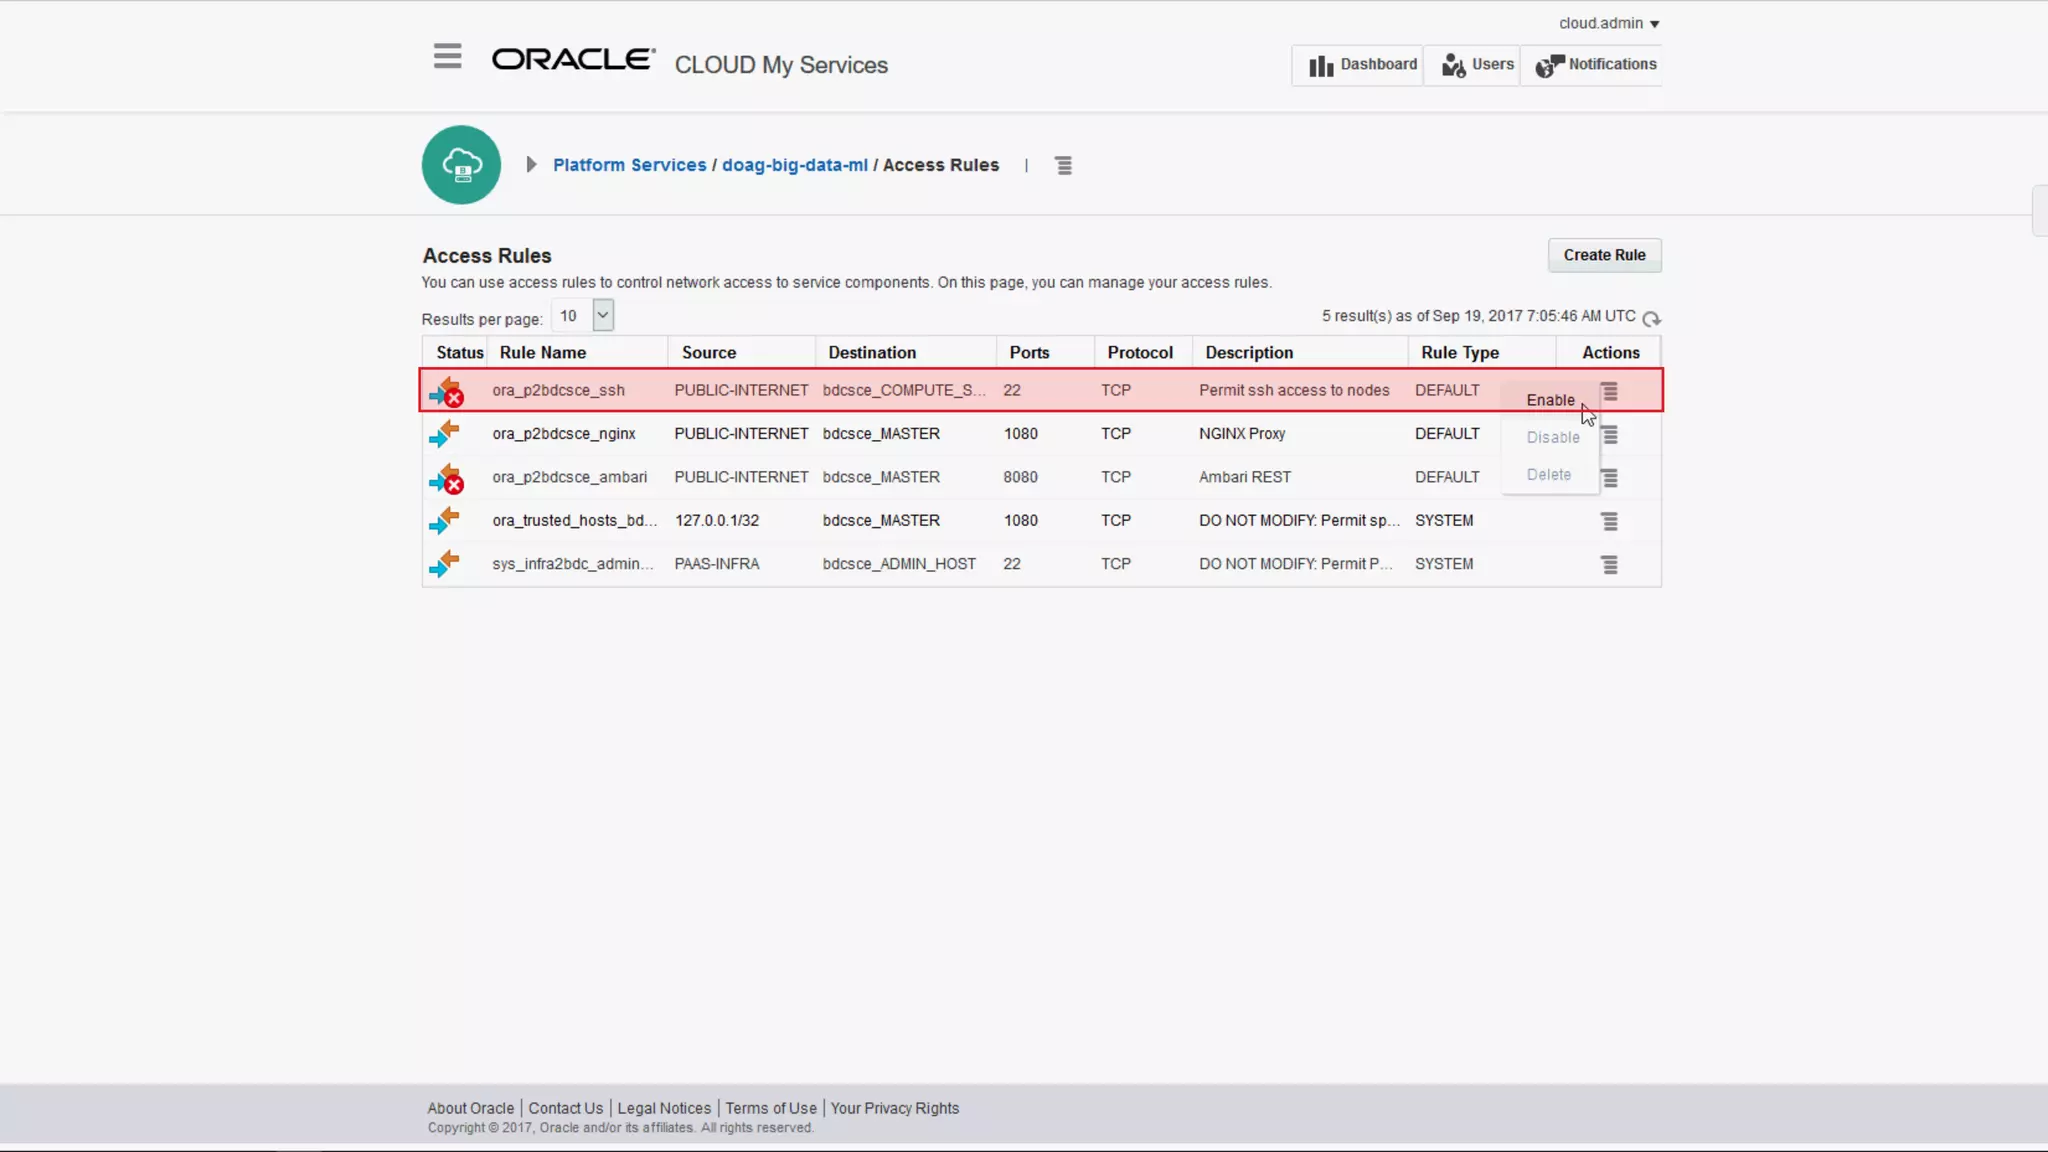
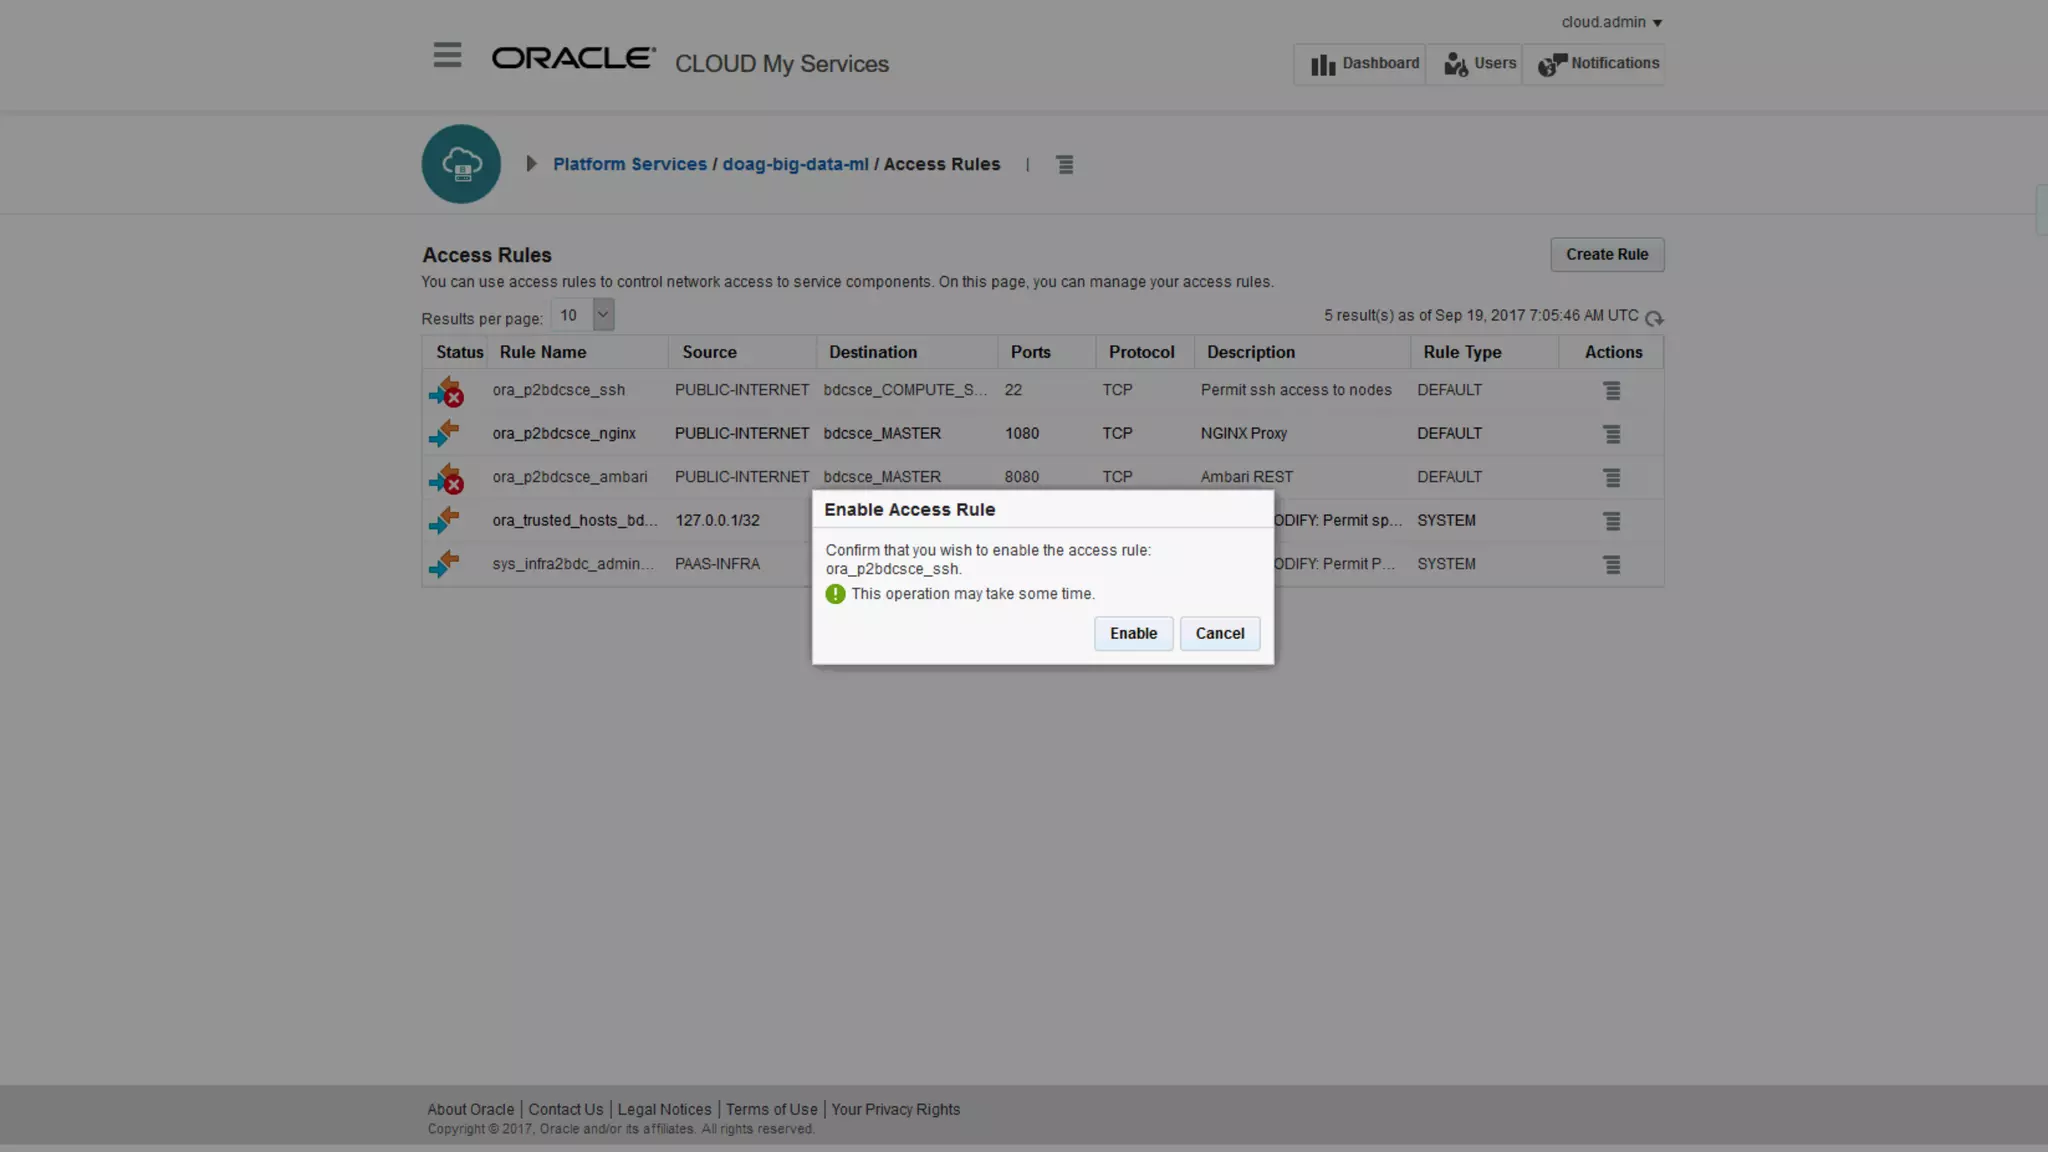
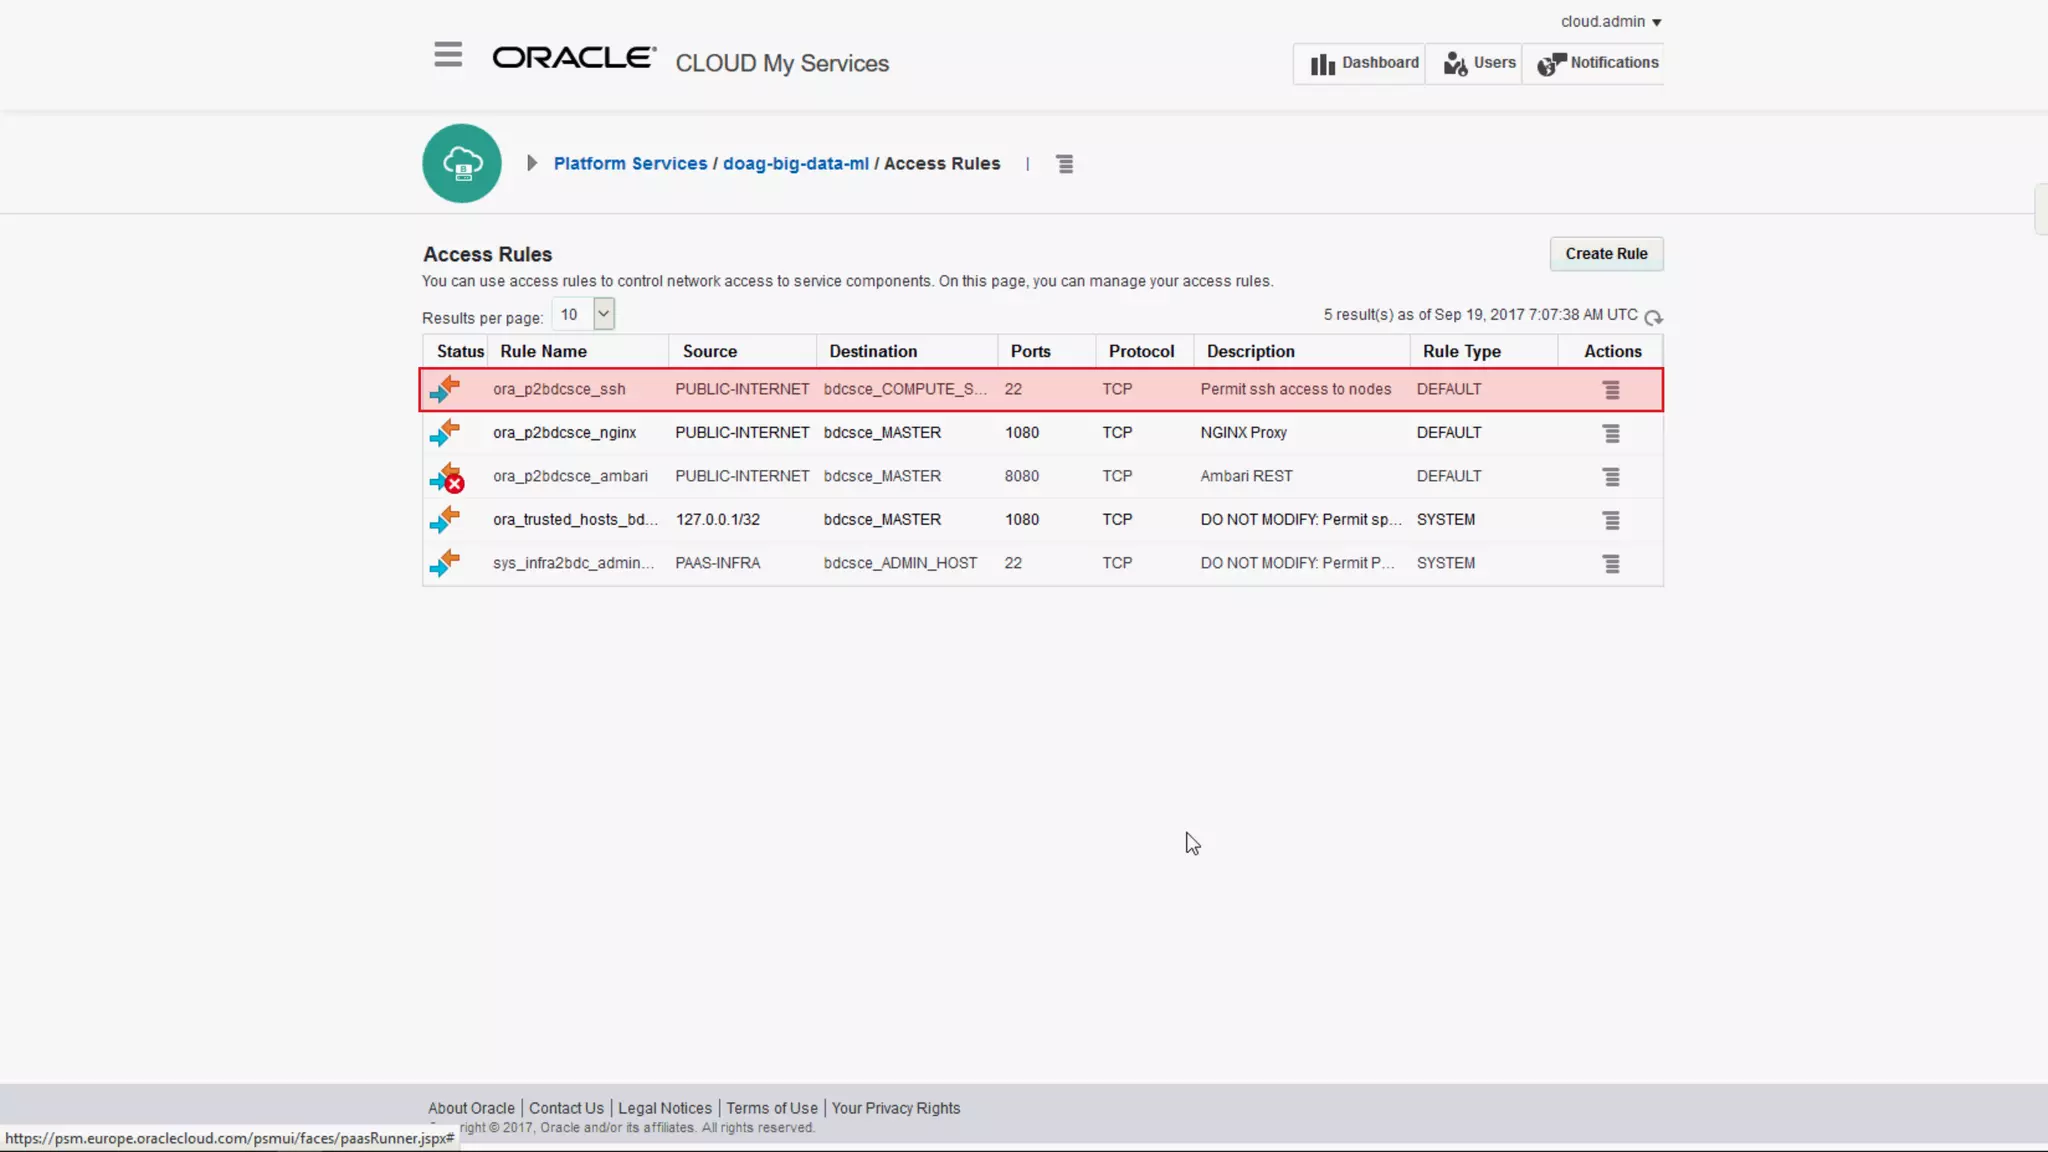
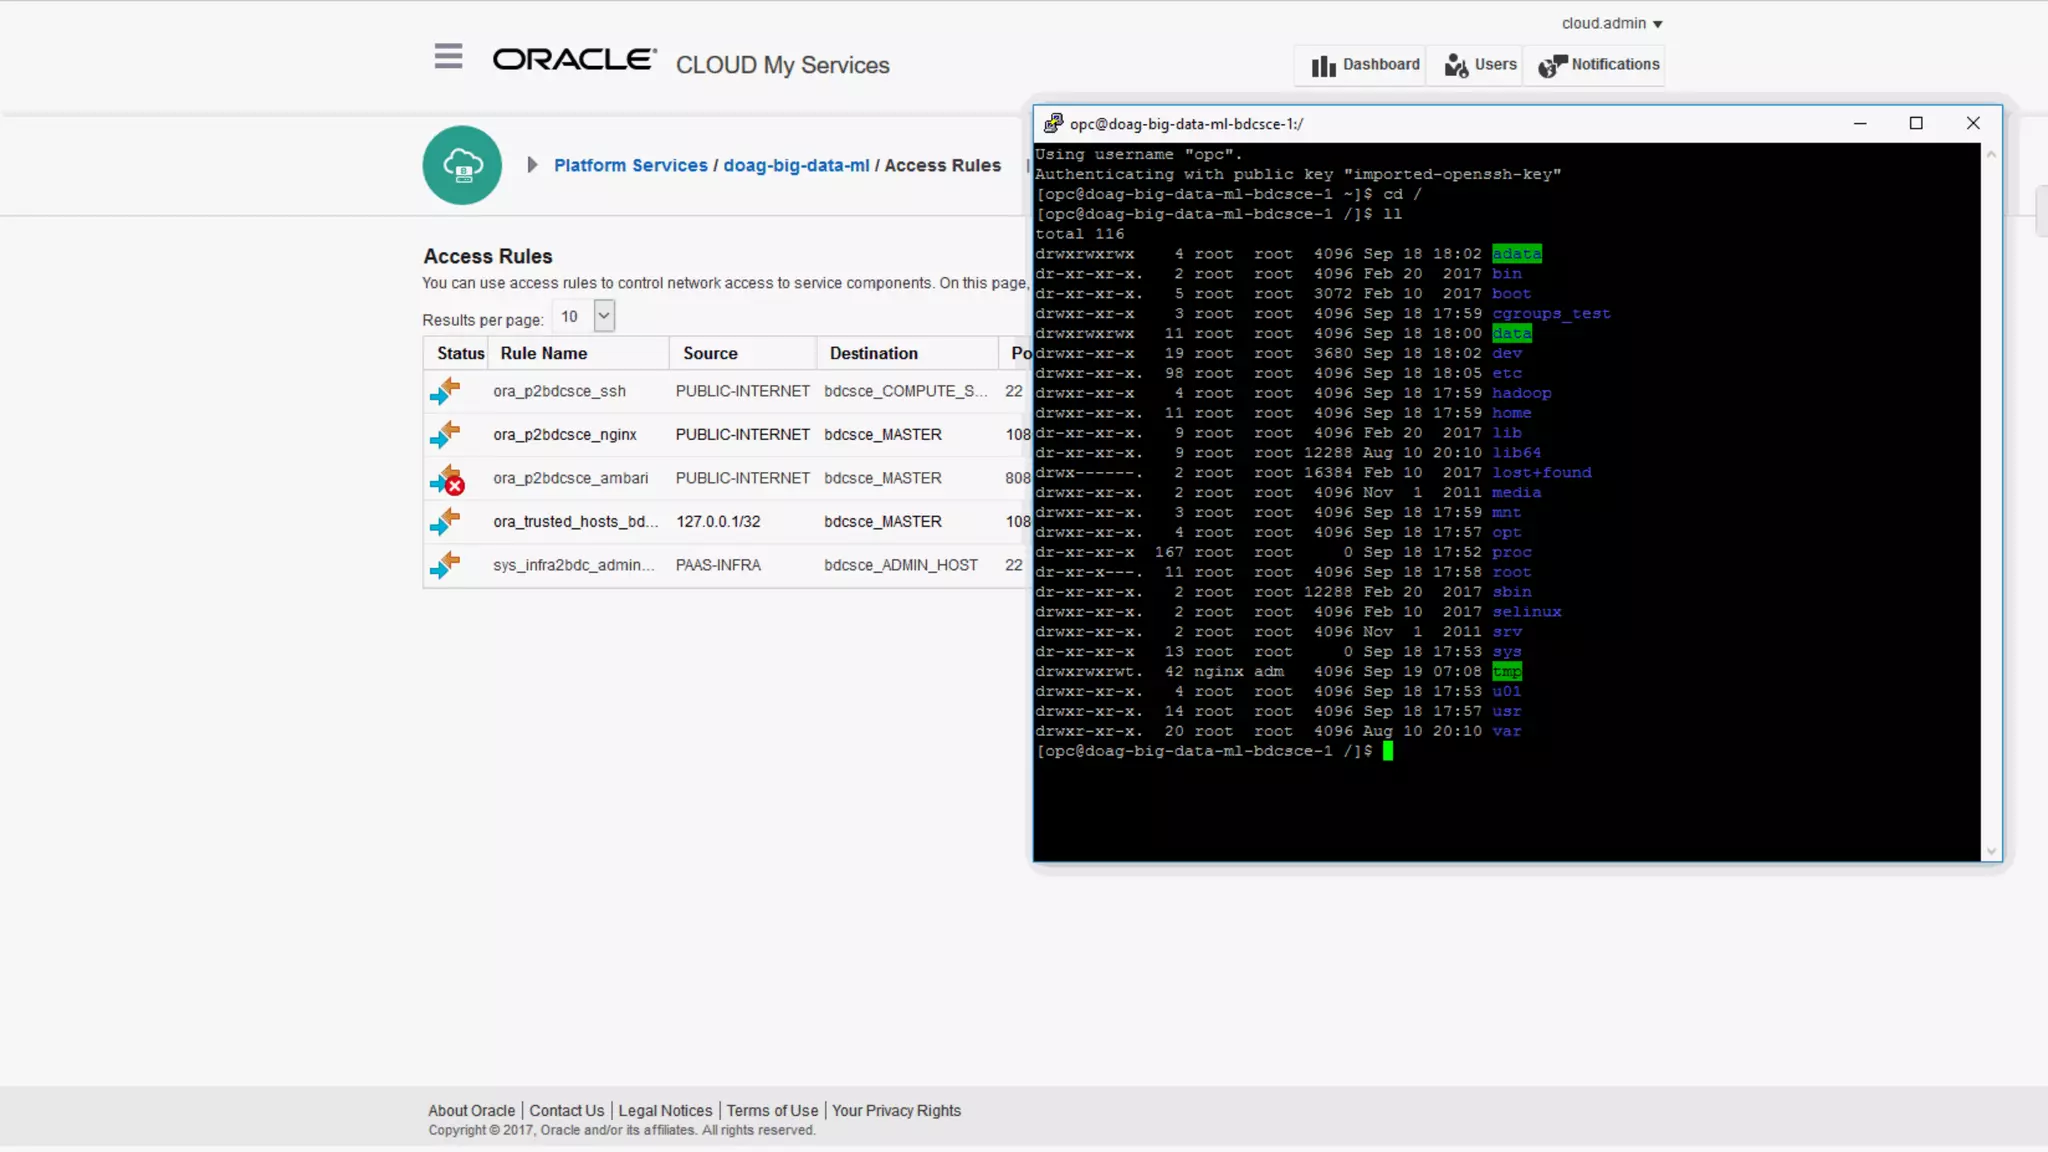
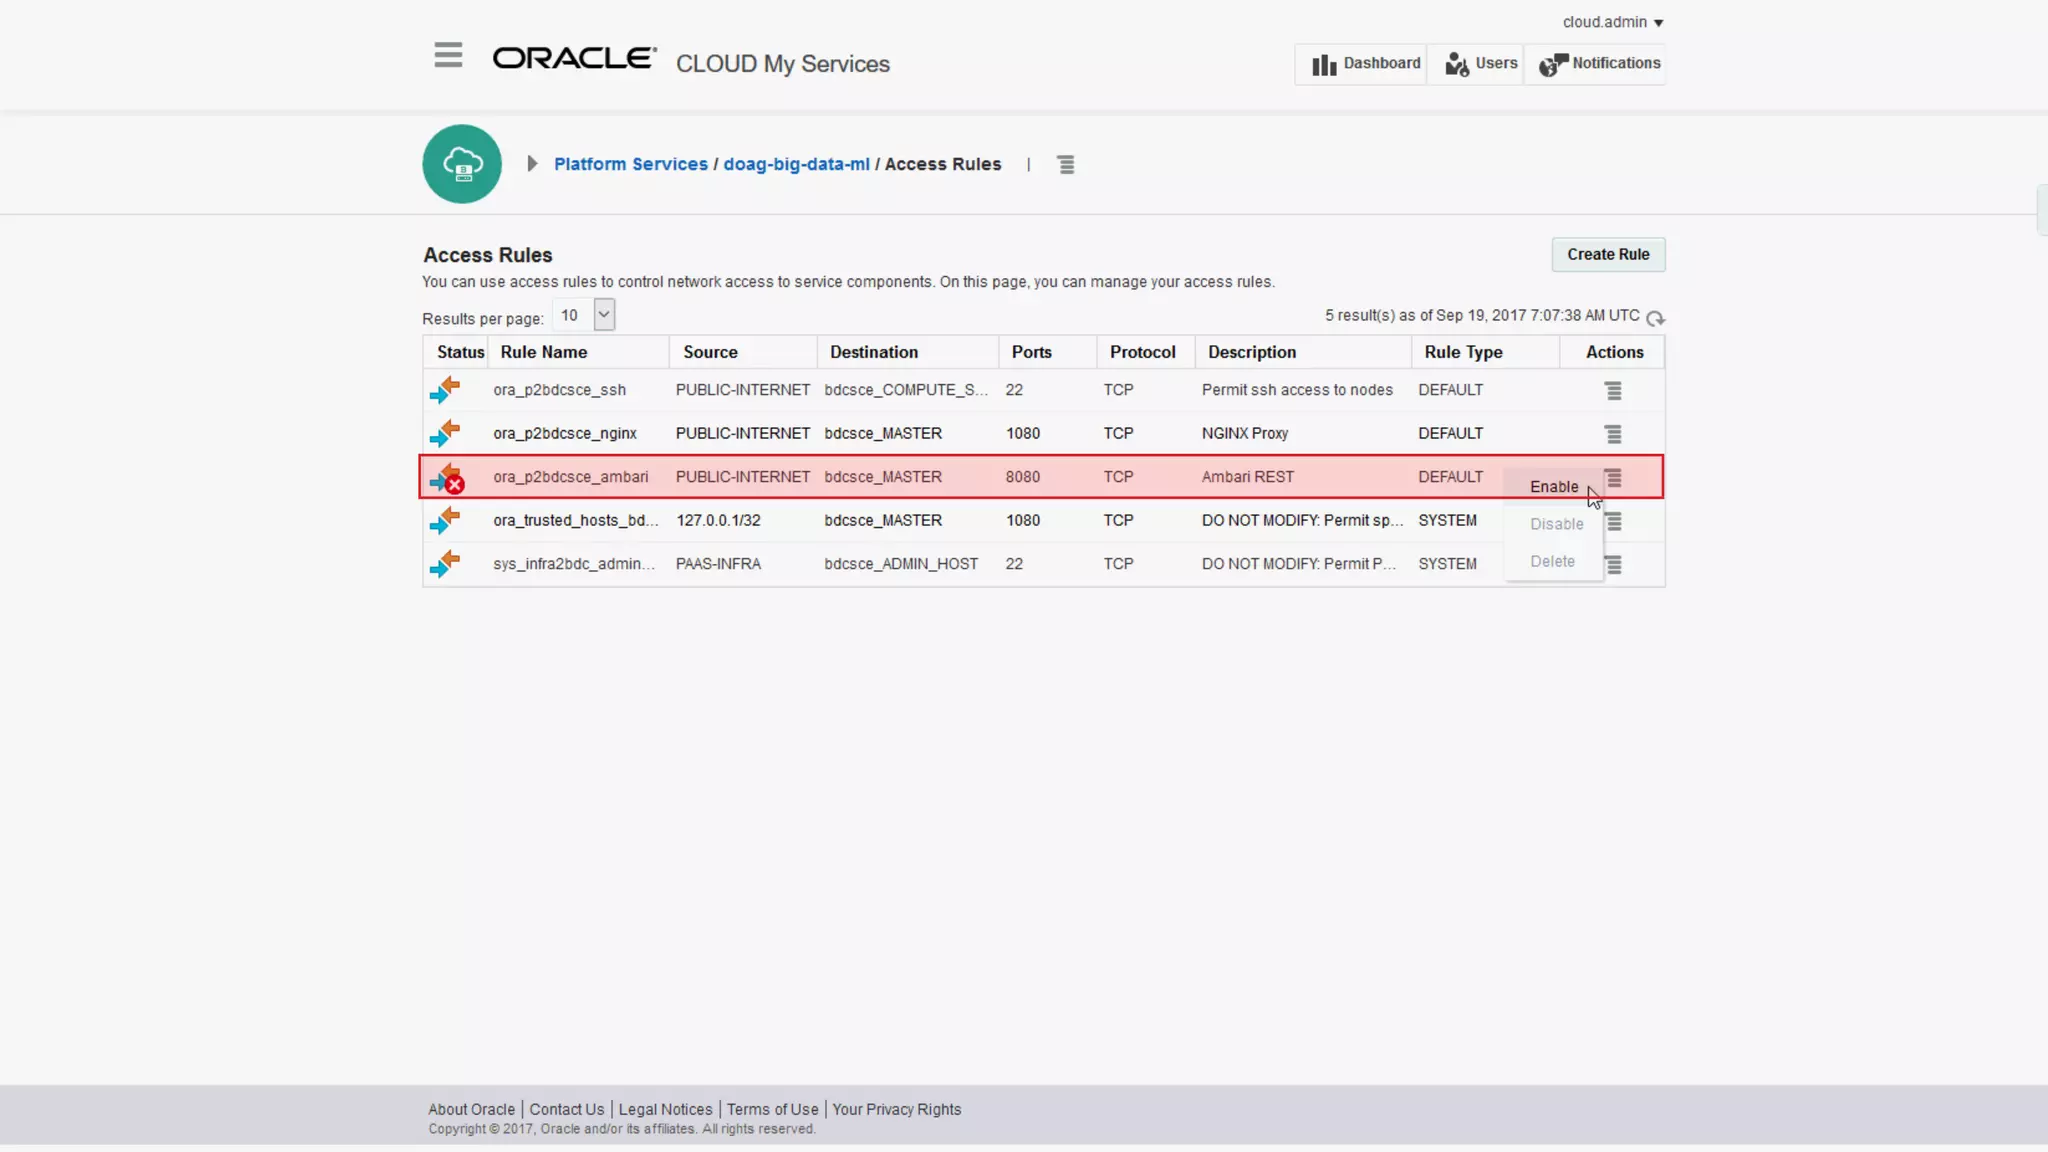
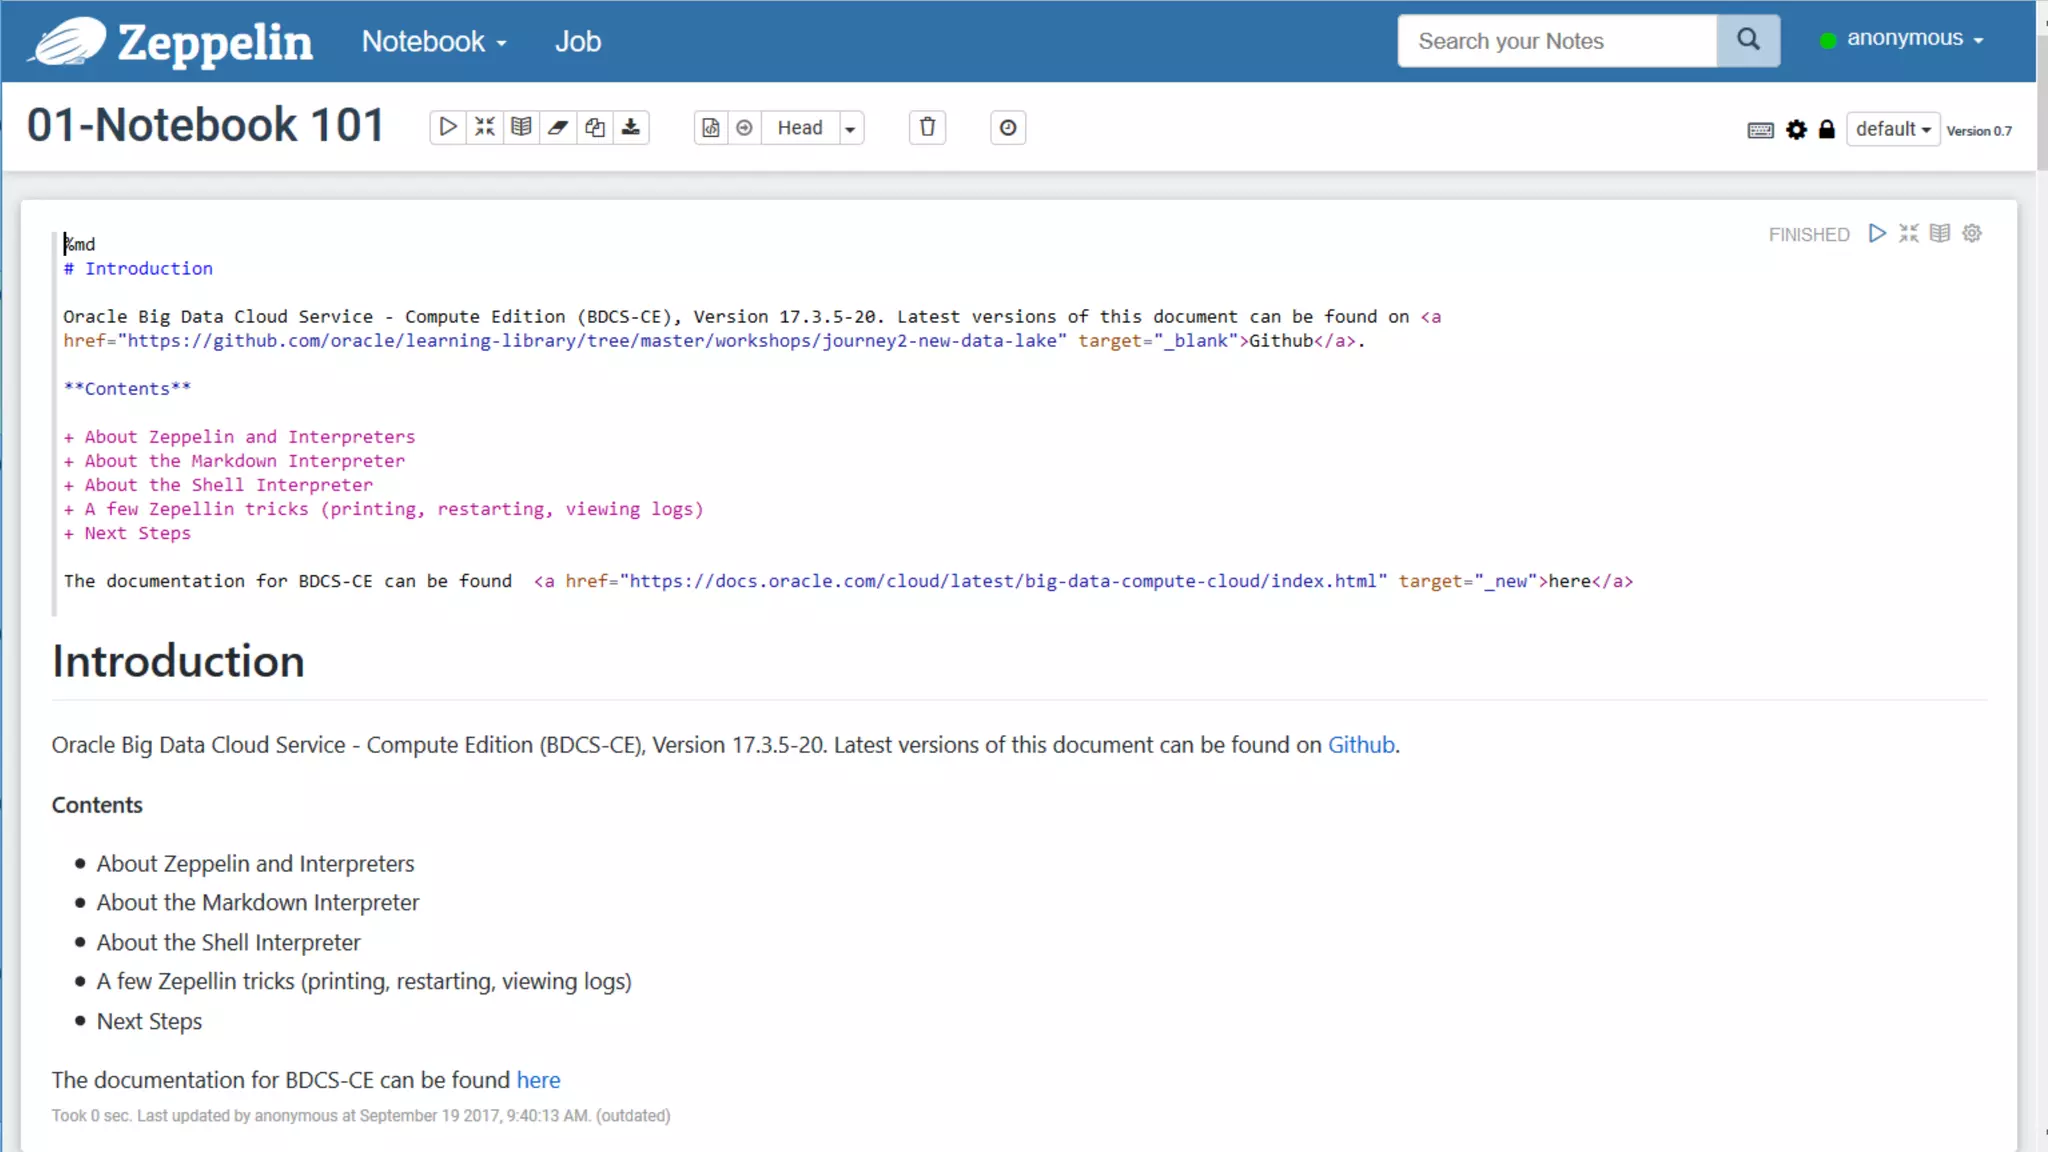
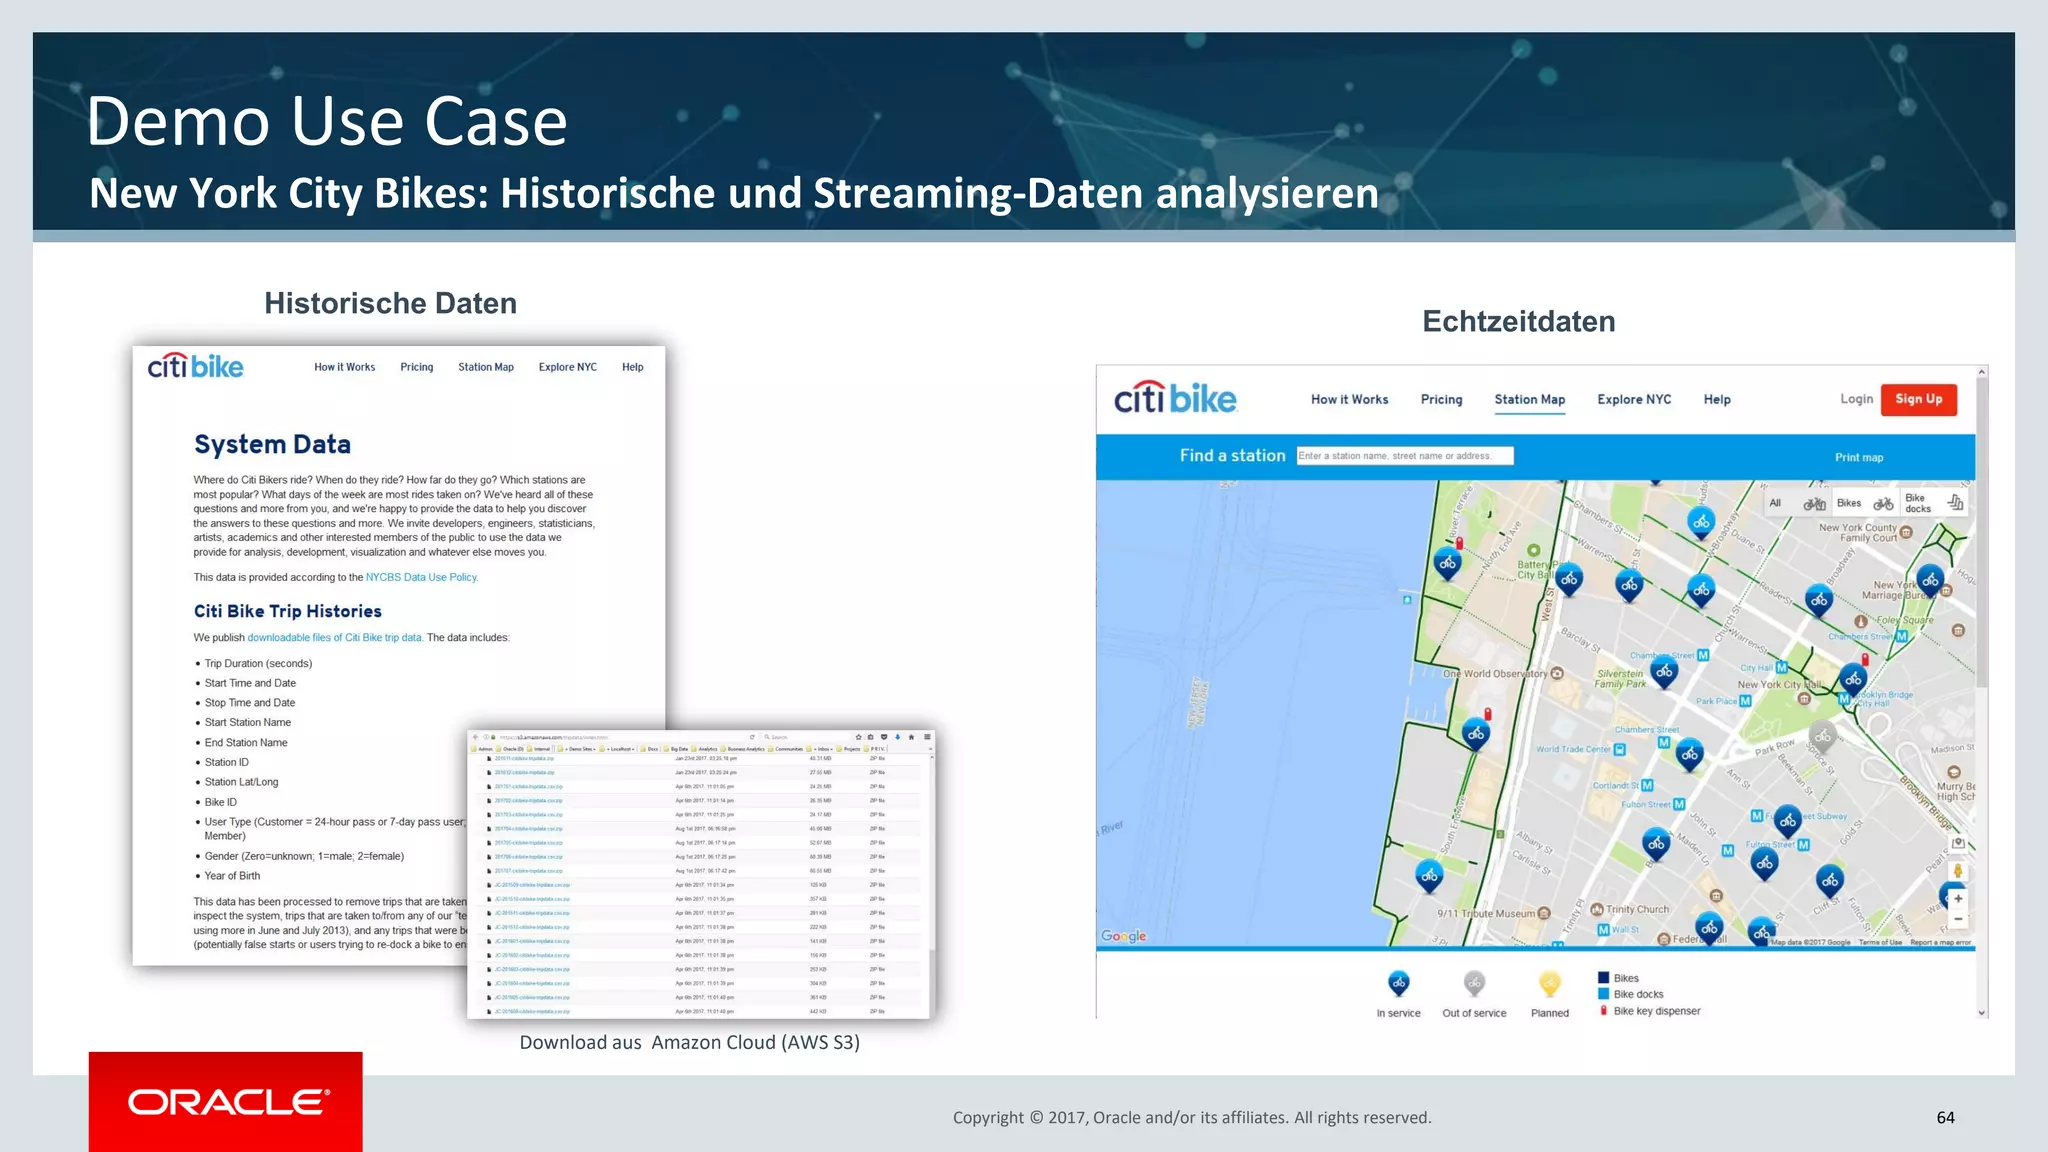
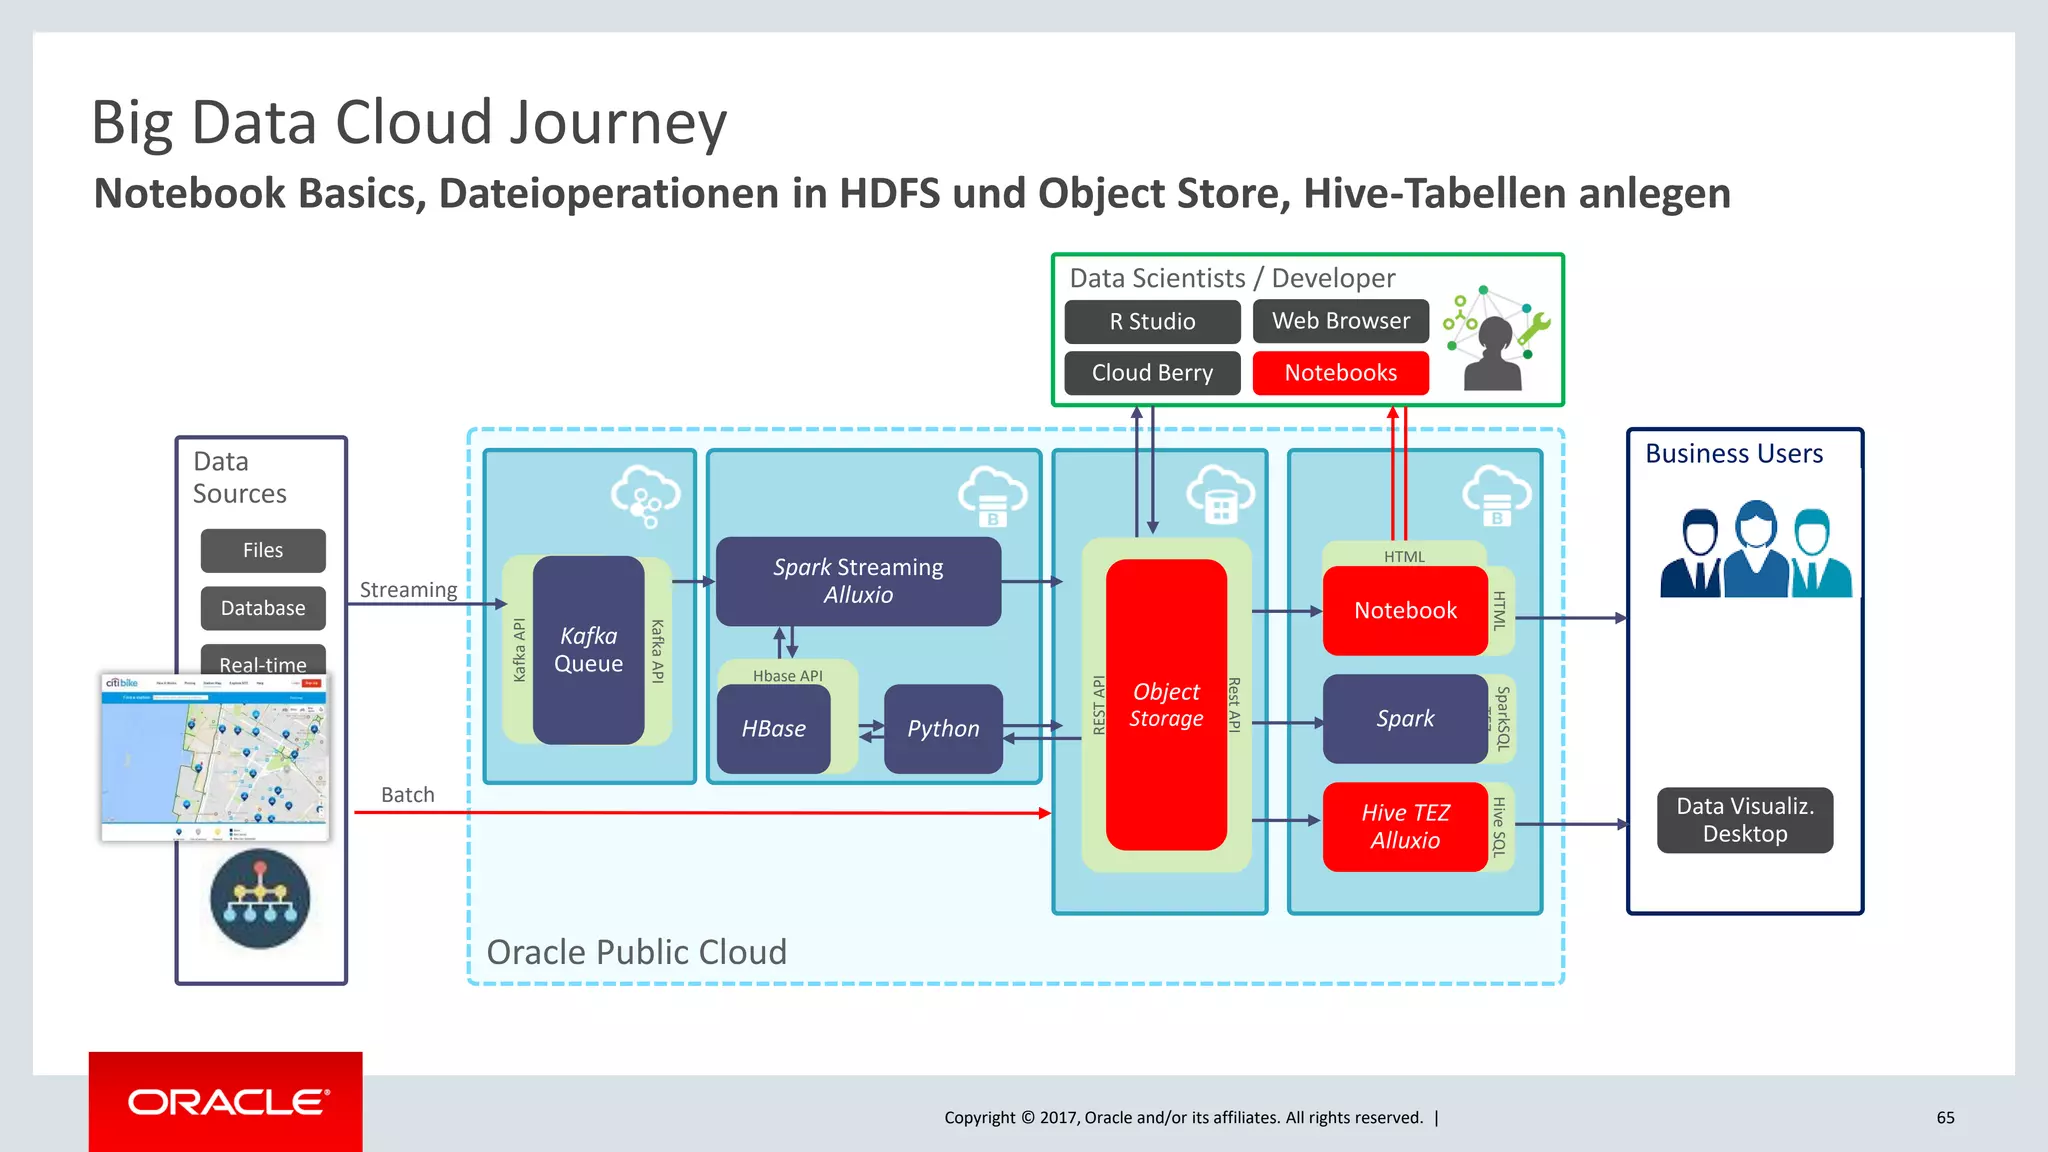
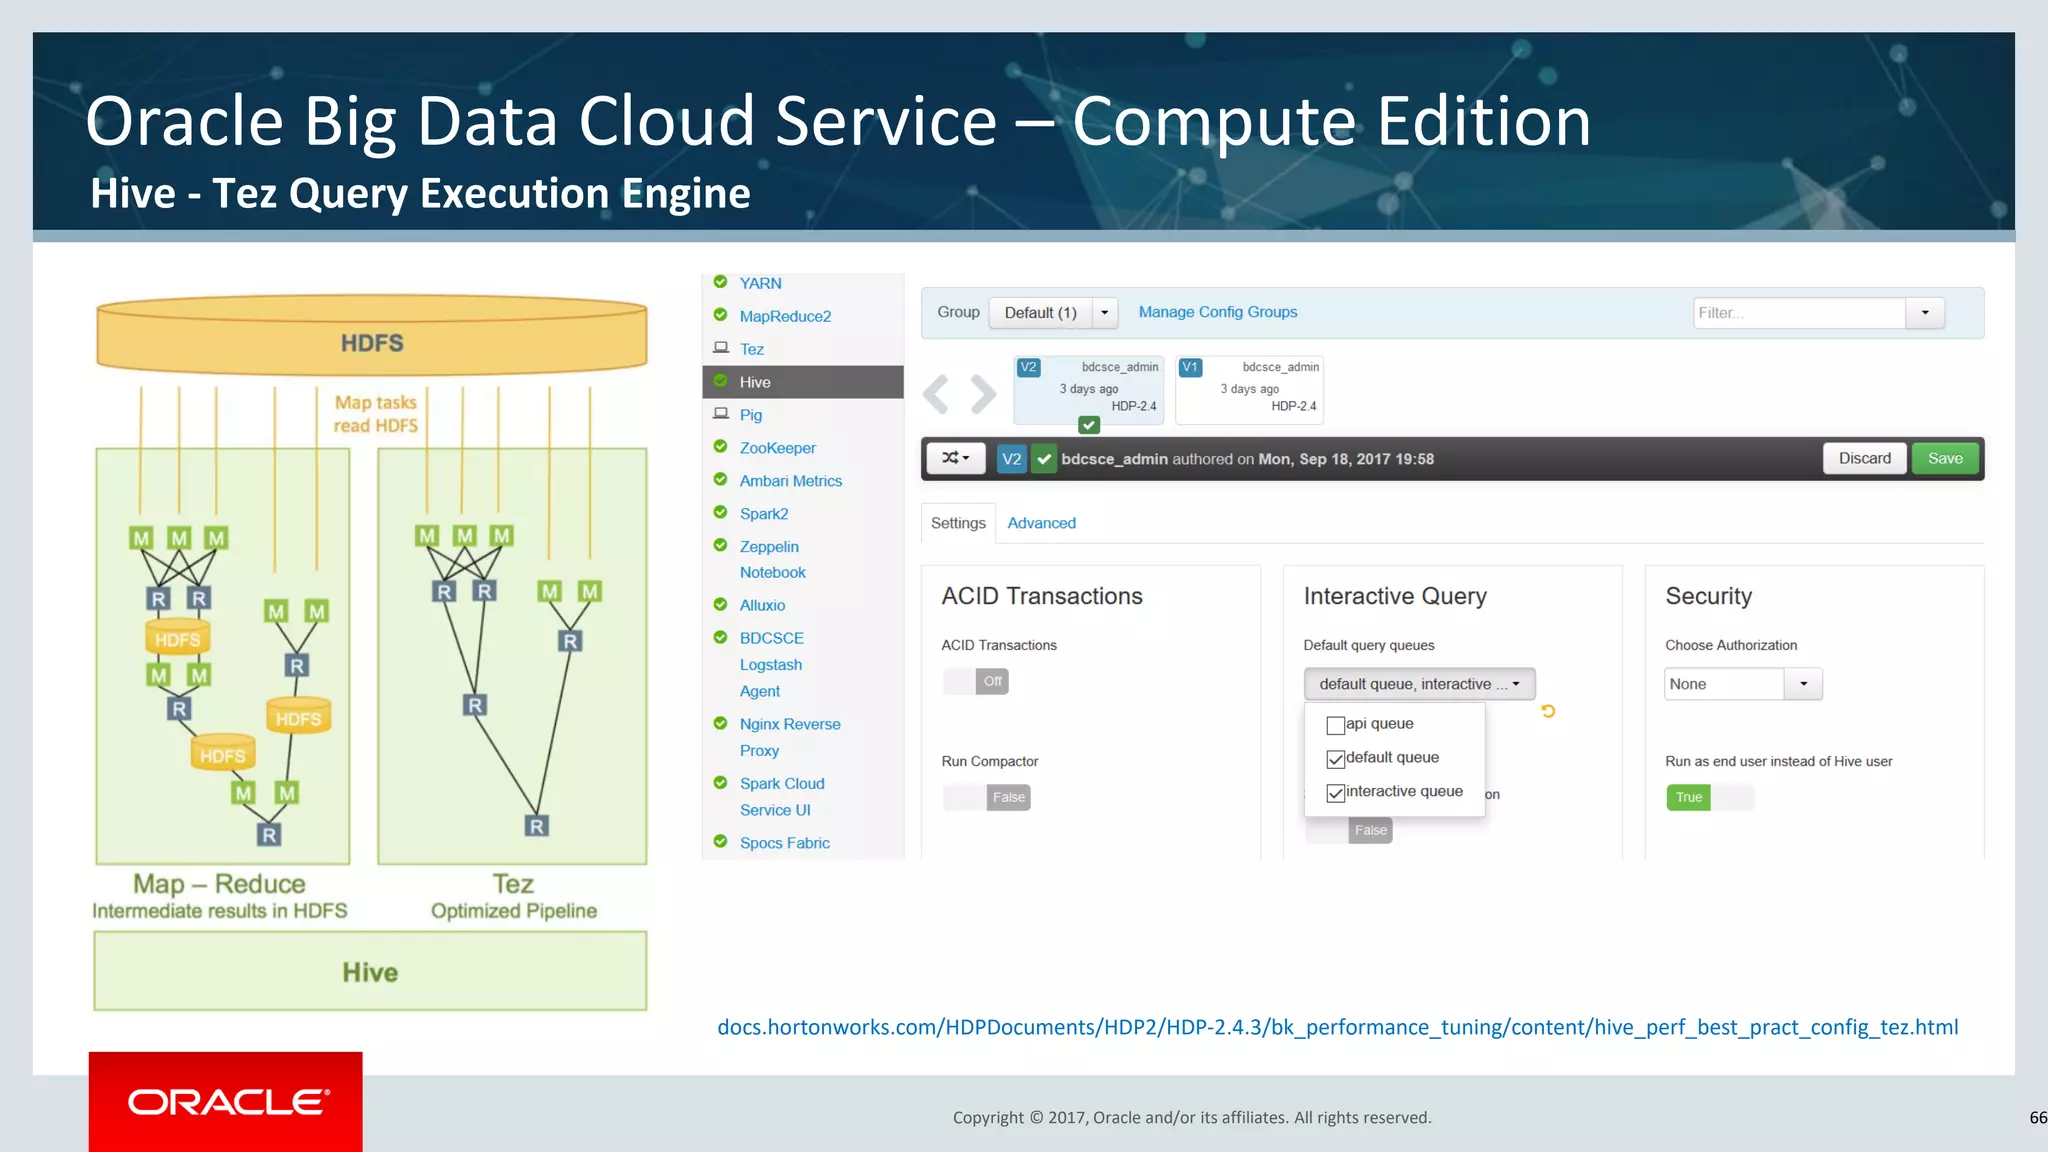
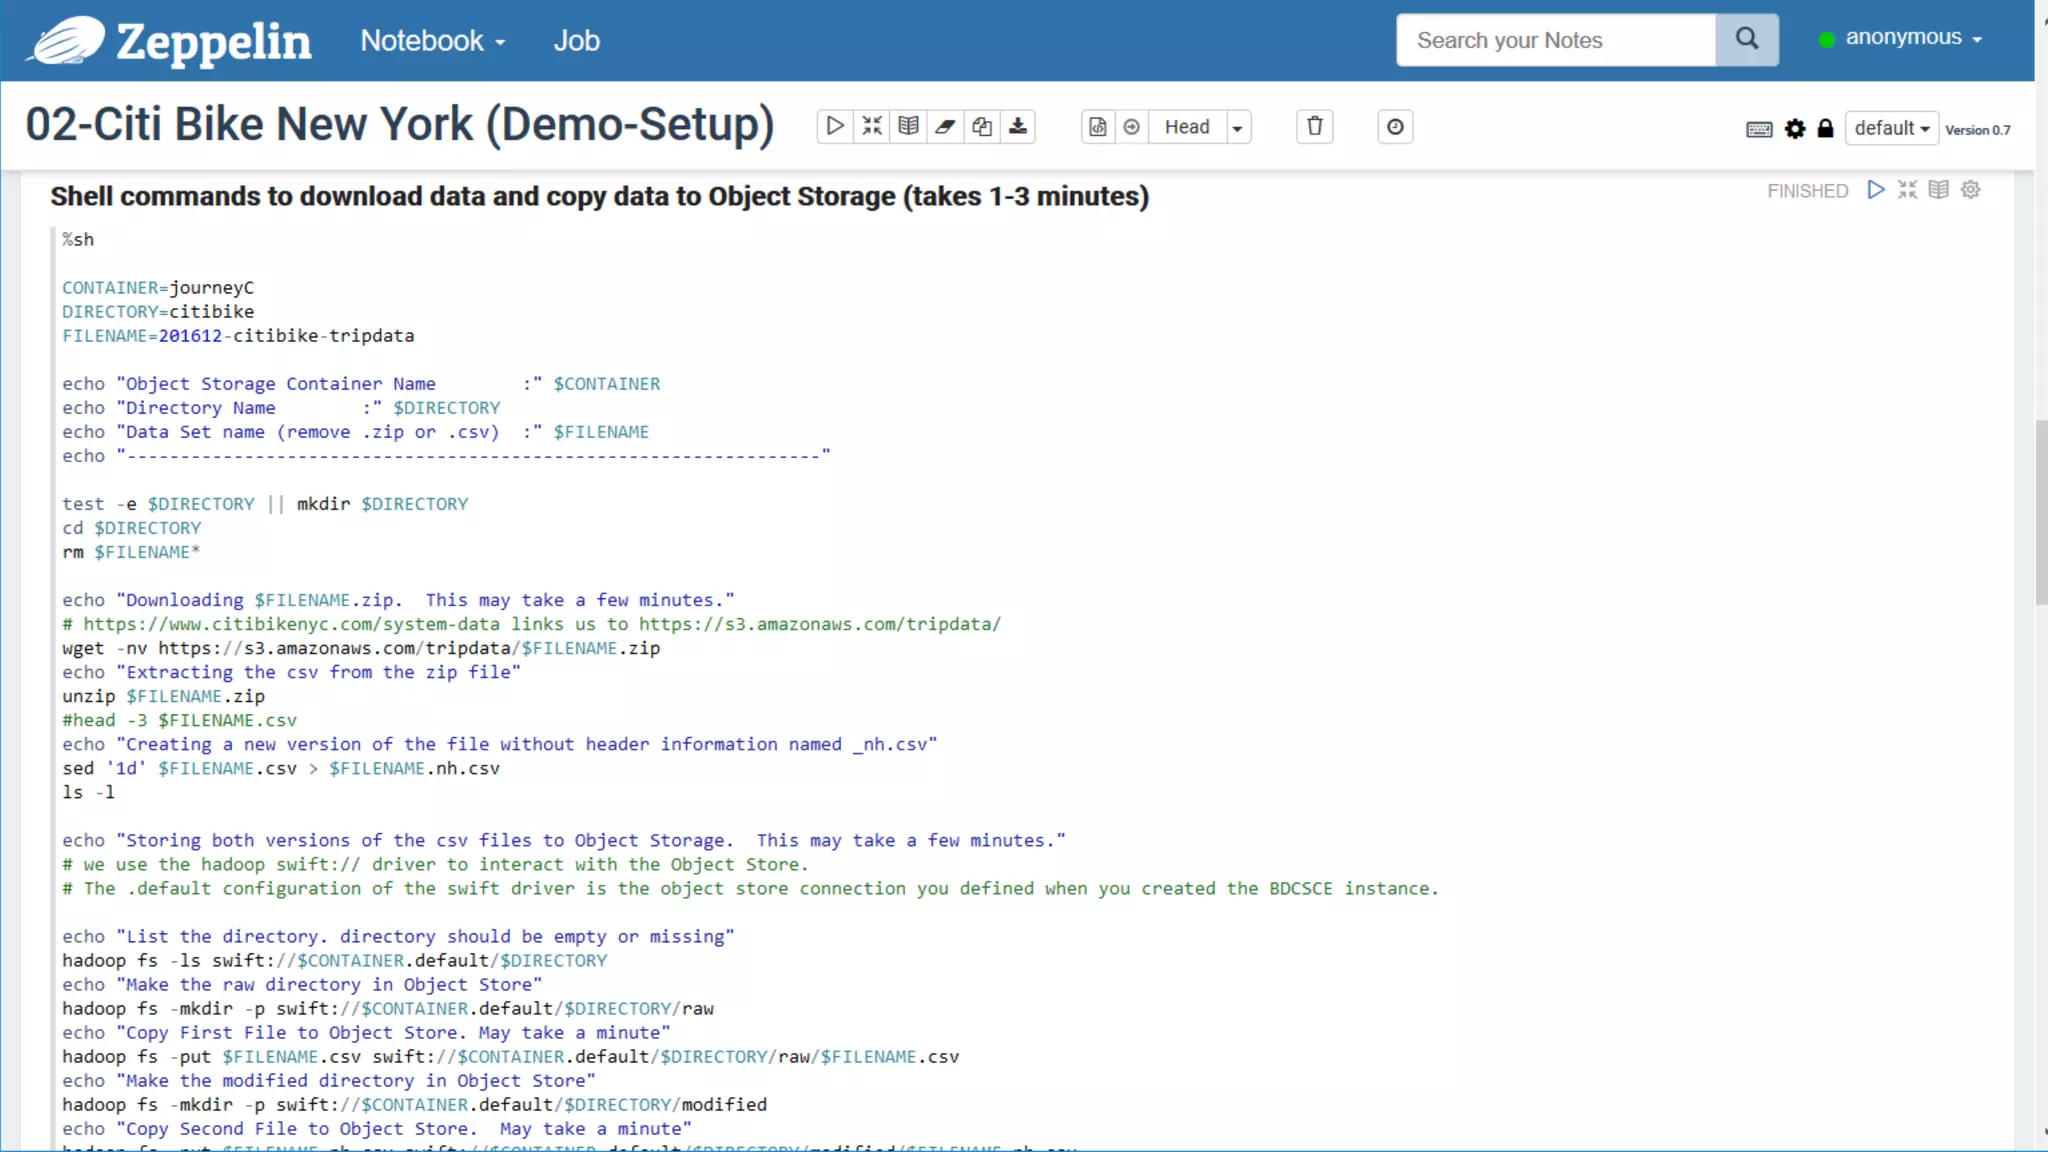
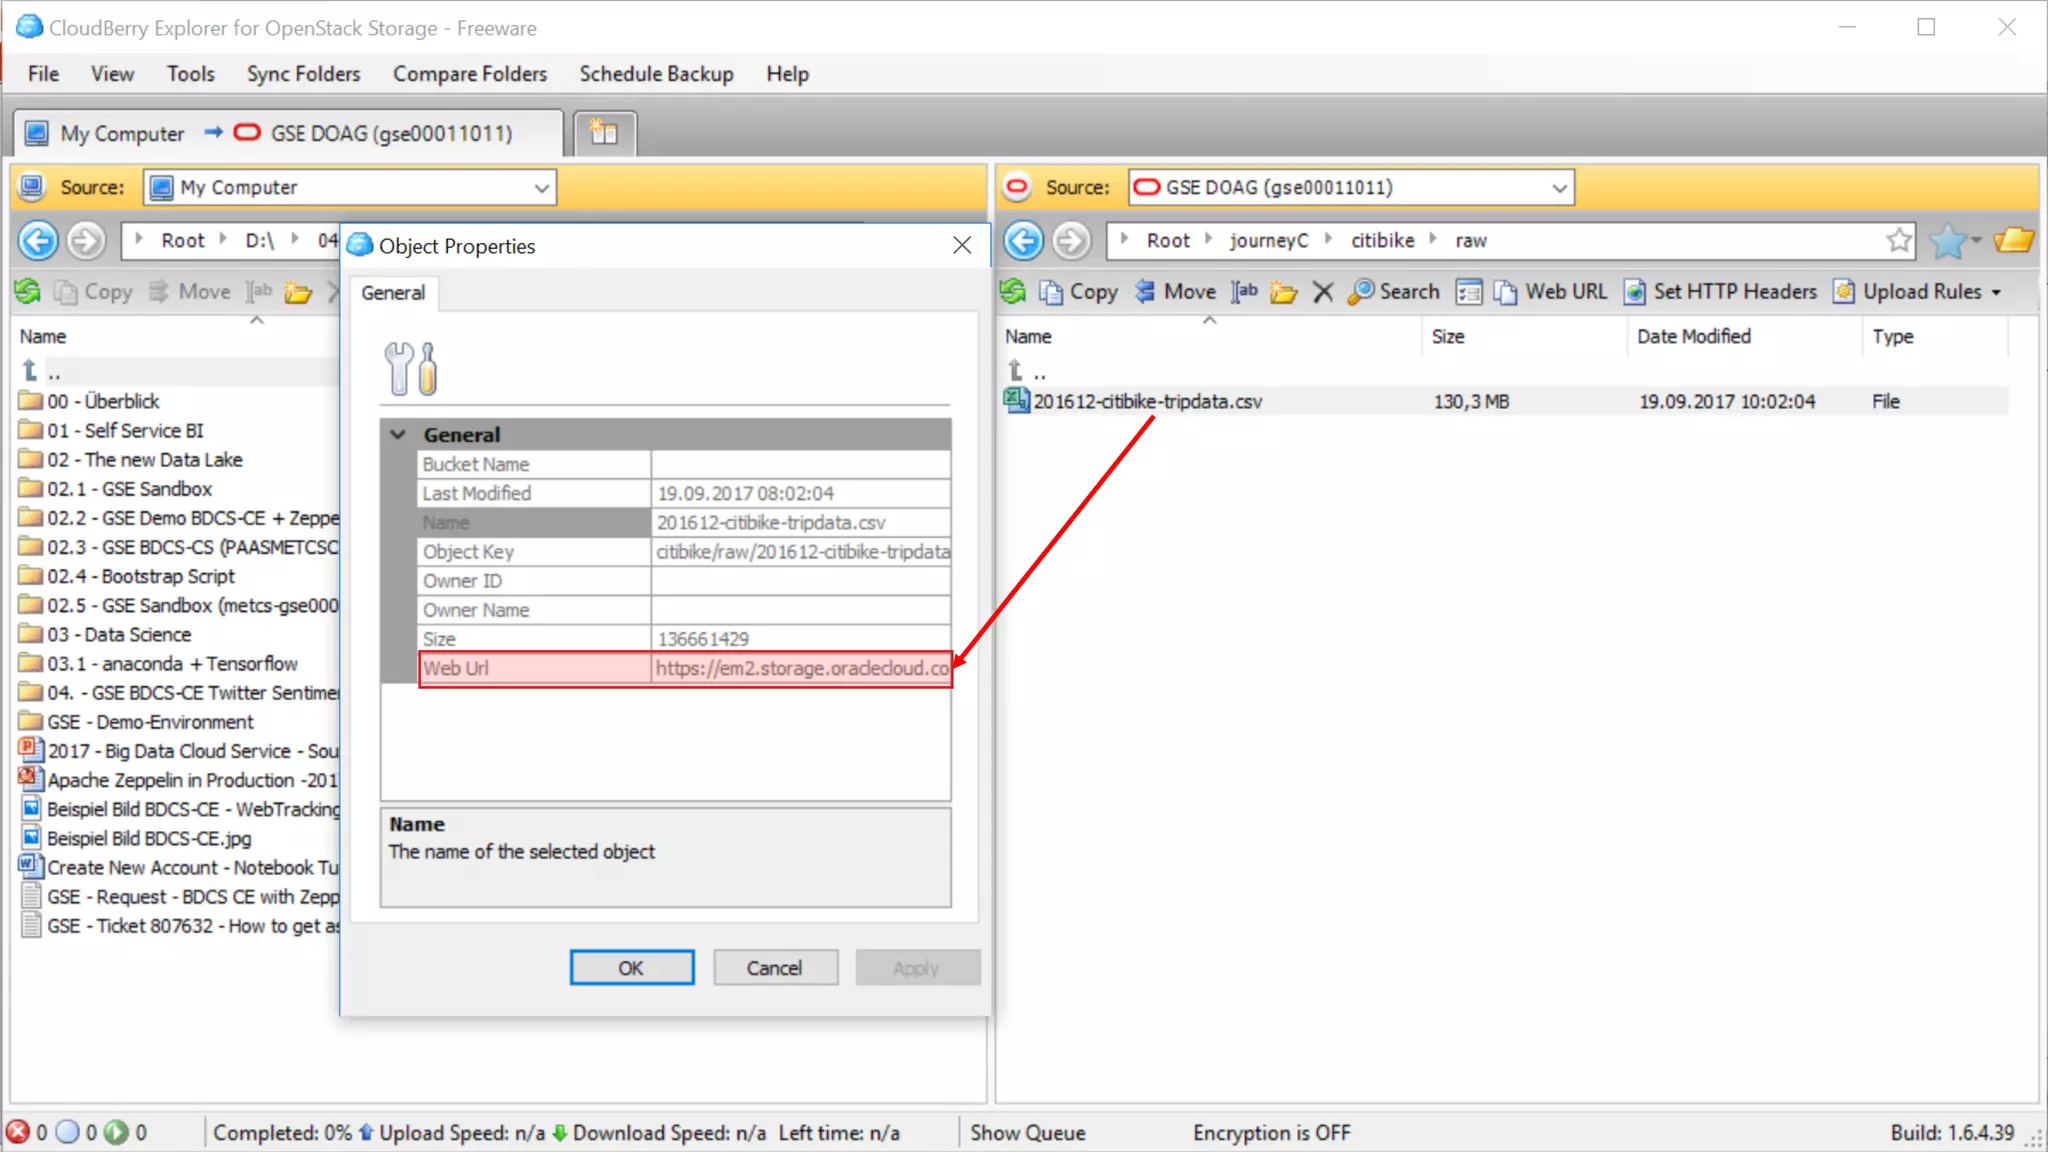
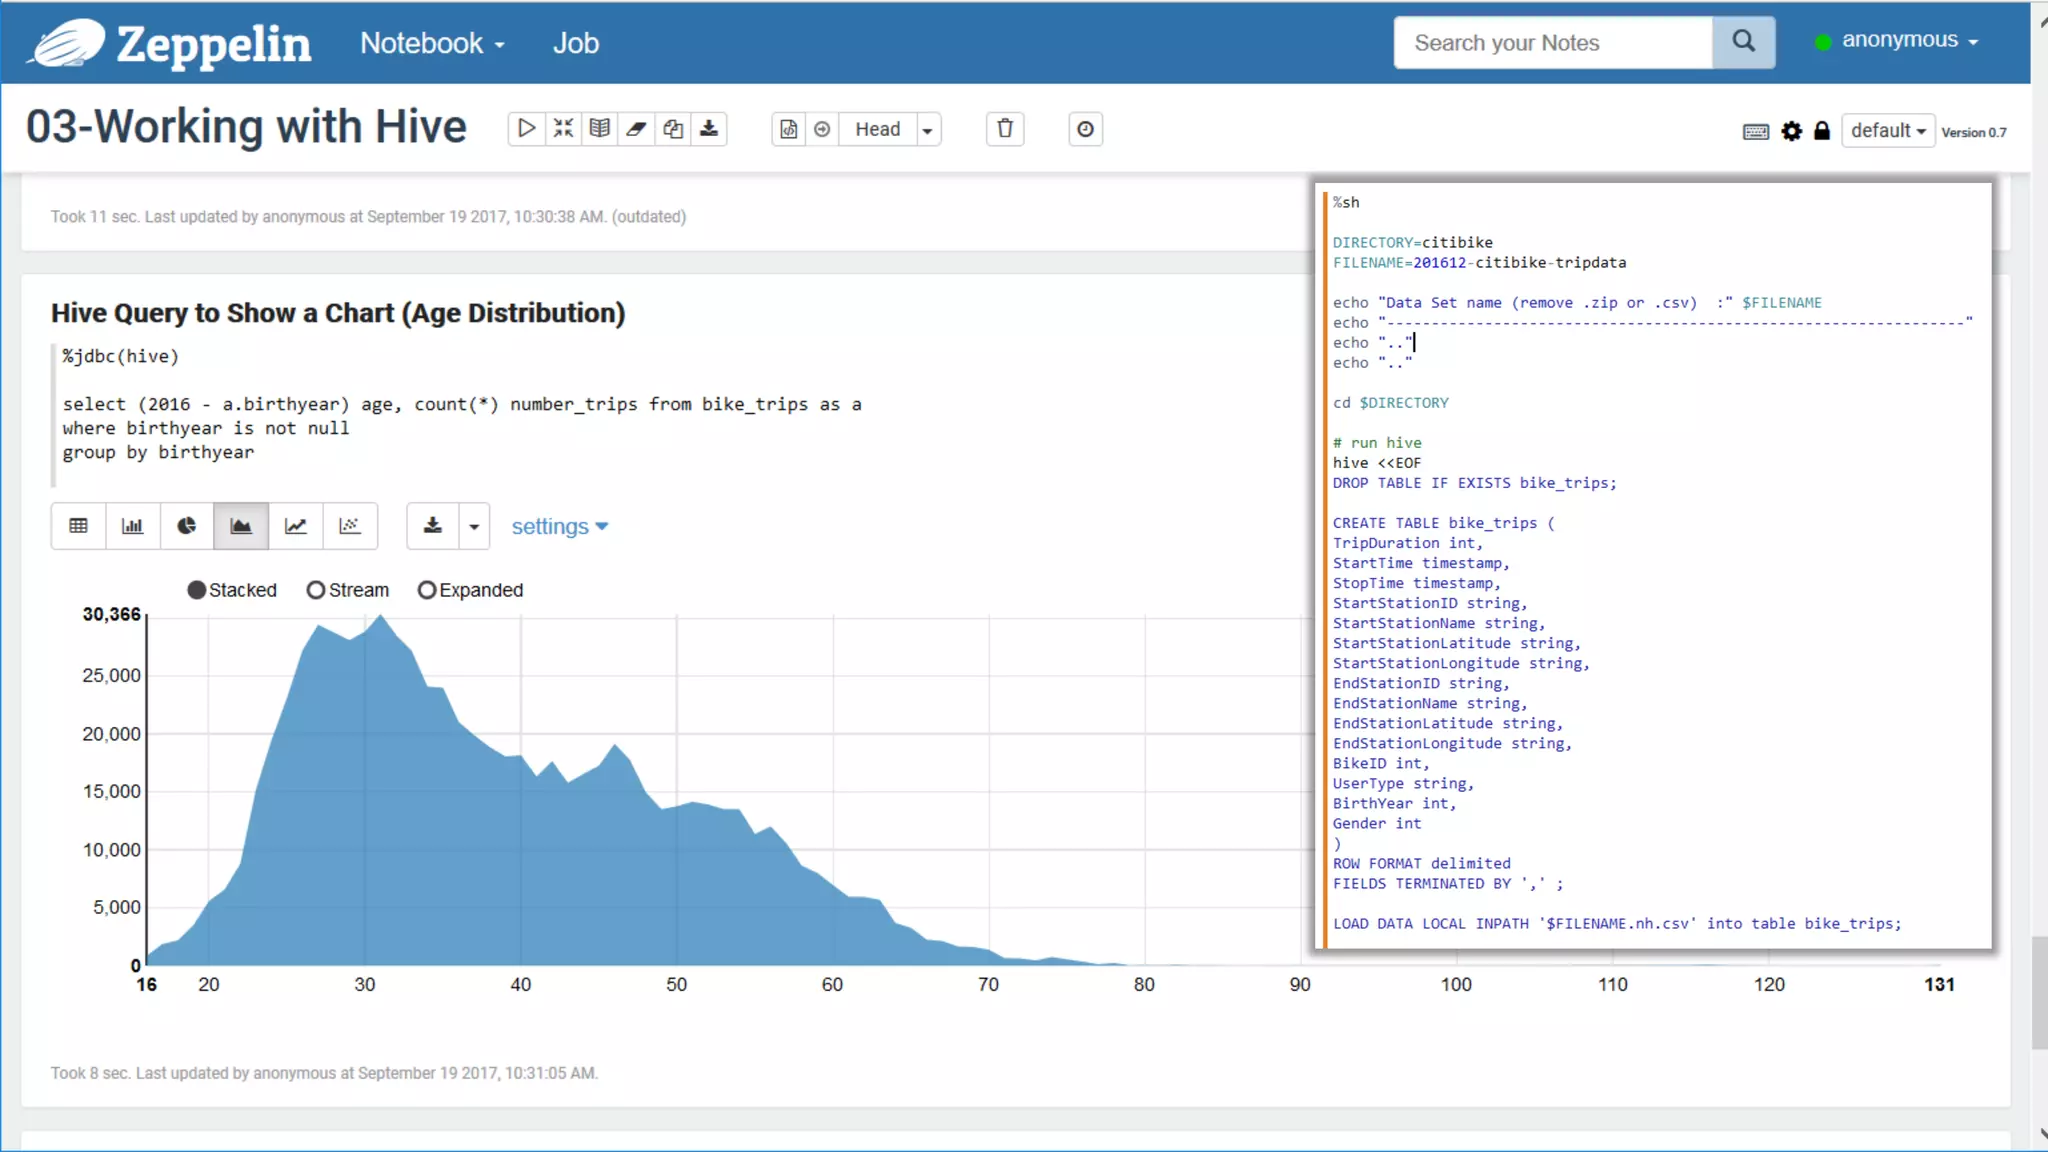
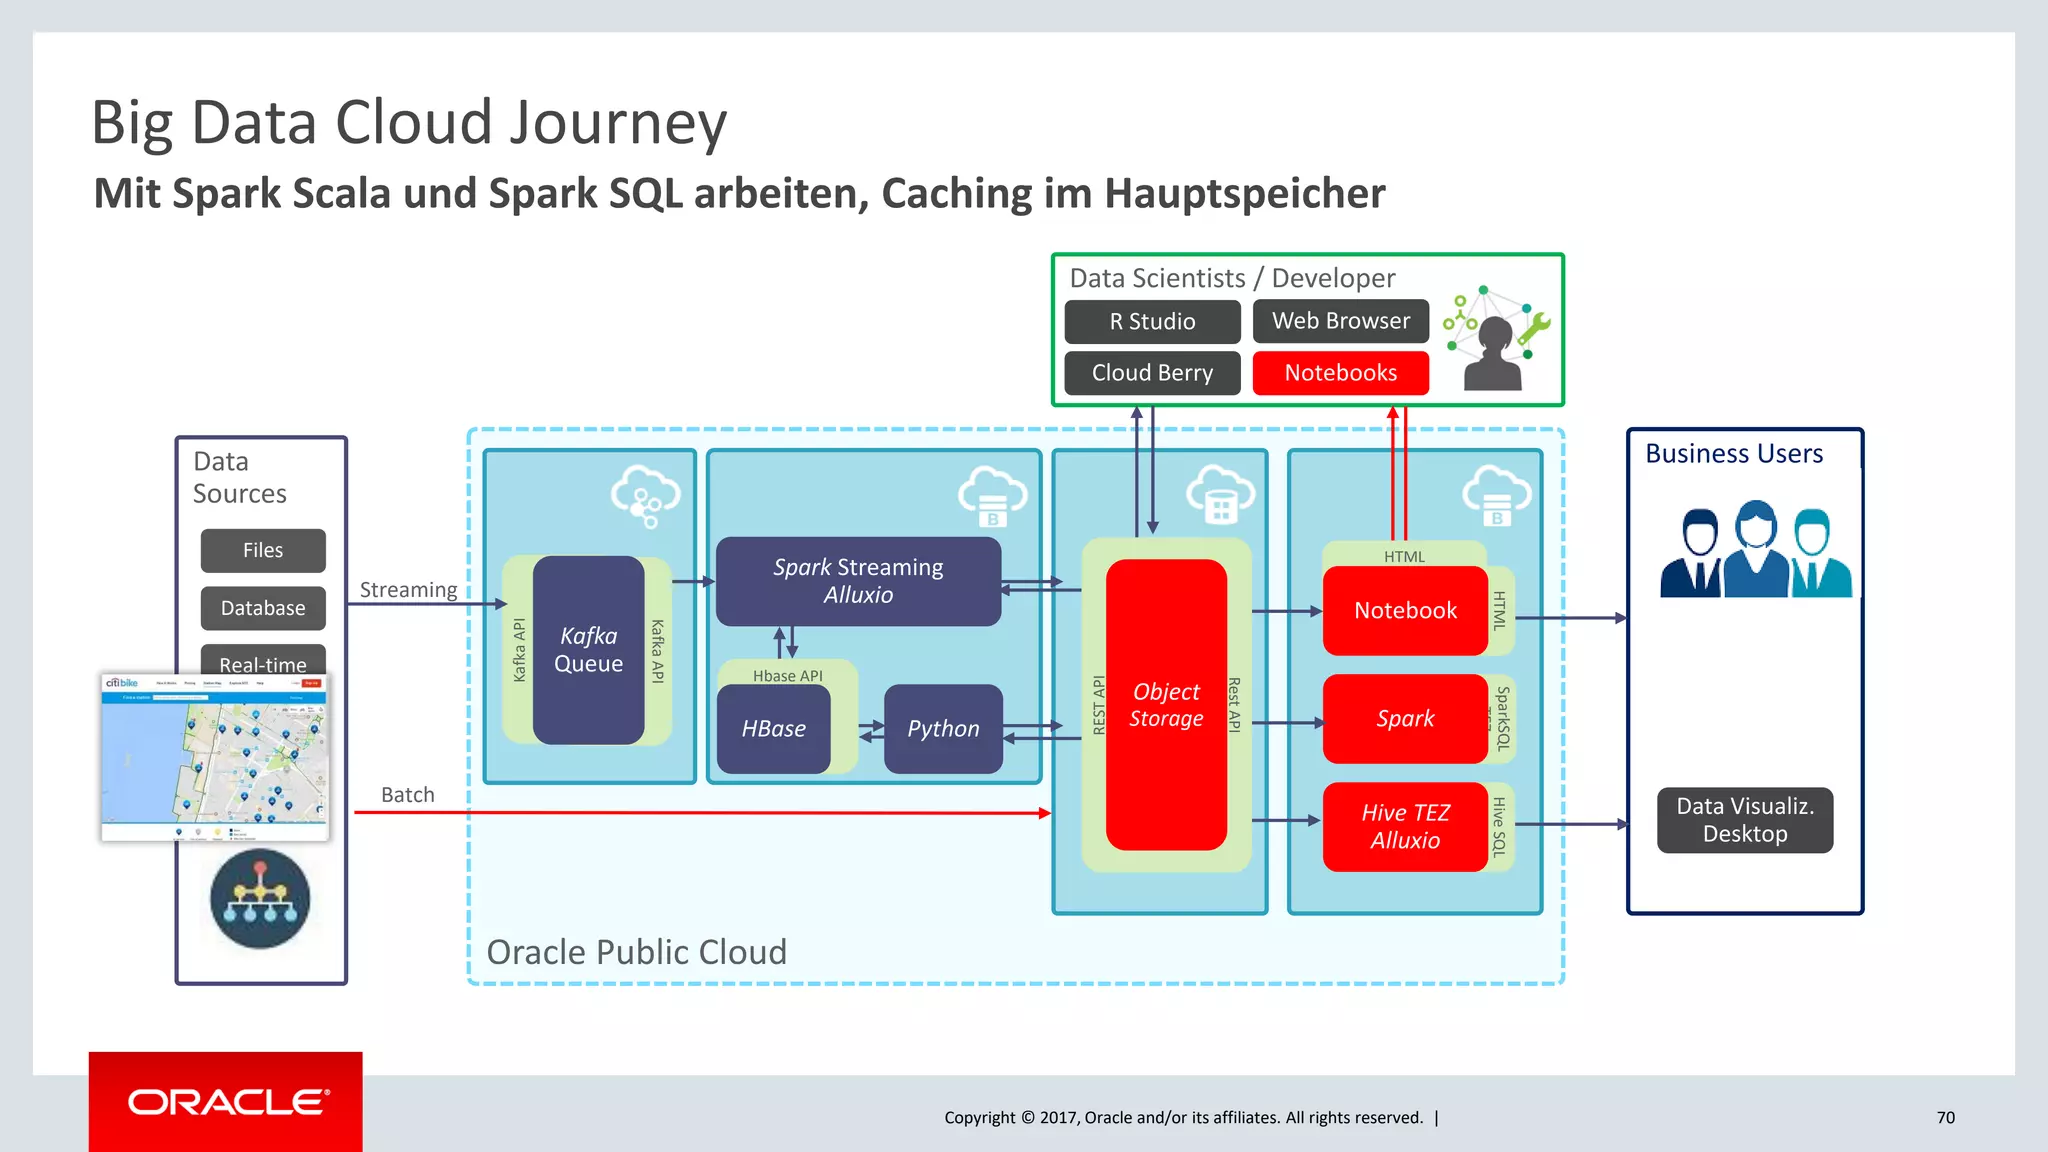
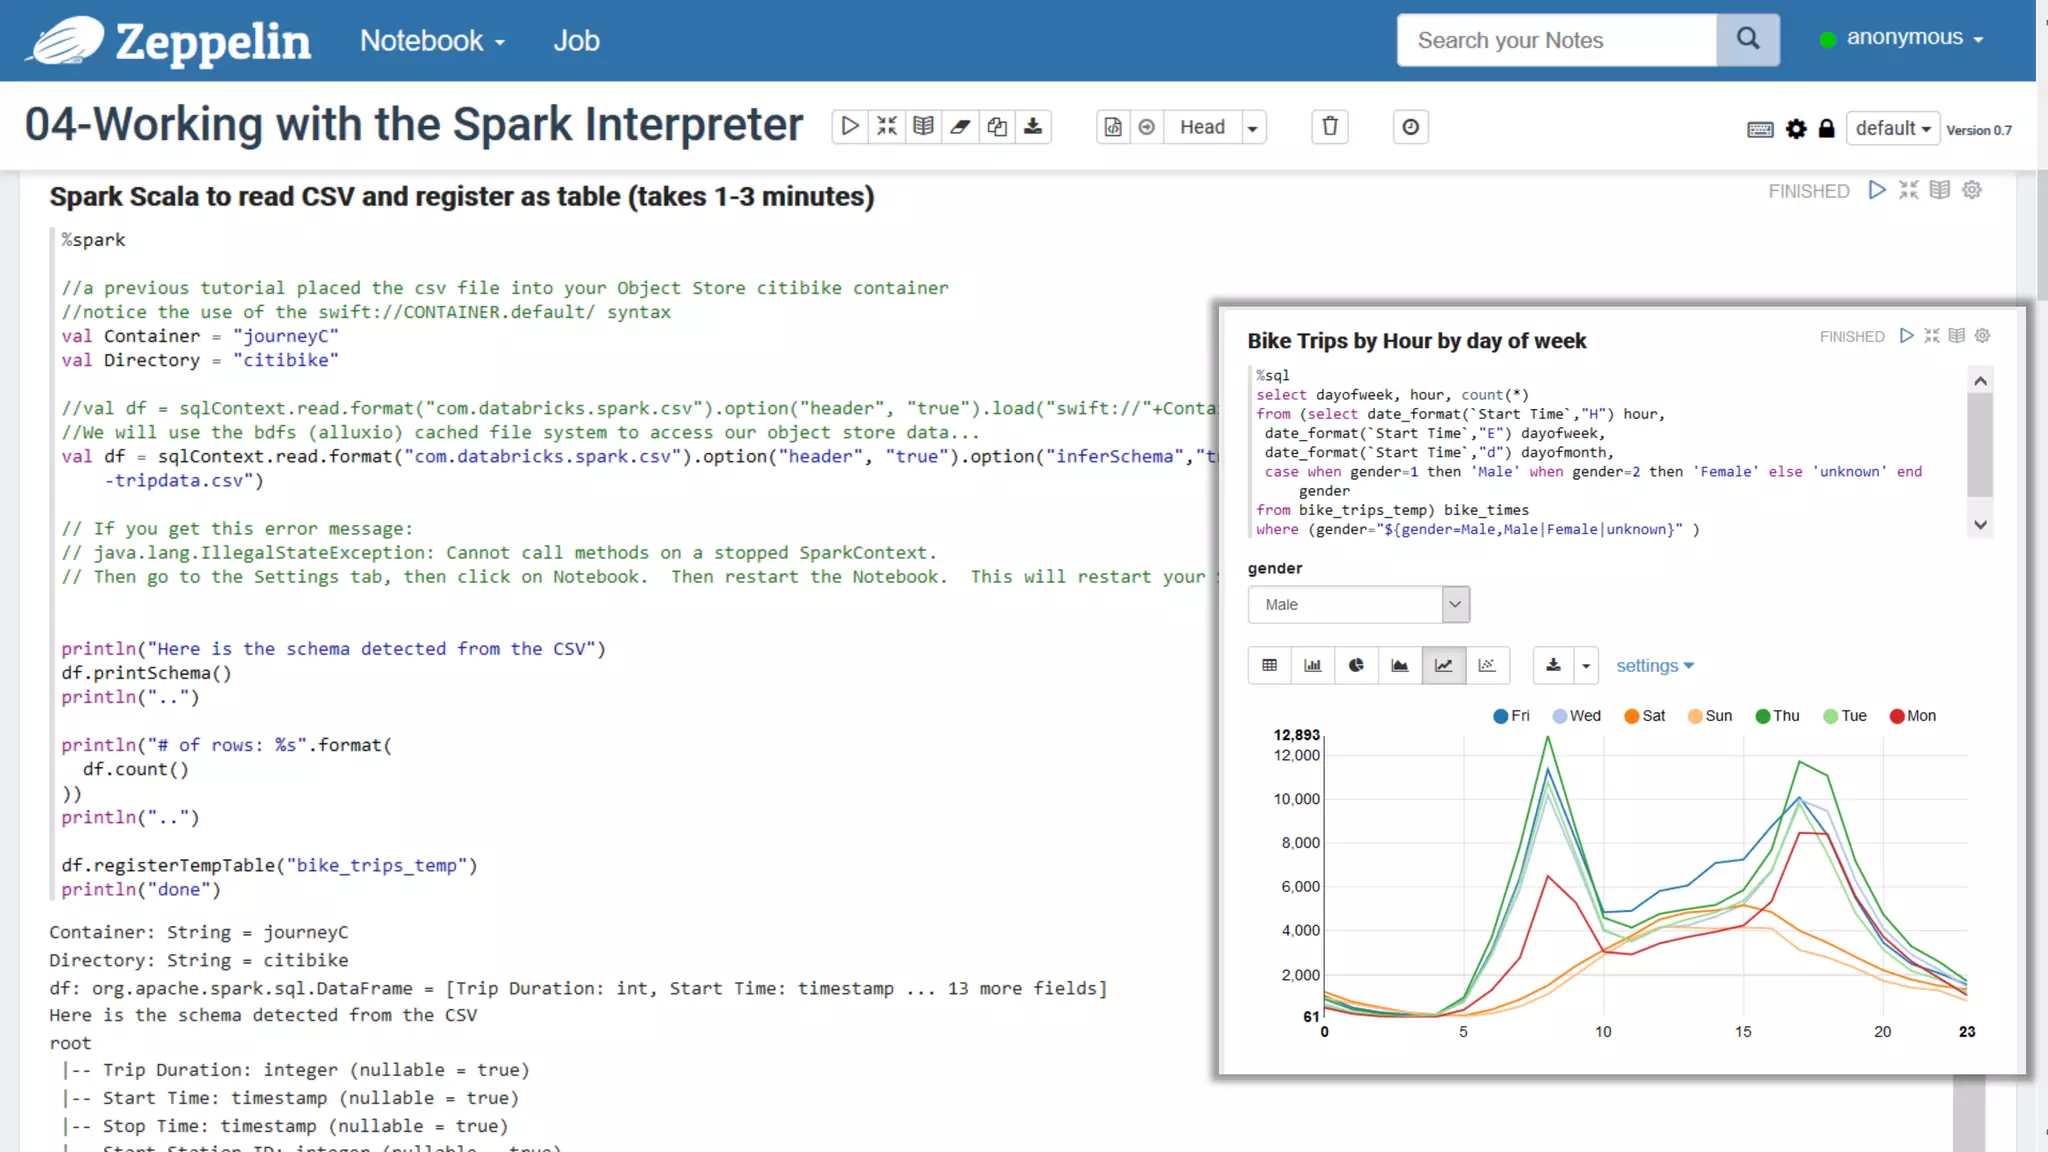
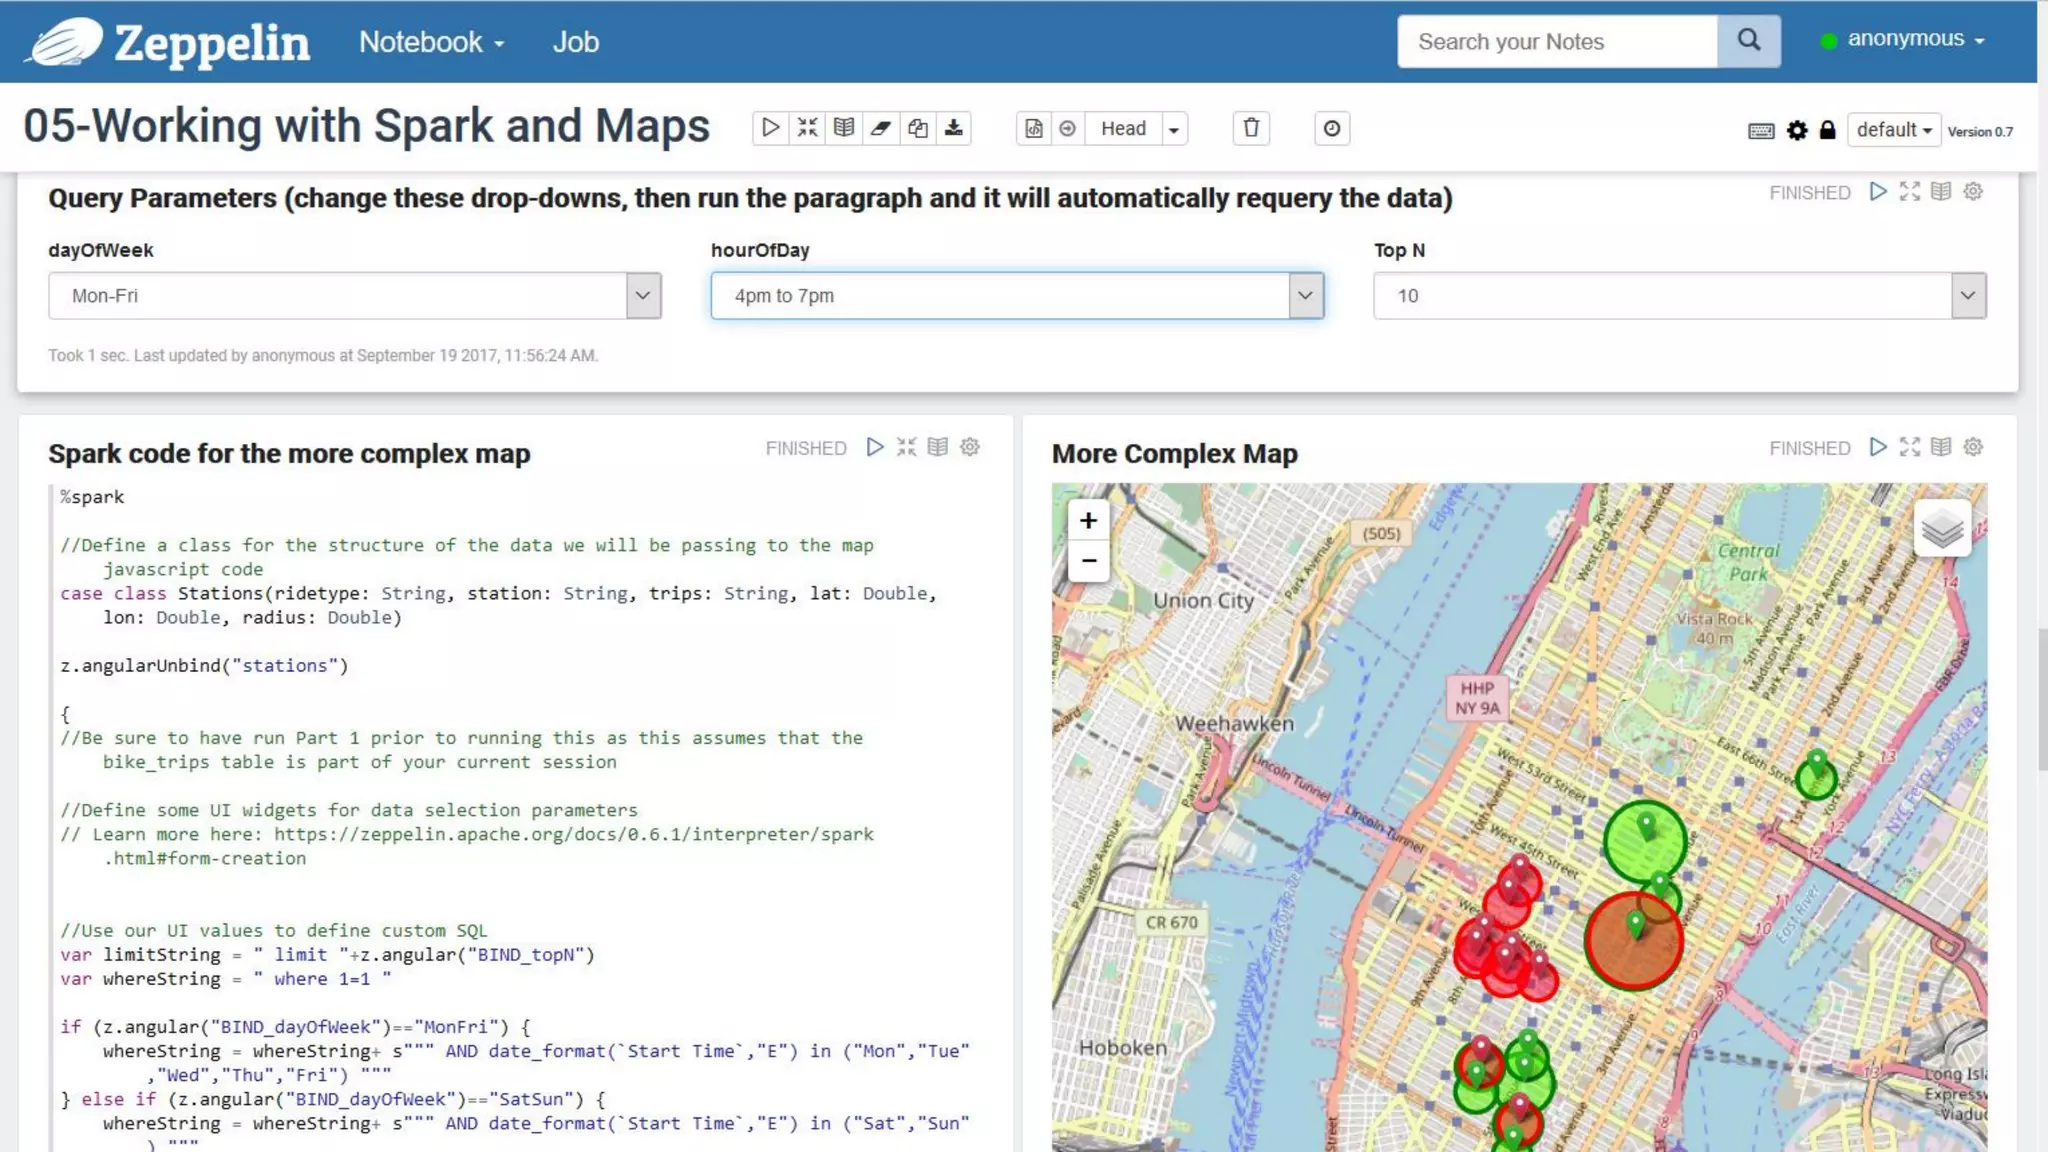
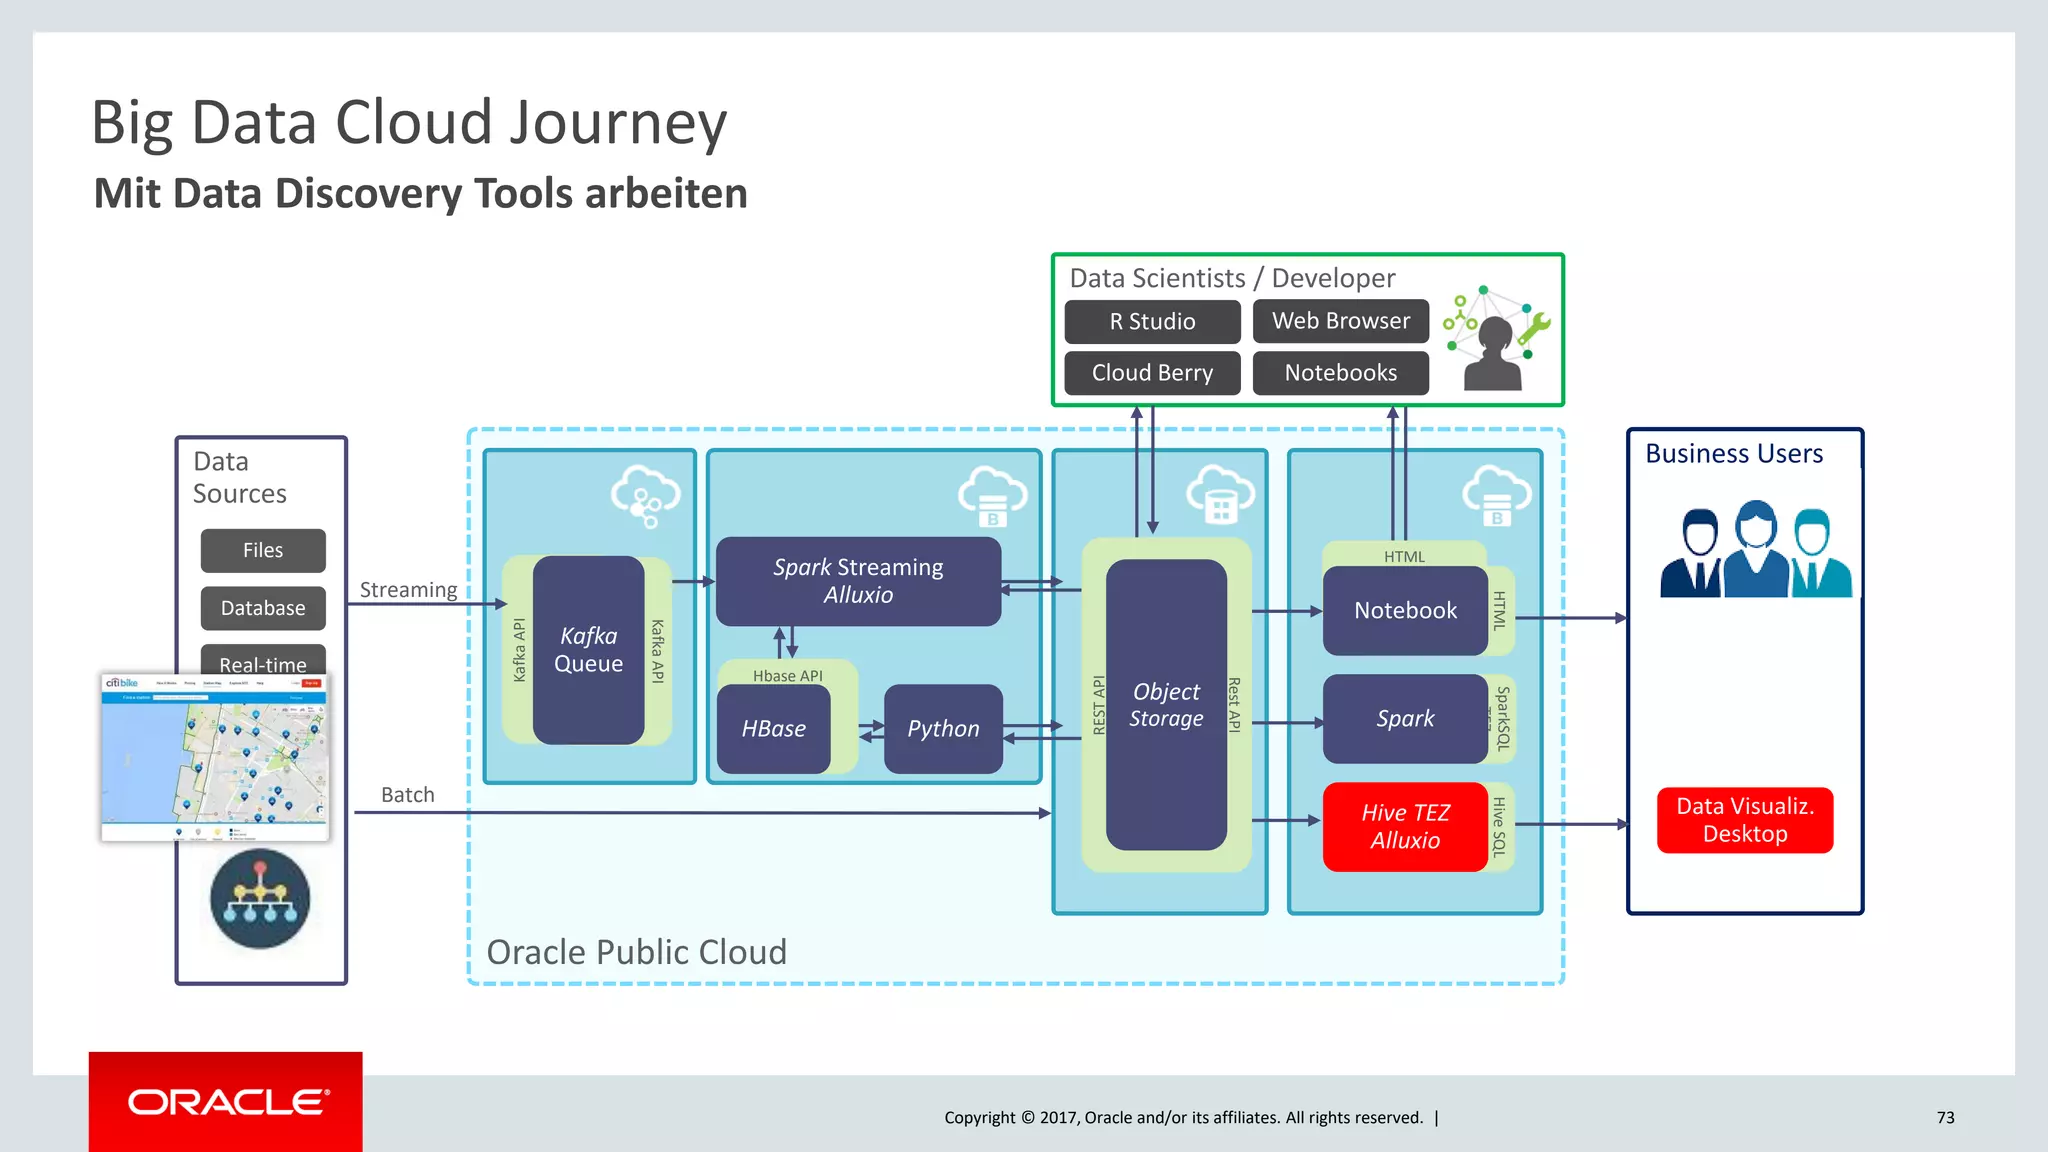
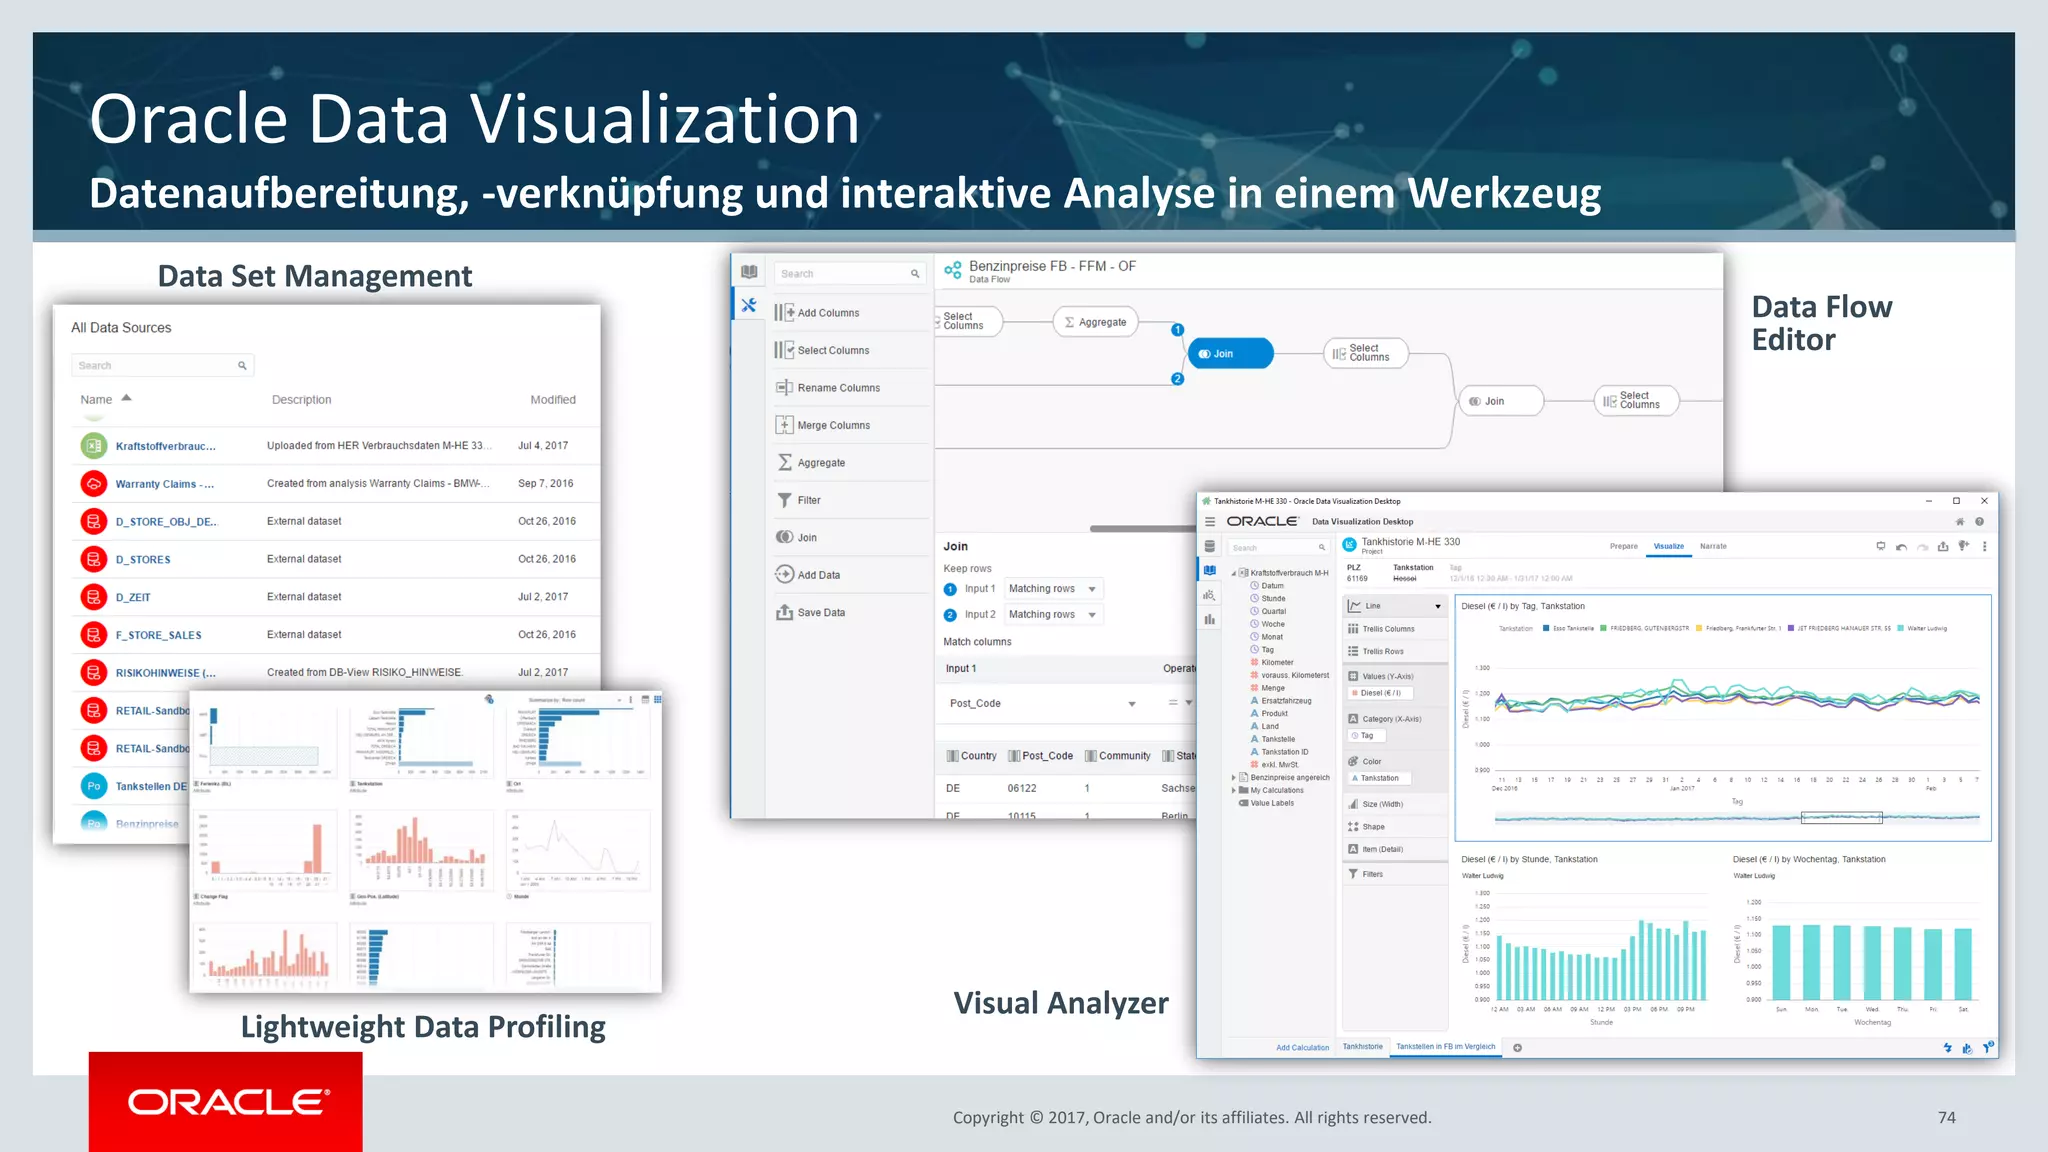
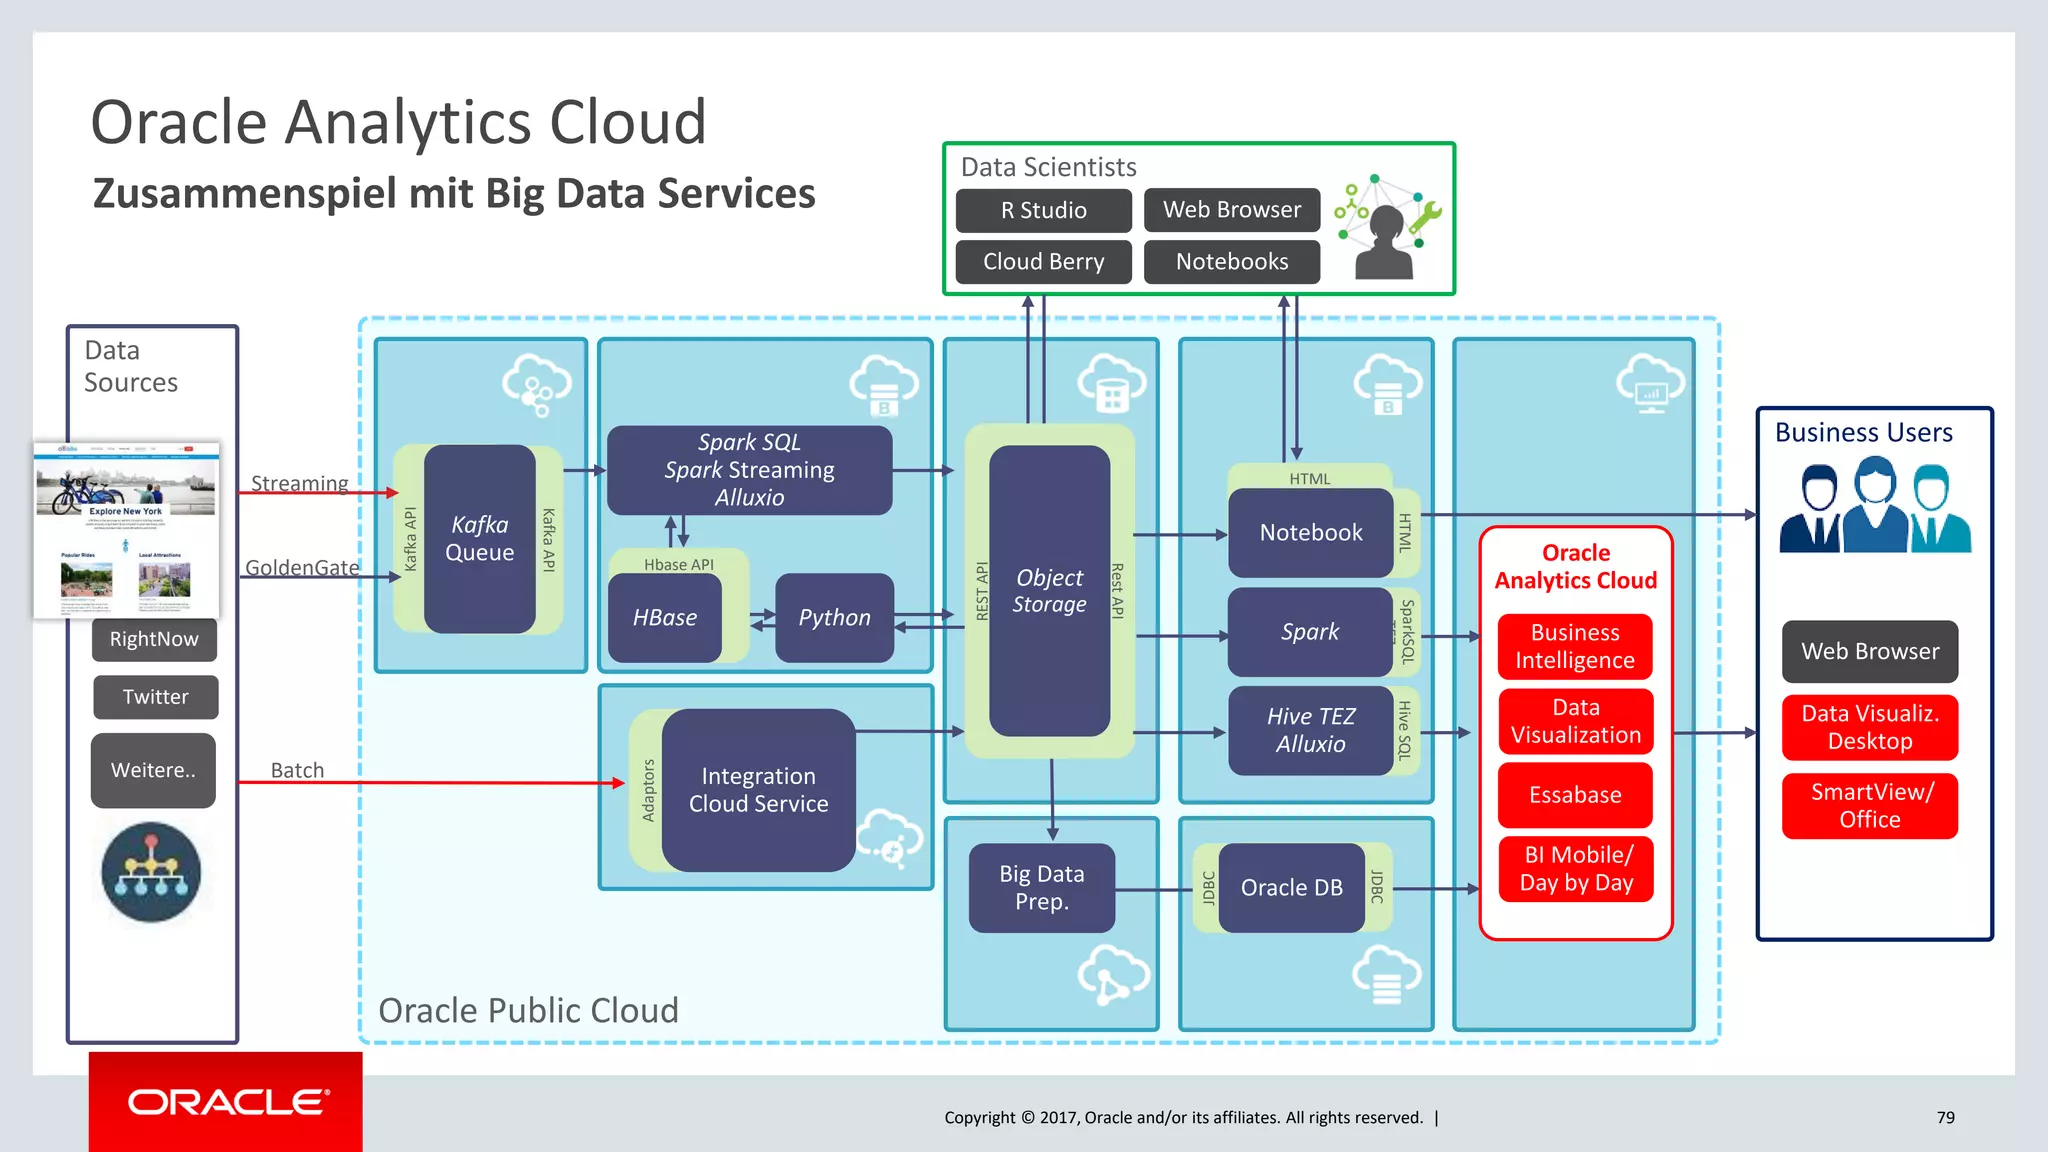
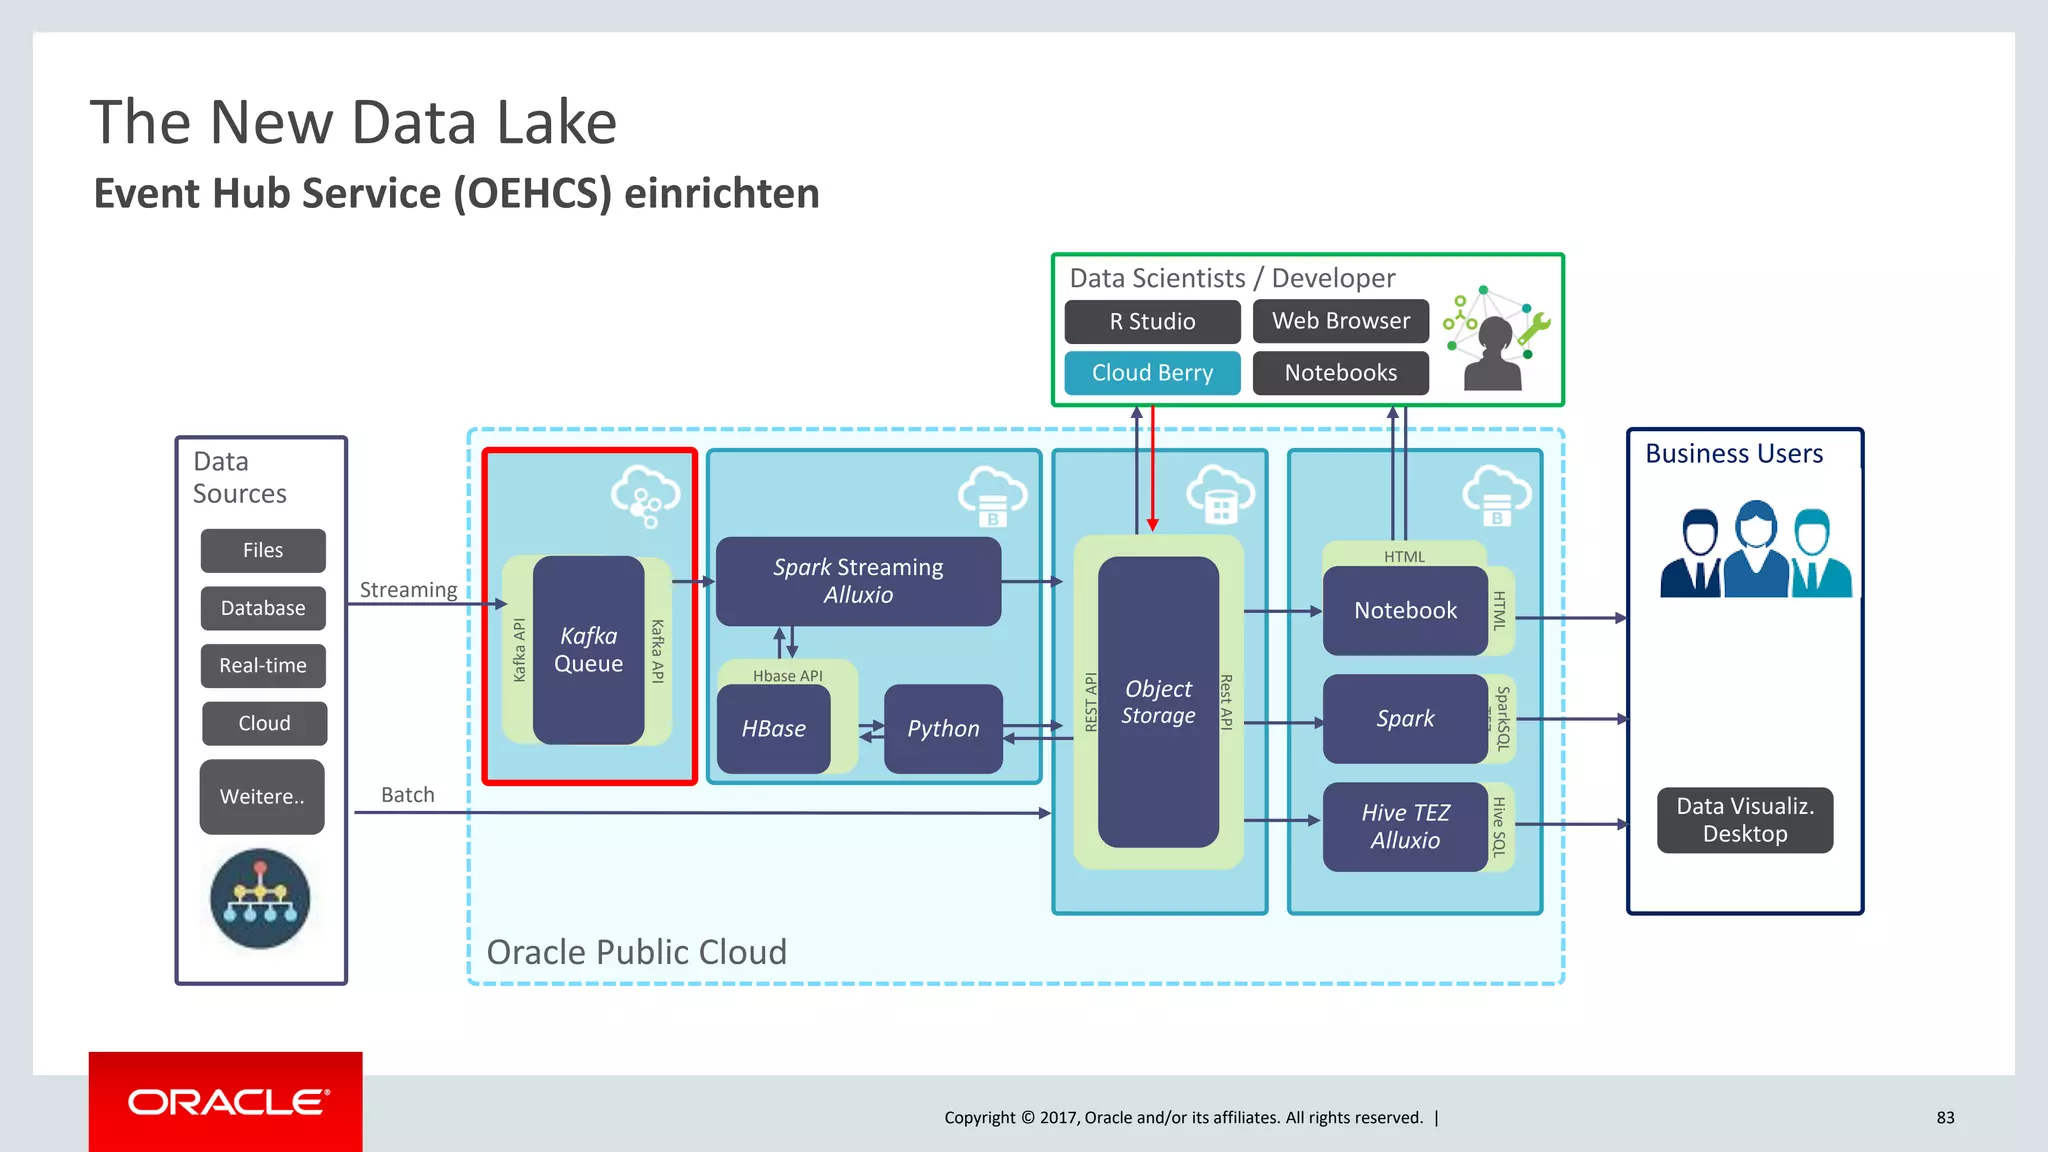
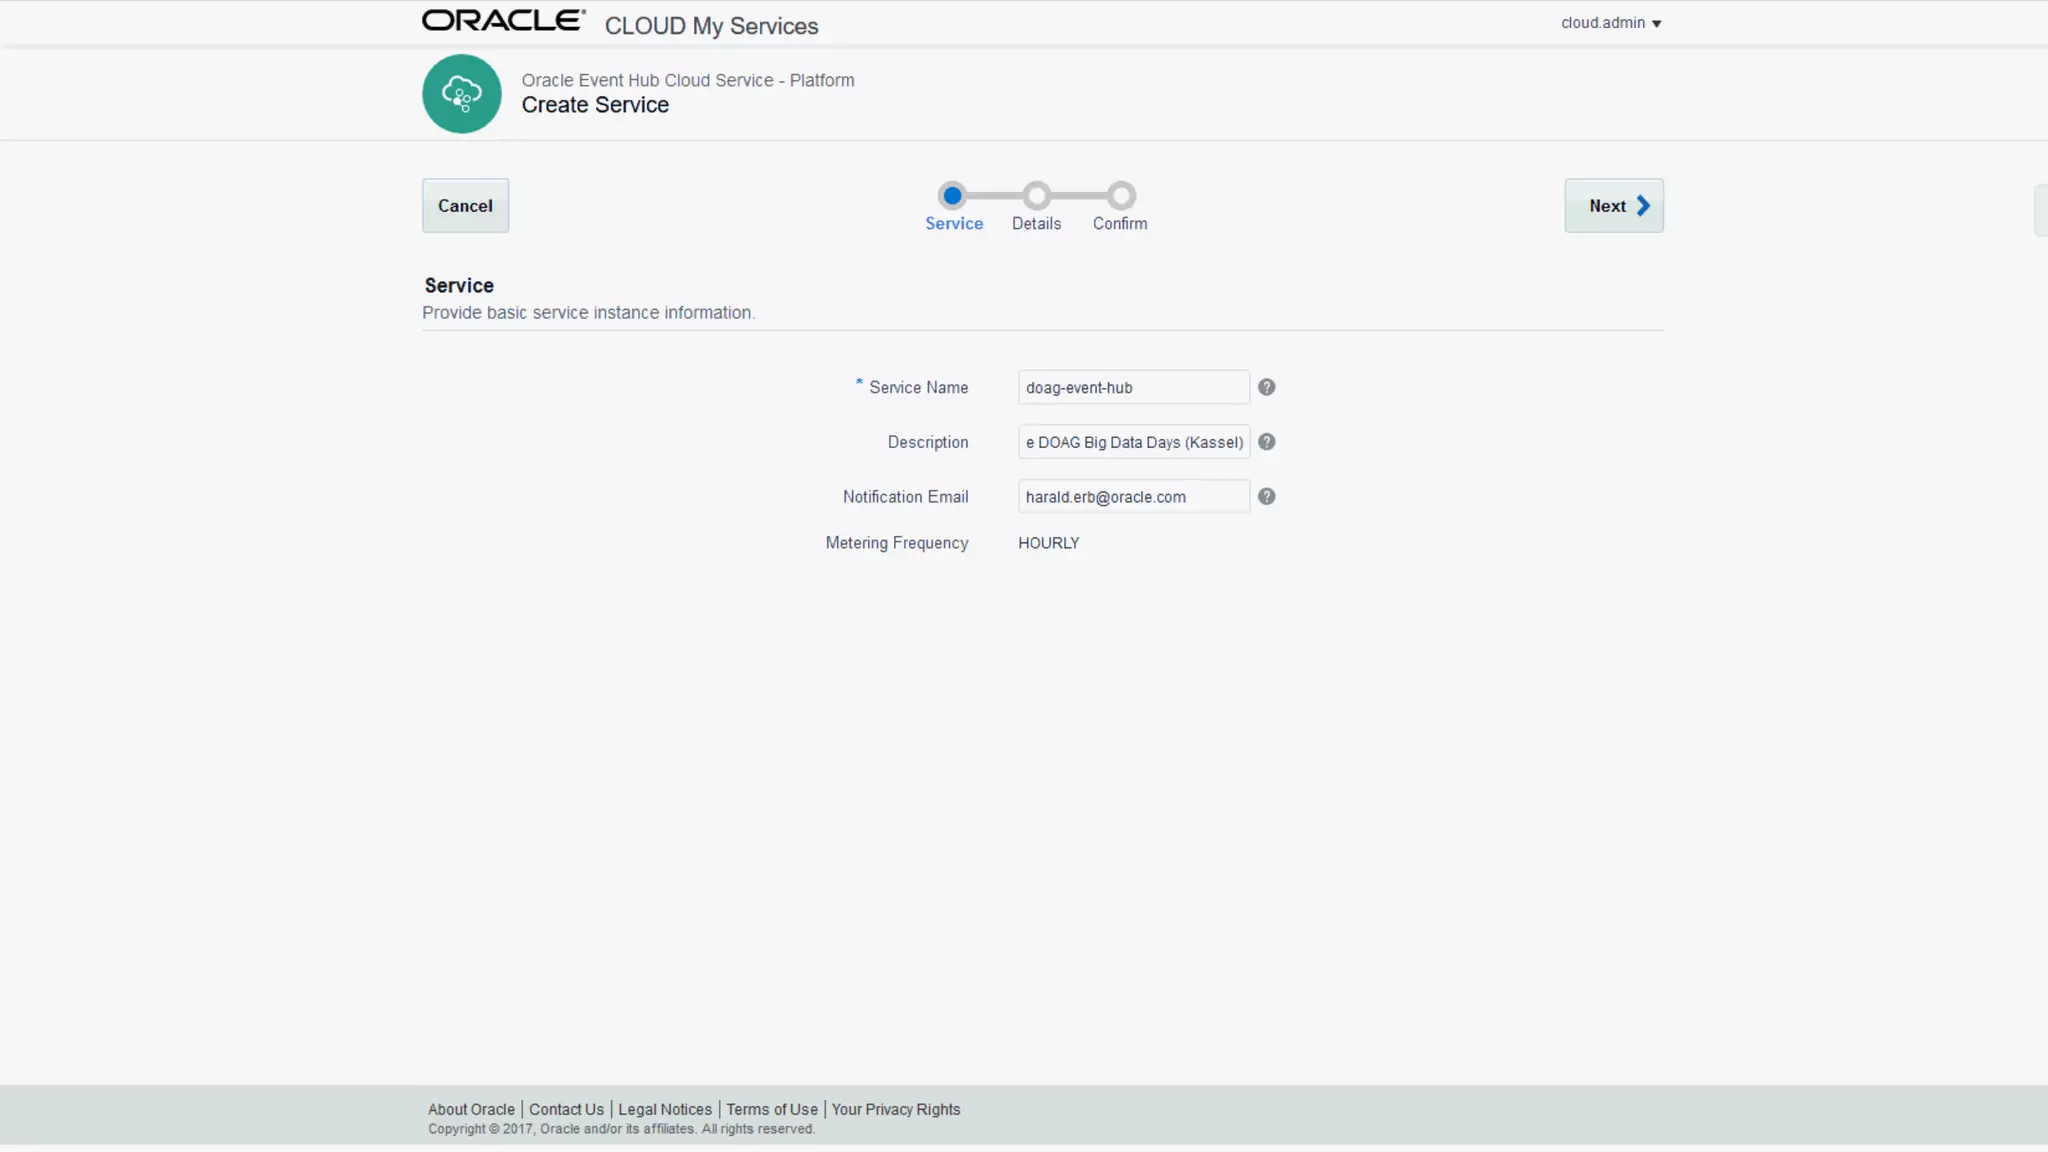
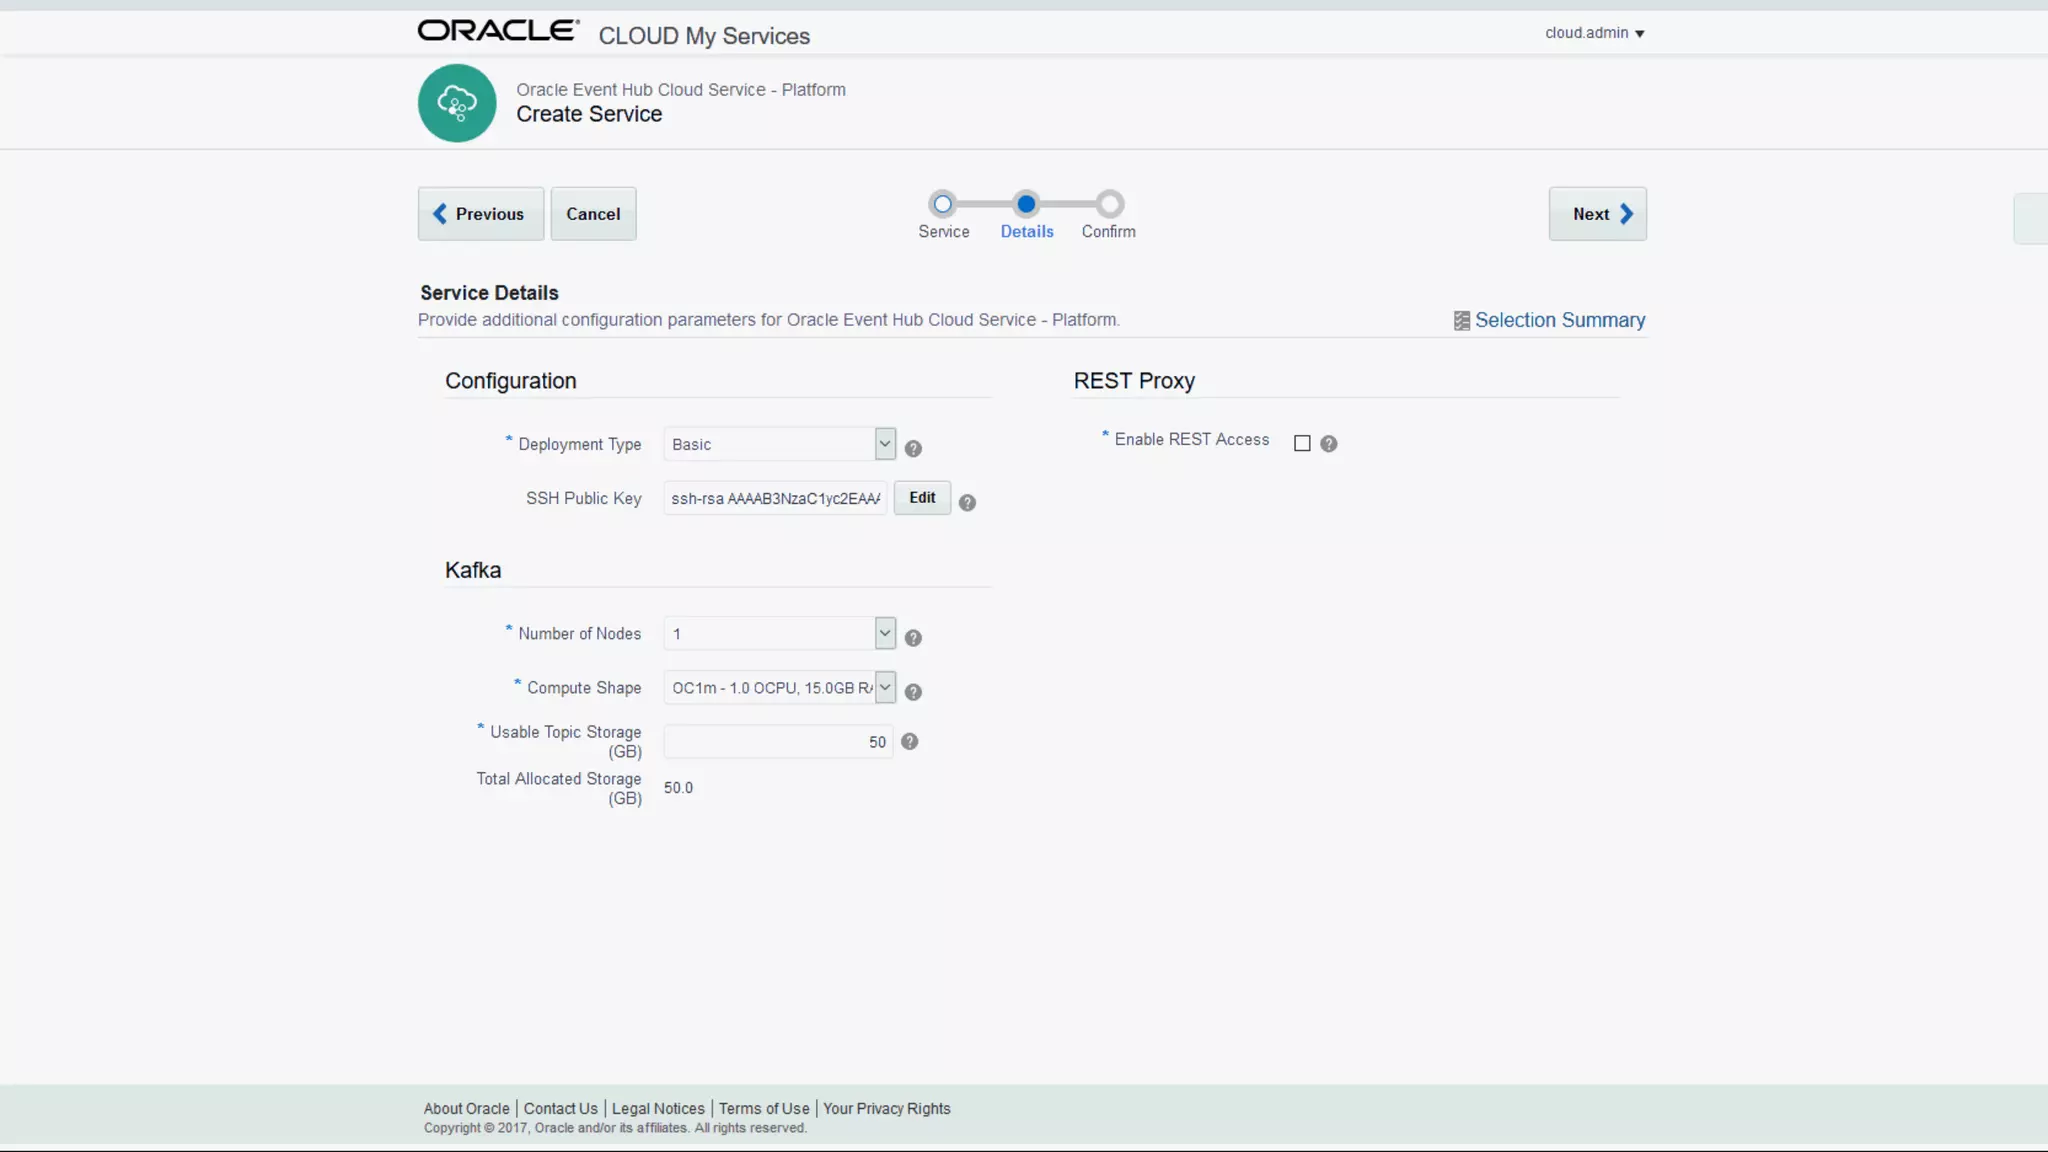
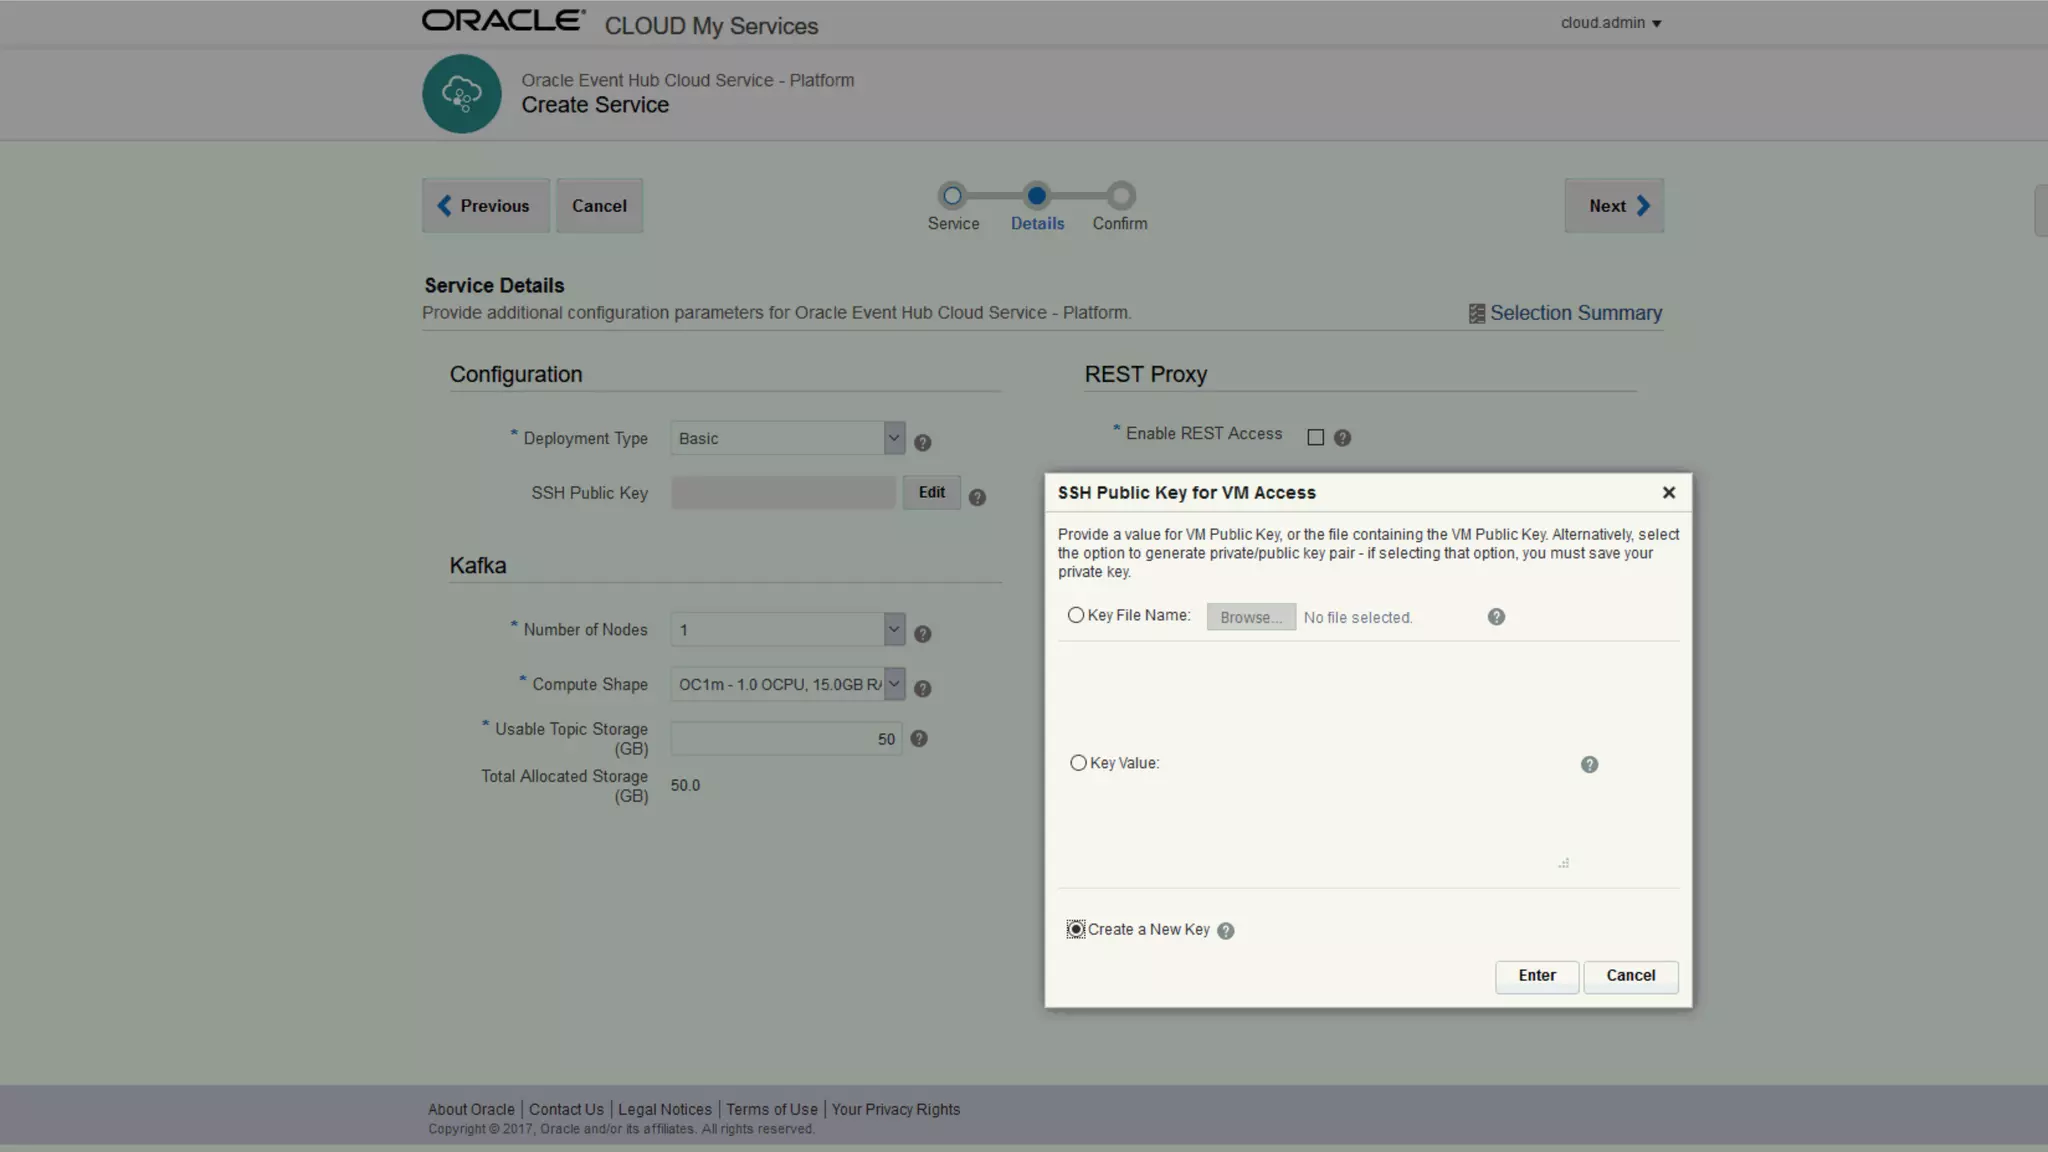
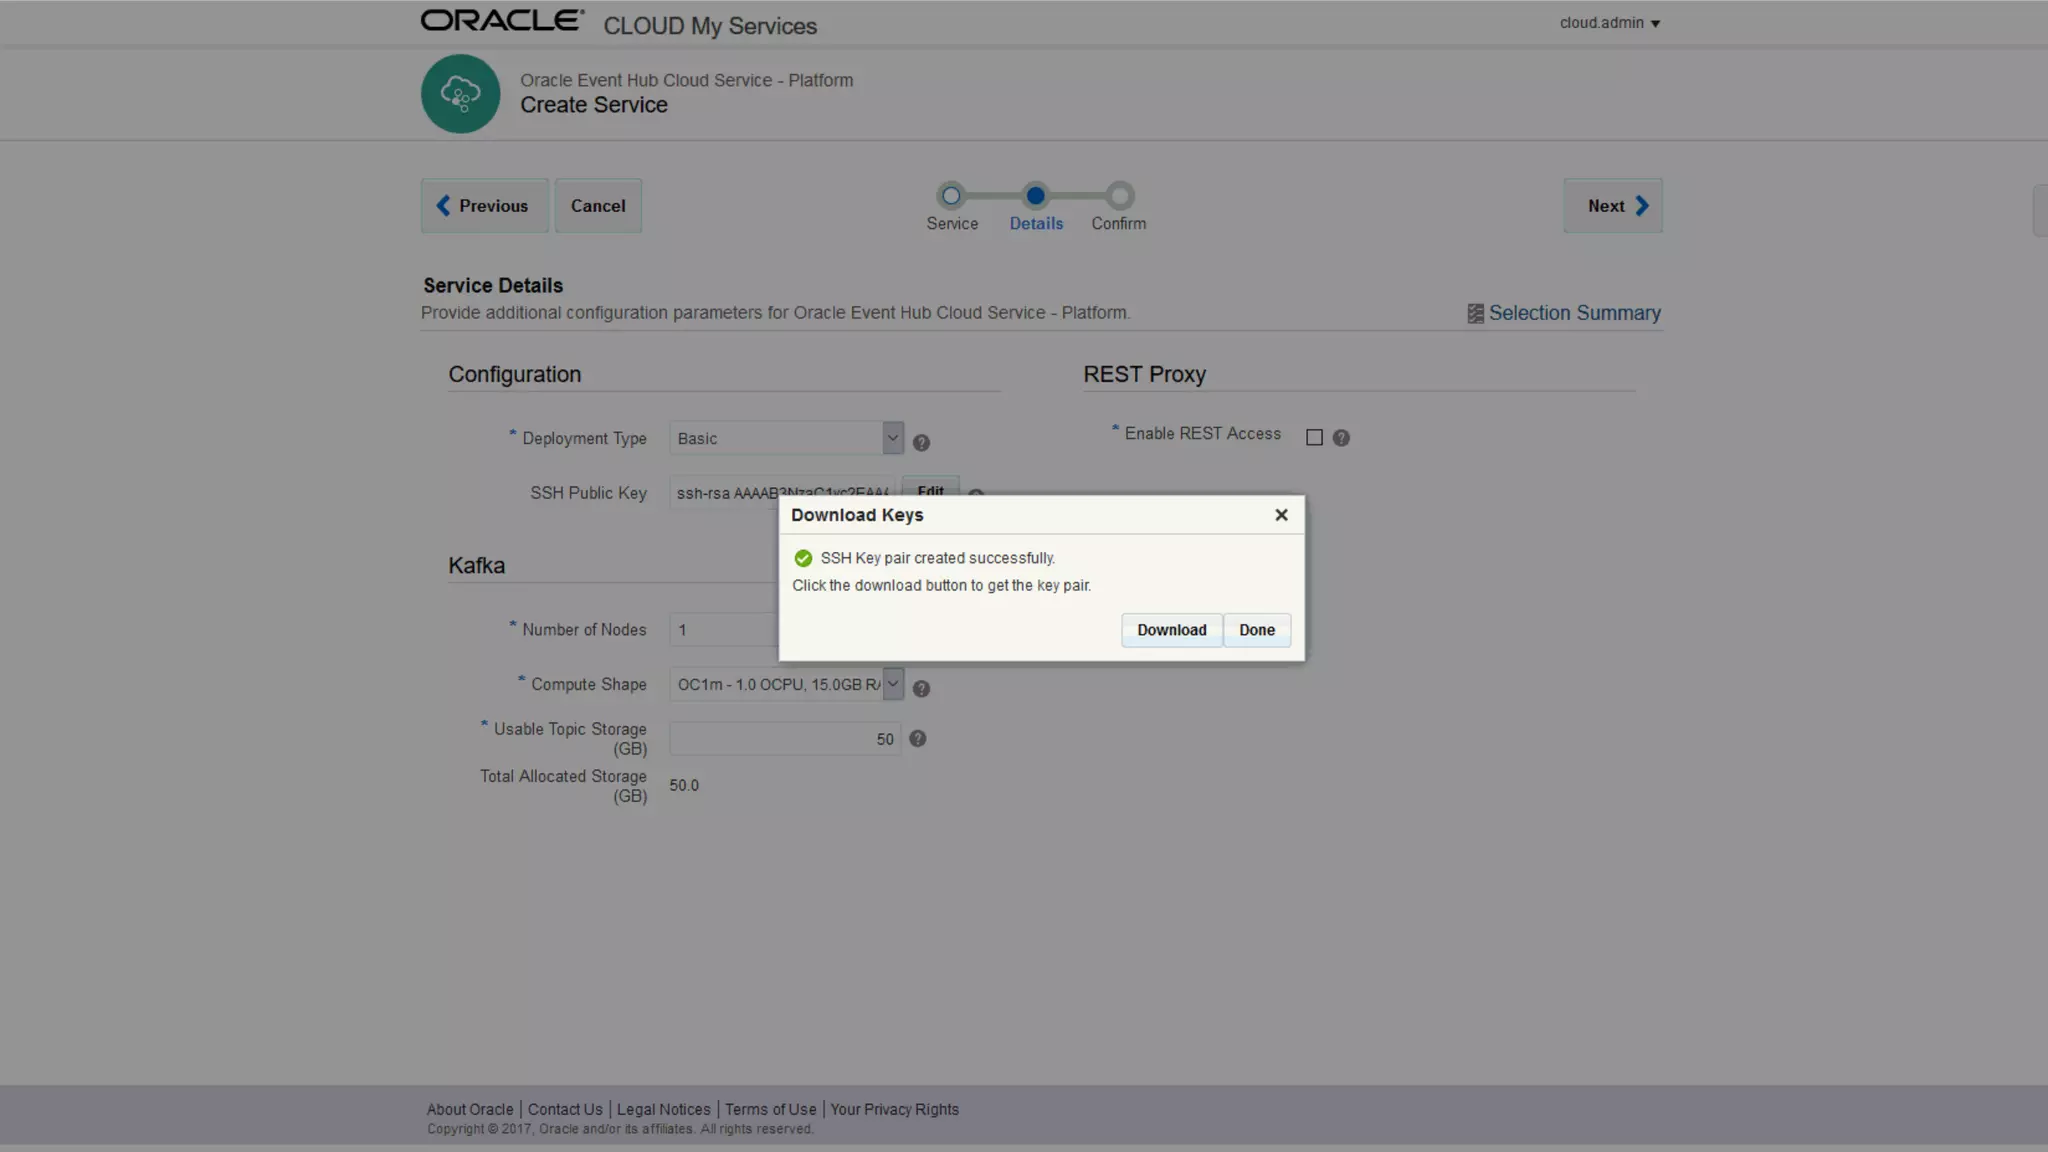
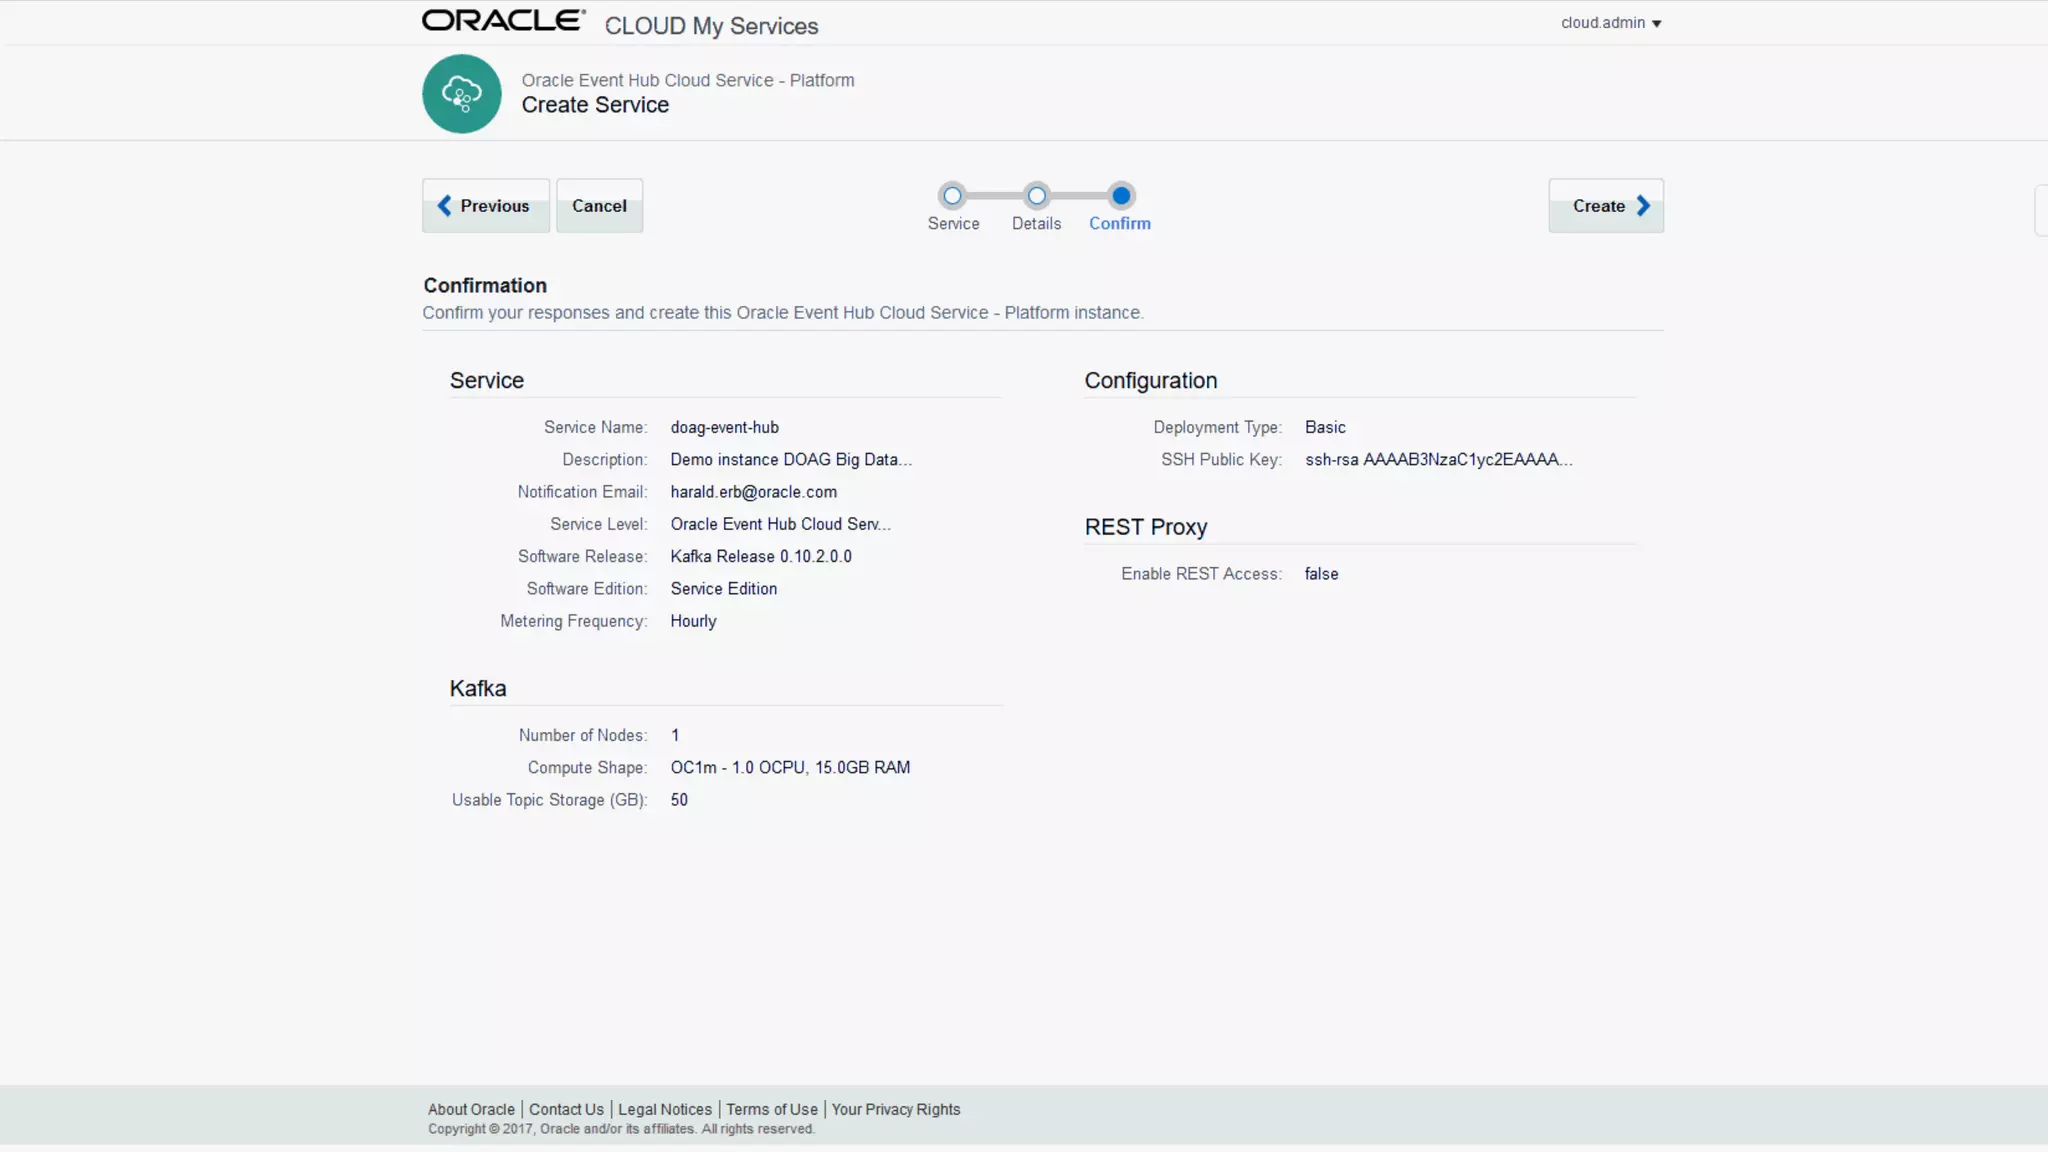
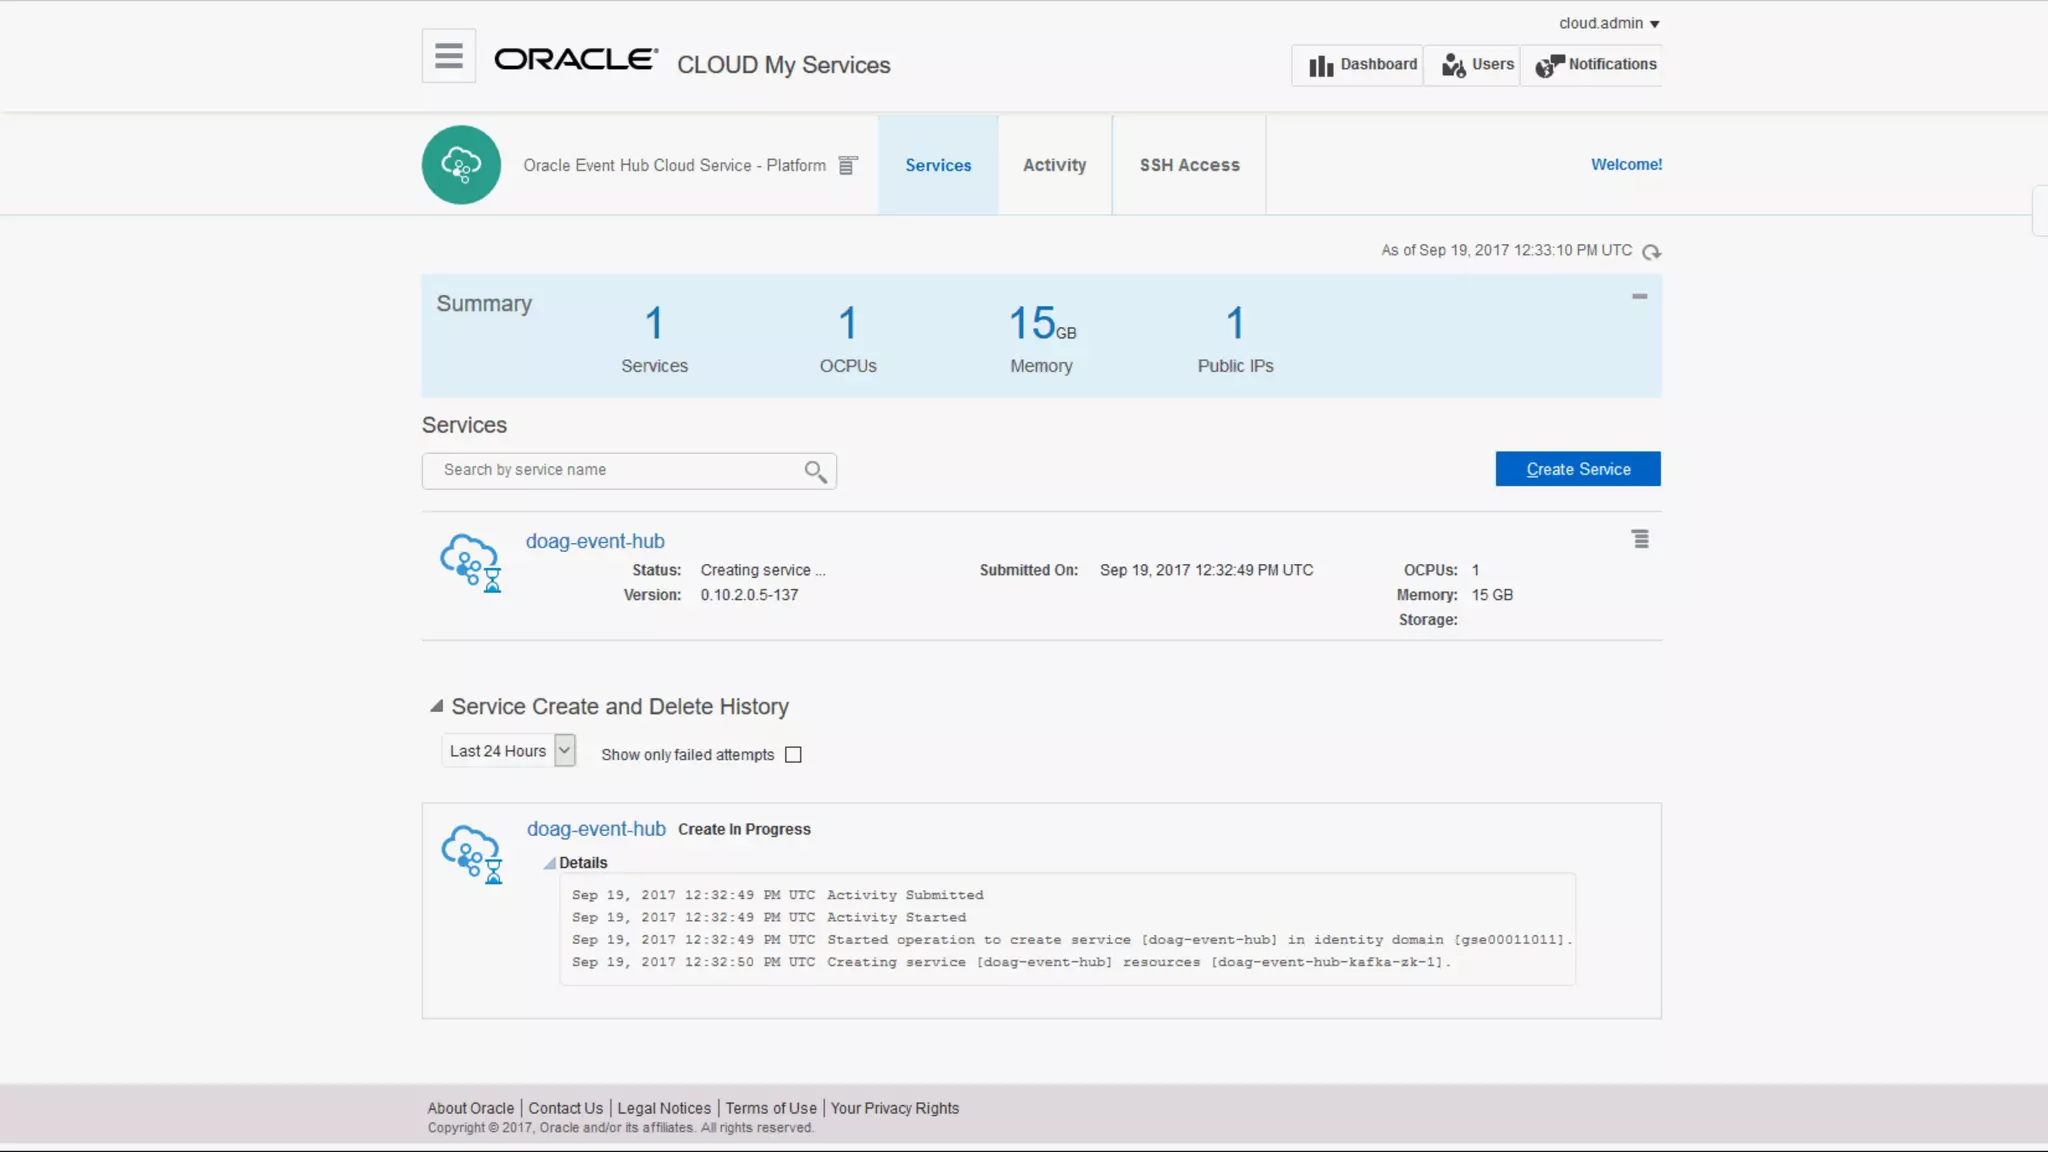
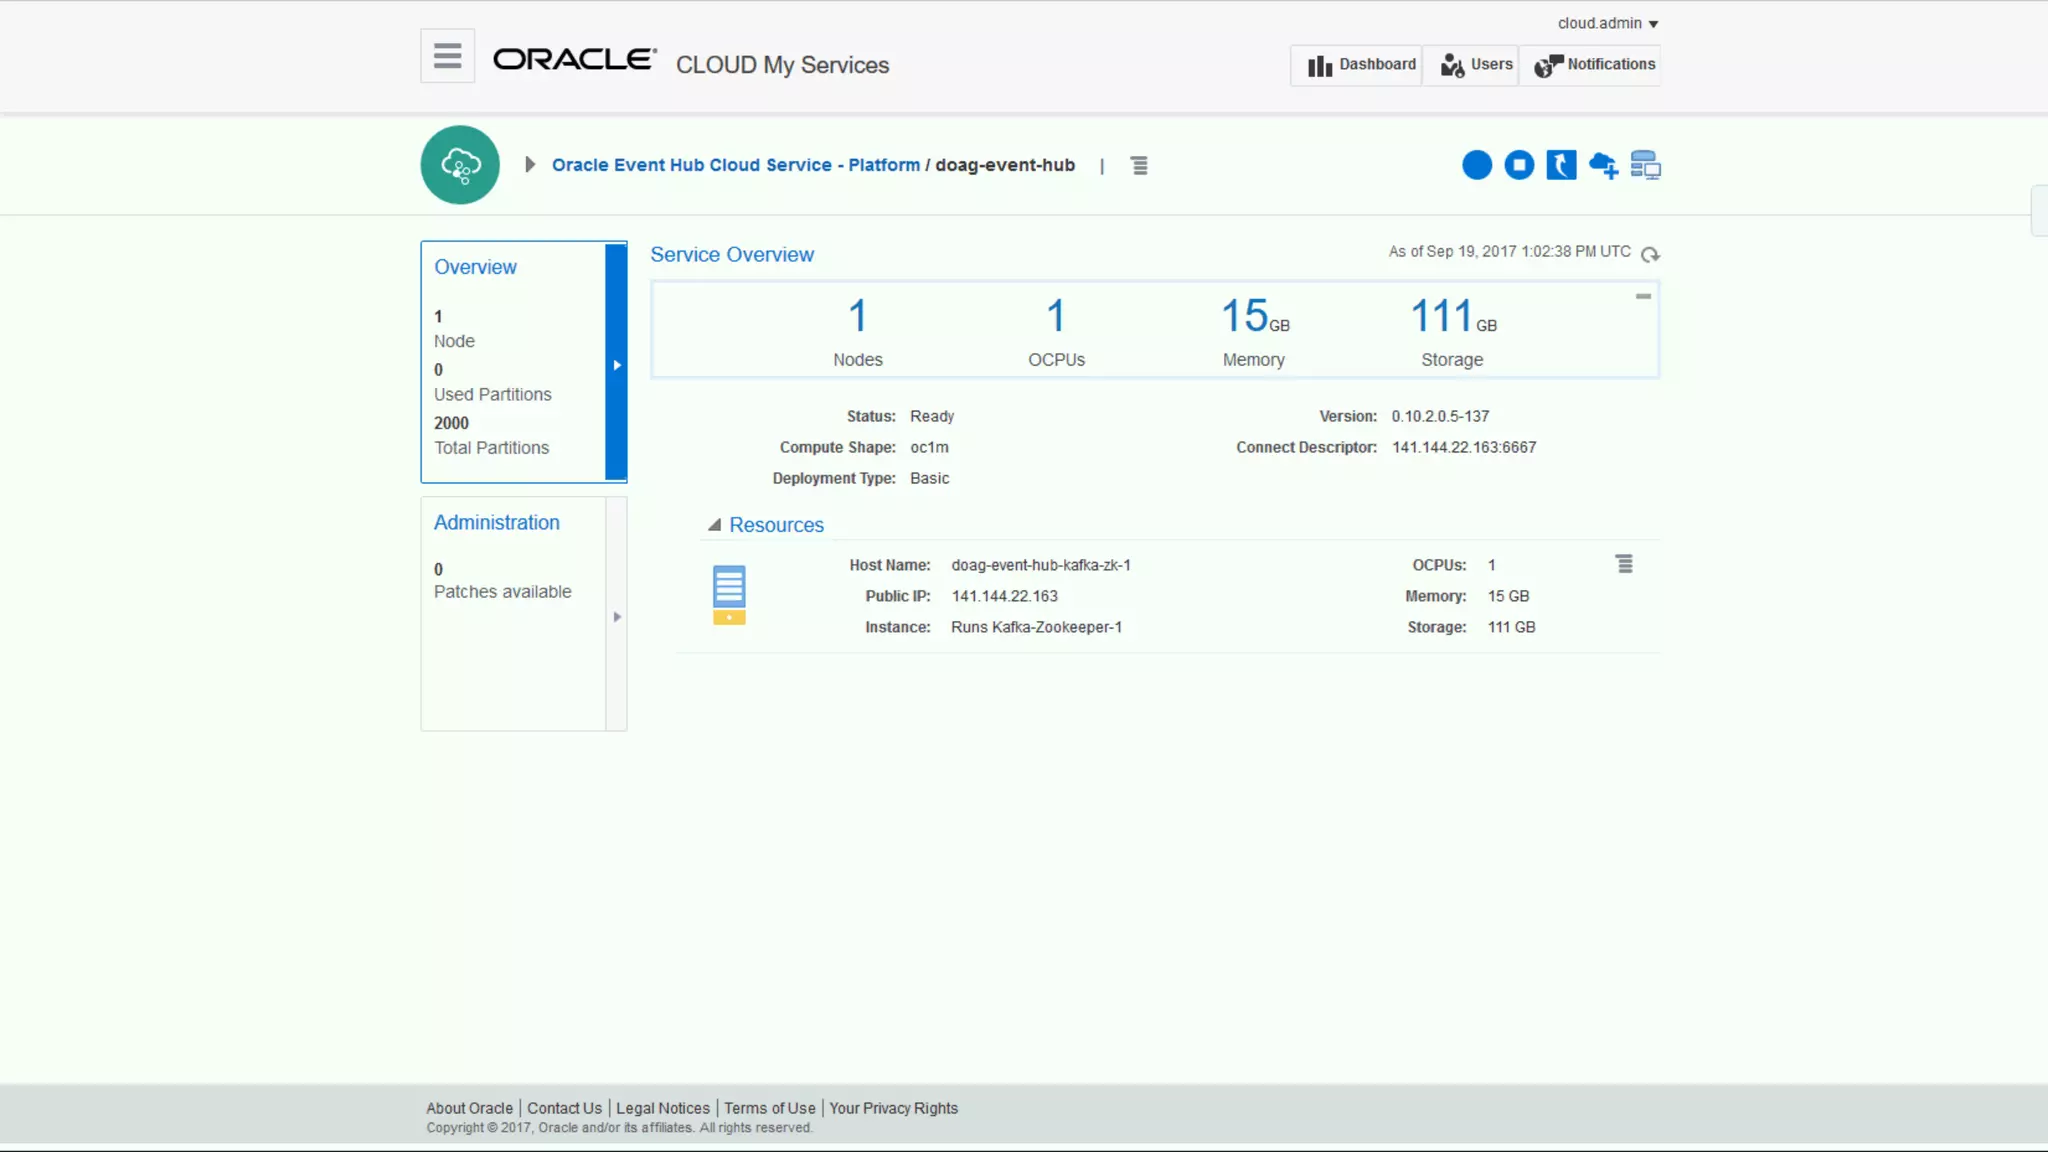
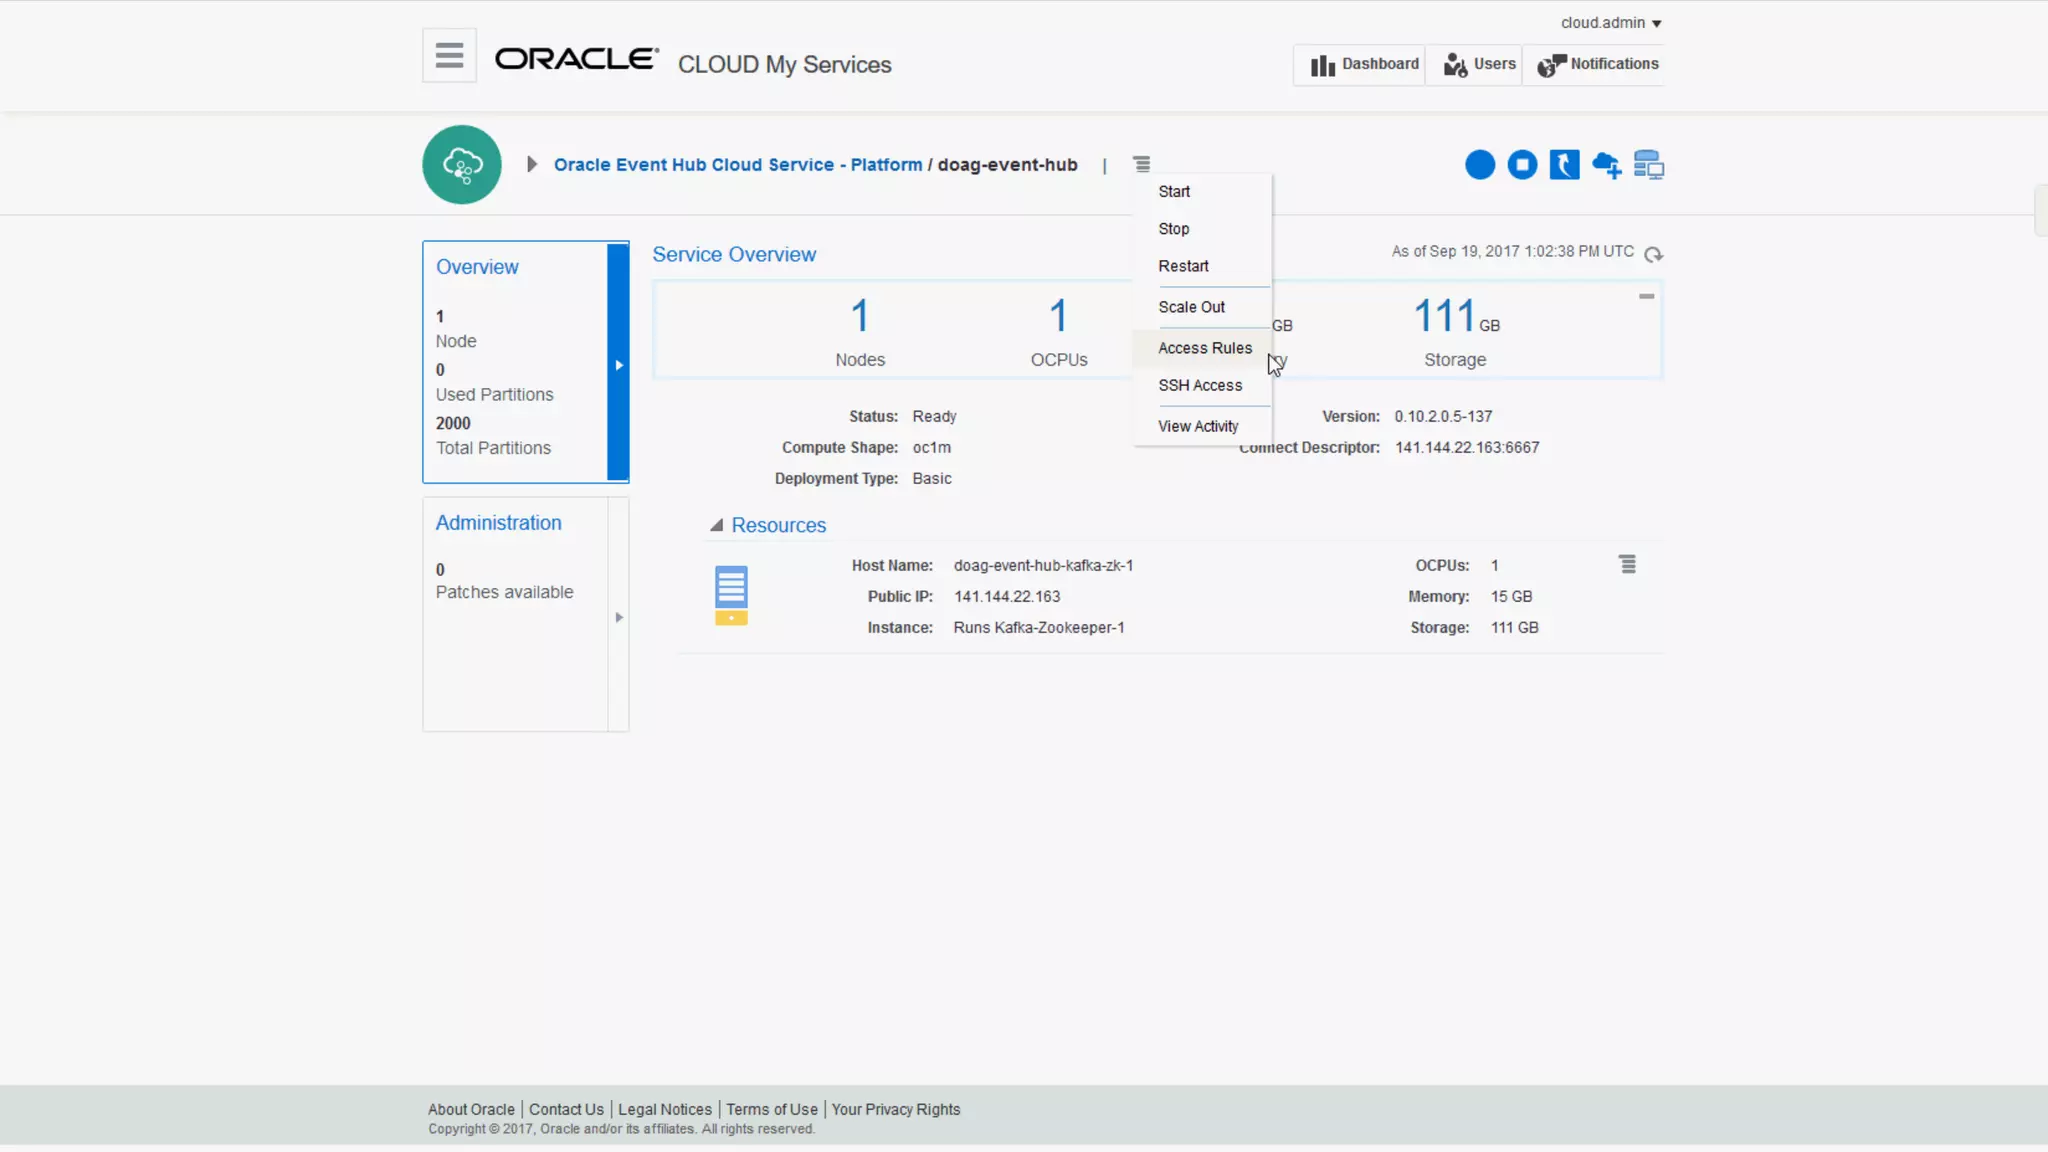
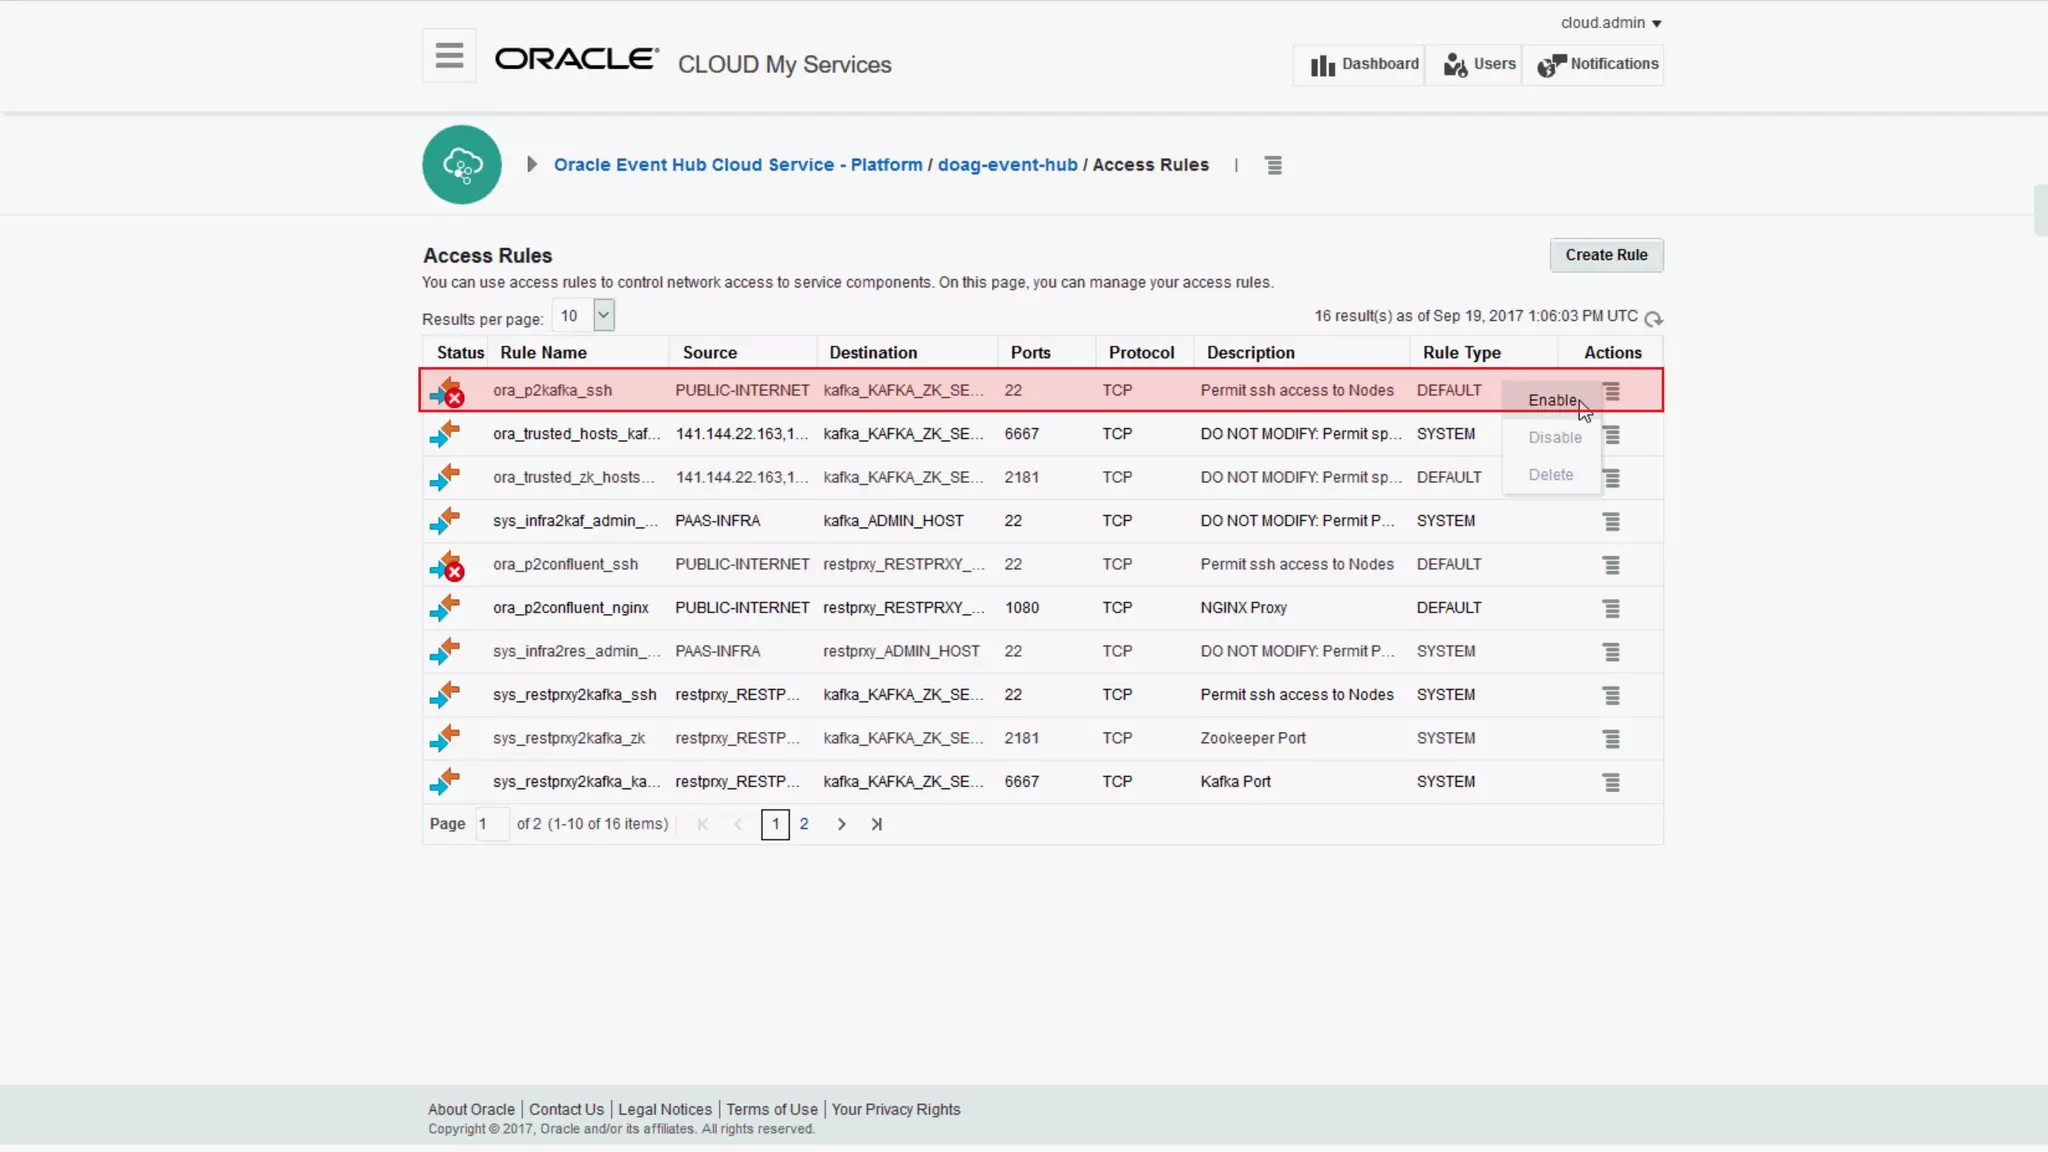
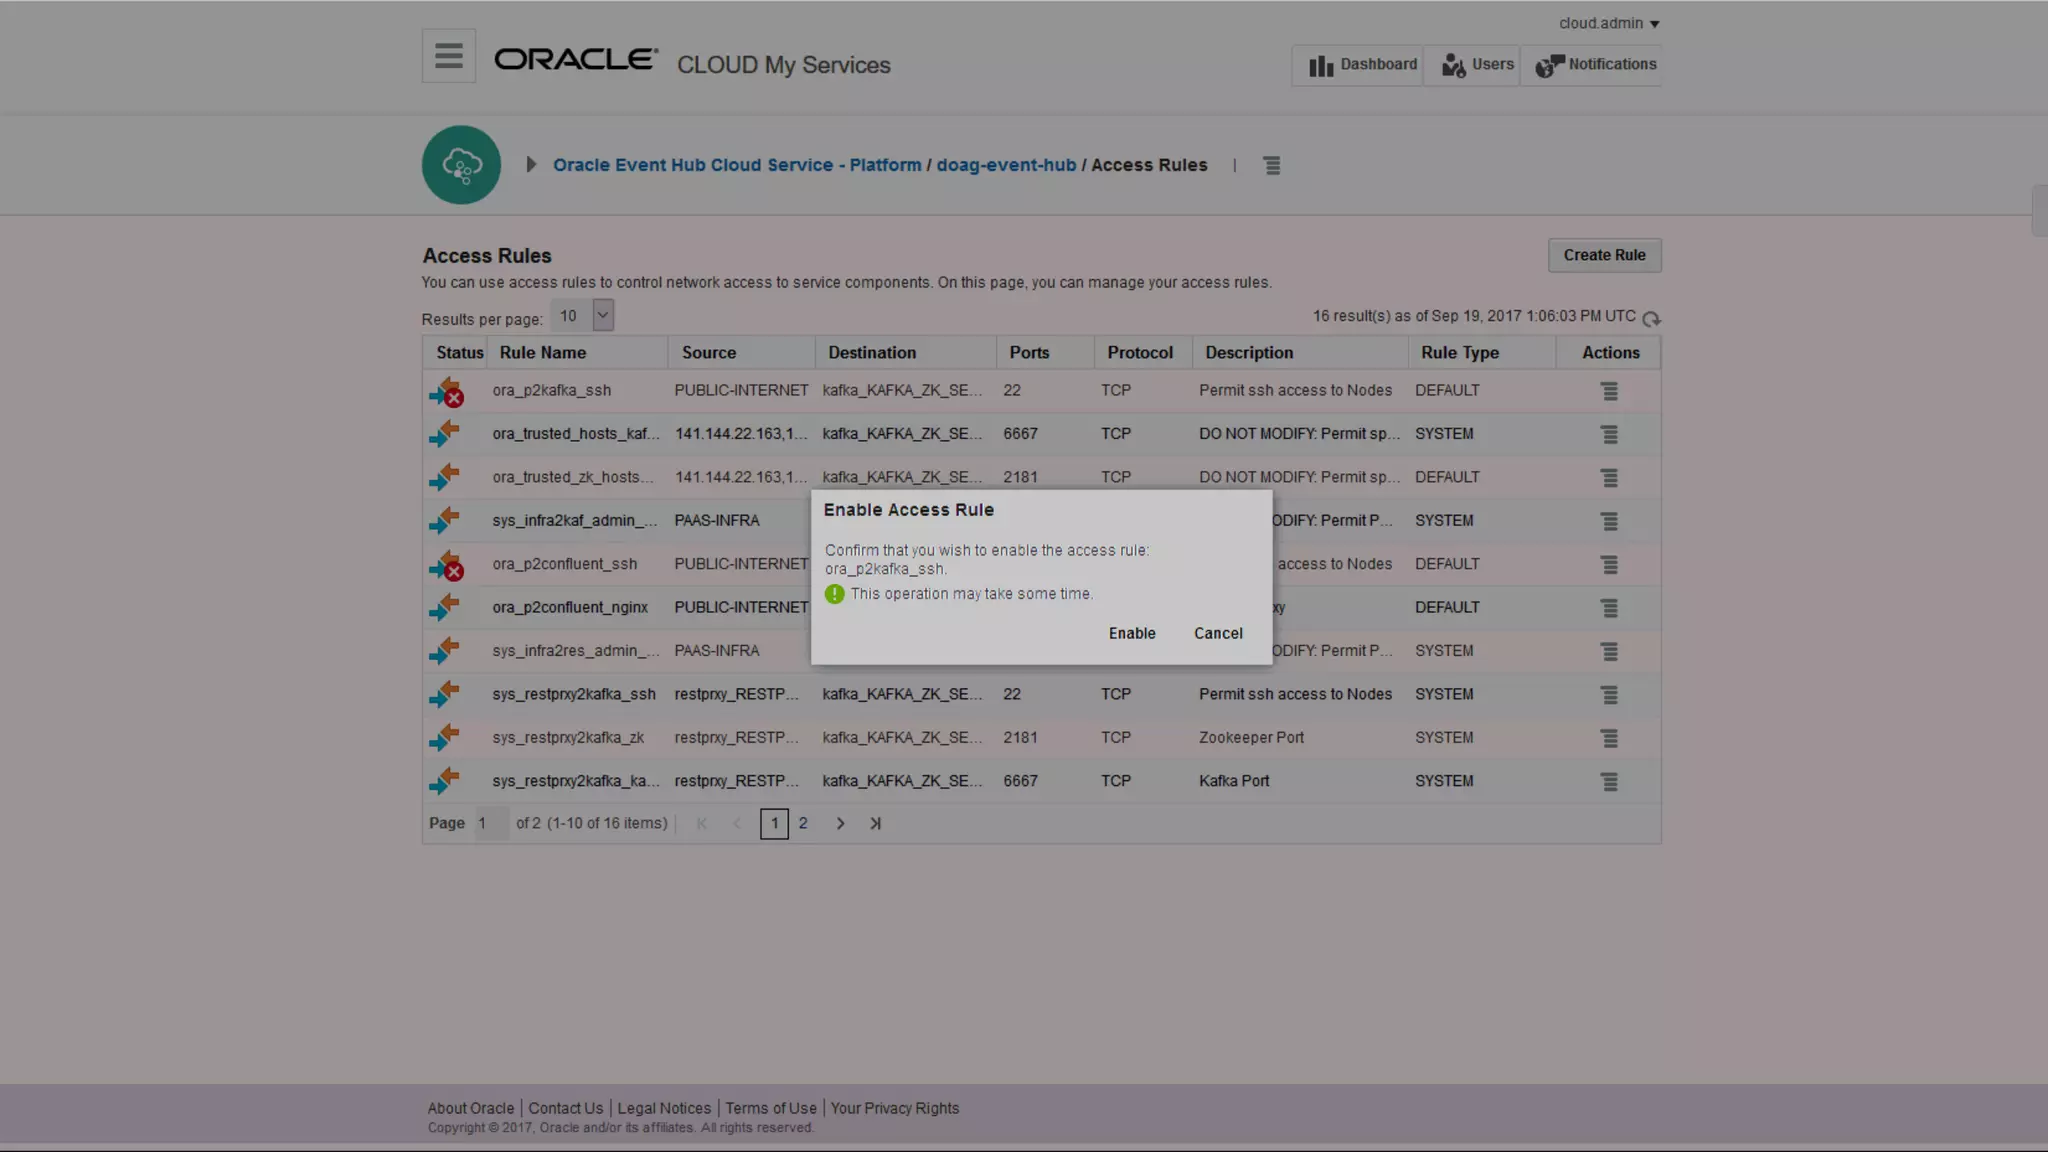
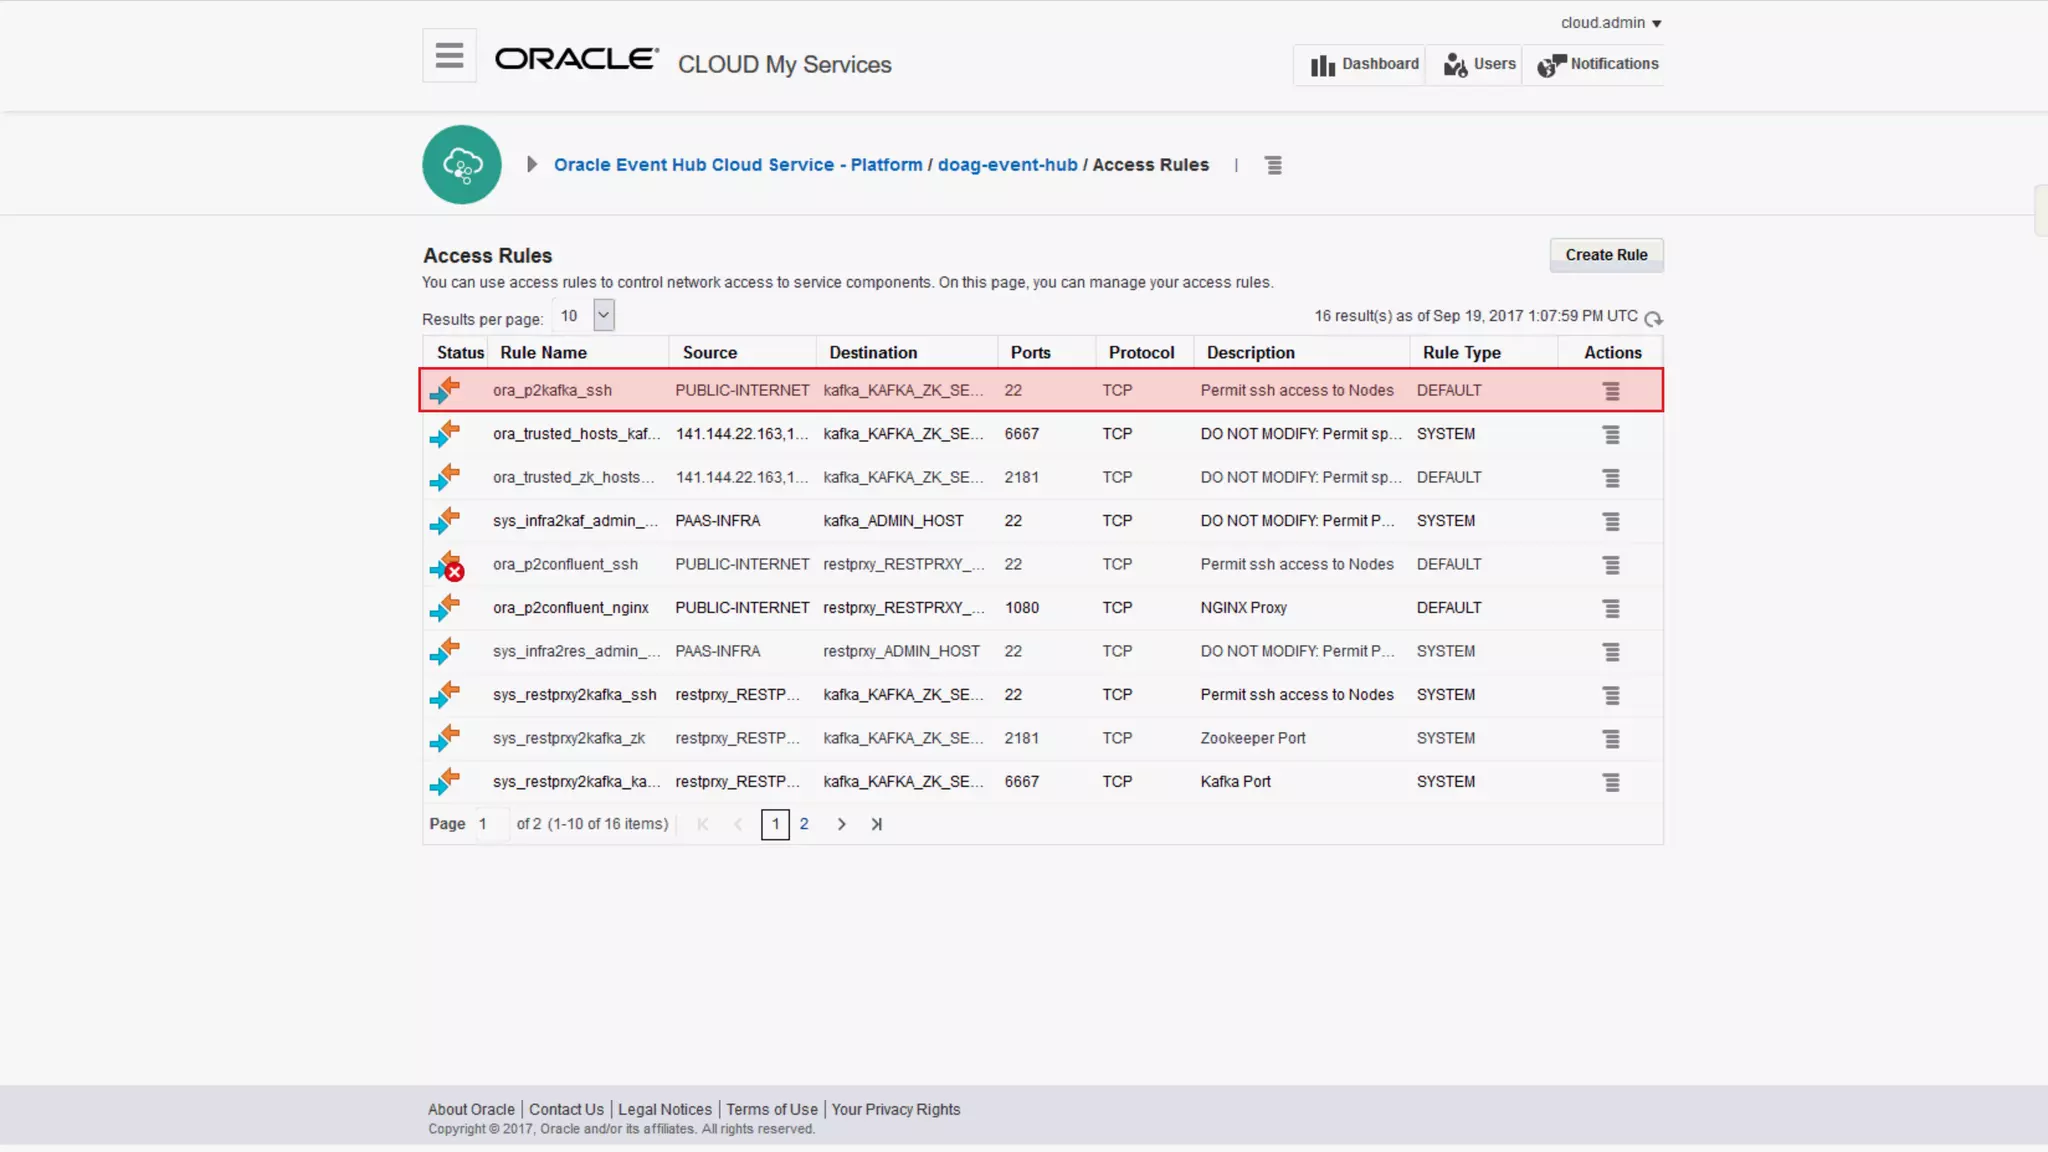
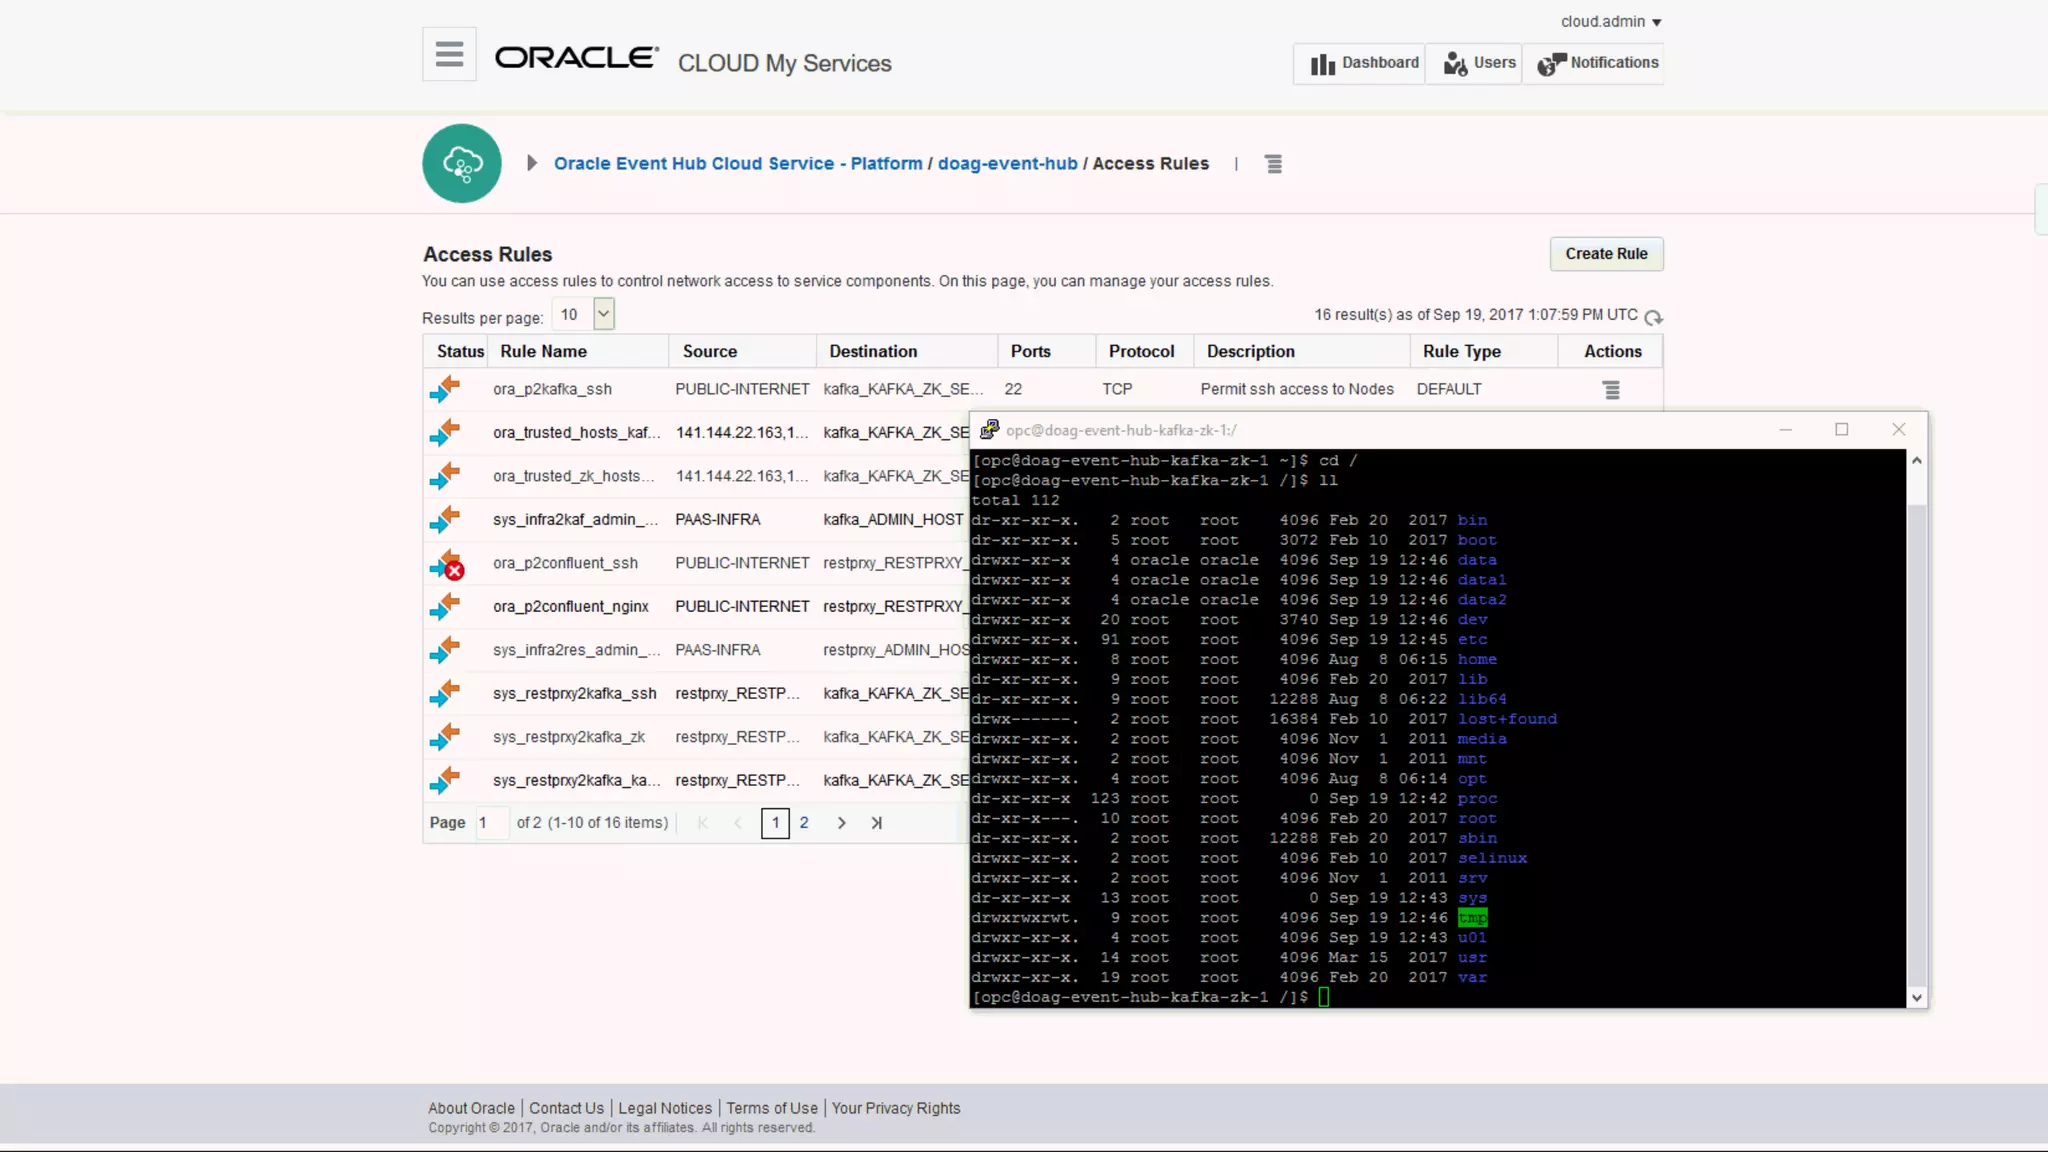
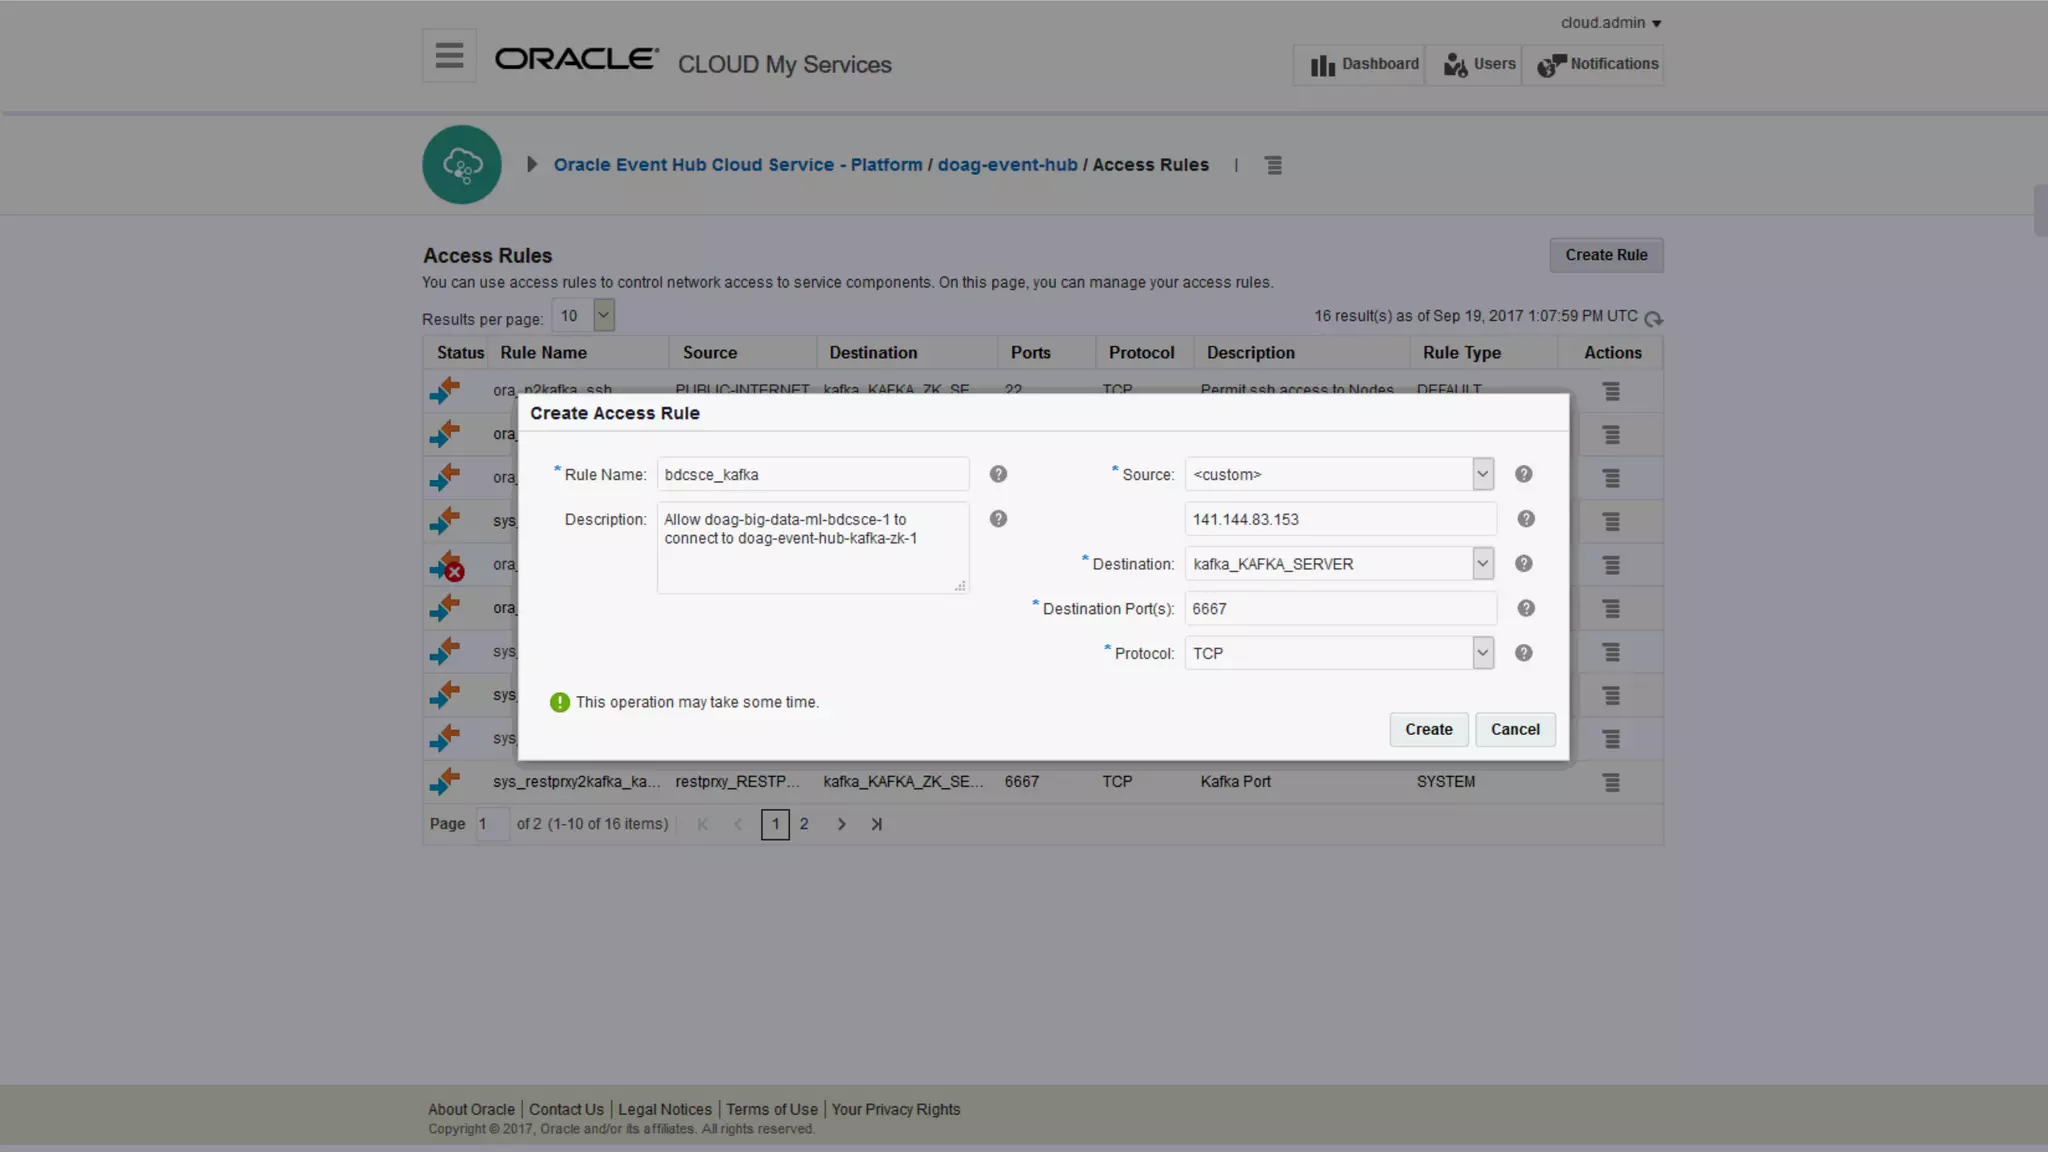
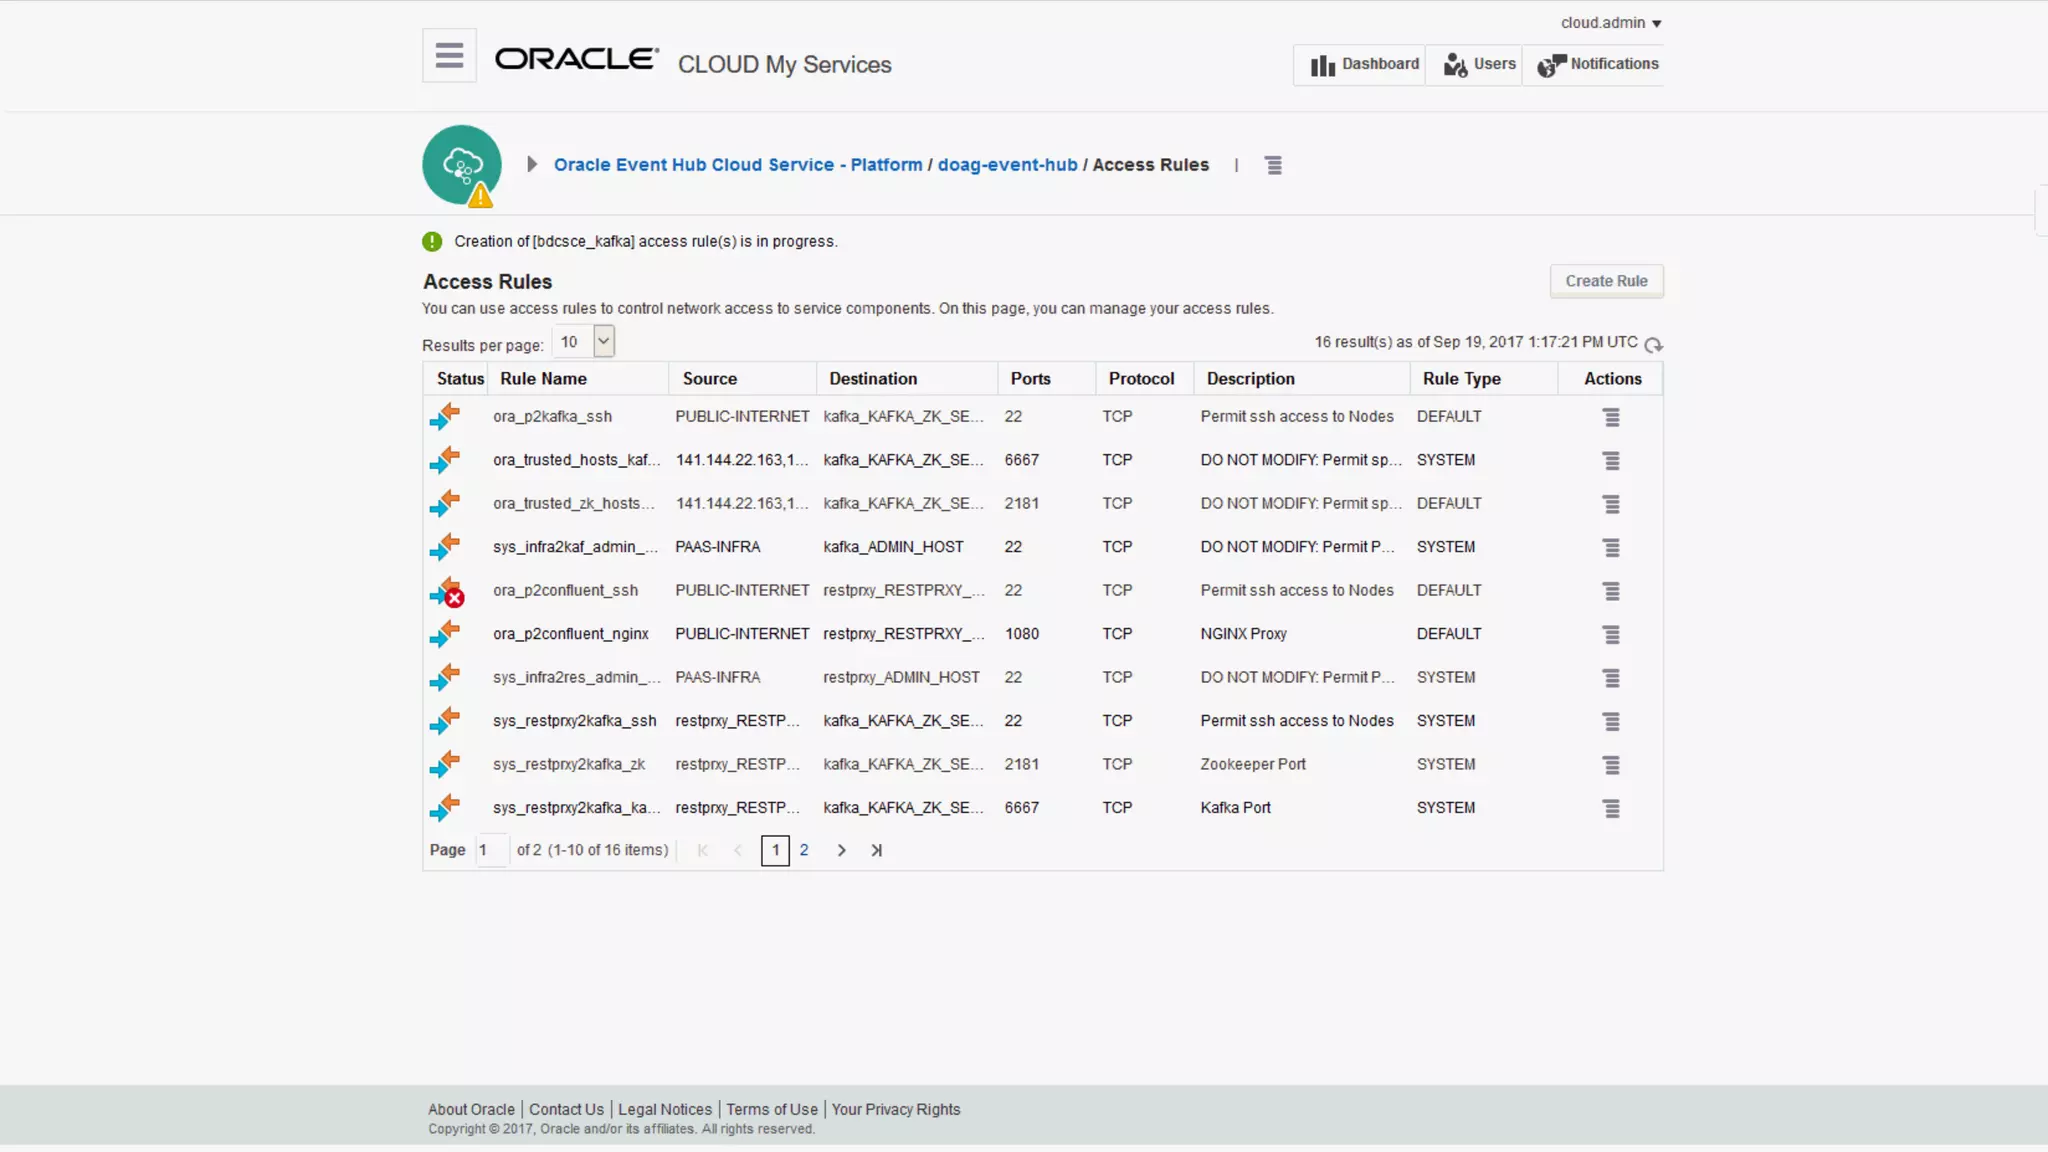
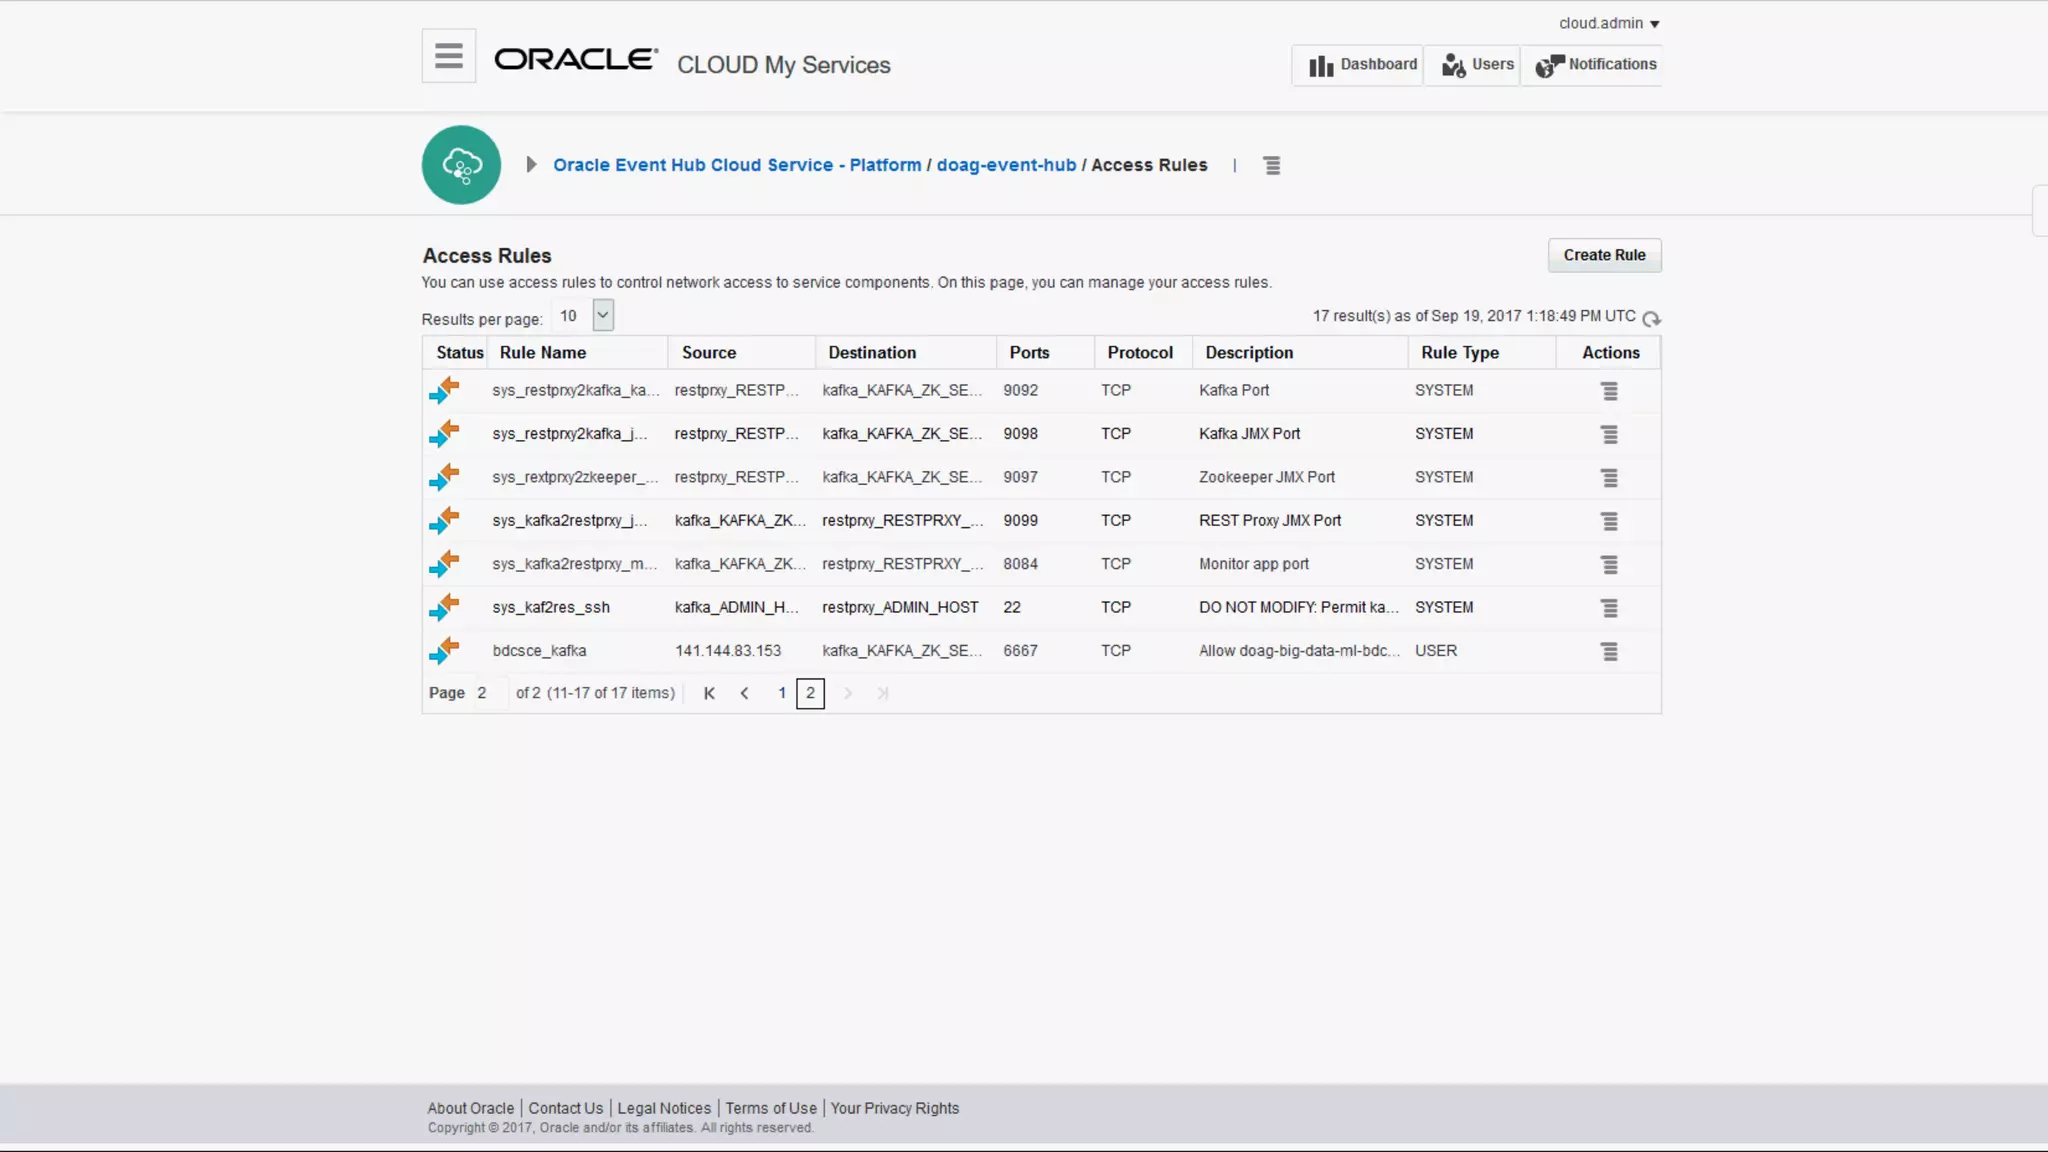
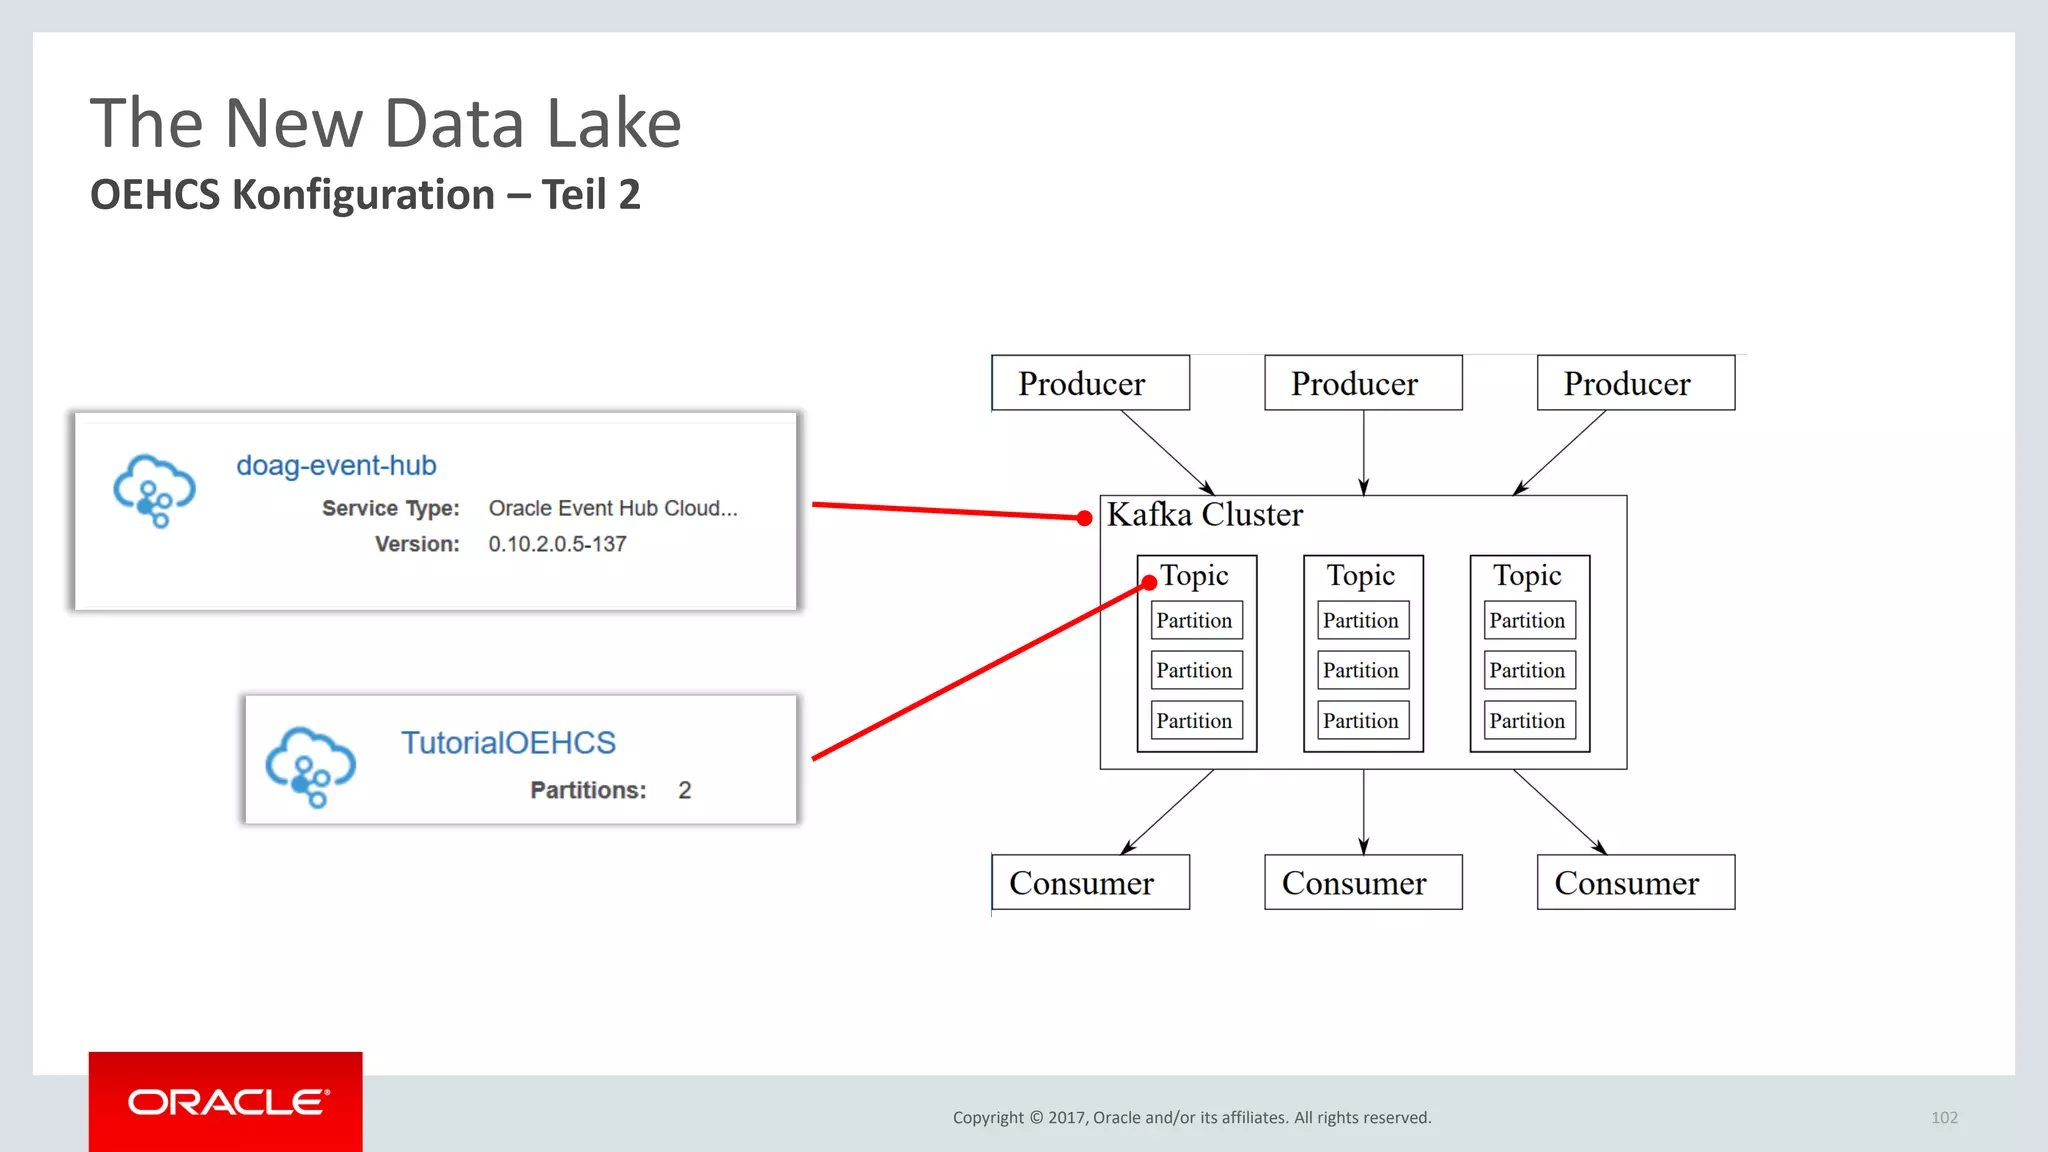
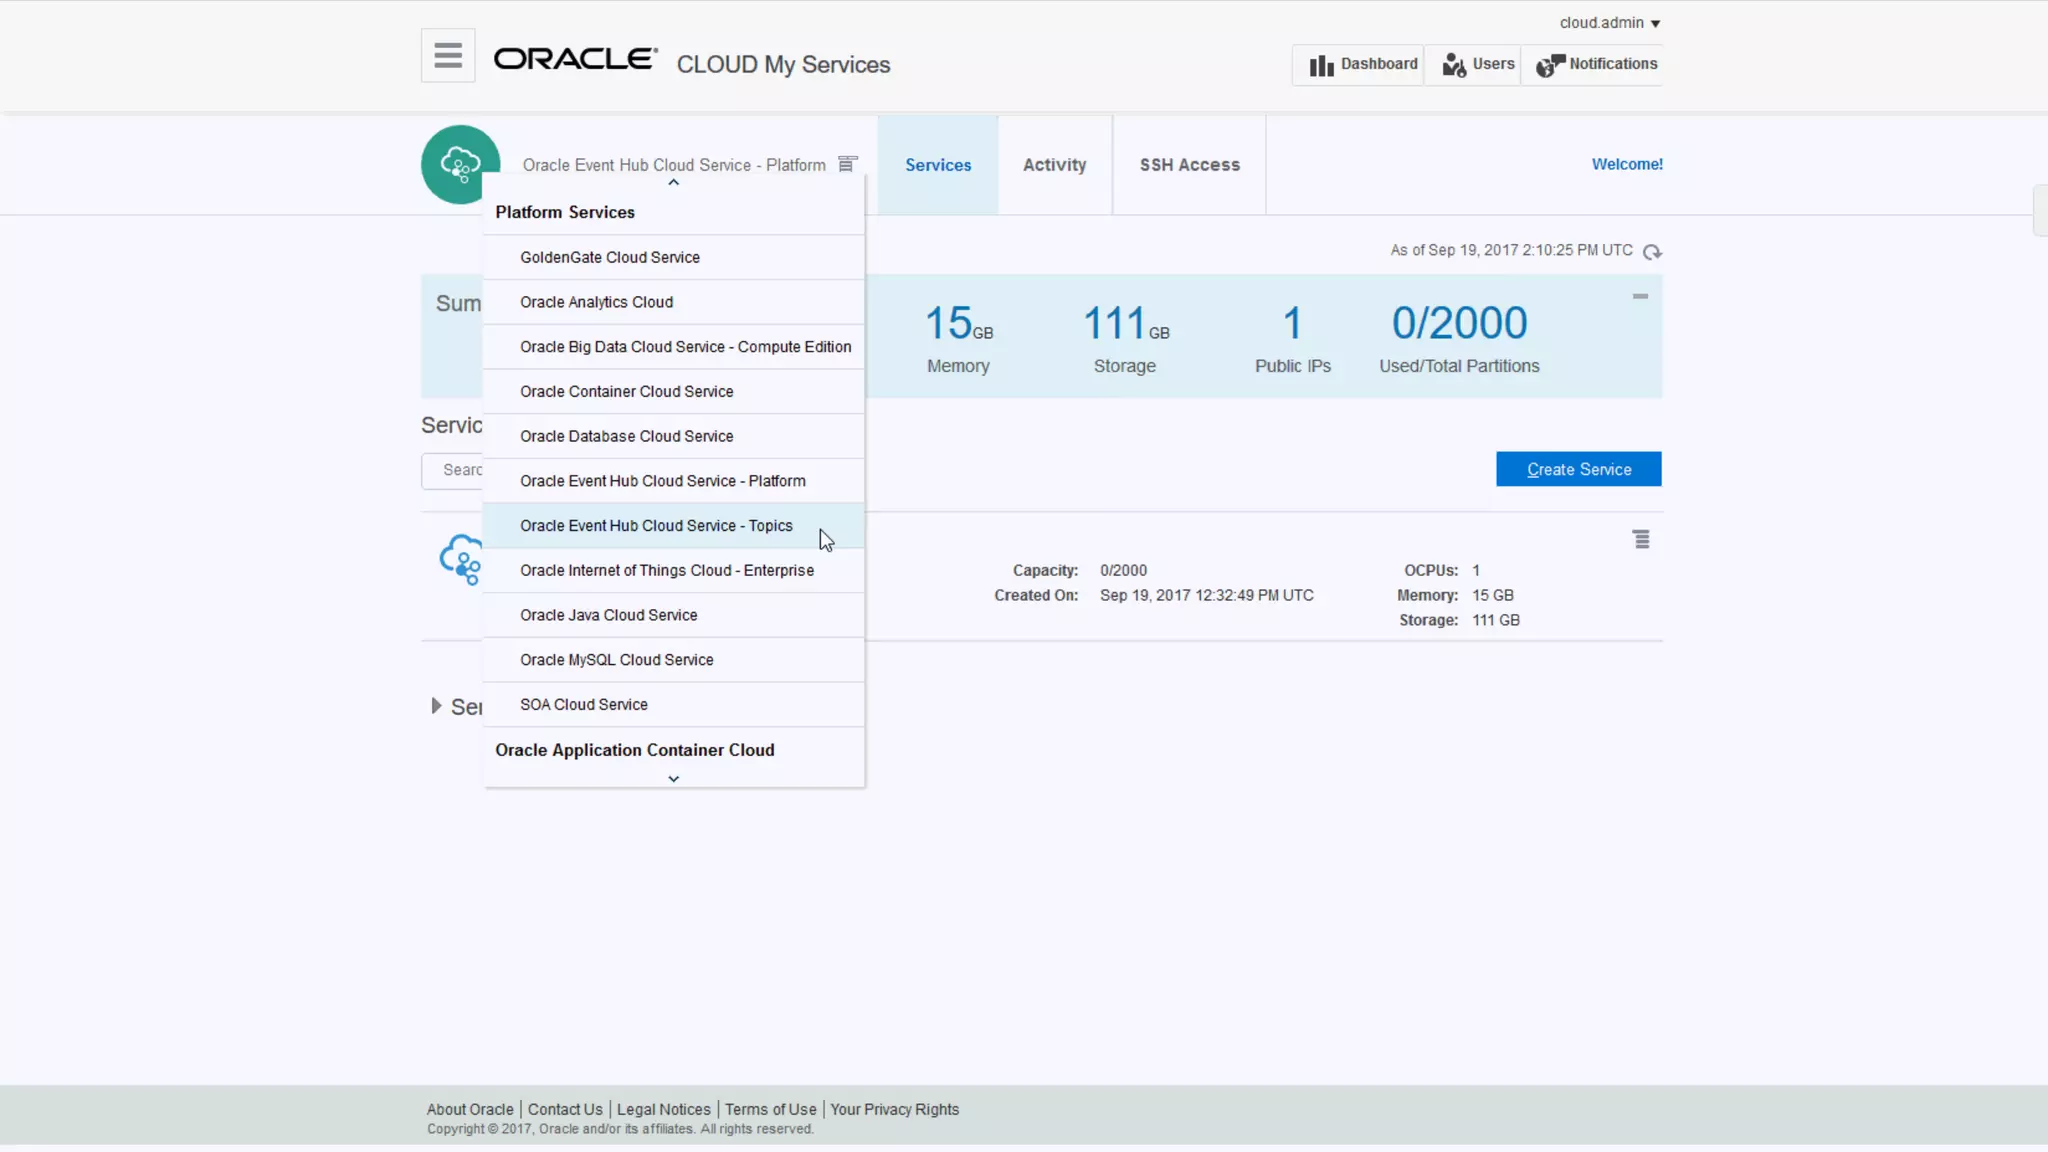
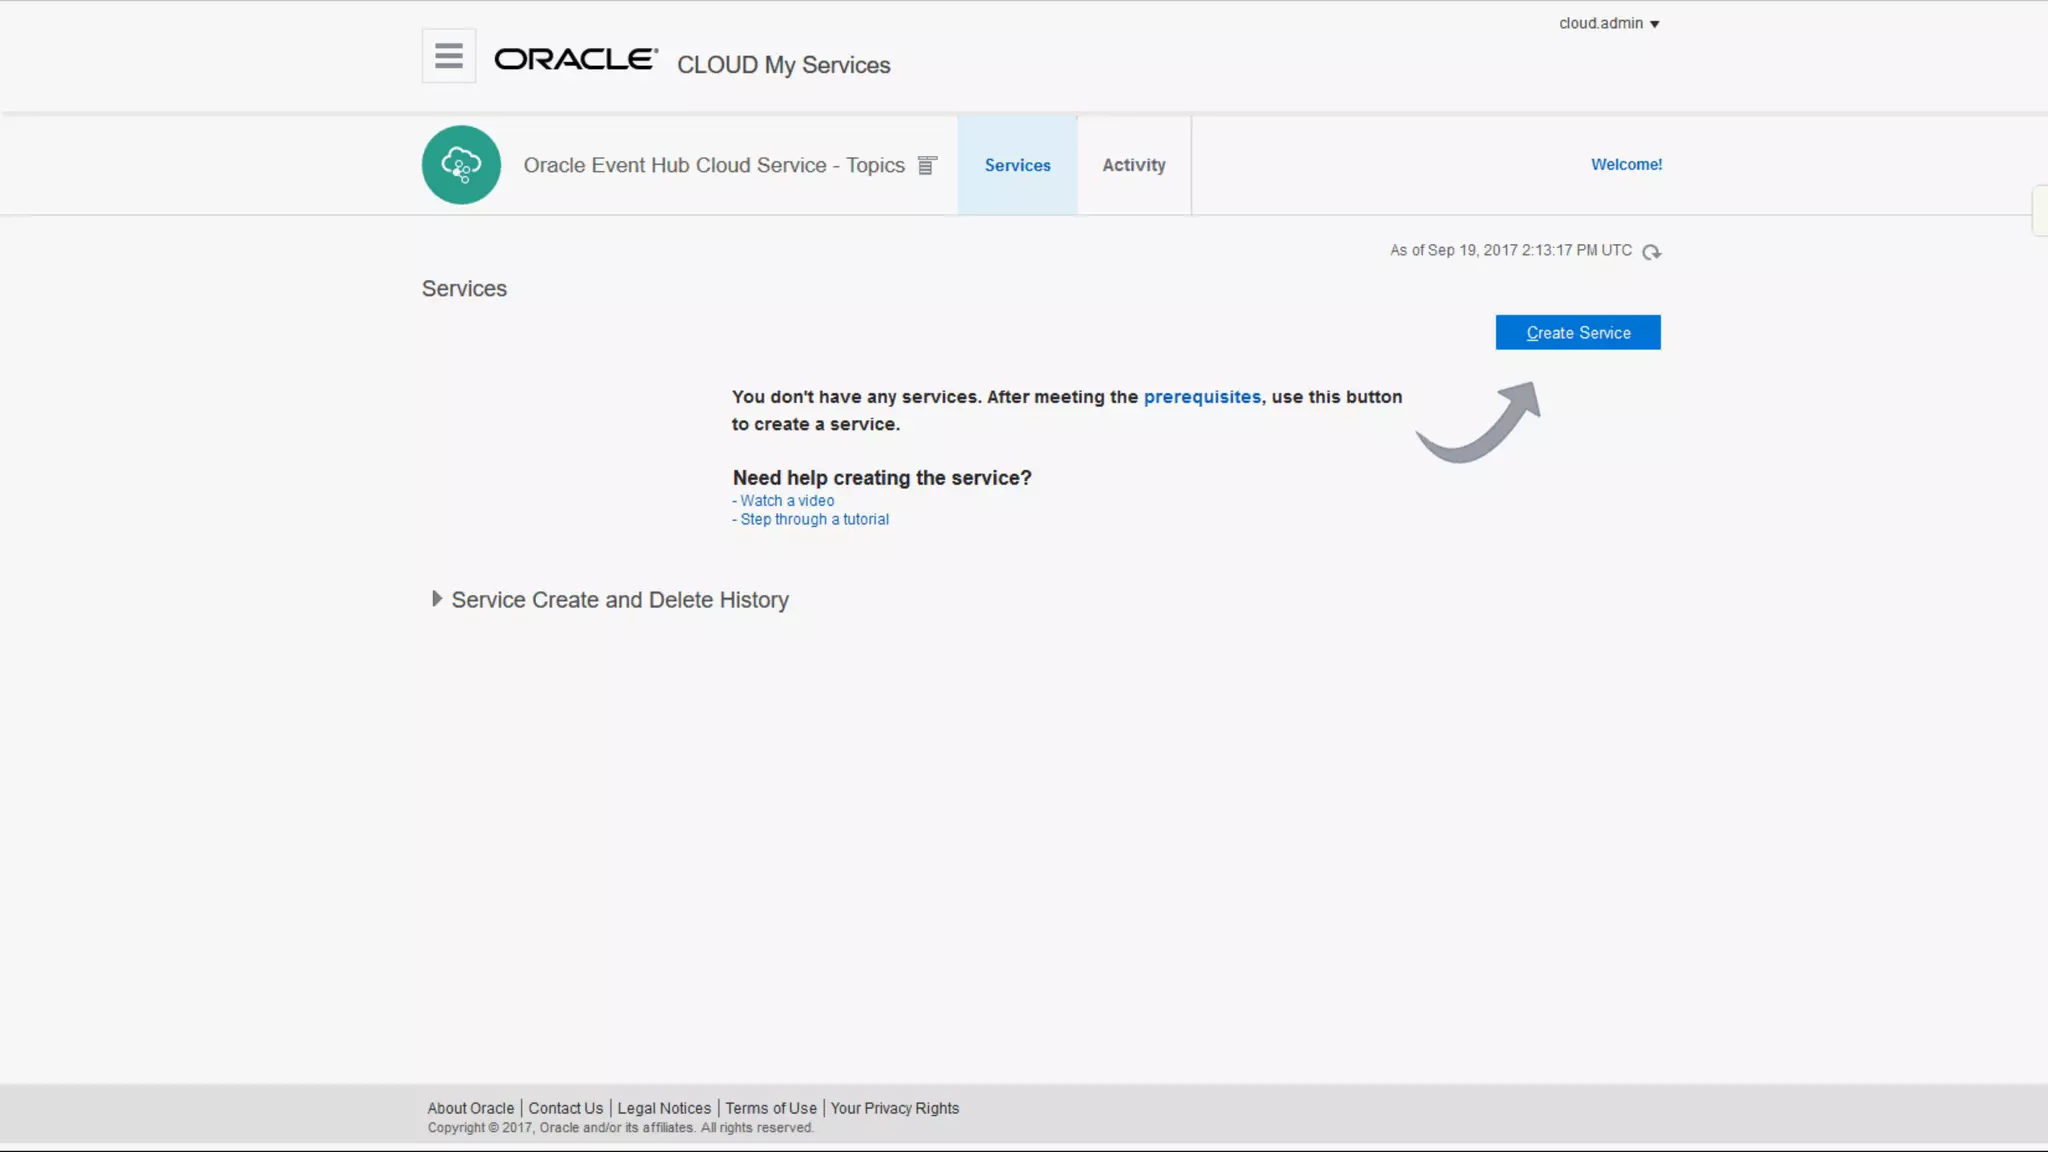
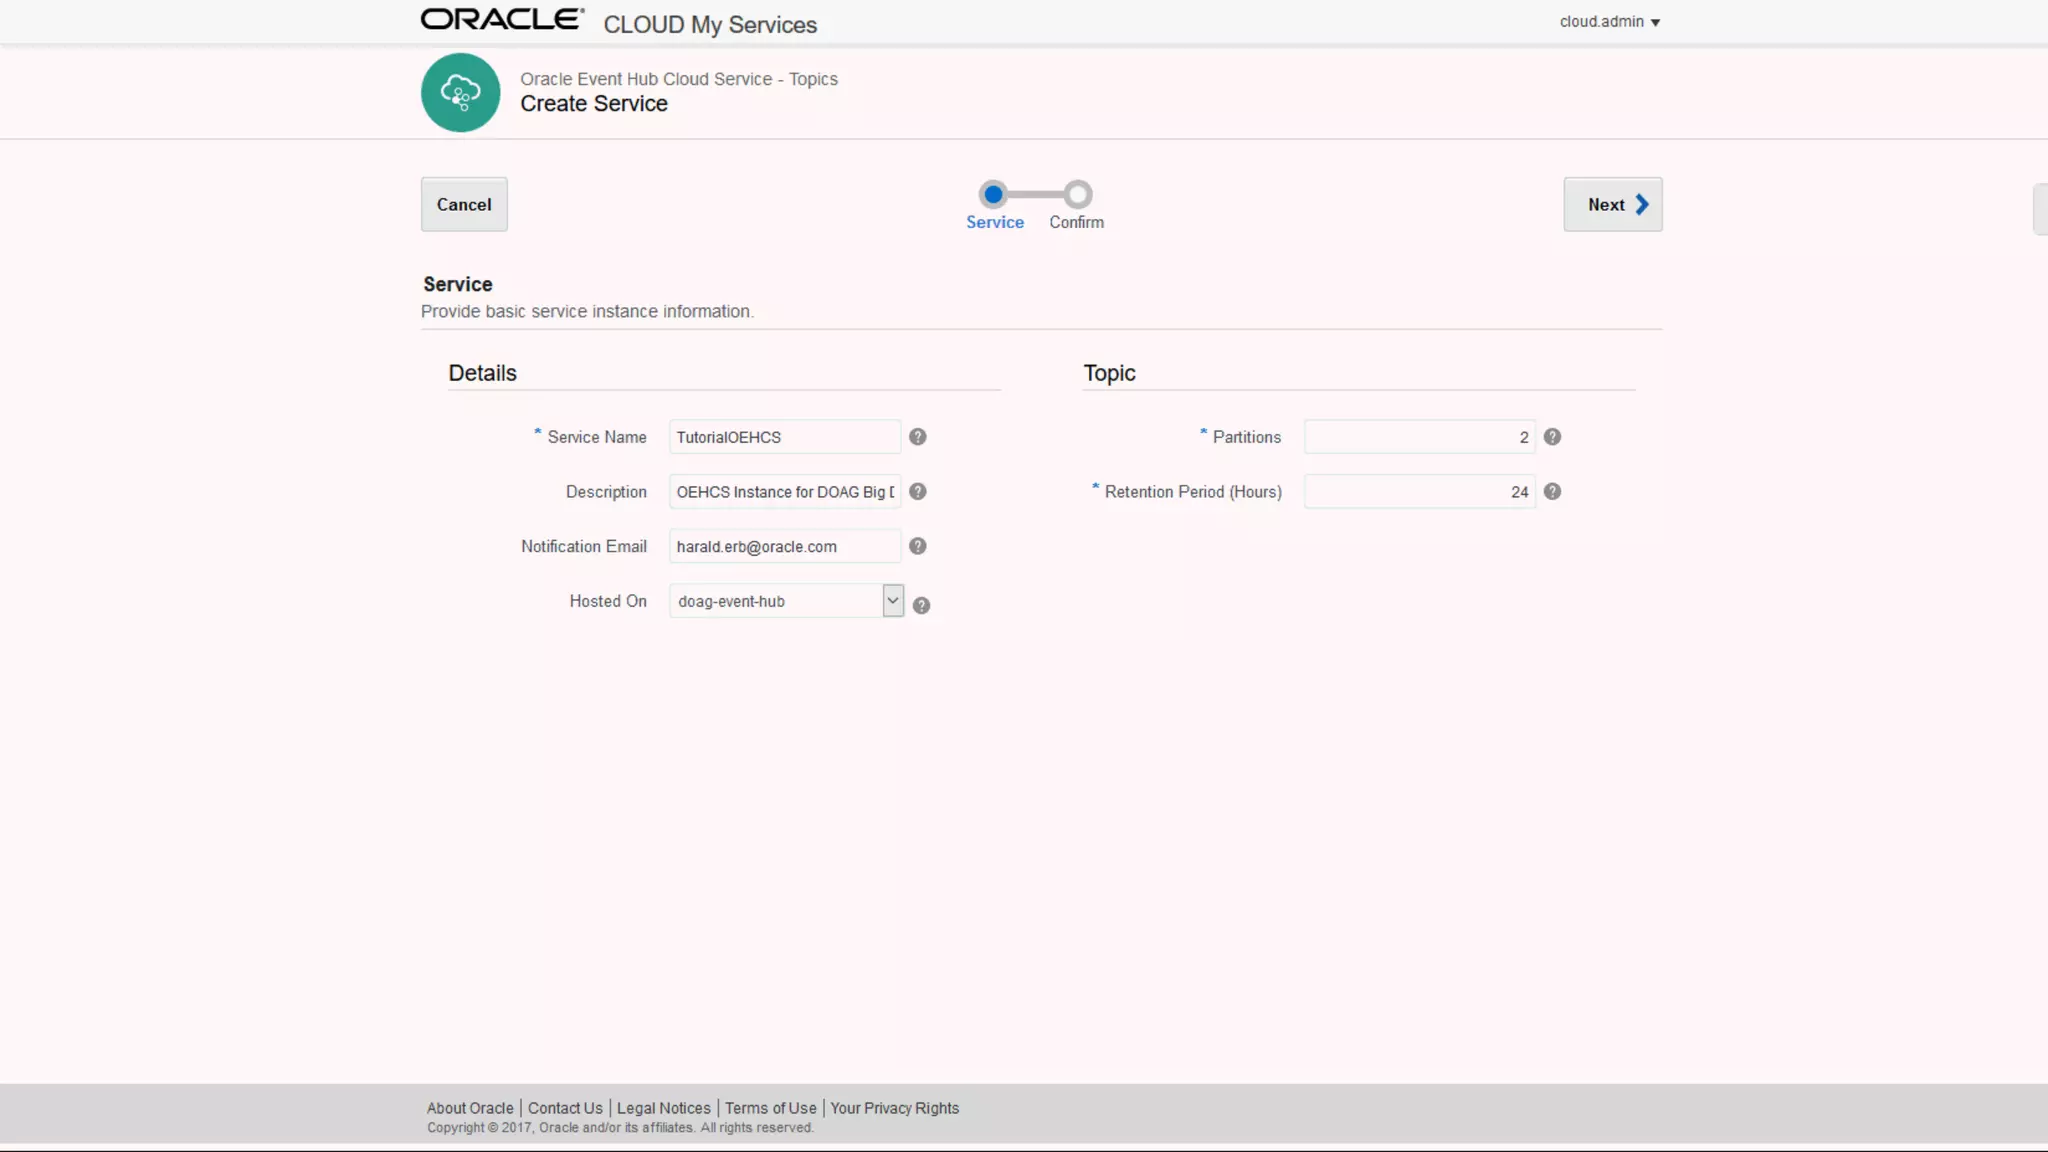
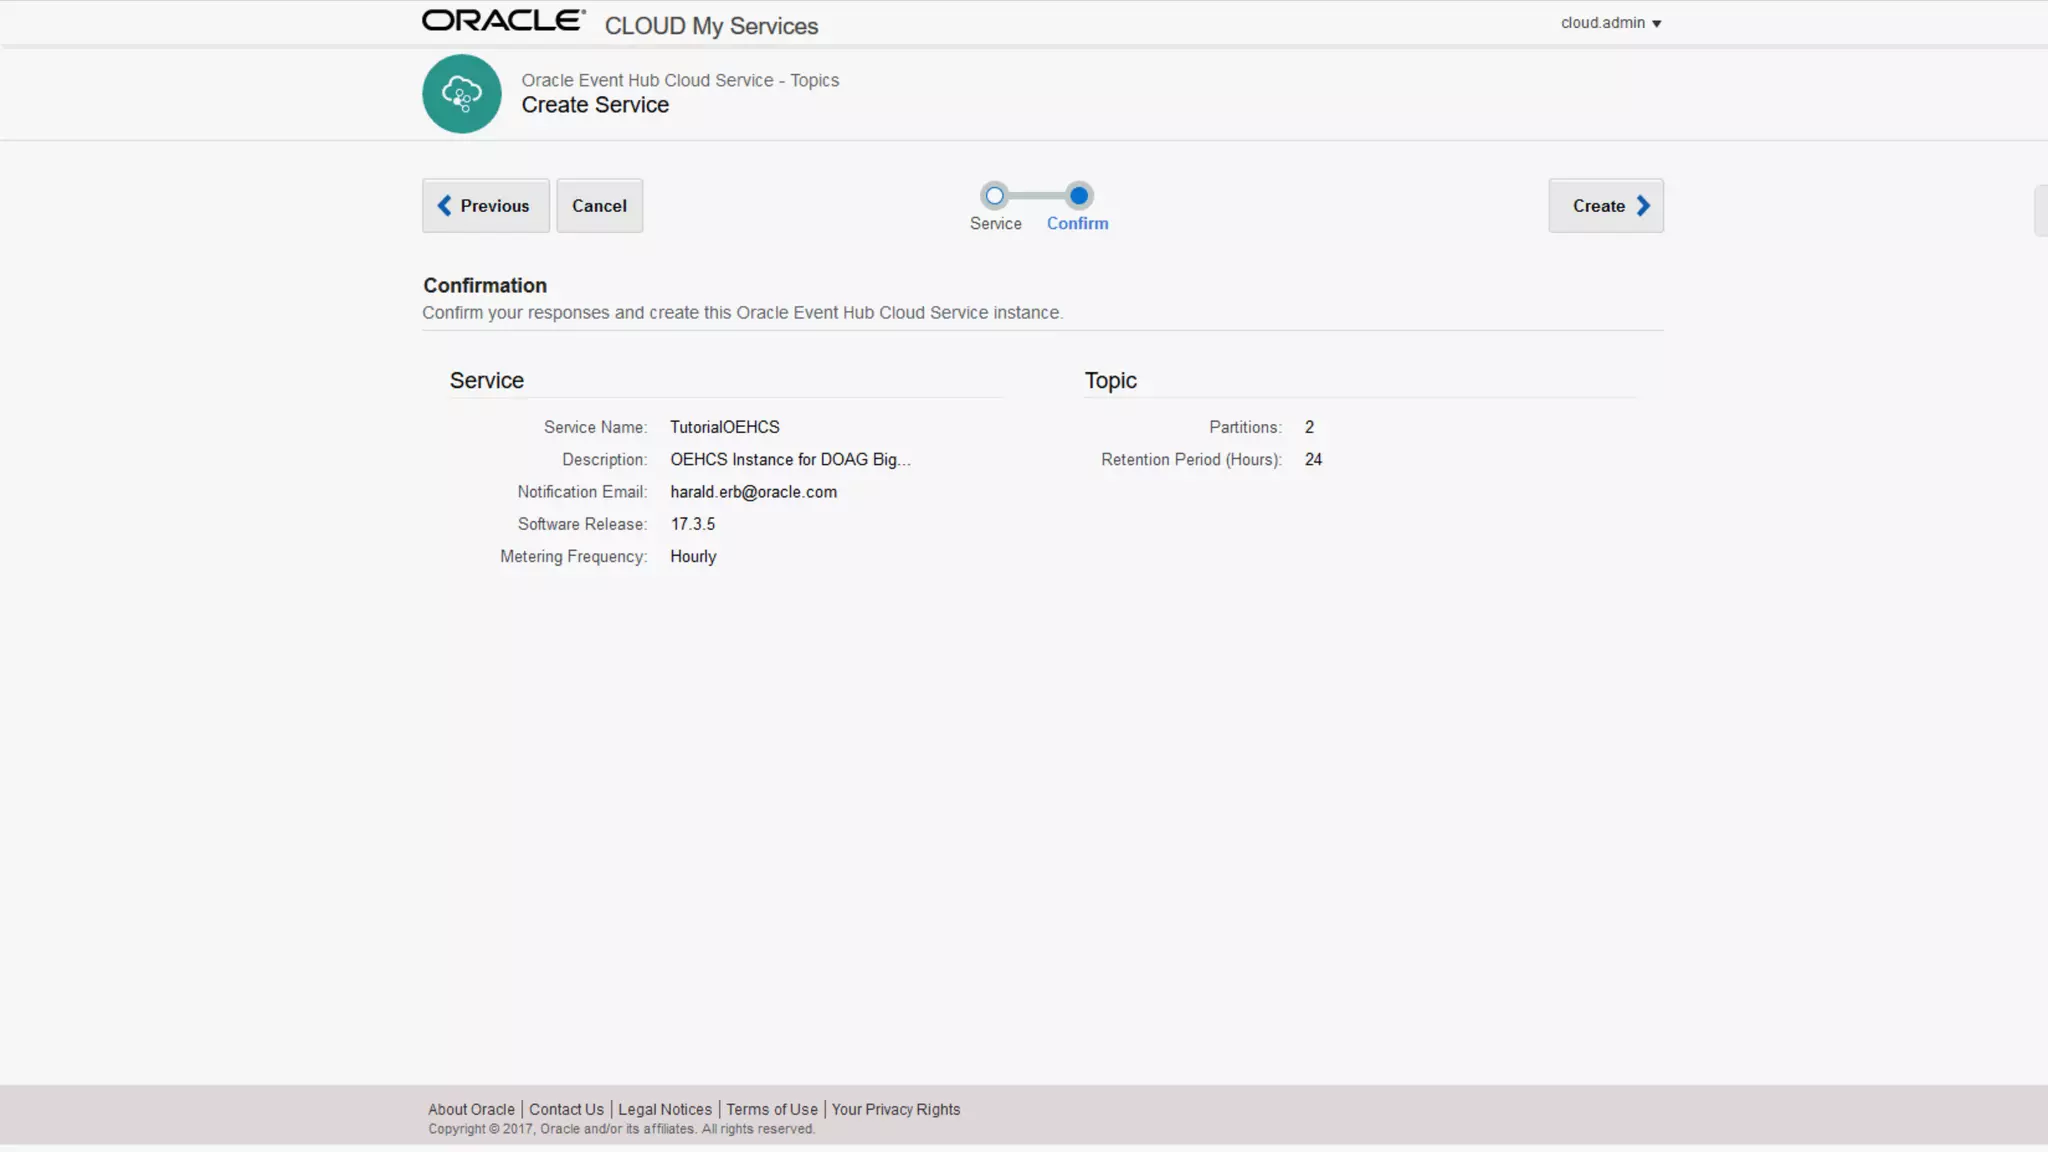
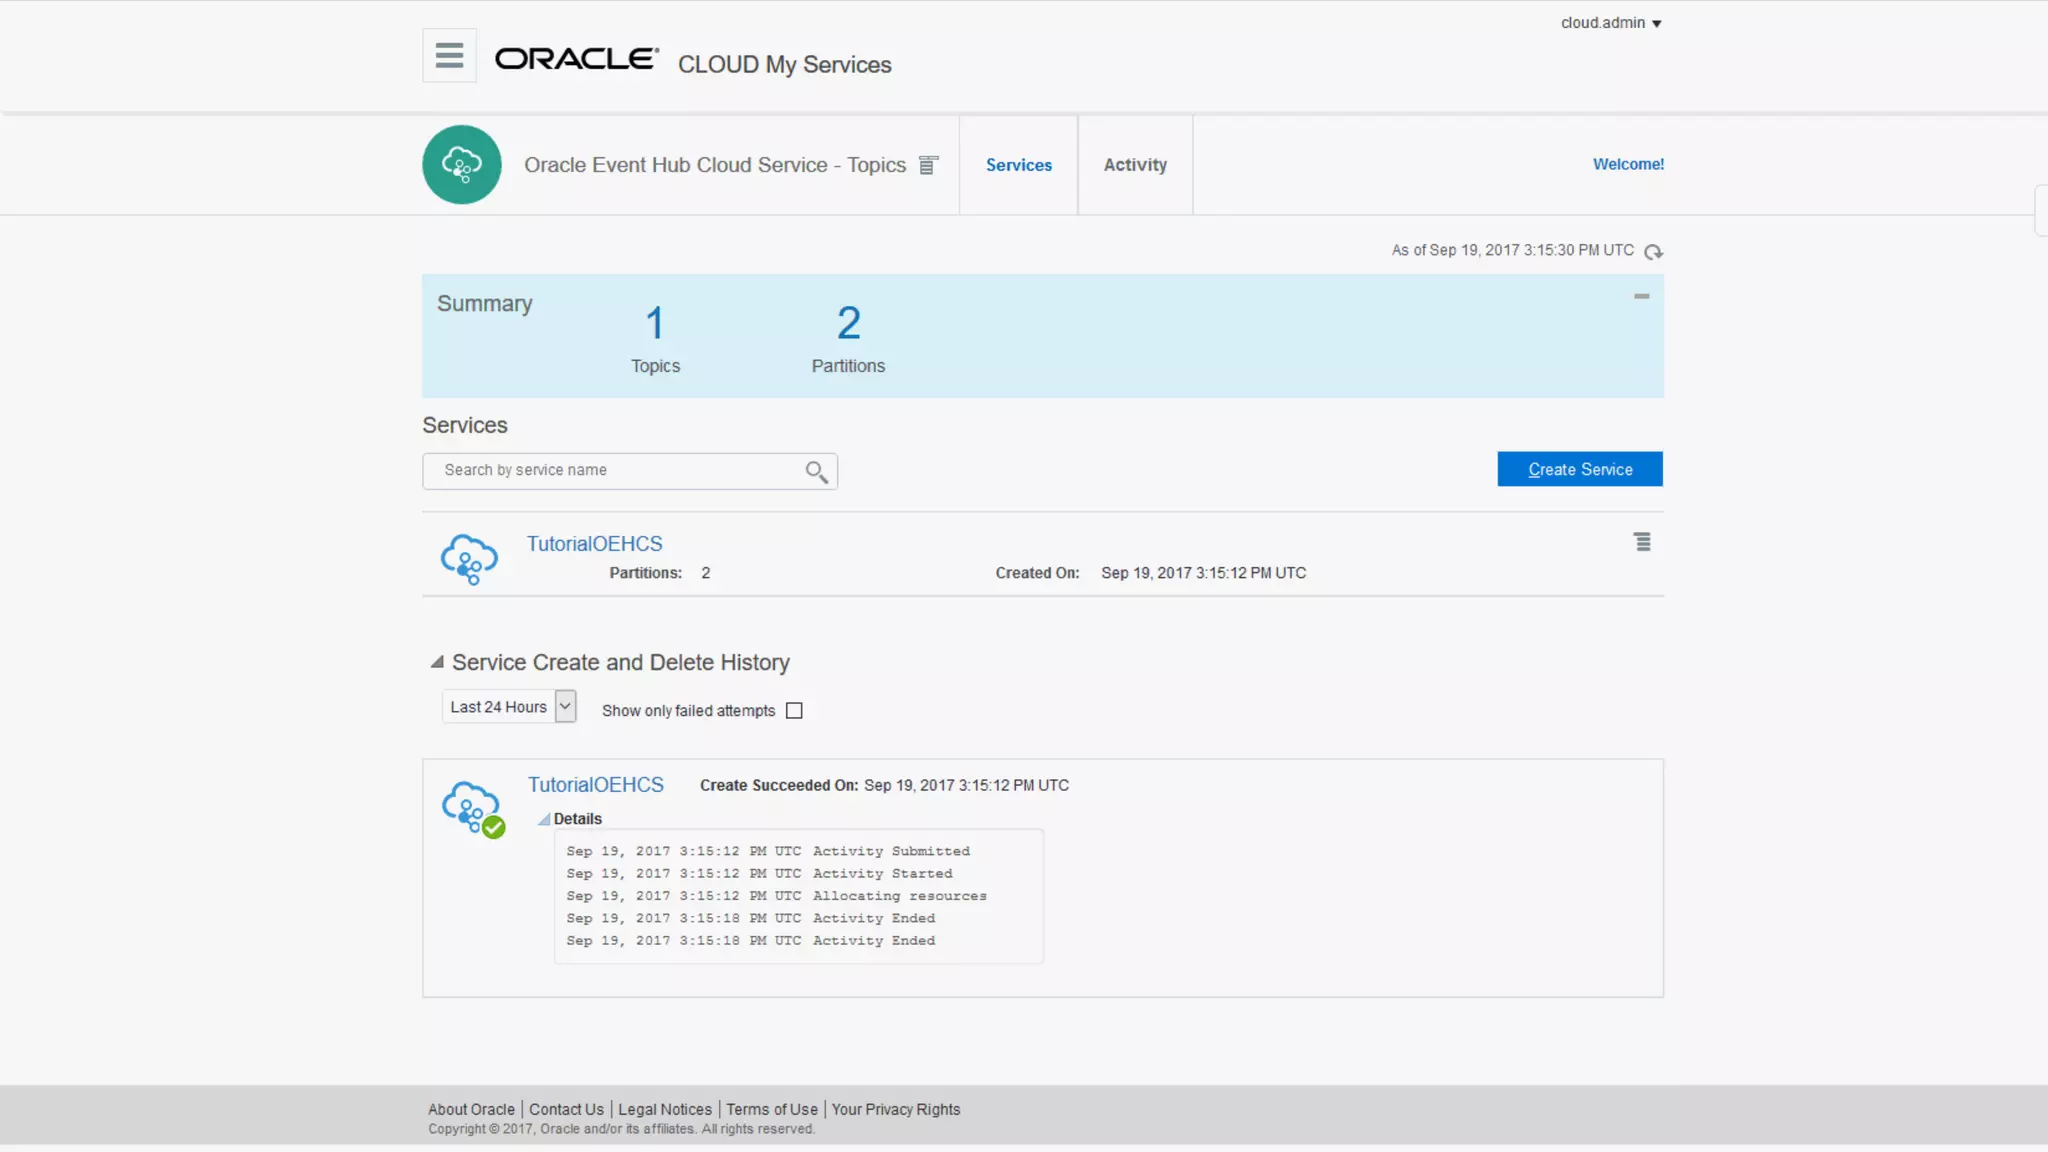
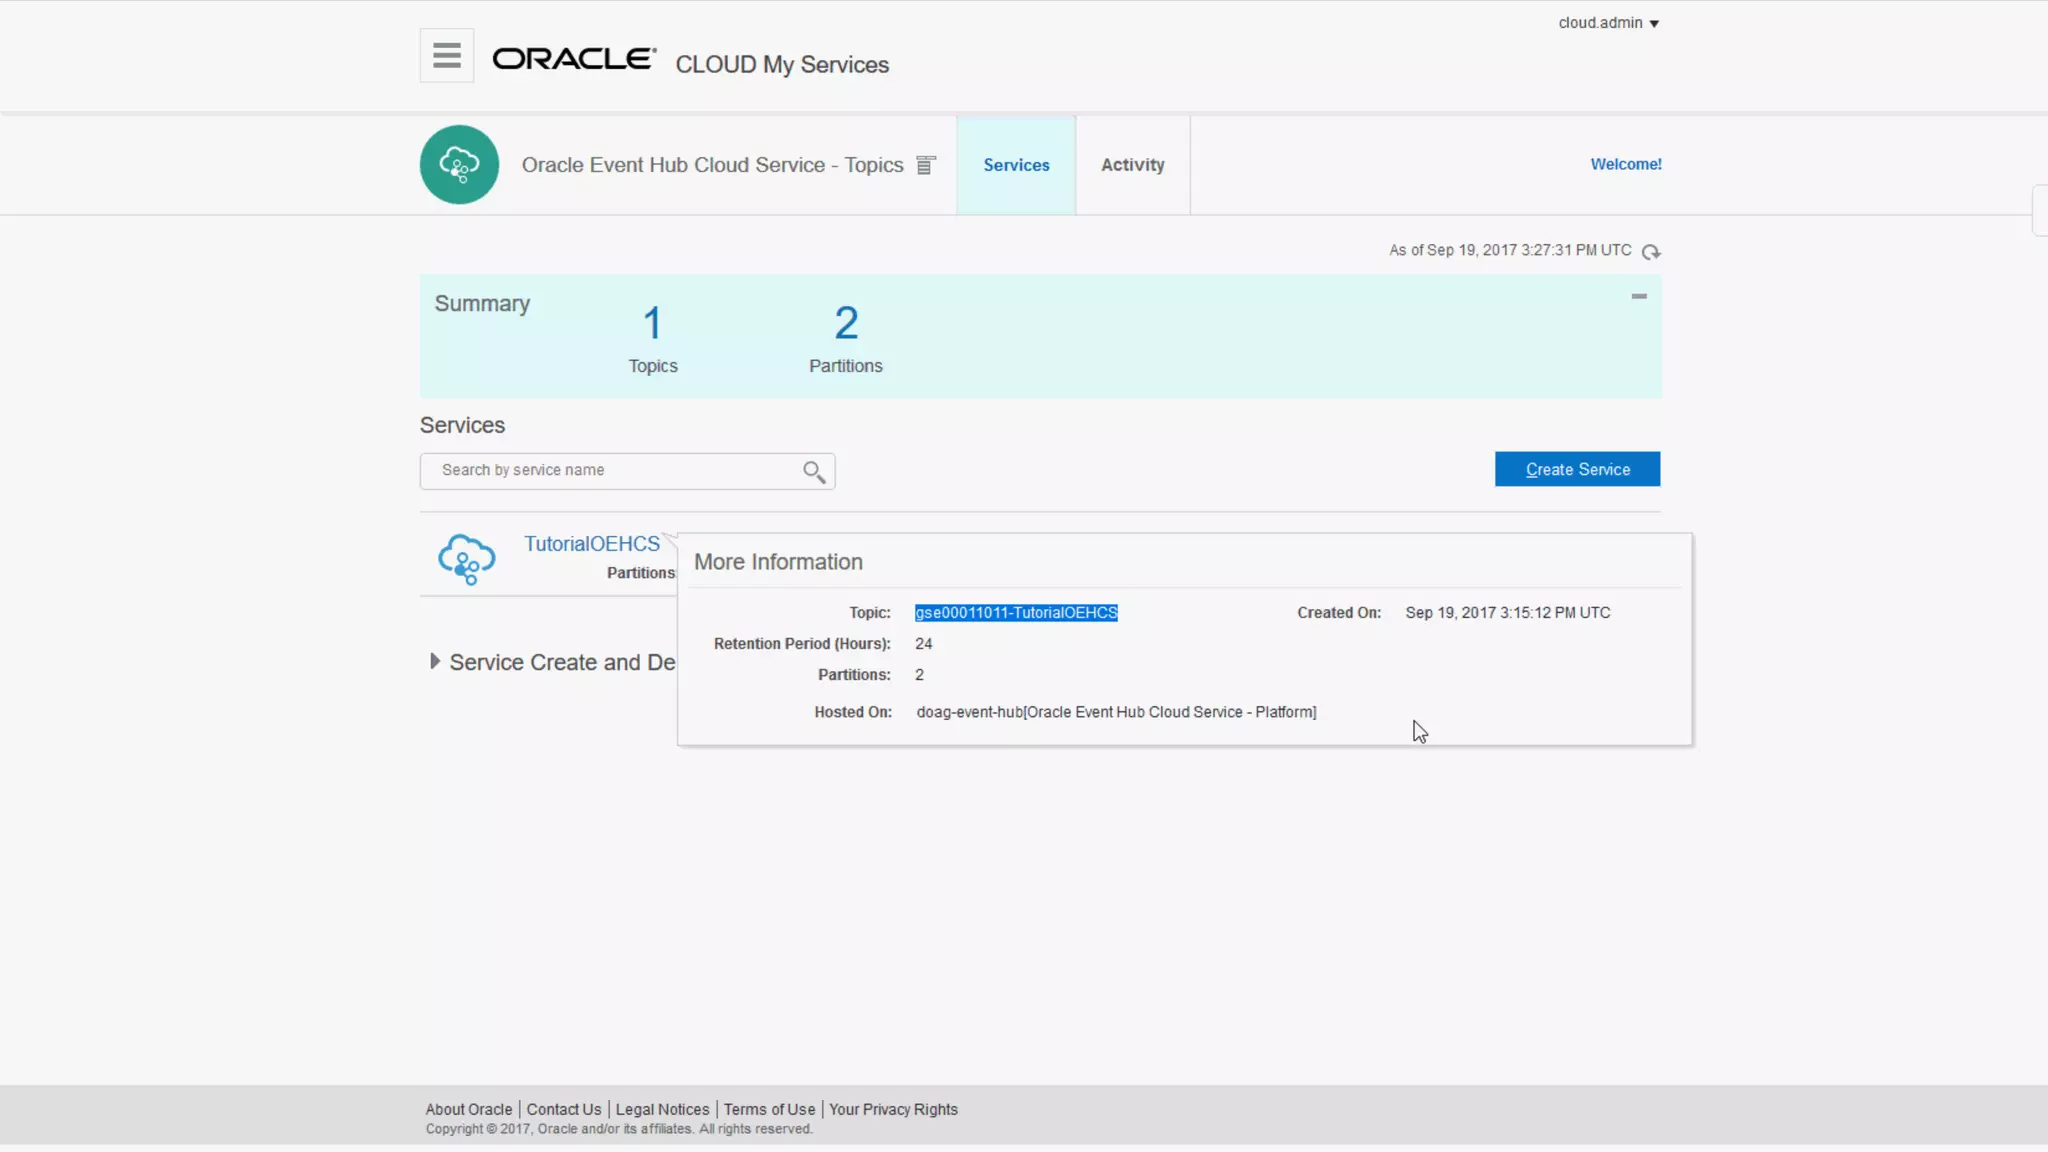
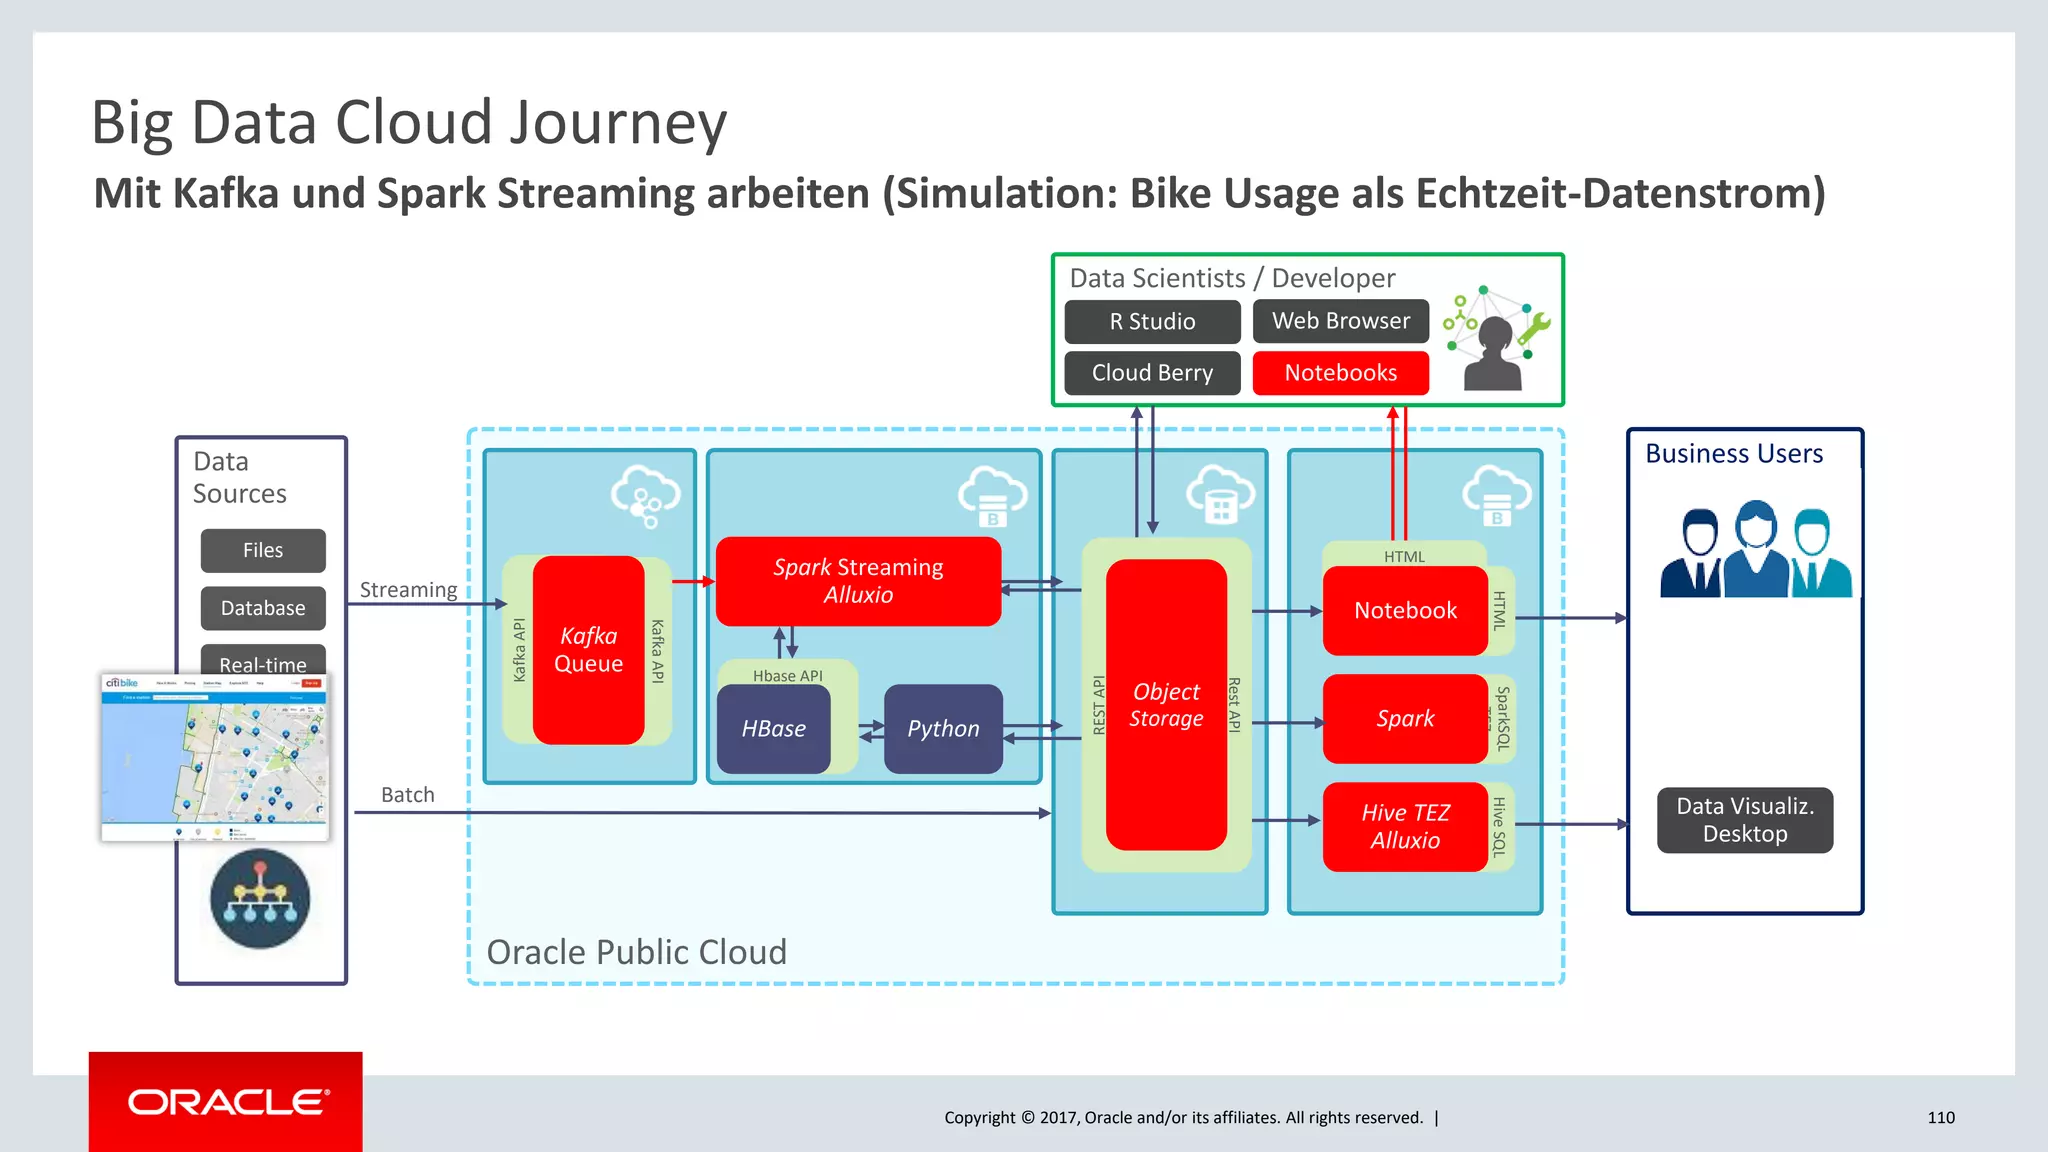
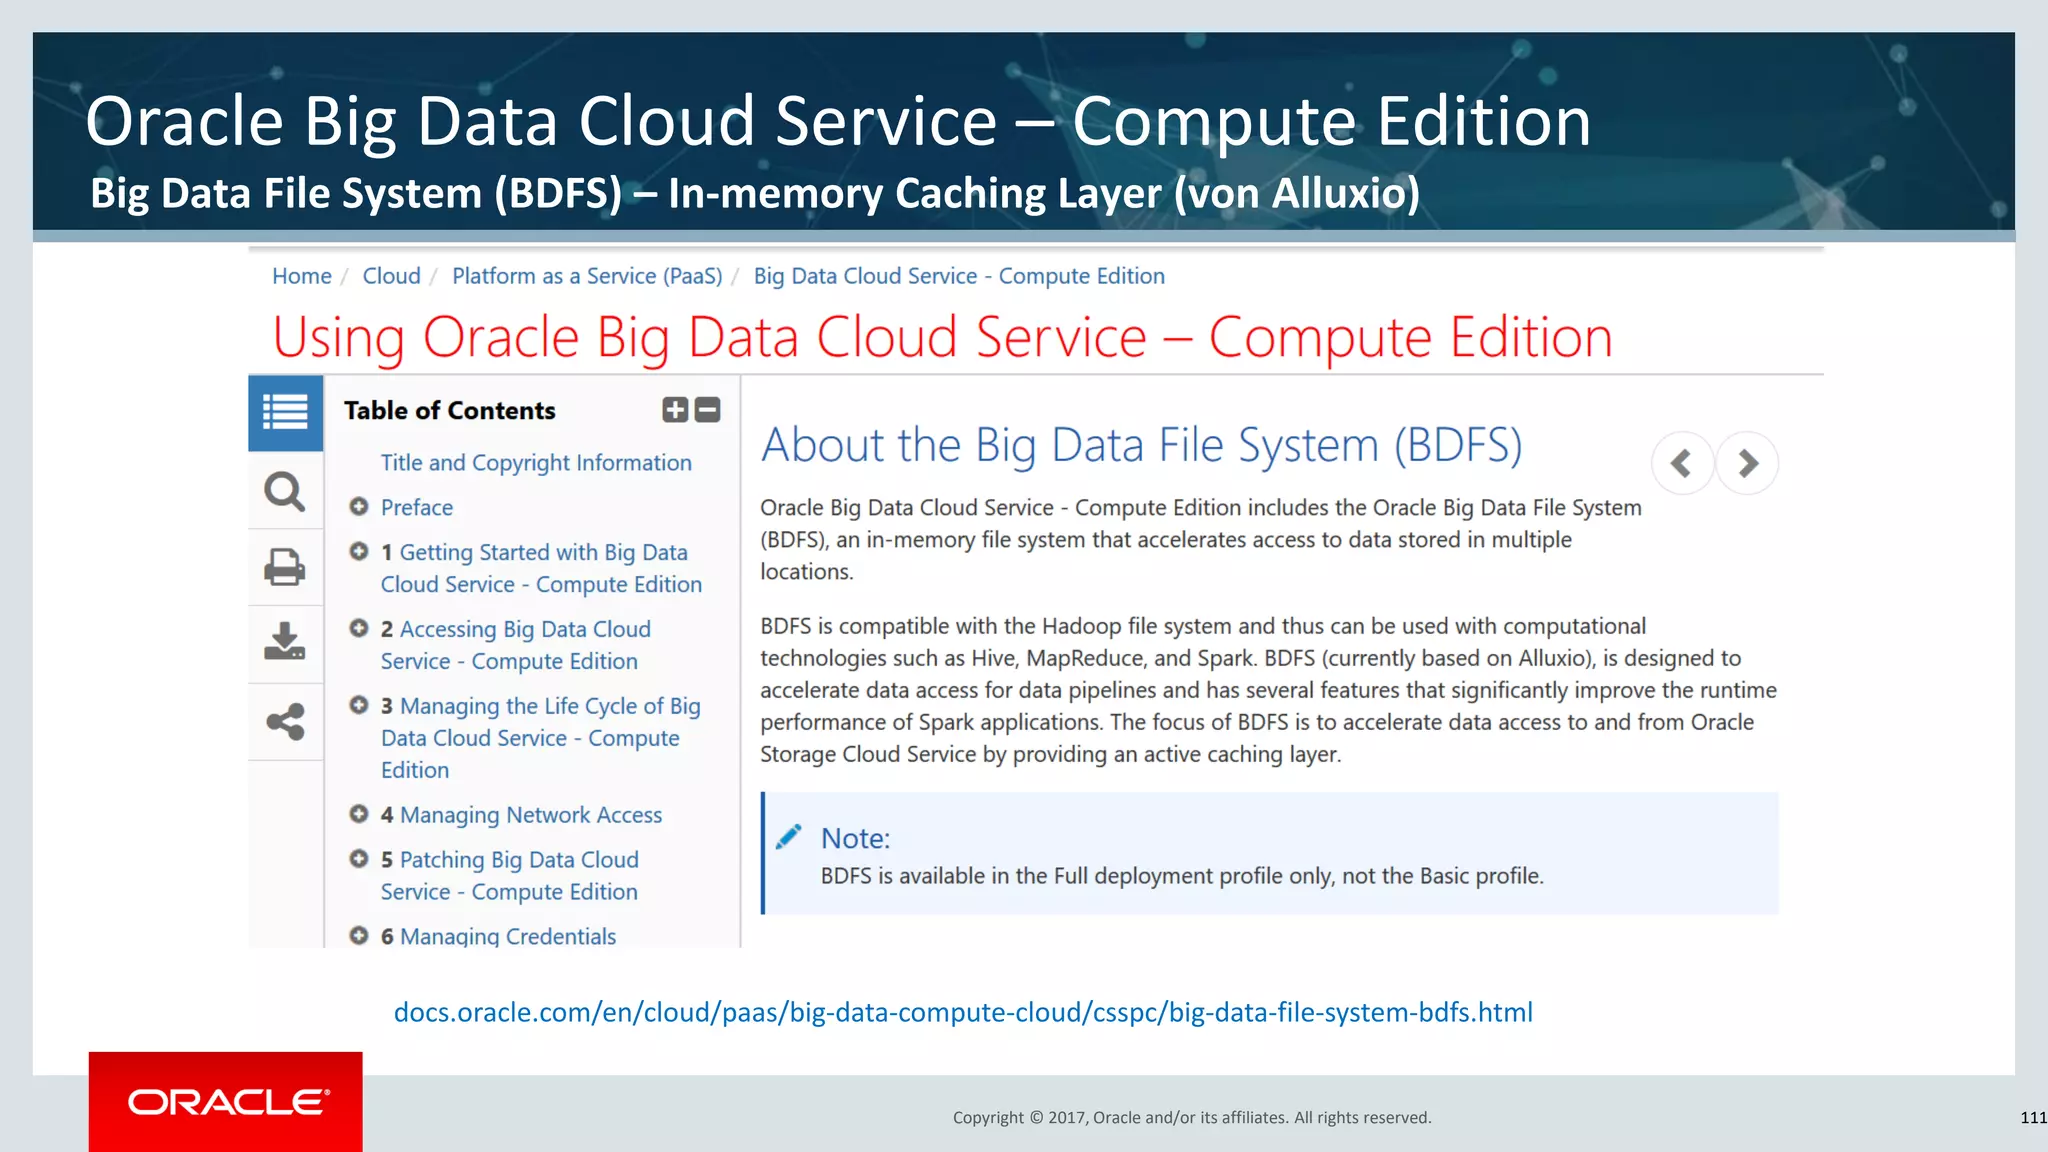
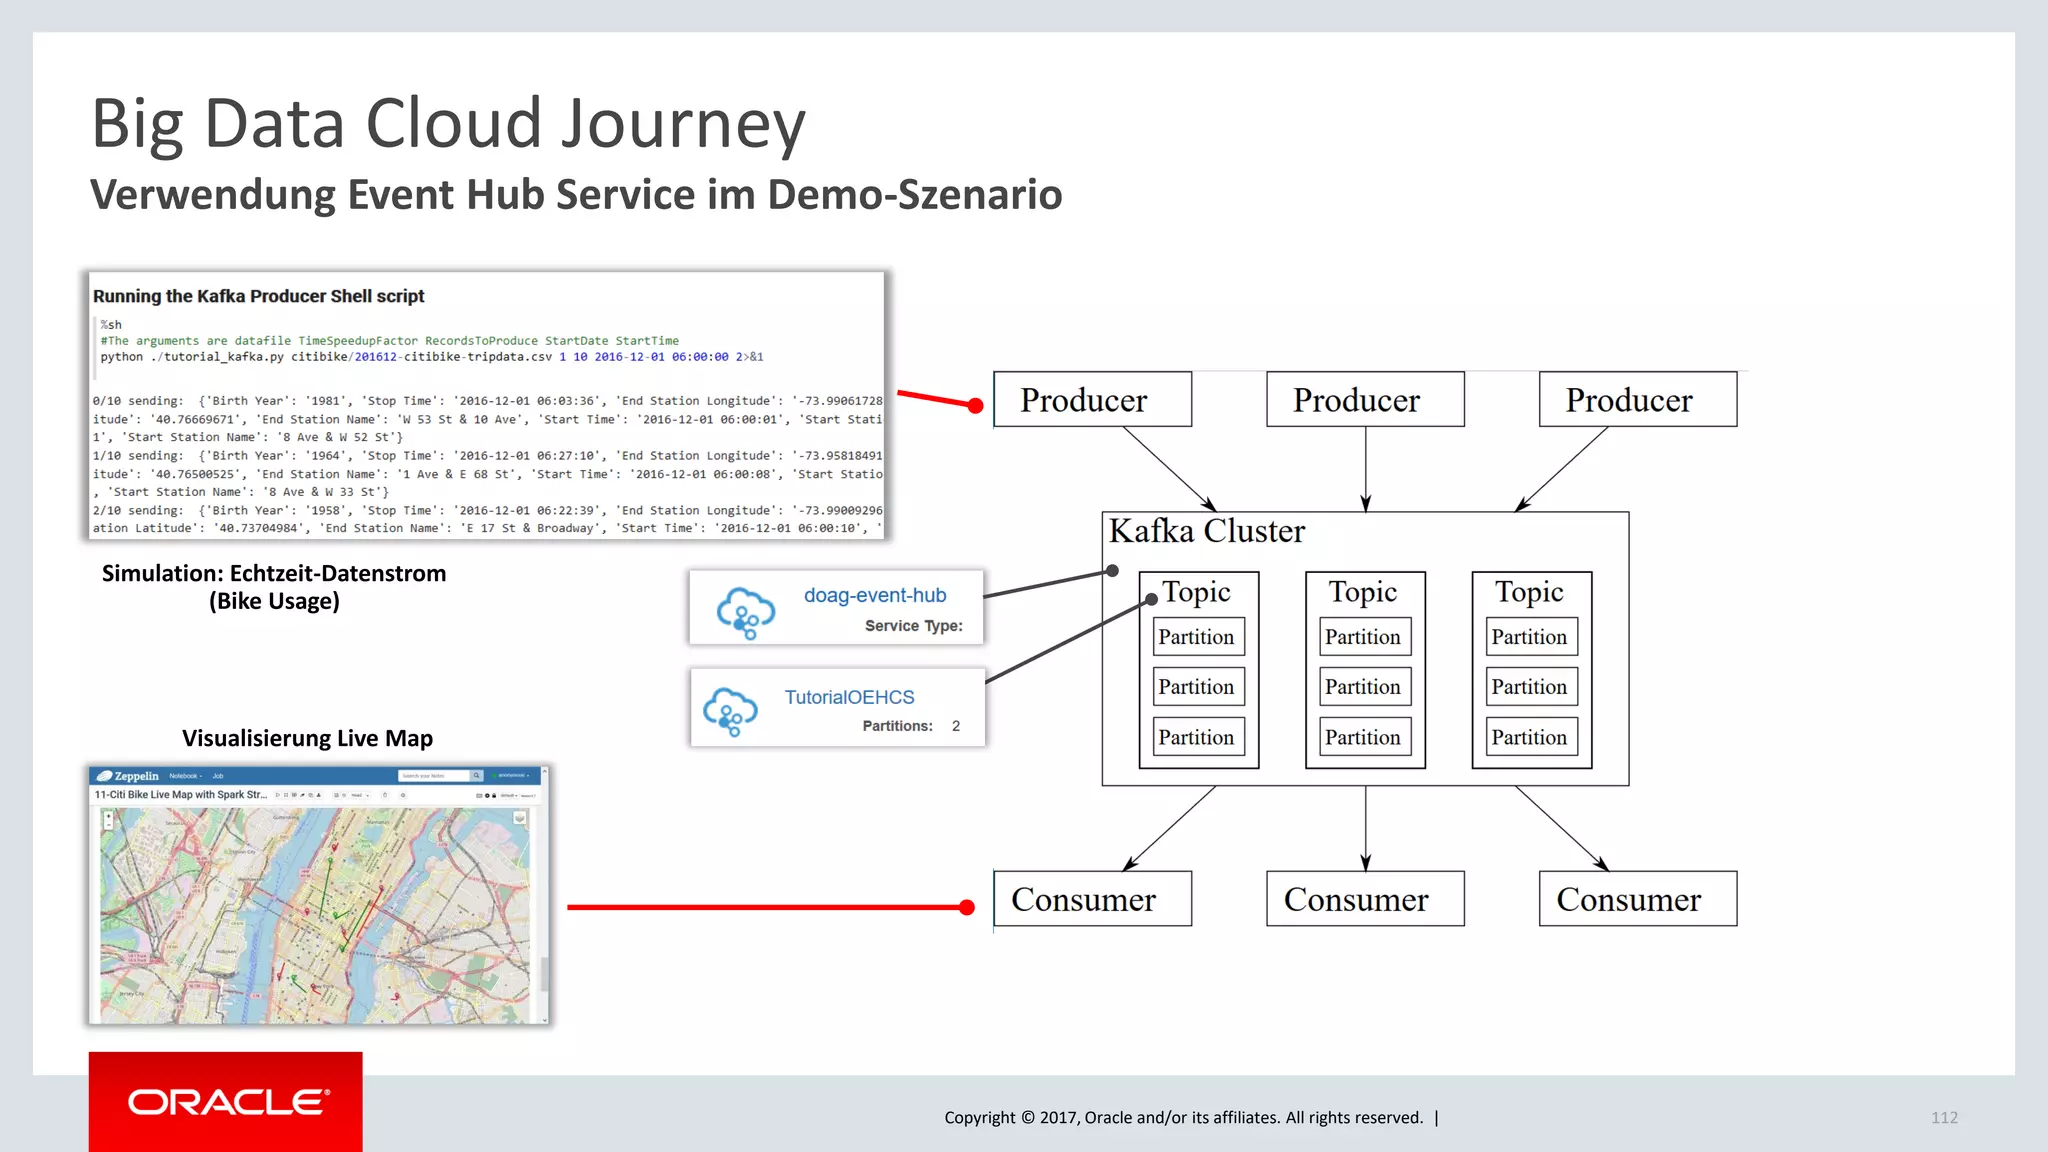
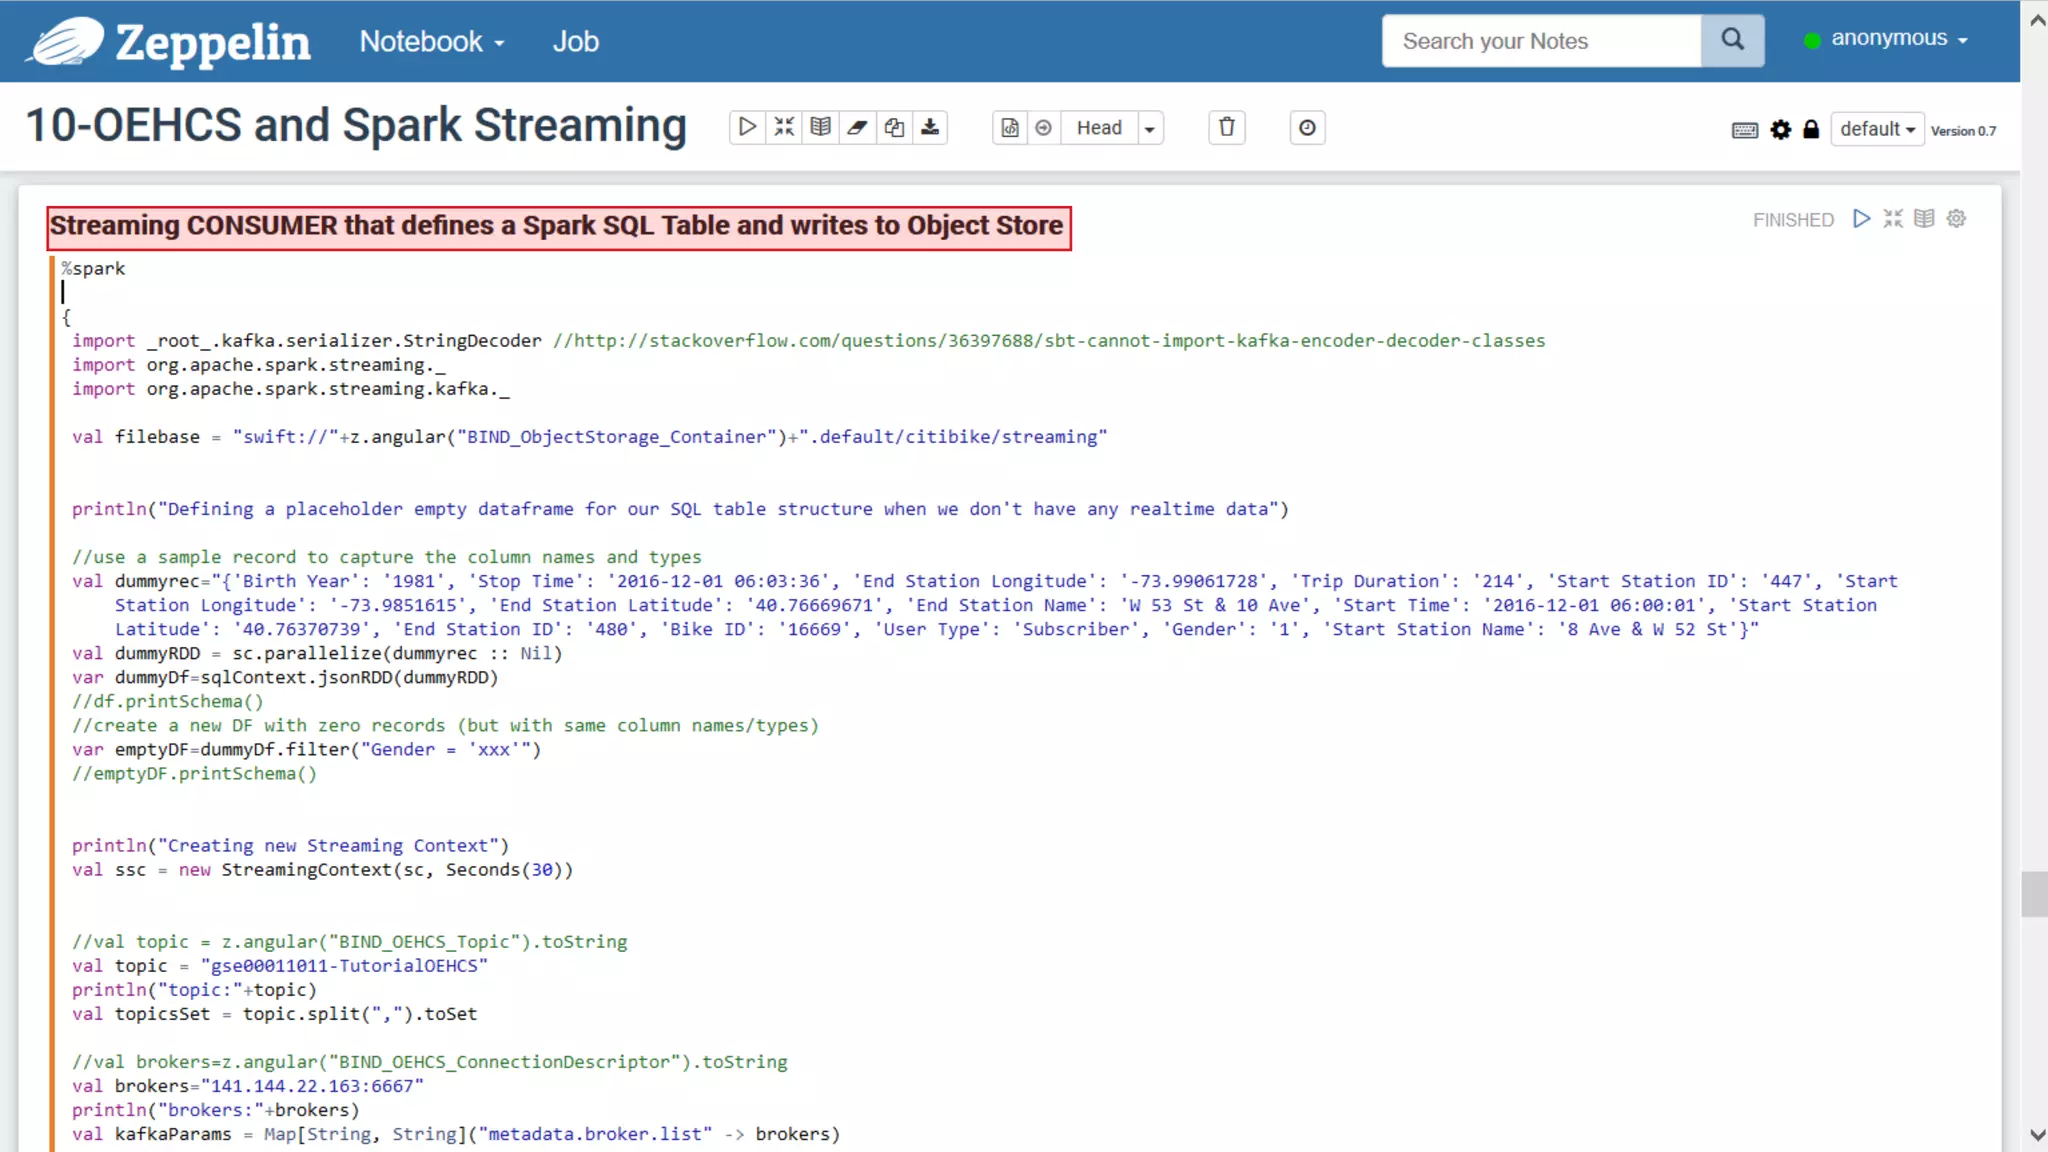
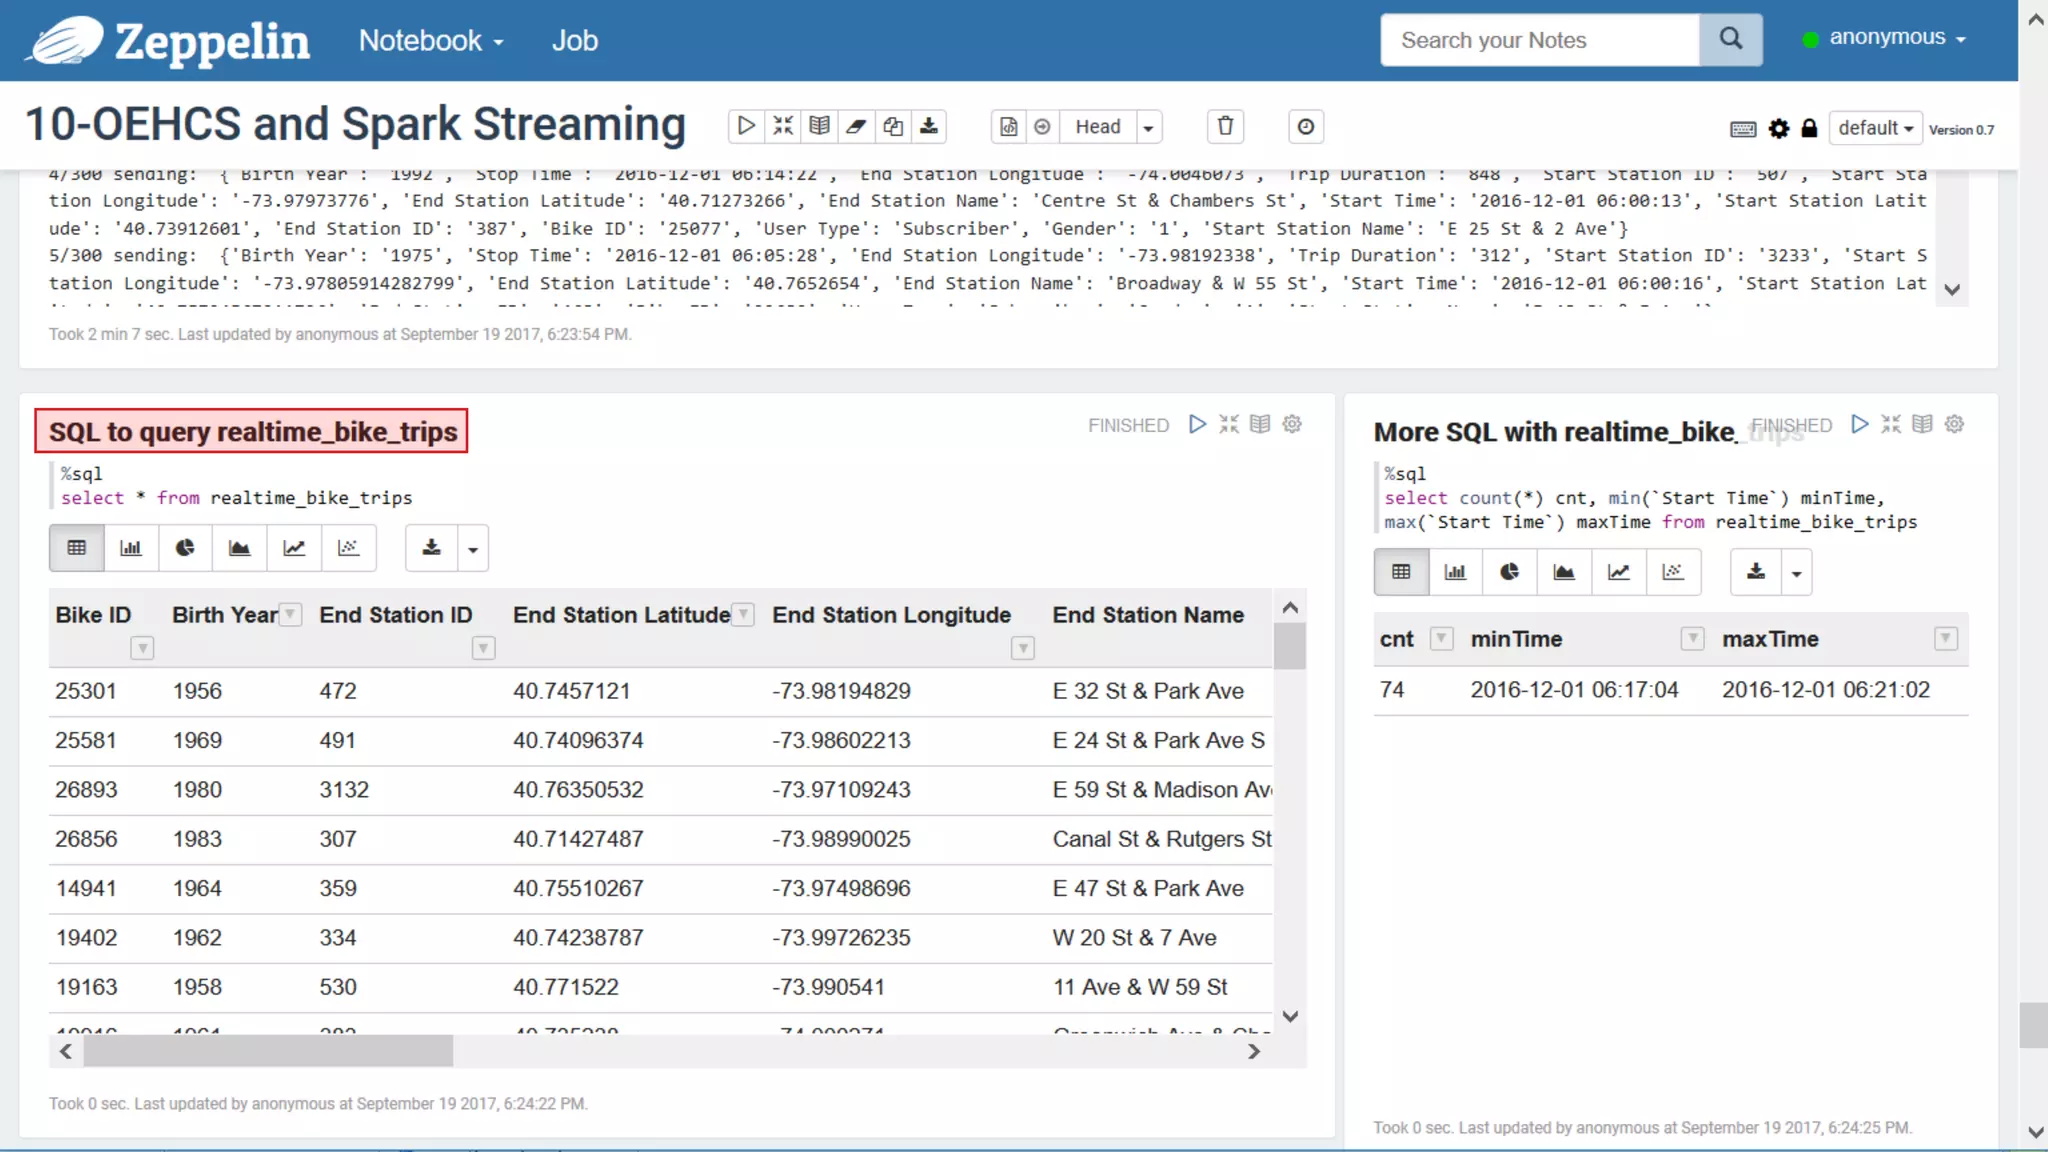
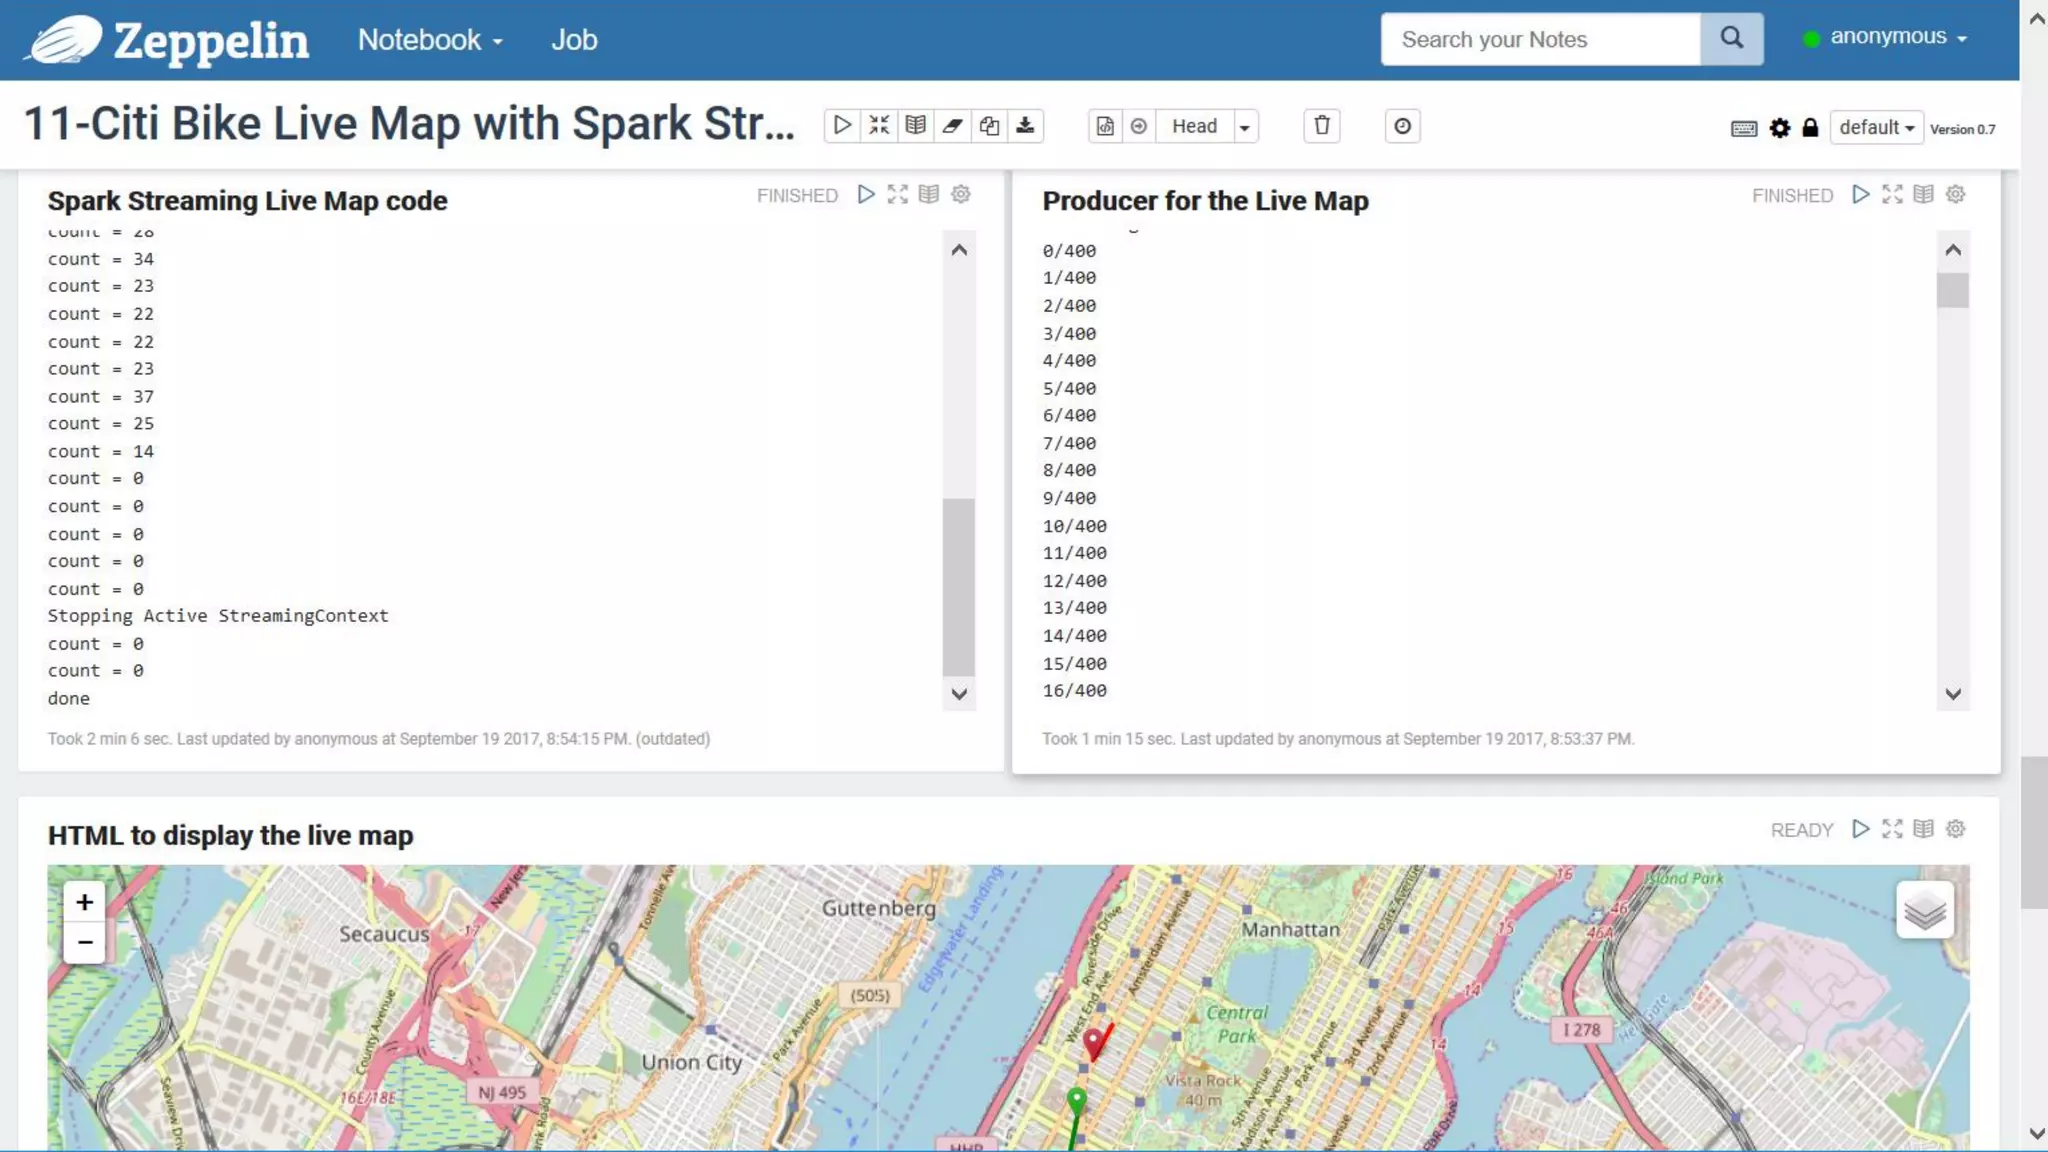
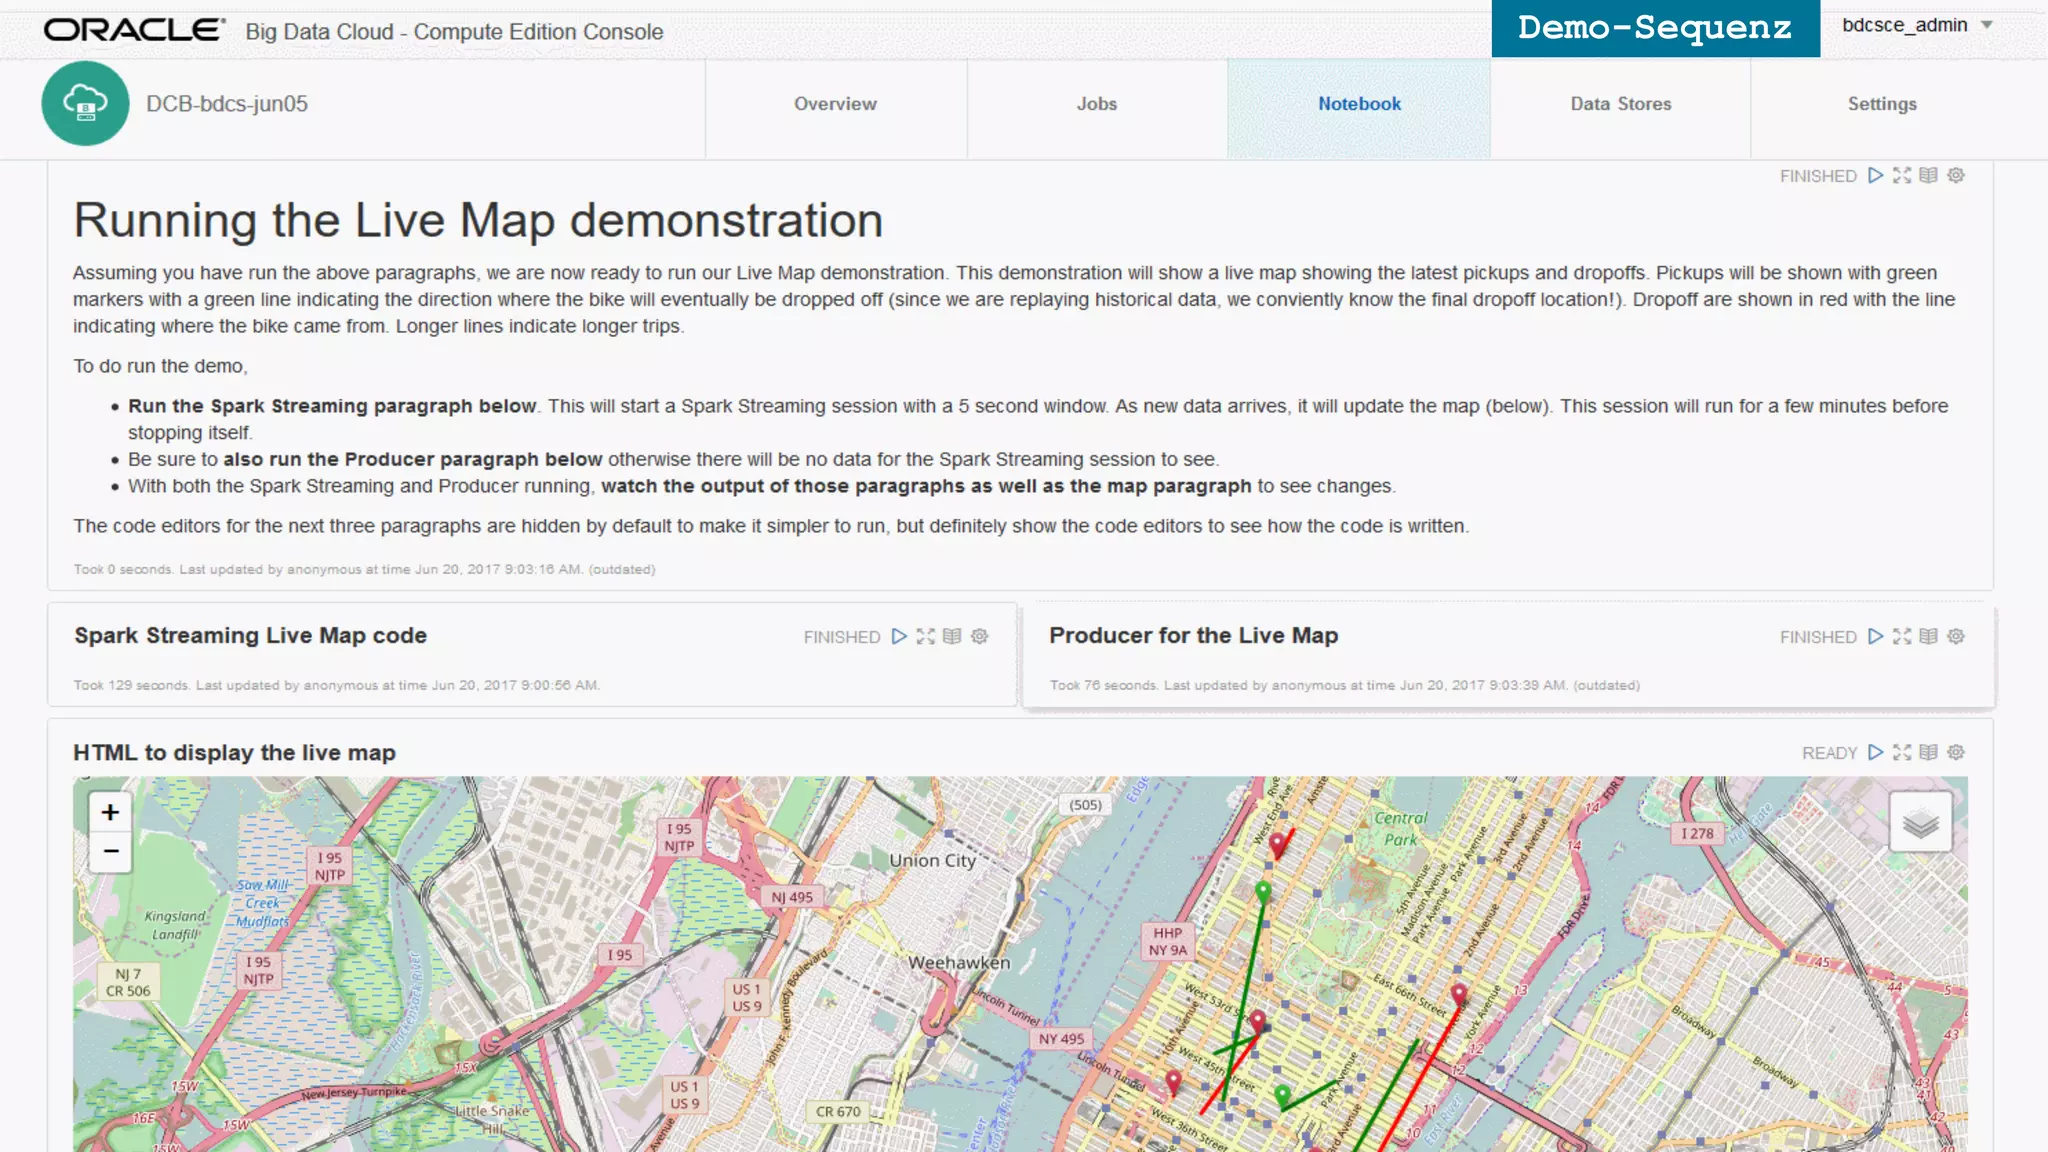
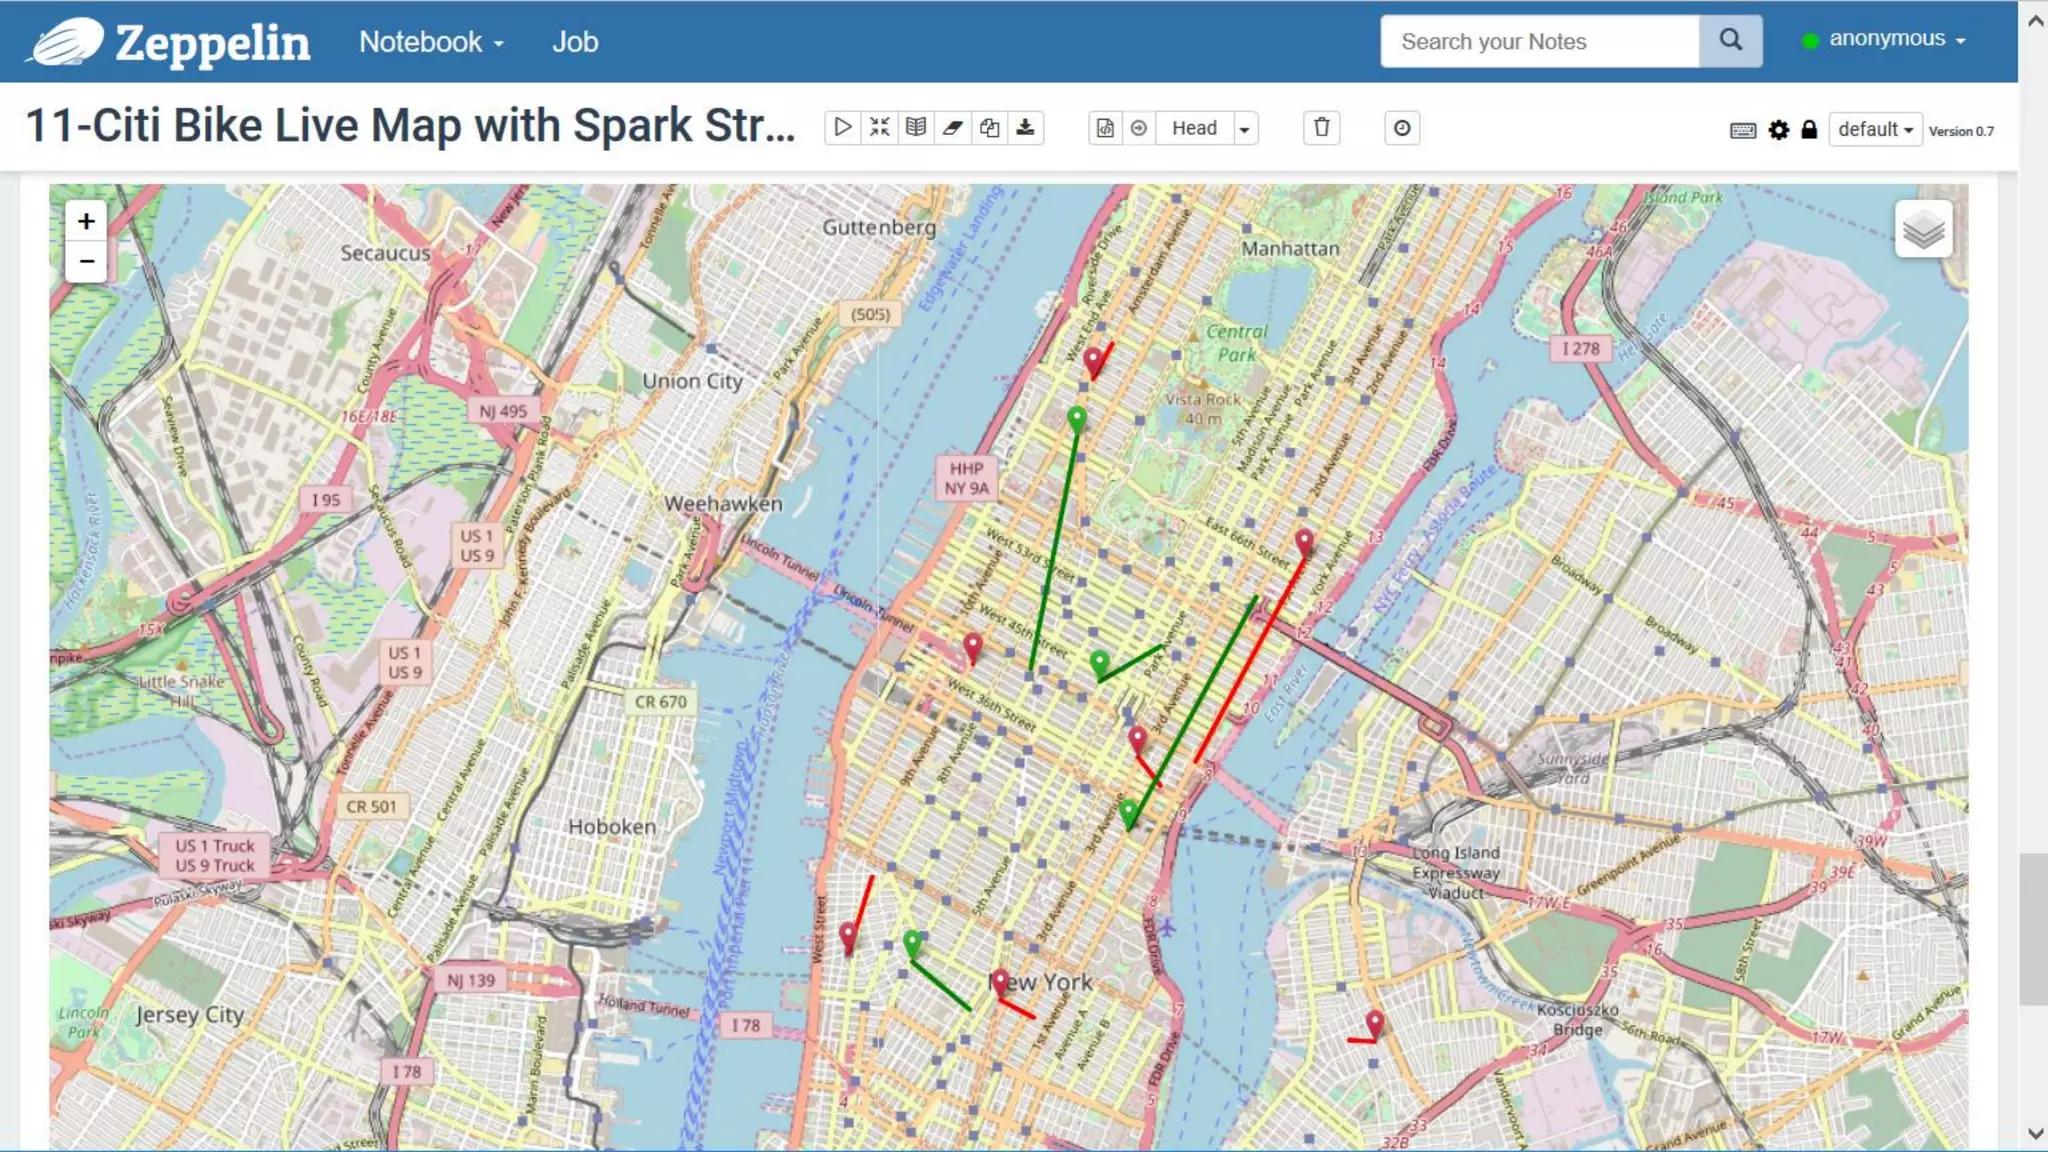
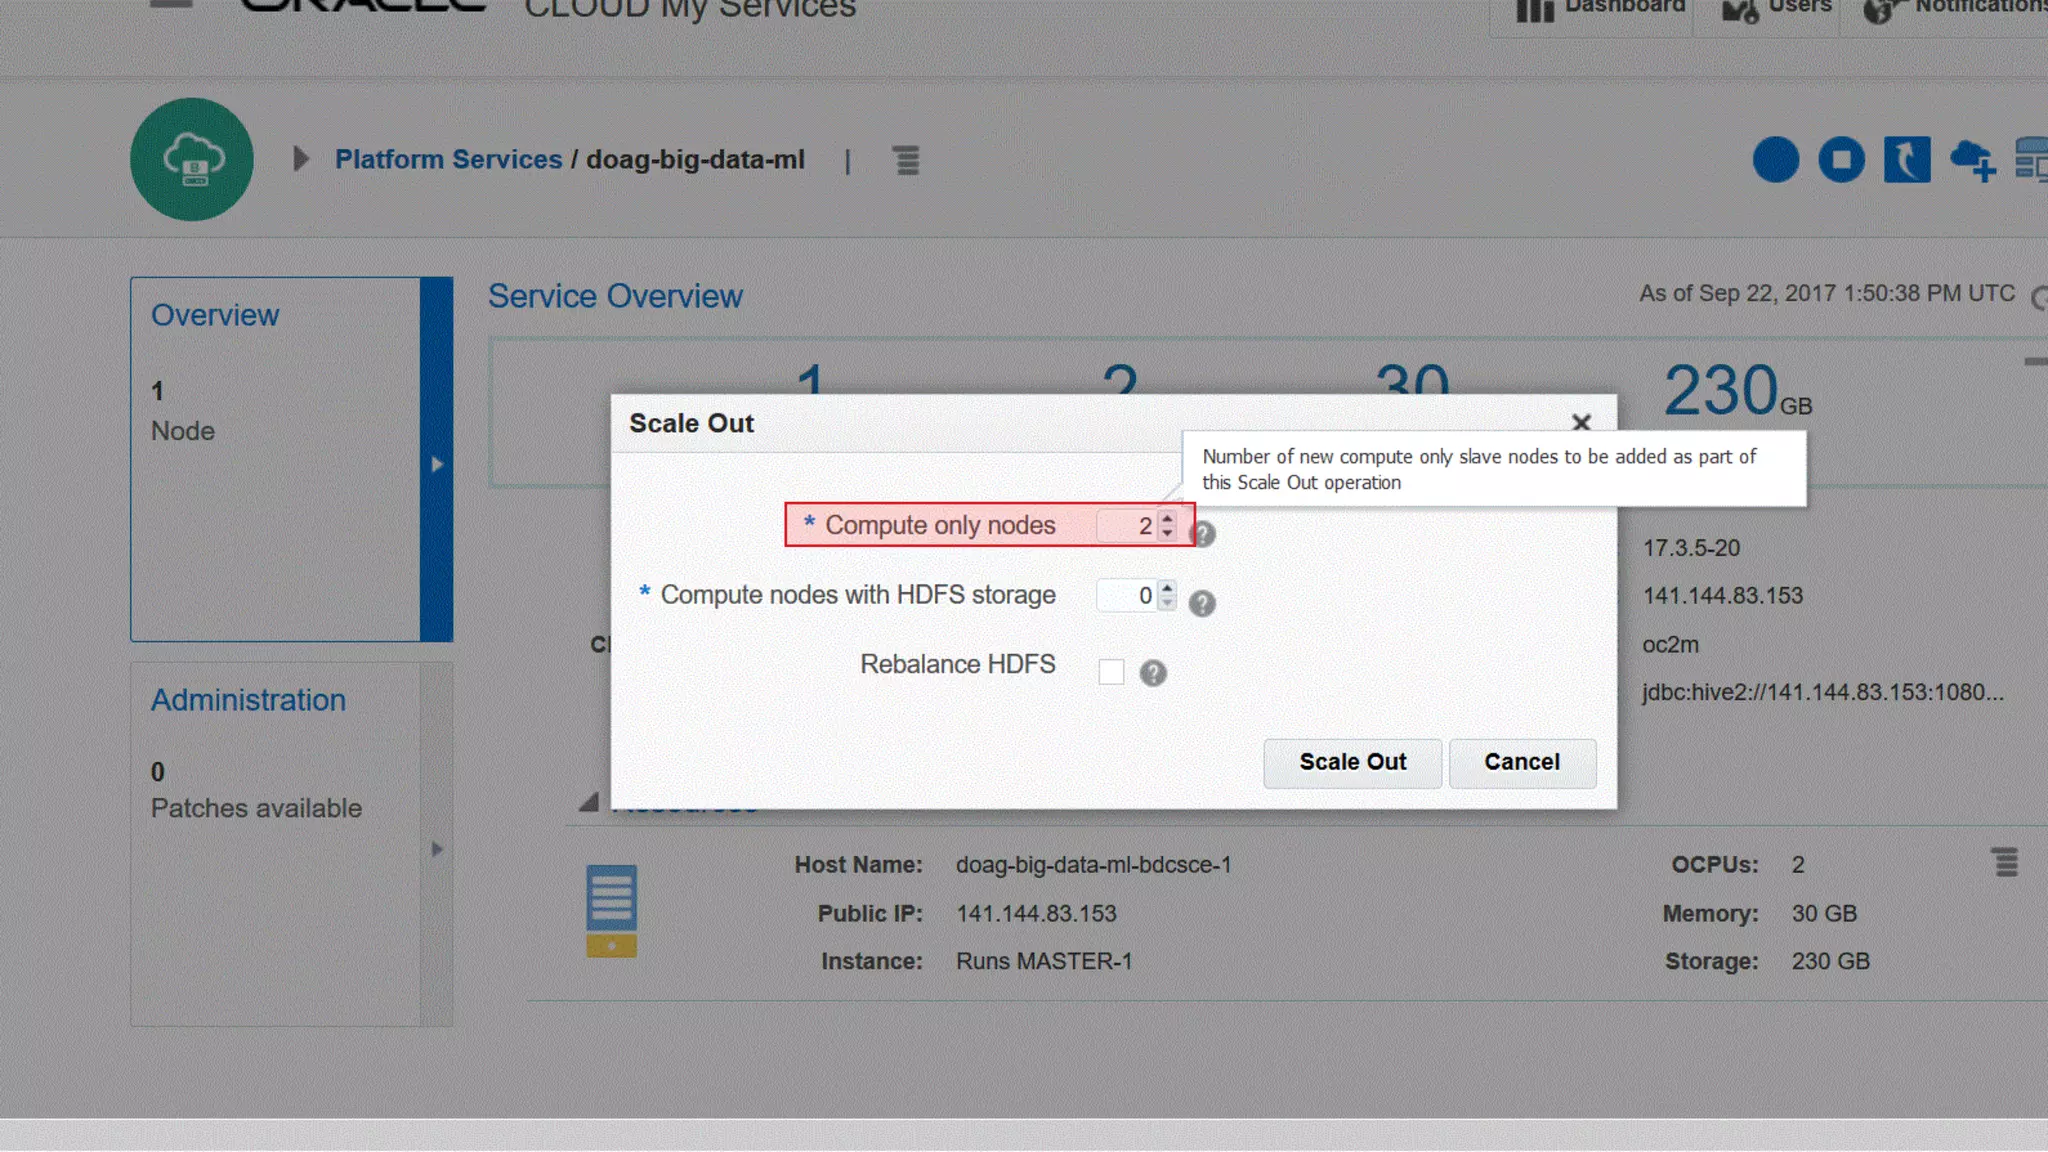
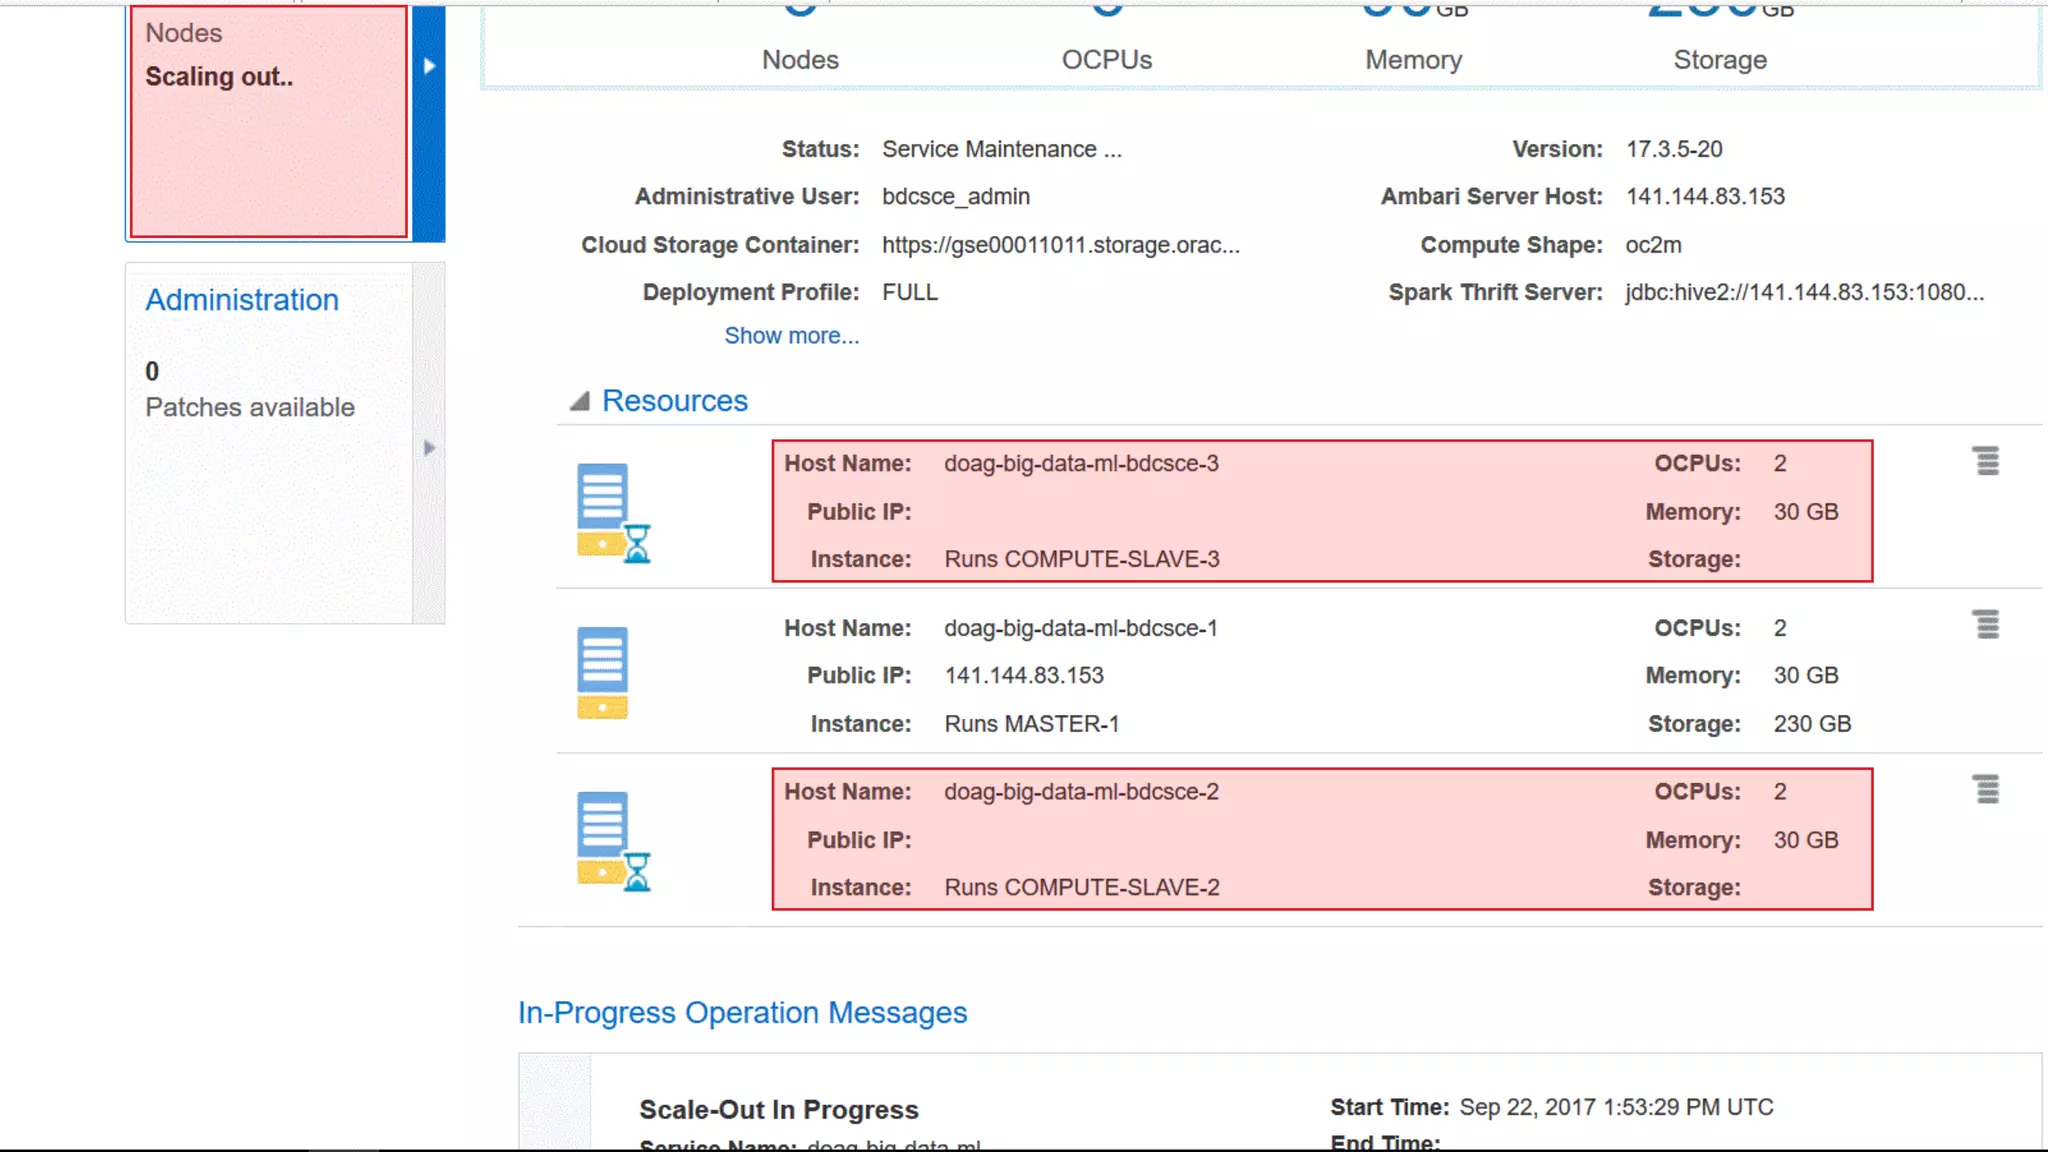
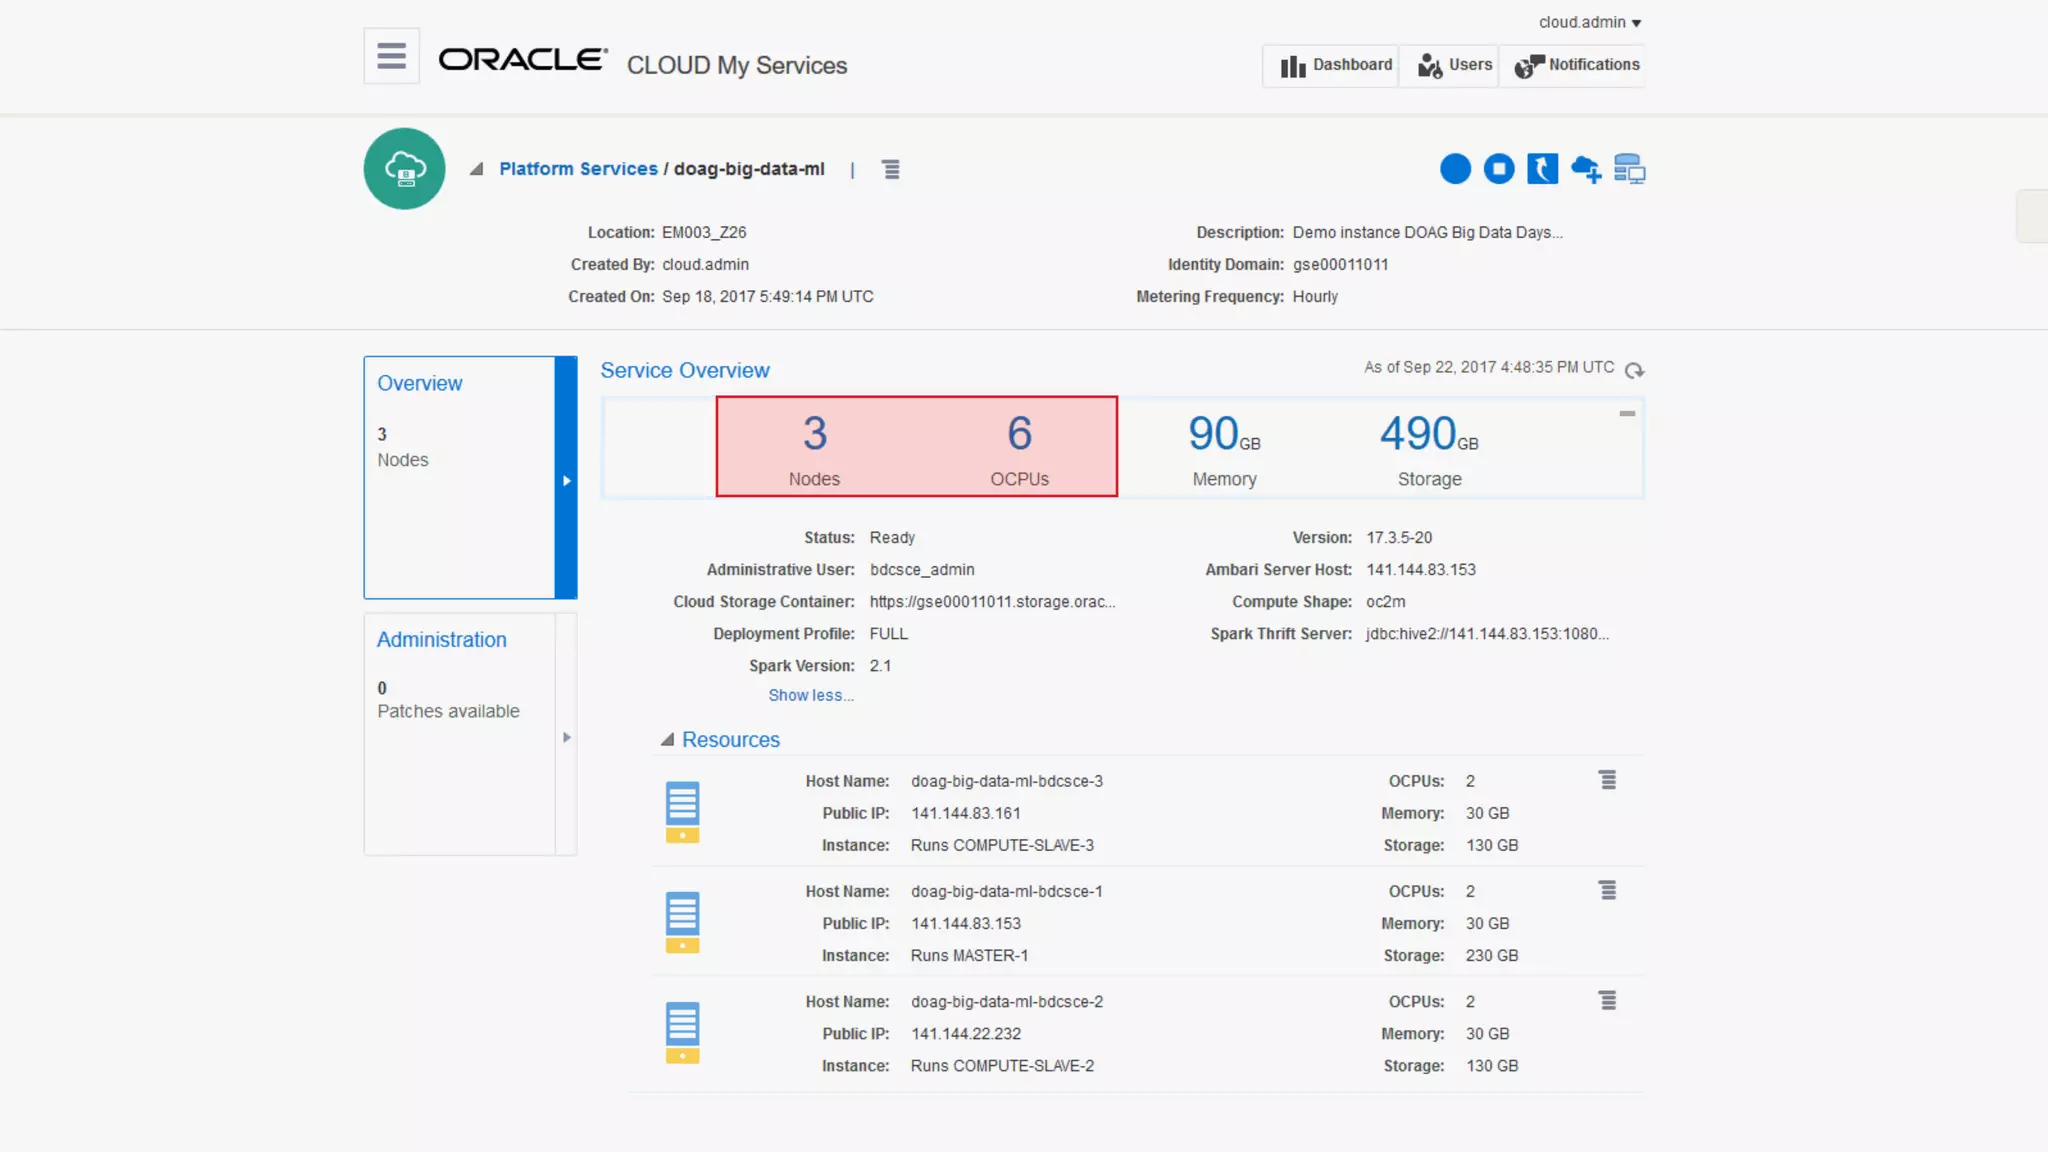
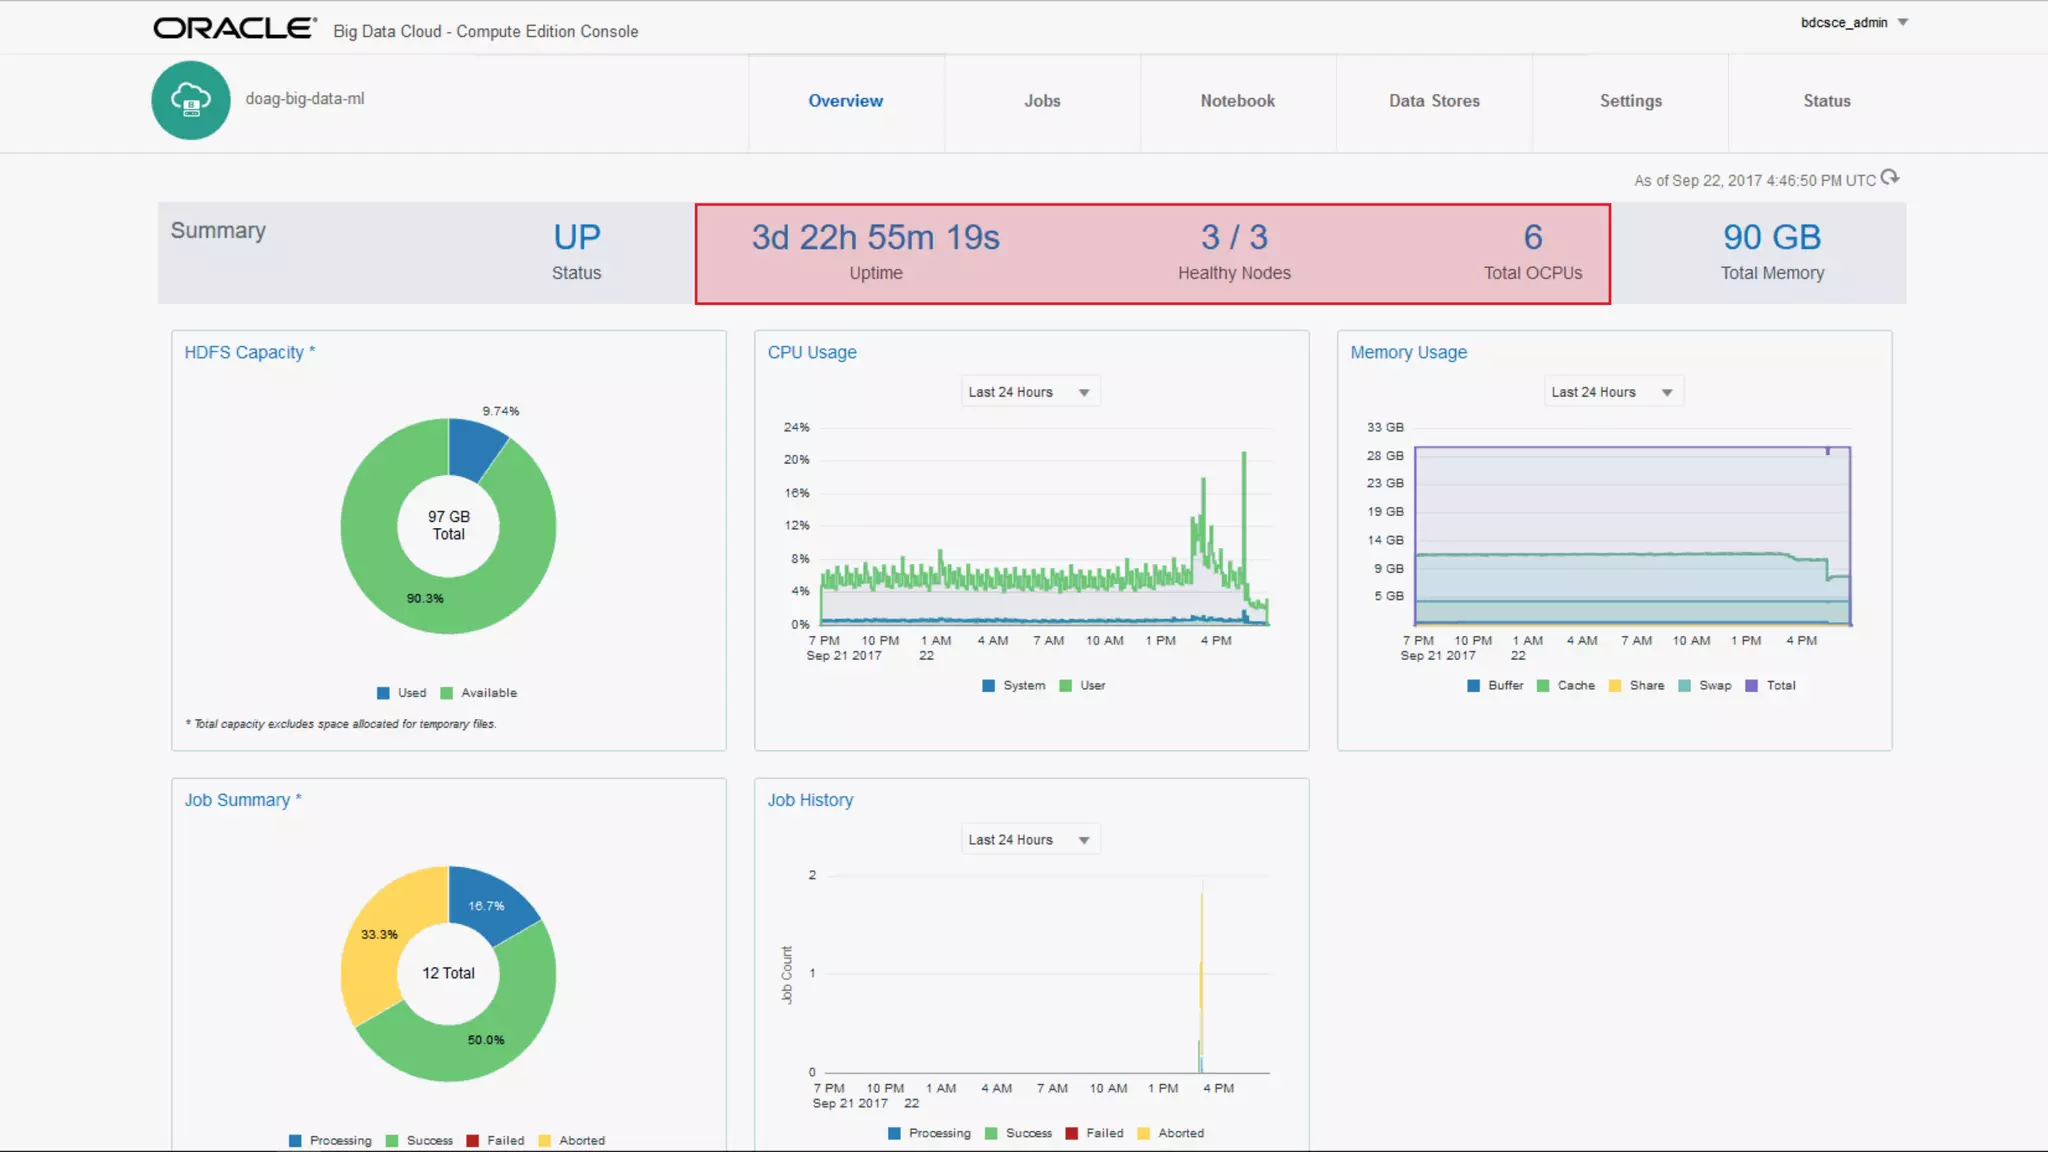
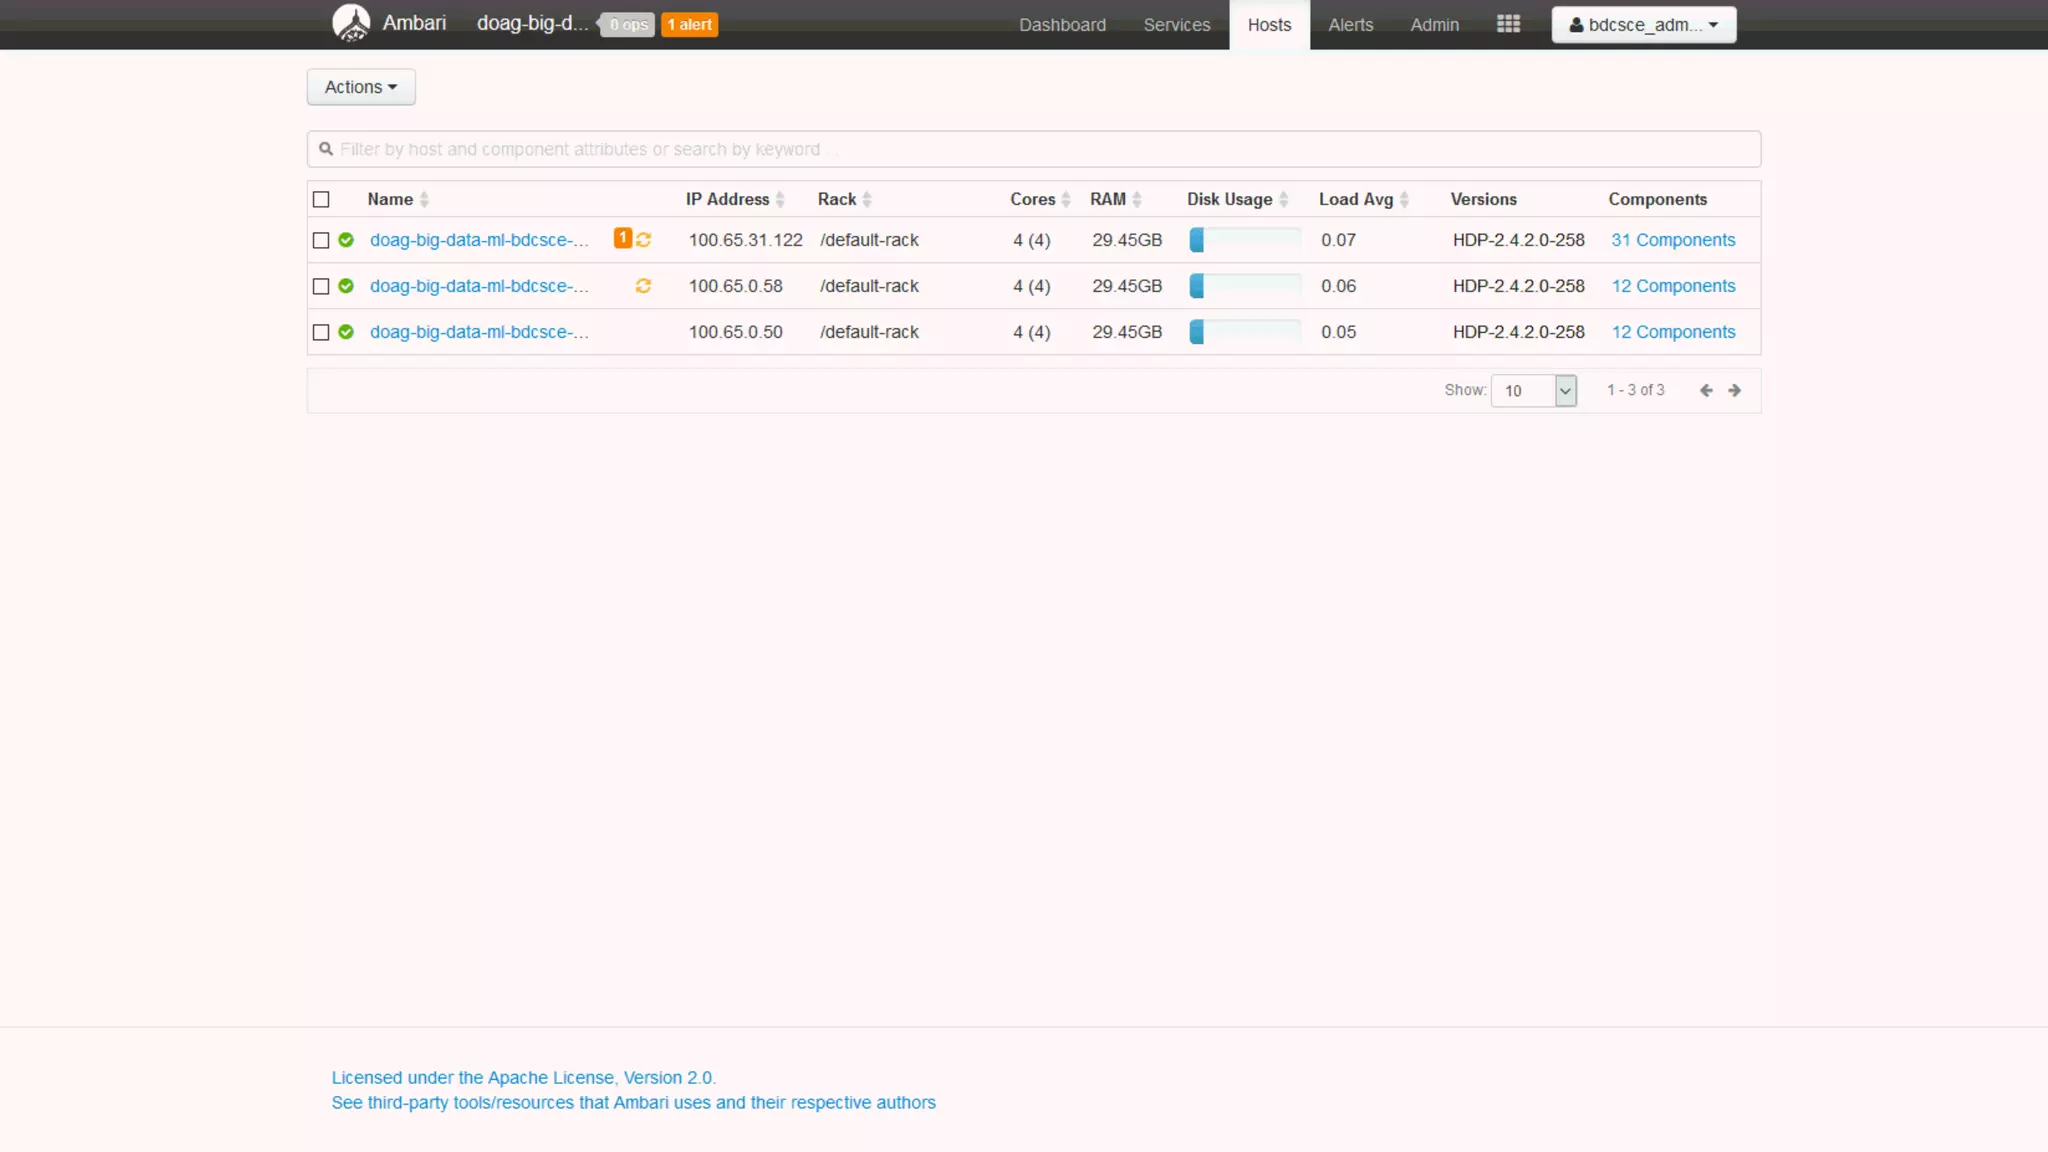
The document discusses Oracle's cloud-based data lake and analytics platform. It provides an overview of the key technologies and services available, including Spark, Kafka, Hive, object storage, notebooks and data visualization tools. It then outlines a scenario for setting up storage and big data services in Oracle Cloud to create a new data lake for batch, real-time and external data sources. The goal is to provide an agile and scalable environment for data scientists, developers and business users.
This document provides an overview and introduction to big data concepts presented by Paresh Motiwala for the New England SQL Server group. The presentation covers sources of big data, privacy concerns, storing data in Hadoop, processing data with MapReduce, and using tools like R, Python, and Power BI for analysis and visualization. It defines key big data concepts like the 5 V's and discusses challenges like volume, variety and velocity of data. It also summarizes strategies for companies to develop their data and cloud capabilities.
1. The document discusses Big Data analytics using Hadoop. It defines Big Data and explains the 3Vs of Big Data - volume, velocity, and variety.
2. It then describes Hadoop, an open-source framework for distributed storage and processing of large data sets across clusters of commodity hardware. Hadoop uses HDFS for storage and MapReduce for distributed processing.
3. The core components of Hadoop are the NameNode, which manages file system metadata, and DataNodes, which store data blocks. It explains the write and read operations in HDFS.
Introducing the Big Data Ecosystem with Caserta Concepts & TalendCaserta
This document summarizes a webinar presented by Talend and Caserta Concepts on the big data ecosystem. The webinar discussed how Talend provides an open source integration platform that scales to handle large data volumes and complex processes. It also overviewed Caserta Concepts' expertise in data management, big data analytics, and industries like financial services. The webinar covered topics like traditional vs big data, Hadoop and NoSQL technologies, and common integration patterns between traditional data warehouses and big data platforms.
This document provides an introduction to data lakes and discusses key aspects of creating a successful data lake. It defines different stages of data lake maturity from data puddles to data ponds to data lakes to data oceans. It identifies three key prerequisites for a successful data lake: having the right platform (such as Hadoop) that can handle large volumes and varieties of data inexpensively, obtaining the right data such as raw operational data from across the organization, and providing the right interfaces for business users to access and analyze data without IT assistance.
MapReduce allows distributed processing of large datasets across clusters of computers. It works by splitting the input data into independent chunks which are processed by the map function in parallel. The map function produces intermediate key-value pairs which are grouped by the reduce function to form the output data. Fault tolerance is achieved through replication of data across nodes and re-executing failed tasks. This makes MapReduce suitable for efficiently processing very large datasets in a distributed environment.
A high level overview of common Cassandra use cases, adoption reasons, BigData trends, DataStax Enterprise and the future of BigData given at the 7th Advanced Computing Conference in Seoul, South Korea
Bigdata and data warehousing can work in synergy by applying the structure of data warehousing to the large and unstructured datasets of bigdata. While data warehousing focuses on modeling data, co-locating related information, and optimizing queries, bigdata is better suited to analyzing unstructured data at scale through distributed systems without an upfront model. The two approaches complement each other by bringing structure to bigdata through modeling and applying bigdata's ability to analyze unstructured data at massive scale.
Big Data Analysis Patterns - TriHUG 6/27/2013boorad
Big Data Analysis Patterns: Tying real world use cases to strategies for analysis using big data technologies and tools.
Big data is ushering in a new era for analytics with large scale data and relatively simple algorithms driving results rather than relying on complex models that use sample data. When you are ready to extract benefits from your data, how do you decide what approach, what algorithm, what tool to use? The answer is simpler than you think.
This session tackles big data analysis with a practical description of strategies for several classes of application types, identified concretely with use cases. Topics include new approaches to search and recommendation using scalable technologies such as Hadoop, Mahout, Storm, Solr, & Titan.
IBM InfoSphere BigInsights provides Hadoop on cloud computing platforms so that users can analyze large volumes of data without requiring large upfront investments in hardware, storage, and networking. It allows users to deploy their own Hadoop clusters on public clouds like Amazon or private clouds in under 30 minutes, paying only for the resources used on an hourly basis starting at $0.34 per node per hour. BigInsights can be deployed on IBM SmartCloud Enterprise with hourly charges starting at $0.30 per cluster per hour and a free trial during a fall promotion. It makes evaluating and learning Hadoop easy without needing to configure hardware or install software.
This document provides an overview of big data. It defines big data as large volumes of diverse data that are growing rapidly and require new techniques to capture, store, distribute, manage, and analyze. The key characteristics of big data are volume, velocity, and variety. Common sources of big data include sensors, mobile devices, social media, and business transactions. Tools like Hadoop and MapReduce are used to store and process big data across distributed systems. Applications of big data include smarter healthcare, traffic control, and personalized marketing. The future of big data is promising with the market expected to grow substantially in the coming years.
Apache Hadoop and the Big Data Opportunity in Banking
The document discusses Apache Hadoop and how it can help banks leverage big data opportunities. It provides an overview of what Apache Hadoop is, how it works, and the core projects. It then discusses how Hadoop can help banks create value by detecting fraud, managing risk, improving products based on customer data analysis, and more. The presenters are from Hortonworks, the lead commercial company for Hadoop, and Tresata, a company focused on using Hadoop for banking applications.
Big data analytics is the use of advanced analytic techniques against very large, diverse data sets that include different types such as structured/unstructured and streaming/batch, and different sizes from terabytes to zettabytes. Big data is a term applied to data sets whose size or type is beyond the ability of traditional relational databases to capture, manage, and process the data with low-latency. And it has one or more of the following characteristics – high volume, high velocity, or high variety. Big data comes from sensors, devices, video/audio, networks, log files, transactional applications, web, and social media - much of it generated in real time and in a very large scale.
Analyzing big data allows analysts, researchers, and business users to make better and faster decisions using data that was previously inaccessible or unusable. Using advanced analytics techniques such as text analytics, machine learning, predictive analytics, data mining, statistics, and natural language processing, businesses can analyze previously untapped data sources independent or together with their existing enterprise data to gain new insights resulting in significantly better and faster decisions.
Big data refers to the large volume of structured and unstructured data that businesses receive daily. It has three key aspects - volume, variety, and velocity. Big data is important for making good use of data, benefiting from cloud storage capabilities, enabling data visualization, and finding new business opportunities. It can lead to improved efficiency, sales, costs, customer service, and products/services. Common software used for big data includes Hadoop, Pig, and Hive. Challenges include finding useful information, data silos, inaccurate data, and a lack of skilled workers. Potential application areas are analytics, integration, cleaning, and updating data. The future of big data involves addressing privacy, security, latency, and scaling issues with
Big data - what, why, where, when and howbobosenthil
The document discusses big data, including what it is, its characteristics, and architectural frameworks for managing it. Big data is defined as data that exceeds the processing capacity of conventional database systems due to its large size, speed of creation, and unstructured nature. The architecture for managing big data is demonstrated through Hadoop technology, which uses a MapReduce framework and open source ecosystem to process data across multiple nodes in parallel.
Introduction to Data Mining, Business Intelligence and Data ScienceIMC Institute
This document discusses data mining, business intelligence, and data science. It begins with an introduction to data mining, defining it as the application of algorithms to extract patterns from data. Business intelligence is defined as applications, infrastructure, tools, and practices that enable access to and analysis of information to improve decisions and performance. Data science is related to data mining, analytics, machine learning, and uses techniques from statistics and computer science to discover patterns in large datasets. The document provides examples of how data is used in areas like understanding customers, healthcare, sports, and financial trading.
The document discusses big data analysis and provides an introduction to key concepts. It is divided into three parts: Part 1 introduces big data and Hadoop, the open-source software framework for storing and processing large datasets. Part 2 provides a very quick introduction to understanding data and analyzing data, intended for those new to the topic. Part 3 discusses concepts and references to use cases for big data analysis in the airline industry, intended for more advanced readers. The document aims to familiarize business and management users with big data analysis terms and thinking processes for formulating analytical questions to address business problems.
This presentation introduces concepts of Big Data in a layman's language. Author does not claim the originality of the content. The presentation is made by compiling from various sources. Author does not claim copyrights or privacy issues.
Big data is exponentially rising in today's age of information and digital shrinkage. This presentation potentially clears the concept and revolving hype around it.
Big Data Real Time Analytics - A Facebook Case StudyNati Shalom
Building Your Own Facebook Real Time Analytics System with Cassandra and GigaSpaces.
Facebook's real time analytics system is a good reference for those looking to build their real time analytics system for big data.
The first part covers the lessons from Facebook's experience and the reason they chose HBase over Cassandra.
In the second part of the session, we learn how we can build our own Real Time Analytics system, achieve better performance, gain real business insights, and business analytics on our big data, and make the deployment and scaling significantly simpler using the new version of Cassandra and GigaSpaces Cloudify.
Big data refers to large volumes of diverse data that traditional database systems cannot effectively handle. With the rise of technologies like social media, sensors, and mobile devices, huge amounts of unstructured data are being generated every day. To gain insights from this "big data", alternative processing methods are needed. Hadoop is an open-source platform that can distribute data storage and processing across many servers to handle large datasets. Facebook uses Hadoop to store over 100 petabytes of user data and gain insights through analysis to improve user experience and target advertising. Organizations must prepare infrastructure like Hadoop to capture value from the growing "data tsunami" and enhance their business with big data analytics.
All about Big Data components and the best tools to ingest, process, store and visualize the data.
This is a keynote from the series "by Developer for Developers" powered by eSolutionsGrup.
The document discusses big data analytics and related topics. It provides definitions of big data, describes the increasing volume, velocity and variety of data. It also discusses challenges in data representation, storage, analytical mechanisms and other aspects of working with large datasets. Approaches for extracting value from big data are examined, along with applications in various domains.
Class lecture by Prof. Raj Jain on Big Data. The talk covers Why Big Data Now?, Big Data Applications, ACID Requirements, Terminology, Google File System, BigTable, MapReduce, MapReduce Optimization, Story of Hadoop, Hadoop, Apache Hadoop Tools, Apache Other Big Data Tools, Other Big Data Tools, Analytics, Types of Databases, Relational Databases and SQL, Non-relational Databases, NewSQL Databases, Columnar Databases. Video recording available in YouTube.
Big data comes from a variety of sources like social networks, sensors, and financial transactions. It is characterized by its volume, velocity, and variety. Hadoop and NoSQL platforms are commonly used to process and analyze big data. There are many opportunities for applications in domains like healthcare, retail, and finance. However, addressing the skills gap for data scientists remains a key challenge for fully realizing the potential of big data.
The document discusses big data, its history, technologies, and uses. It begins with an introduction to big data and defines it using the 3Vs/4Vs model, describing the volume, velocity, variety and increasingly veracity of data. It then discusses big data technologies like Hadoop, databases, reporting, dashboards and real-time analytics. Examples are given of how big data is used, such as understanding customers, optimizing business processes, improving health outcomes, and improving security and law enforcement. Requirements for big data analytics are also mentioned, including data management, analytics applications, and business interpretation.
IBM is helping companies leverage big data through its IBM big data platform and supercomputing capabilities. The document discusses how Vestas Wind Systems uses IBM's solution to analyze weather data and provide location site data in minutes instead of weeks from 2.8 petabytes to 24 petabytes of data. It also mentions how other customers like x+1, KTH Royal Institute of Technology, and University of Ontario-Institute of Technology are achieving growth, reducing traffic times, and improving patient outcomes respectively through big data analytics. The VP of IBM business development hopes readers will consider IBM for their big data challenges.
This document discusses high performance analytics and summarizes key capabilities of SAS Visual Analytics including easy analytics, visualizations for any skill level, calculated measures, automatic forecasting, and saved report packages. It also provides examples of public data sources that can be analyzed in SAS Visual Analytics including agricultural production and pricing data from India.
The document discusses the big data ecosystem, including the 3Vs of volume, velocity, and variety that define big data. It describes the data path from collection through processing to query, visualization, and analysis. For processing, it discusses batch and real-time paradigms using technologies like MapReduce. It also briefly touches on infrastructure, application, and data quality monitoring in big data systems. The document provides a high-level overview of the big data landscape and considerations for collecting, processing, and consuming data appropriately for business needs.
This document discusses using graphs for data analysis and provides examples of different types of graph algorithms and queries that can be performed on graph data. Some key points:
- Graphs can be used to represent relational datasets and enable different types of analysis than is possible on traditional relational models.
- Common graph algorithms discussed include centrality measures, community detection, pattern matching queries, and shortest path algorithms.
- Examples applications highlighted are fraud detection using financial transaction graphs and topic modeling on text data represented as a graph.
Expand a Data warehouse with Hadoop and Big Datajdijcks
After investing years in the data warehouse, are you now supposed to start over? Nope. This session discusses how to leverage Hadoop and big data technologies to augment the data warehouse with new data, new capabilities and new business models.
Modern data management using Kappa and streaming architectures, including discussion by EBay's Connie Yang about the Rheos platform and the use of Oracle GoldenGate, Kafka, Flink, etc.
Insights into Real-world Data Management ChallengesDataWorks Summit
Oracle began with the belief that the foundation of IT was managing information. The Oracle Cloud Platform for Big Data is a natural extension of our belief in the power of data. Oracle’s Integrated Cloud is one cloud for the entire business, meeting everyone’s needs. It’s about Connecting people to information through tools which help you combine and aggregate data from any source.
This session will explore how organizations can transition to the cloud by delivering fully managed and elastic Hadoop and Real-time Streaming cloud services to built robust offerings that provide measurable value to the business. We will explore key data management trends and dive deeper into pain points we are hearing about from our customer base.
Insights into Real World Data Management ChallengesDataWorks Summit
Data is your most valuable business asset and it's also your biggest challenge. This challenge and opportunity means we continually face significant road blocks toward becoming a data driven organisation. From the management of data, to the bubbling open source frameworks, the limited industry skills to surmounting time and cost pressures, our challenge in data is big.
We all want and need a “fit for purpose” approach to management of data, especially Big Data, and overcoming the ongoing challenges around the ‘3Vs’ means we get to focus on the most important V - ‘Value’.Come along and join the discussion on how Oracle Big Data Cloud provides Value in the management of data and supports your move toward becoming a data driven organisation.
Speaker
Noble Raveendran, Principal Consultant, Oracle
The document discusses how big data and analytics can transform businesses. It notes that the volume of data is growing exponentially due to increases in smartphones, sensors, and other data producing devices. It also discusses how businesses can leverage big data by capturing massive data volumes, analyzing the data, and having a unified and secure platform. The document advocates that businesses implement the four pillars of data management: mobility, in-memory technologies, cloud computing, and big data in order to reduce the gap between data production and usage.
The document discusses opportunities for enriching a data warehouse with Hadoop. It outlines challenges with ETL and analyzing large, diverse datasets. The presentation recommends integrating Hadoop and the data warehouse to create a "data reservoir" to store all potentially valuable data. Case studies show companies using this approach to gain insights from more data, improve analytics performance, and offload ETL processing to Hadoop. The document advocates developing skills and prototypes to prove the business value of big data before fully adopting Hadoop solutions.
AUSOUG - NZOUG-GroundBreakers-Jun 2019 - AI and Machine LearningSandesh Rao
Autonomous Database is one of the hottest Oracle products where we have attempted to use Machine Learning for several aspects of the service. This presentation takes a view on our current state of Diagnostic methodology in the Autonomous Database Cloud services and how do we process this data to find anomalies in them to troubleshoot them at a scale of several petabytes a year and conduct AIOps. Some of the use cases we will cover are a Log Anomaly timeline which we reduce significant amounts of logs using semi-supervised machine learning techniques to reduce logs and match them in near real time. We will cover techniques to analyze database issues using Machine learning techniques like Kmeans , TFIDF, Random Forests, and z-scores to predict if a spike in the CPU is a normal or abnormal spike. We will also talk about RNN’s with LSTM/GRU as some of the applications of how to predict faults before they happen. Some of the other use cases are to use convolution filters to determine maintenance windows within the database workloads, determine best times to do database backups, security anomaly timelines and many others. This is a production service and this can be used if you have a customer SR/defect today. The service is much more extensive inside the Oracle Autonomous Database Cloud. This presentation will accompany several examples with how to apply these techniques, machine learning knowledge is preferred but not a prerequisite
This document is a presentation on Big Data by Oleksiy Razborshchuk from Oracle Canada. The presentation covers Big Data concepts, Oracle's Big Data solution including its differentiators compared to DIY Hadoop clusters, and use cases and implementation examples. The agenda includes discussing Big Data, Oracle's solution, and use cases. Key points covered are the value of Oracle's Big Data Appliance which provides faster time to value and lower costs compared to building your own Hadoop cluster, and how Oracle provides an integrated Big Data environment and analytics platform. Examples of Big Data solutions for financial services are also presented.
This document provides an overview and agenda for a presentation on big data landscape and implementation strategies. It defines big data, describes its key characteristics of volume, velocity and variety. It outlines the big data technology landscape including data acquisition, storage, organization and analysis tools. Finally it discusses an integrated big data architecture and considerations for implementation.
1° Sessione Oracle CRUI: Analytics Data Lab, the power of Big Data Investiga...Jürgen Ambrosi
I dati sono il nuovo Capitale: come il capitale finanziario, sono una risorsa che deve essere gestita, raccolta e tenuta al sicuro, ma deve essere anche investita dalle organizzazioni che vogliono ottenere vantaggio competitivo. I dati non sono una risorsa nuova, ma soltanto oggi per la prima volta sono disponbili in abbondanza assieme alle tecnologie necessarie per massimizzarne il ritorno. Esattamente come l'elettricità fu una curiosità da laboratorio per molto tempo, finché non venne resa disponibile alle masse e dunque cambiò totalmente il volto dell'industria moderna.Ecco perché per accelerare il cambiamento è necessario un approccio innovativo alla esecuzione delle iniziative orientate ai Big Data: un laboratorio analitico come catalizzatore dell'innovazione (Data Lab).In questo webinar sulle tecnologie Oracle, utilizzeremo il consueto approccio del racconto basato su casi d’uso ed esperienze concrete.
The document provides an overview of various emerging technologies and trends that are influencing customers, including chatbots, blockchain, internet of things, and artificial intelligence. It discusses these technologies and how Oracle is addressing them through products and services like its blockchain cloud service, IoT cloud service, and intelligent bots platform.
18. Madhur Hemnani - Result Orientated Innovation with Oracle HR AnalyticsCedar Consulting
The document discusses Oracle's analytics cloud strategy and Oracle Analytics Cloud (OAC) platform. It covers OAC's features such as self-service report creation, data visualization capabilities, and integration with other Oracle products. The document also summarizes how customers can migrate existing on-premise analytics solutions like OBIEE, BICS, and DVCS to OAC. Finally, it provides an overview of Oracle Analytic Cloud - Essbase for flexible analytic applications and management reporting in the cloud.
Demystifying Data Warehousing as a Service - DFWKent Graziano
This document provides an overview and introduction to Snowflake's cloud data warehousing capabilities. It begins with the speaker's background and credentials. It then discusses common data challenges organizations face today around data silos, inflexibility, and complexity. The document defines what a cloud data warehouse as a service (DWaaS) is and explains how it can help address these challenges. It provides an agenda for the topics to be covered, including features of Snowflake's cloud DWaaS and how it enables use cases like data mart consolidation and integrated data analytics. The document highlights key aspects of Snowflake's architecture and technology.
Strata 2015 presentation from Oracle for Big Data - we are announcing several new big data products including GoldenGate for Big Data, Big Data Discovery, Oracle Big Data SQL and Oracle NoSQL
The document discusses Oracle's data integration products and big data solutions. It outlines five core capabilities of Oracle's data integration platform, including data availability, data movement, data transformation, data governance, and streaming data. It then describes eight core products that address real-time and streaming integration, ELT integration, data preparation, streaming analytics, dataflow ML, metadata management, data quality, and more. The document also outlines five cloud solutions for data integration including data migrations, data warehouse integration, development and test environments, high availability, and heterogeneous cloud. Finally, it discusses pragmatic big data solutions for data ingestion, transformations, governance, connectors, and streaming big data.
The document discusses Oracle's hybrid cloud solutions and deployment choices. It outlines Oracle's strategy of providing public cloud services that can be delivered within a customer's own data center (Oracle Cloud Machine) for security and compliance reasons. It also discusses Oracle's portfolio of engineered systems that can be deployed on-premises or in the public cloud to allow for flexible workload migration.
Solution Use Case Demo: The Power of Relationships in Your Big DataInfiniteGraph
In this security solution demo, we have integrated Oracle NoSQL DB with InfiniteGraph to demonstrate the power of using the right tools for the solution. By integrating the key value technology of Oracle with the InfiniteGraph distributed graph database, we are able to create new views of existing Call Detail Record (CDR) details to enable discovery of connections, paths and behaviors that may otherwise be missed.
Discover how to add value to your existing Big Data to increase revenues and performance!
Actionable Insights with AI - Snowflake for Data ScienceHarald Erb
Talk @ ScaleUp 360° AI Infrastructures DACH, 2021: Data scientists spend 80% and more of their time searching for and preparing data. This talk explains Snowflake’s Platform capabilities like near-unlimited data storage and instant and near-infinite compute resources and how the platform can be used to seamlessly integrate and support the machine learning libraries and tools data scientists rely on.
From the Data Work Out event:
Performant and scalable Data Science with Dataiku DSS and Snowflake
Managing the whole process of setting up a machine learning environment from end-to-end becomes significantly easier when using cloud-based technologies. The ability to provision infrastructure on demand (IaaS) solves the problem of manually requesting virtual machines. It also provides immediate access to compute resources whenever they are needed. But that still leaves the administrative overhead of managing the ML software and the platform to store and manage the data.
A fully managed end-to-end machine learning platform like Dataiku Data Science Studio (DSS) that enables data scientists, machine learning experts, and even business users to quickly build, train and host machine learning models at scale, needs to access data from many different sources and can also access data provided by Snowflake. Storing data in Snowflake has three significant advantages: a single source of truth, shorten the data preparation cycle, scale as you go.
The document discusses machine learning and artificial intelligence applications inside and outside of Snowflake's cloud data warehouse. It provides an overview of Snowflake and its architecture. It then discusses how machine learning can be implemented directly in the database using SQL, user-defined functions, and stored procedures. However, it notes that pure coding is not suitable for all users and that automated machine learning outside the database may be preferable to enable more business analysts and power users. It provides an example of using Amazon Forecast for time series forecasting and integrating it with Snowflake.
Delivering rapid-fire Analytics with Snowflake and TableauHarald Erb
Until recently, advancements in data warehousing and analytics were largely incremental. Small innovations in database design would herald a new data warehouse every
2-3 years, which would quickly become overwhelmed with rapidly increasing data volumes. Knowledge workers struggled to access those databases with development intensive BI tools designed for reporting, rather than exploration and sharing. Both databases and BI tools were strained in locally hosted environments that were inflexible to growth or change.
Snowflake and Tableau represent a fundamentally different approach. Snowflake’s multi-cluster shared data architecture was designed for the cloud and to handle logarithmically larger data volumes at blazing speed. Tableau was made to foster an interactive approach to analytics, freeing knowledge workers to use the speed of Snowflake to their greatest advantage.
Machine Learning - Eine Challenge für ArchitektenHarald Erb
Aufgrund vielfältiger potenzieller Geschäftschancen, die Machine Learning bietet, starten viele Unternehmen Initiativen für datengetriebene Innovationen. Dabei gründen sie Analytics-Teams, schreiben neue Stellen für Data Scientists aus, bauen intern Know-how auf und fordern von der IT-Organisation eine Infrastruktur für "heavy" Data Engineering & Processing samt Bereitstellung einer Analytics-Toolbox ein. Für IT-Architekten warten hier spannende Herausforderungen, u.a. bei der Zusammenarbeit mit interdisziplinären Teams, deren Mitglieder unterschiedlich ausgeprägte Kenntnisse im Bereich Machine Learning (ML) und Bedarfe bei der Tool-Unterstützung haben.
Do you know what k-Means? Cluster-Analysen Harald Erb
Cluster-Analysen sind heute "Brot und Butter"-Analysetechniken mit Verfahren, die zur Entdeckung von Ähnlichkeitsstrukturen in (großen) Datenbeständen genutzt werden, mit dem Ziel neue Gruppen in den Daten zu identifizieren. Der K-Means-Algorithmus ist dabei einer der einfachsten und bekanntesten unüberwachten Lernverfahren, das in verschiedenen Machine Learning Aufgabenstellung einsetzbar ist. Zum Beispiel können abnormale Datenpunkte innerhalb eines großen Data Sets gefunden, Textdokumente oder Kunden¬segmente geclustert werden. Bei Datenanalysen kann die Anwendung von Cluster-Verfahren ein guter Einstieg sein bevor andere Klassifikations- oder Regressionsmethoden zum Einsatz kommen.
In diesem Talk wird der K-Means Algorithmus samt Erweiterungen und Varianten nicht im Detail betrachtet und ist stattdessen eher als ein Platzhalter für andere Advanced Analytics-Verfahren zu verstehen, die heute „intelligente“ Bestandteile in modernen Softwarelösungen sind bzw. damit kombiniert werden können. Anhand von zwei Kurzbeispielen wird live gezeigt: (1) Identifizierung von Kunden-Cluster mit einem Big Data Discovery Tool und Python (Jupyter Notebook) und (2) die Realisierung einer Anomalieerkennung direkt im Echtzeitdatenstrom mit einer Stream Analytics Lösung von Oracle.
Exploratory Analysis in the Data Lab - Team-Sport or for Nerds only?Harald Erb
Talk held at DOAG 2016 conference (2016.doag.org/de/home) discussing a data lab concept incl.architecture blueprint, collaboration and tool examples based on Oracle solutions like Oracle Big Data Discovery (in combination with Jupyter Notebook)
Big Data Discovery + Analytics = Datengetriebene Innovation!Harald Erb
Vortrag von der DOAG 2015-Konferenz: Die Umsetzung von Datenprojekten muss man nicht zwangsläufig den sog. Data Scientists allein überlassen werden. Daten- und Tool-Komplexität im Umgang mit Big Data sind keine unüberwindbaren Hürden mehr für die Teams, die heute im Unternehmen bereits für Aufbau und Bewirtschaftung des Data Warehouses sowie dem Management bzw. der Weiterentwicklung der Business Intelligence-Plattform zuständig sind. In einem interdisziplinären Team bringen neben den technischen Rollen auch Fachanwender und Business Analysten von Anfang an ihr Domänenwissen in das Datenprojekt mit ein,
Oracle Big Data Discovery working together with Cloudera Hadoop is the fastest way to ingest and understand data. Powerful data transformation capabilities mean that data can quickly be prepared for consumption by the extended organisation.
DOAG News 2012 - Analytische Mehrwerte mit Big DataHarald Erb
Seit einigen Monaten wird „Big Data“ intensiv aber auch kontrovers diskutiert. Stellt dieser Ansatz die bestehende relationale Datenbankdominanz in Frage, zumindest für ausgewählte analytische Problemstellungen? Dieser Artikel zeigt nach einem einführenden Überblick anhand von Anwendungsfällen auf, wo die geschäftlichen Mehrwerte von Big Data Projekten liegen und wie diese neuen Erkenntnisse in die bestehenden Data Warehouse und Business Intelligence Projekte integriert werden können.
Oracle Unified Information Architeture + Analytics by ExampleHarald Erb
Der Vortrag gibt zunächst einen Architektur-Überblick zu den UIA-Komponenten und deren Zusammenspiel. Anhand eines Use Cases wird vorgestellt, wie im "UIA Data Reservoir" einerseits kostengünstig aktuelle Daten "as is" in einem Hadoop File System (HDFS) und andererseits veredelte Daten in einem Oracle 12c Data Warehouse miteinander kombiniert oder auch per Direktzugriff in Oracle Business Intelligence ausgewertet bzw. mit Endeca Information Discovery auf neue Zusammenhänge untersucht werden.
Endeca Web Acquisition Toolkit - Integration verteilter Web-Anwendungen und a...Harald Erb
Das einzig Beständige ist der Wandel: Kritische Informationen, die Unternehmen täglich als Entscheidungsgrundlage benötigen, unterliegen der permanenten Veränderung und sind noch dazu über viele interne und externe Quellen verteilt. Sei es in Dokumenten, E-Mails, auf Portalen und Websites, etc. – überall finden sich relevante Daten, die wertvolle Erkenntnisse für fundierte Geschäftsentscheidungen liefern können.
Technisch betrachtet müssen die zum Teil sehr schwer zugänglichen Informationen zunächst einmal von den verteilten Anwendungen und Datenquellen beschafft werden bevor die eigentliche Weiterverarbeitung im Data Warehouse stattfindet. Als graphisches Entwicklungswerkzeug setzt das Endeca Web Acquisition Toolkit (Endeca WAT) genau an diesem Punkt an, indem es das Erstellen synthetischer Schnittstellen ermöglicht. Z.B. sollen von einer kommerziellen Website Preisdaten und/oder Kundenbewertungen akquiriert werden, für die der Website-Betreiber keine API bereitstellt. Der nachfolgende Artikel bzw. Vortrag skizziert, wie das Endeca Web Acquisition Toolkit Integrationsaufgaben zur Anbindung externer Datenquellen im Rahmen der aktuellen Oracle Information Management Reference Architecture übernehmen kann
06-04-2024 - NYC Tech Week - Discussion on Vector Databases, Unstructured Data and AI
Round table discussion of vector databases, unstructured data, ai, big data, real-time, robots and Milvus.
A lively discussion with NJ Gen AI Meetup Lead, Prasad and Procure.FYI's Co-Found
Predictably Improve Your B2B Tech Company's Performance by Leveraging DataKiwi Creative
Harness the power of AI-backed reports, benchmarking and data analysis to predict trends and detect anomalies in your marketing efforts.
Peter Caputa, CEO at Databox, reveals how you can discover the strategies and tools to increase your growth rate (and margins!).
From metrics to track to data habits to pick up, enhance your reporting for powerful insights to improve your B2B tech company's marketing.
- - -
This is the webinar recording from the June 2024 HubSpot User Group (HUG) for B2B Technology USA.
Watch the video recording at https://youtu.be/5vjwGfPN9lw
Sign up for future HUG events at https://events.hubspot.com/b2b-technology-usa/
Learn SQL from basic queries to Advance queriesmanishkhaire30
Dive into the world of data analysis with our comprehensive guide on mastering SQL! This presentation offers a practical approach to learning SQL, focusing on real-world applications and hands-on practice. Whether you're a beginner or looking to sharpen your skills, this guide provides the tools you need to extract, analyze, and interpret data effectively.
Key Highlights:
Foundations of SQL: Understand the basics of SQL, including data retrieval, filtering, and aggregation.
Advanced Queries: Learn to craft complex queries to uncover deep insights from your data.
Data Trends and Patterns: Discover how to identify and interpret trends and patterns in your datasets.
Practical Examples: Follow step-by-step examples to apply SQL techniques in real-world scenarios.
Actionable Insights: Gain the skills to derive actionable insights that drive informed decision-making.
Join us on this journey to enhance your data analysis capabilities and unlock the full potential of SQL. Perfect for data enthusiasts, analysts, and anyone eager to harness the power of data!
#DataAnalysis #SQL #LearningSQL #DataInsights #DataScience #Analytics
ViewShift: Hassle-free Dynamic Policy Enforcement for Every Data LakeWalaa Eldin Moustafa
Dynamic policy enforcement is becoming an increasingly important topic in today’s world where data privacy and compliance is a top priority for companies, individuals, and regulators alike. In these slides, we discuss how LinkedIn implements a powerful dynamic policy enforcement engine, called ViewShift, and integrates it within its data lake. We show the query engine architecture and how catalog implementations can automatically route table resolutions to compliance-enforcing SQL views. Such views have a set of very interesting properties: (1) They are auto-generated from declarative data annotations. (2) They respect user-level consent and preferences (3) They are context-aware, encoding a different set of transformations for different use cases (4) They are portable; while the SQL logic is only implemented in one SQL dialect, it is accessible in all engines.
#SQL #Views #Privacy #Compliance #DataLake
STATATHON: Unleashing the Power of Statistics in a 48-Hour Knowledge Extravag...sameer shah
"Join us for STATATHON, a dynamic 2-day event dedicated to exploring statistical knowledge and its real-world applications. From theory to practice, participants engage in intensive learning sessions, workshops, and challenges, fostering a deeper understanding of statistical methodologies and their significance in various fields."
The Ipsos - AI - Monitor 2024 Report.pdfSocial Samosa
According to Ipsos AI Monitor's 2024 report, 65% Indians said that products and services using AI have profoundly changed their daily life in the past 3-5 years.
06-04-2024 - NYC Tech Week - Discussion on Vector Databases, Unstructured Data and AI
Discussion on Vector Databases, Unstructured Data and AI
https://www.meetup.com/unstructured-data-meetup-new-york/
This meetup is for people working in unstructured data. Speakers will come present about related topics such as vector databases, LLMs, and managing data at scale. The intended audience of this group includes roles like machine learning engineers, data scientists, data engineers, software engineers, and PMs.This meetup was formerly Milvus Meetup, and is sponsored by Zilliz maintainers of Milvus.
Global Situational Awareness of A.I. and where its headedvikram sood
You can see the future first in San Francisco.
Over the past year, the talk of the town has shifted from $10 billion compute clusters to $100 billion clusters to trillion-dollar clusters. Every six months another zero is added to the boardroom plans. Behind the scenes, there’s a fierce scramble to secure every power contract still available for the rest of the decade, every voltage transformer that can possibly be procured. American big business is gearing up to pour trillions of dollars into a long-unseen mobilization of American industrial might. By the end of the decade, American electricity production will have grown tens of percent; from the shale fields of Pennsylvania to the solar farms of Nevada, hundreds of millions of GPUs will hum.
The AGI race has begun. We are building machines that can think and reason. By 2025/26, these machines will outpace college graduates. By the end of the decade, they will be smarter than you or I; we will have superintelligence, in the true sense of the word. Along the way, national security forces not seen in half a century will be un-leashed, and before long, The Project will be on. If we’re lucky, we’ll be in an all-out race with the CCP; if we’re unlucky, an all-out war.
Everyone is now talking about AI, but few have the faintest glimmer of what is about to hit them. Nvidia analysts still think 2024 might be close to the peak. Mainstream pundits are stuck on the wilful blindness of “it’s just predicting the next word”. They see only hype and business-as-usual; at most they entertain another internet-scale technological change.
Before long, the world will wake up. But right now, there are perhaps a few hundred people, most of them in San Francisco and the AI labs, that have situational awareness. Through whatever peculiar forces of fate, I have found myself amongst them. A few years ago, these people were derided as crazy—but they trusted the trendlines, which allowed them to correctly predict the AI advances of the past few years. Whether these people are also right about the next few years remains to be seen. But these are very smart people—the smartest people I have ever met—and they are the ones building this technology. Perhaps they will be an odd footnote in history, or perhaps they will go down in history like Szilard and Oppenheimer and Teller. If they are seeing the future even close to correctly, we are in for a wild ride.
Let me tell you what we see.
The Building Blocks of QuestDB, a Time Series Databasejavier ramirez
Talk Delivered at Valencia Codes Meetup 2024-06.
Traditionally, databases have treated timestamps just as another data type. However, when performing real-time analytics, timestamps should be first class citizens and we need rich time semantics to get the most out of our data. We also need to deal with ever growing datasets while keeping performant, which is as fun as it sounds.
It is no wonder time-series databases are now more popular than ever before. Join me in this session to learn about the internal architecture and building blocks of QuestDB, an open source time-series database designed for speed. We will also review a history of some of the changes we have gone over the past two years to deal with late and unordered data, non-blocking writes, read-replicas, or faster batch ingestion.
4th Modern Marketing Reckoner by MMA Global India & Group M: 60+ experts on W...Social Samosa
The Modern Marketing Reckoner (MMR) is a comprehensive resource packed with POVs from 60+ industry leaders on how AI is transforming the 4 key pillars of marketing – product, place, price and promotions.
State of Artificial intelligence Report 2023kuntobimo2016
Artificial intelligence (AI) is a multidisciplinary field of science and engineering whose goal is to create intelligent machines.
We believe that AI will be a force multiplier on technological progress in our increasingly digital, data-driven world. This is because everything around us today, ranging from culture to consumer products, is a product of intelligence.
The State of AI Report is now in its sixth year. Consider this report as a compilation of the most interesting things we’ve seen with a goal of triggering an informed conversation about the state of AI and its implication for the future.
We consider the following key dimensions in our report:
Research: Technology breakthroughs and their capabilities.
Industry: Areas of commercial application for AI and its business impact.
Politics: Regulation of AI, its economic implications and the evolving geopolitics of AI.
Safety: Identifying and mitigating catastrophic risks that highly-capable future AI systems could pose to us.
Predictions: What we believe will happen in the next 12 months and a 2022 performance review to keep us honest.