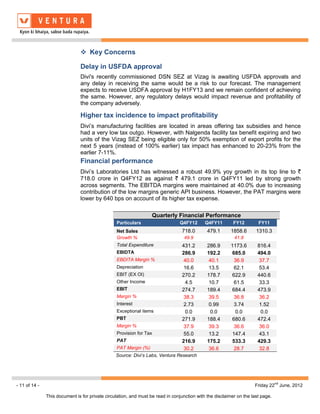
SlideShare a Scribd company logo
1 of 14
Download to read offline
Divi’s Laboratories Ltd.
                                                                                                                                                   BUY

  Target Price ` 1287                    CMP ` 952                                                                                   FY14 PE 15.5x

              Index Details             We initiate coverage on Divi's Laboratories Ltd as a BUY with a
  Sensex                 16,973         Price Objective of `1,287 (target 21.0x FY14 P/E). At CMP of ` 952,
  Nifty                   5,146         the stock is trading at 19.6x and 15.5x its estimated earnings for
  BSE 100                 5,141         FY13 & FY14 respectively, representing a potential upside of ~35%
  Industry               Pharma         over a period of 18 months. Being a leading player in the CRAMs
                                        space, Divi’s will be a key beneficiary of the increased generic
              Scrip Details
                                        opportunities emanating from the patent expiry cliff on the back of
                                        its expertise in complex chemistry, efficient and cost conscious
  Mkt Cap (` cr)          12,636
                                        processes and relationships with the top 25 global innovators. We
  BVPS (`)                160.6
                                        expect Divi's revenues and earnings to post a CAGR of 25.2% and
  O/s Shares (Cr)             13.3
                                        23.5% to `2915 crore and `814 crore, respectively by FY14.
  Av Vol (Lacs)               0.1
                                        Further, timely approvals for ready to market products can be a
  52 Week H/L            968/690        game changer for the company and further accelerate the pace of
  Div Yield (%)               1.4


                                                                                                                                                             STOCK POINTER
                                        growth.
  FVPS (`)                    2.0

                                       Continuous growth of the matured API product portfolio and
     Shareholding Pattern
                                        impending sales of the new ready to market API’s to fuel growth
  Shareholders                 %
  Promoters
                               
                              52.2
                                        In the generic API segment, Divi’s enjoys a significant market share in its key
                                        products and derives 47% of its revenue from the top 5 products, which are in the
  DIIs                        17.3      matured stage. The company also has a strong pipeline of ready to market products,
  FIIs                        9.6       in addition to its developmental pipeline, which provides Divi’s with strong revenue
  Public                      20.9      visibility over the long term. Seeing the robust growth potential in the API space, we
  Total                       100       expect revenues from this segment to grow at a CAGR of 19.6% to `1306.9 crore by
                                        FY14.
                               
      Divi’s Lab. vs. Sensex
                                       CRAMS on growth path leading to profitability
                                        Backed by the strong relationship with the innovators, presence across the entire
                                        CRAMS value chain and its ability to support the innovator in late life-cycle
                                        strategies has enabled Divi’s to establish itself as a leading player in the CRAMS
                                        space. Further, the increased focus of MNCs on outsourcing led by cost arbitrage
                                        and strong R&D capabilities will only benefit Divi’s. We expect this custom synthesis
                                        business to grow at a CAGR of 25% to ` 1277 crore by FY14.


  Key Financials (` in Cr)
               Net                                                         EPS Growth            RONW            ROCE            P/E             EV/EBITDA
  Y/E Mar                 EBITDA                  PAT           EPS
            Revenue                                                           (%)                 (%)             (%)             (x)                (x)
  2011       1307.1        491.5                  429.3         32.3          23.8                23.9            28.2           29.4               25.8
  2012       1858.6        685.0                  533.3         40.2          24.2                25.0            33.2           23.7               18.5
  2013E      2332.0        876.5                  646.2         48.7          21.2                25.2            34.5           19.6               14.4
  2014E      2915.2        1095.8                 813.7         61.3          25.9                25.8            35.4           15.5               11.6


                                                                                                                                          nd
- 1 of 14 -                                                                                                                  Friday 22         June, 2012
                        This document is for private circulation, and must be read in conjunction with the disclaimer on the last page.
 Strong execution and effective control to ensure sustained
                               margin
                              Compared to peers, Divi's have been able to maintain strong margins on account of its
                              ability to swiftly execute capex and ensure quick capacity ramp up. Divi’s policy of
                              adding capacities, only post clear visibility of orders ensures that there is no spare
                              capacity and strong cash flows from the very 1st week of operations leads to ROCE
                              being much higher than peers.

                               Valuation

                              At the CMP of ` 952, Divi's is trading at 19.6x and 15.5x its estimated earnings for
                              FY13 and FY14, respectively. Divi’s is trading at a considerable premium to its
                              counterparts in the domestic market i.e. Biocon, Jubilant as well as to the international
                              players. However, considering the high margin business, steady organic growth,
                              strong cash flows and high return ratios, we believe the premium is completely
                              justified. We initiate coverage on Divi's Laboratories Ltd as a BUY with a Price
                              Objective of `1287 (target 21.0x FY14 P/E) representing a potential upside of 35%
                              over the next 18 months.


                                                                                                                                nd
- 2 of 14 -                                                                                                         Friday 22        June, 2012

              This document is for private circulation, and must be read in conjunction with the disclaimer on the last page.
 Company Background
                              Divi's Laboratories Ltd (Divi's) has a significant presence in both Generic APIs and
                              CRAMS business, with each of these segments contributing equally to the topline. The
                              company operates predominately in the export market, which accounts for nearly 93%
                              of its overall revenue with ~75% of it coming from developed markets like the US and
                              EU.


                                                                          Geographical break-up

                                                                                ROW Asia
                                                                                 5% 4%


                                                                                                     North
                                                                                                    America
                                                                       Europe                         44%
                                                                        30%


                                                                                 Far East
                                                                                          India
                                                                                   9%
                                                                                           8%


                                                       Source: Divi’s Labs, Ventura Research


                              Divi’s has grown to emerge as a preferred supplier of generic APIs and key ingredients
                              for MNCs in the pharmaceutical segments, primarily on the back of its understanding
                              of complex chemistries and development of new process, which are globally
                              acceptable and cost efficient. In addition, the company has an unassailable track
                              record of being a leading player in the CRAMS segment and has one of the strongest
                              custom chemical synthesis (CCS) pipelines with presence in the entire life cycle of a
                              pharmaceutical product. This makes it a preferred one stop solution provider for the
                              pharma giants. Recently, Divi’s has entered into the lucrative carotenoid segment,
                              which would help in diversifying its API product mix.


                                                                                                                                nd
- 3 of 14 -                                                                                                         Friday 22        June, 2012

              This document is for private circulation, and must be read in conjunction with the disclaimer on the last page.
Divi’s Business Model


                                                Source: Divi’s Labs, Ventura Research


                              Divi’s currently owns four manufacturing facilities including the recently commissioned
                              DSN SEZ, Vishakhapatnam. The other three facilities being one in Nalgonda near
                              Hyderabad and two in Vishakhapatnam. DLL also owns four research centres with
                              functional focus across all verticals.


                                                               Divi’s Manufacturing Facilities

                                  Plant                    Location                    Remarks/Approvals
                                  Choutuppal Unit          AP, India           USFDA, cGMP, ISO-9001, ISO-14001
                                  Chippada Unit            AP, India       100% EOU,USFDA, cGMP, ISO-9001, ISO-14001
                                  Chippada Unit-SEZ        AP, India           USFDA, cGMP, ISO-9001, ISO-14001
                                  DSN SEZ                  AP, India             Awaiting International Approvals

                              Source: Divi’s Labs, Ventura Research


                                                                                                                                nd
- 4 of 14 -                                                                                                         Friday 22        June, 2012

              This document is for private circulation, and must be read in conjunction with the disclaimer on the last page.
 Key Investment Highlights

                             Continuous growth of the matured API product portfolio and
                              impending sales of the new ready to market API’s to fuel growth
                             In the generic API segment, Divi’s enjoys a significant market share in its key products
                              and derives 47% of its revenue from the top 5 products, which are in the matured stage.
                              Apart from this, the company also has a strong pipeline of ready to market products, in
                              addition to its developmental pipeline, which provides Divi’s with strong revenue
                              visibility over the long term. Seeing the robust growth potential in the API space, we
                              expect revenues from this segment to grow at a CAGR of 19.6% to `1306.9 crore by
                              FY14.
                                                                   Revenue- Generic API’s
                                                  1400    Rs.Crore                                                   60%

                                                  1200                                                               50%
                                                                                                                     40%
                                                  1000
                                                                                                                     30%
                                                   800                                                               20%
                                                   600                                                               10%
                                                                                                                     0%
                                                   400
                                                                                                                     -10%
                                                   200                                                               -20%
                                                      0                                                              -30%
                                                            FY10        FY11        FY12      FY13E       FY14E

                                                                     Generics APIs          Growth (%) RHS


                                               Source: Divi’s Labs, Ventura Research


                              Ripened product portfolio yielding long term benefits

                              Divi's focus on complex chemistry and expertise to develop proprietary, efficient
                              process to manufacture APIs lends the company a strong position in the competitive
                              market with its discernible pricing power. Presently, the company garners 47% of its
                              revenue from its top 5 products and is a market leader with significant market share
                              (>70%) in two key products (Naproxen and Dextromethorphan Hydrobromide). Since
                              Divi’s product portfolio consists of matured products, which have already undergone
                              significant price erosion due to generic competition, they are now unlikely to see any
                              pricing pressure, ensuring long term visibility of revenues and margin stability. Further,
                              the company‘s presence in complimentary therapies ensures limited threat from newer
                              therapies.


                                                                                                                                nd
- 5 of 14 -                                                                                                         Friday 22        June, 2012

              This document is for private circulation, and must be read in conjunction with the disclaimer on the last page.
Top Five Products

                                    Product name            Therapeutics                    Used for             Global Sales ($,mn)
                                    Naproxen                Osteoarthitris     Anti Inflammatory Drug                   377
                                    Dextromethorphan       Cold Medications    Cough Supressant                         249
                                    Nabumetone              Osteoarthitris     Anti Inflammatory Drug                   66.8
                                    Levodopa                     CNS           Parkinsion's Disease                      79
                                    Phenylephrine HCI            CNS           Decongestant, Dilate Pupils               26

                              Source: Divi’s Labs, Ventura Research


                              Anti Inflammatory drugs, Naproxen and Nabumetone used in the treatment of arthritis,
                              spondylitis, and other inflammatory conditions contributes around 25% to Divi's
                              generic API’s topline and are expected to grow at a annual rate of 10-15% over the
                              forecast period.

                              Dextromethorphan Hydrobromide (70% market share), another key product which
                              contributes to around 15% to topline is widely used as the main ingredient in the
                              formulation of cough syrups and tablets. Prices of Dextromethorphan Hydrobromide
                              have been rising steadily due to global shortage enabling Divi’s to take a price hike of
                              8% during the previous fiscal.

                              New products awaiting approval to catapult growth further
                              In addition to the existing portfolio, Divi's also has a strong developmental portfolio,
                              representing a market potential of USD 14.6 bn. Further, the company has products
                              awaiting USFDA approvals with market potential of $ 8.7 bn. Considering, Divi's strong
                              expertise and swift execution abilities demonstrated in the past, we expect Divi's to
                              effectively monetize the opportunity leading to strong revenue growth over the forecast
                              period. However, we have not factored the same in our valuations.

                                                               Product Available to be marketed

                                 Product name                     Therapeutics                 Used for               Global Sales ($, mn)
                                 Candesartan Cilexetil                CVS                   Hyper Tension                        1500
                                 Entacapone                           CNS                Parkinsions Disease                     100
                                 Losartan potassium                   CVS                  Hyper Tension                        1580.4
                                 Olmesartan Medoxomil                 CVS                   Hyper Tension                        2500
                                 Pregabalin                           CNS                Anti Convulsant Drug                    3063

                                Source: Divi’s Labs, Ventura Research


                              So far, Divi’s has registered 41 (Drug Master Files) DMFs with the US Food & Drug
                              Administration (USFDA) and 12 DMFs with the European Directorate for the Quality of
                              Medicine & Healthcare (EDQM).


                                                                                                                                nd
- 6 of 14 -                                                                                                         Friday 22        June, 2012

              This document is for private circulation, and must be read in conjunction with the disclaimer on the last page.
Product under Development

                                 PRODUCT NAME                     THERAPEUTICS                   USED FOR              Global Sales ($, mn)
                                 Aliskirin Hemifumarate                CVS               Lower Blood cholesterol               557
                                 Atazanavir                            CNS                        HIV                         1400
                                 Atorvastatin                          CVS               Lower Blood cholesterol             12000
                                 Bazedoxifene                          CNS            Post Menopausal Osteoporosis
                                 Chlophedianol HCL                     CNS                 Cough Supressant                       275
                                 Fesoterodine Fumarate                 CNS                     Anti- Diuretic                     140
                                 Fondaparinex                          CVS                   Anti Coagulant                       340
                                 Saxagliptin                      Anti Diabetic                Anti Diabetic                      160
                                 Seletracetam                          CNS                Anti Convulsant Drug
                                 Valgaciclovir                    Anti Infectives               Anti Viral                        575

                                Source: Divi’s Labs, Ventura Research


                                Foray into the fast growing Carotenoids market to enhance product
                                depth
                                Considering the huge potential of the carotenoids market, Divi’s has made a strategic
                                entry into the carotenoids business in FY09 through the launch of six key products.
                                This has helped Divi’s diversify into the food and processing industry, a marginal shift
                                from the current focus on pharmaceutical industry.


                     Global Carotenoids Market                                      Divi’s Carotenoid Segment Revenue
     1.3      $ bn                                                           250     Rs.Crore

     1.2
                                                                             200
     1.2

     1.1                                                                     150

     1.1
                                                                             100
     1.0
                                                                              50
     1.0

     0.9                                                                        0
                        2012                     2015E                                    2012              2013E                 2014E


 Source: Divi’s Labs, Ventura Research                                    Source: Divi’s Labs, Ventura Research


                                                                                                                                  nd
- 7 of 14 -                                                                                                           Friday 22        June, 2012

                This document is for private circulation, and must be read in conjunction with the disclaimer on the last page.
Globally, carotenoid is a $1 bn industry with the adroit players like BASP and DSM
                              leading the market. This business is expected to grow to $1.2 bn by 2015. At present,
                              carotenoids business contributes ` 82 crore (4.4%) to Divi's top-line and the
                              management expects it to grow to ` 150 and ` 250 crore by FY13 and FY14,
                              respectively. Considering the robust market potential and Divi’s strong execution skills,
                              we are confident about management abilities to achieve the desired levels of growth.

                                                                  Carotenoids product portfolio

                                  Product name                     Therapeutics                        Used for
                                  Beta-Carotene               Dietary Supplements          Geranylgeranyl Pyrophosphate
                                  Lycopene                    Anti-hyperlipidemic          Photosynthetic Organisms
                                  Astaxanthin                 Anti-hyperlipidemic          Terpenes
                                  Apocarotenal                Anti-hyperlipidemic          Spinach & Citrus
                                  Lutein                      Eye Preparations             Xanthophyll
                                  Canthaxanthin               Anti-hyperlipidemic          Terpenoids

                               Source: Divi’s Labs, Ventura Research


                               CRAMS business on growth path, leading to profitability
                              Backed by the strong relationship with the innovators, presence across the entire
                              CRAMS value chain and its ability to support the innovator companies in late life-cycle
                              strategies has enabled Divi’s to establish itself as a leading player in the CRAMS
                              space. Further, the increased focus of MNCs on outsourcing led by cost arbitrage and
                              strong R&D capabilities will only benefit Divi’s. We expect this custom synthesis
                              business to grow at a CAGR of 25% to ` 1277 crore by FY14.

                                                                   Revenue- Custom Synthesis
                                             1400    Rs.Crore                                                   50%

                                             1200                                                               40%
                                                                                                                30%
                                             1000
                                                                                                                20%
                                              800
                                                                                                                10%
                                              600
                                                                                                                0%
                                              400
                                                                                                                -10%
                                              200                                                               -20%
                                                0                                                               -30%
                                                       FY10         FY11      FY12       FY13E       FY14E

                                                                Custom Synthesis        Growth (%) RHS


                                         Source: Divi’s Labs, Ventura Research


                                                                                                                                 nd
- 8 of 14 -                                                                                                          Friday 22        June, 2012

              This document is for private circulation, and must be read in conjunction with the disclaimer on the last page.
Indian CRAMS industry has grown at a CAGR of 47% over the past three years led by
                              enhanced outsourcing budgets of Big Pharma companies. Currently MNCs, outsource
                              only 25-35% of the CRO activities but with enhanced capabilities, the chunk is all likely
                              to increase. Going ahead, the scenario is expected to get more favorable on account
                              of the impending patent cliff.

                              Divi’s presence in the entire life cycle of a pharmaceutical product makes it the most
                              preferred one - stop solution provider for leading pharmaceutical companies. This is
                              re-iterated by the fact that the Top 25 innovators are already customers to Divi’s. The
                              company also provides complete regulatory supports, including DMF filing and large
                              scale component manufacturing, which helps innovators to meet their requirement
                              under one roof.


                                                   Life cycle of pharmaceutical product

                                                              Identifying/disc
                                                                overing new                   Drug
                                                                 molecule                     Discovery


                                                                                                Patent
                                                                                                Filing
                                                                    Pre
                                   Custom                    clinical/Phase I,
                                                                                                 Drug
                                   Synthesis                 Phase IIa, Phase
                                                                                                 Development
                                                              IIb & Phase III
                                                                                                  Regulatory
                                                                                                  Approval

                                                                Commercial
                                                                  launch


                                                                                                  End of Patent
                                                                                                  protection

                                      Generic                    Generics
                                      APIs                       entering


              Source: Divi’s Labs, Ventura Research


                                Strong execution, product portfolio selection, and weakening
                                 rupee to ensure sustain margin
                              Compared to peers, Divi's have been able to maintain strong margins on account of its
                              ability to swiftly execute capex and ensure quick capacity ramp up. Divi’s policy of
                              adding capacities, only post clear visibility of orders ensures that there is no spare
                              capacity and strong cash flows from the very 1st week of operations leads to ROCE
                              being much higher than peers.

                              Unlike its peers, Divi’s limits its focus to complex chemistry and development of cost
                              efficient processes to manufacture them. This cost competitiveness helps Divi’s to
                              acquire market share and command premium.
              Source: Divi’s Lab, Ventura Research
                                                                                                                                nd
- 9 of 14 -                                                                                                         Friday 22        June, 2012

              This document is for private circulation, and must be read in conjunction with the disclaimer on the last page.
Margin Charts (%)                                                                       Peer Comparison Charts
   60                                                                                             35

   55                                              Affected by inventory                                                                              Divi's Lab Ltd
                                                                                                  30
   50                                              destocking by global
                                                   pharma giant                                   25
   45


                                                                                 PAT Margin (%)
   40
                                                                                                  20
   35                                                                                                                                Biocon Ltd.
   30                                                                                             15
                                                                                                            Piramal       Jubilant Life
   25                                                                                                      Healthcare     Sciences. Ltd
                                                                                                  10
   20
   15                                                                                              5                         Dishman
                                                                                                                             Pharma
   10
                                                                                                   0
        FY06    FY07   FY08   FY09   FY10   FY11    FY12 FY13E FY14E                                   -       10.00         20.00            30.00            40.00
                                                                                                                        EBITDA Margin (%)
               EBITDA Margin RHS (%)         PAT Margin RHS(%)

 Source: Divi’s Labs, Ventura Research                                          Source: Divi’ Labs, Ventura Research


                                 Rupee depreciation to further boost margins
                                 The Rupee depreciation is expected to positively impact margins by 100- 150 bps.
                                 Factoring for imports (~13.5% of net sales) and fixed currency contracts, 42% of net
                                 revenues would be a net beneficiary of the currency movement. However we have not
                                 factored this in our model and represents an upside risk to our estimates.


                                  Strong cash flow and healthy balance sheet
                                 Divi's has maintained strong cash flows for FY12 despite higher capex spend. The
                                 company has invested nearly ` 200 crore on the 2nd SEZ facility in Vizag and when
                                 fully commissioned expects to garner close to ` 400 crore of revenue annually.
                                 Currently, the company has capitalized ` 78 crore towards the two commissioned
                                 blocks of the Vizag facility and expects to capitalize `120 crore for the remaining three
                                 blocks by Q2FY13. The company further intends to spend `150 crore each in the next
                                 two years on expansion of existing facilities. Strong capex cycle and capitalization of
                                 Vizag facility is positive for the company and would boost its revenues and
                                 profitability.

                                                                           Strong cash flow despite capex
                                         Particulars (Rs.Crore)                                   FY 11        FY 12           FY 13E              FY 14E
                                         Capex                                                    -158.3       -263.2          -225.0              -250.0
                                         Working Capital Changes                                   -81.3       -208.8          -176.1              -248.3
                                         Cash Flow Net of Capex                                    241.8        90.2            324.5               410.0
                                         Debt/Equity Ratio (x)                                      0.0          0.0             0.0                 0.0
                                         Increase In Reserves                                      276.6        334.0           428.7               596.3

                                     Source: Divi’s Labs, Ventura Research


                                                                                                                                                        nd
- 10 of 14 -                                                                                                                                Friday 22        June, 2012

               This document is for private circulation, and must be read in conjunction with the disclaimer on the last page.
 Key Concerns

                               Delay in USFDA approval
                               Divi's recently commissioned DSN SEZ at Vizag is awaiting USFDA approvals and
                               any delay in receiving the same would be a risk to our forecast. The management
                               expects to receive USDFA approval by H1FY13 and we remain confident of achieving
                               the same. However, any regulatory delays would impact revenue and profitability of
                               the company adversely.

                               Higher tax incidence to impact profitability
                               Divi’s manufacturing facilities are located in areas offering tax subsidies and hence
                               had a very low tax outgo. However, with Nalgenda facility tax benefit expiring and two
                               units of the Vizag SEZ being eligible only for 50% exemption of export profits for the
                               next 5 years (instead of 100% earlier) tax impact has enhanced to 20-23% from the
                               earlier 7-11%.
                               Financial performance
                               Divi’s Laboratories Ltd has witnessed a robust 49.9% yoy growth in its top line to `
                               718.0 crore in Q4FY12 as against ` 479.1 crore in Q4FY11 led by strong growth
                               across segments. The EBITDA margins were maintained at 40.0% due to increasing
                               contribution of the low margins generic API business. However, the PAT margins were
                               lower by 640 bps on account of its higher tax expense.

                                                                   Quarterly Financial Performance
                                                 Particulars                    Q4FY12       Q4FY11        FY12        FY11
                                                 Net Sales                       718.0        479.1      1858.6       1310.3
                                                 Growth %                         49.9                     41.8
                                                 Total Expenditure               431.2        286.9      1173.6        816.4
                                                 EBIDTA                          286.9        192.2      685.0         494.0
                                                 EBDITA Margin %                  40.0         40.1       36.9          37.7
                                                 Depreciation                     16.6         13.5       62.1          53.4
                                                 EBIT (EX OI)                    270.2        178.7      622.9         440.6
                                                 Other Income                      4.5         10.7       61.5          33.3
                                                 EBIT                            274.7        189.4      684.4         473.9
                                                 Margin %                         38.3         39.5       36.8          36.2
                                                 Interest                         2.73         0.99       3.74          1.52
                                                 Exceptional items                 0.0          0.0        0.0           0.0
                                                 PBT                             271.9        188.4      680.6         472.4
                                                 Margin %                         37.9         39.3       36.6          36.0
                                                 Provision for Tax                55.0         13.2      147.4          43.1
                                                 PAT                             216.9        175.2      533.3         429.3
                                                 PAT Margin (%)                   30.2         36.6       28.7          32.8
                                                 Source: Divi’s Labs, Ventura Research


                                                                                                                                 nd
- 11 of 14 -                                                                                                         Friday 22        June, 2012

               This document is for private circulation, and must be read in conjunction with the disclaimer on the last page.
Financial outlook
                               Aided by its unique product portfolio and continuous proven capability in the CRAMS
                               segment, we expect Divi’s revenues to grow at a CAGR of 25.2 % to ` 2915.2 crore
                               over the forecast period FY12-14. In addition, we haven’t factored additional revenues
                               coming in from the ready to market products, which should also help boost revenues
                               and profitability going ahead. We expect the PAT to grow at a CAGR of 23.5% to `
                               813.7 crore in FY14E as compared to `533.3 crore in FY12.

                                                                 Revenue and Profitability trend
                                              3500    Rs.Crore                                                       40

                                              3000                                                                   35
                                                                                                                     30
                                              2500
                                                                                                                     25
                                              2000


                                                                                                                          (%)
                                                                                                                     20
                                              1500
                                                                                                                     15
                                              1000
                                                                                                                     10
                                               500                                                                   5
                                                  0                                                                  0
                                                          FY11            FY12          FY13E           FY14E

                                                       Revenue           EBITDA Margin (%)            PAT Margin (%)


                                        Source: Divi’s Labs, Ventura Research

                               Valuation
                               At the CMP of ` 952, Divi's is trading at 19.6x and 15.5x its estimated earnings for
                               FY13 and FY14, respectively. Divi’s is trading at a considerable premium to its
                               counterparts in the domestic market i.e. Biocon, Jubilant as well as to the international
                               players. However, considering the high margin business, steady organic growth,
                               strong cash flows and high return ratios, we believe the premium is completely
                               justified. We initiate coverage on Divi's Laboratories Ltd as a BUY with a Price
                               Objective of `1287 (target 21.0x FY14 P/E) representing an potential upside of 35%
                               over the next 18 months.

                                                                    Peer Comparison

                                                                                    Sales
                         Particulars (FY 14)                          Sales                     EBITDA (%)      PAT (%)         ROE(%)
                                                                                  Growth (%)
On all                   DiviS Laboratories Ltd.                     2915.2          25.2           37.6           27.9          25.8
parameters,              Dishman Pharma & Chemicals Ltd.             1420.3          15.0           20.1           7.0           9.5
Divi’s emerges           Biocon Ltd.                                 2698.2          15.9           26.1           15.6          15.8
strong compared          Jubilant Life Sciences Ltd.                 5745.9          18.4           20.1           8.9           17.5
to its peers             Piramal Healthcare Ltd.                     2674.2          17.4           9.7            9.0           1.6
                       *Consenus   estimates for players other than Divi’s Labs

                       Source: Divi’s Labs, Ventura Research

                                                                                                                                 nd
- 12 of 14 -                                                                                                         Friday 22        June, 2012

               This document is for private circulation, and must be read in conjunction with the disclaimer on the last page.
P/E
                                               1600
                                               1400
                                               1200
                                               1000
                                                800
                                                600
                                                400
                                                200
                                                  0
                                                  Apr-06          Apr-08              Apr-10          Apr-12
                                                      CMP       14X        17.5X        21X     24.5X          28X

                                          Source: Divi’s Labs, Ventura Research

                                                                         P/B
                                               2000
                                               1800
                                               1600
                                               1400
                                               1200
                                               1000
                                                800
                                                600
                                                400
                                                200
                                                  0
                                                  Apr-06             Apr-08            Apr-10           Apr-12
                                                      CMP       4.5X          5.75X      7X     8.25X          9.5X

                                          Source: Divi’s Labs, Ventura Research

                                                                       EV/EBITDA
                                             18000
                                             16000
                                             14000
                                             12000
                                             10000
                                              8000
                                              6000
                                              4000
                                              2000
                                                 0
                                                 Apr-06           Apr-08              Apr-10       Apr-12
                                                      EV       11X         13X         15X      17X        19X

                                          Source: Divi’s Labs India, Ventura Research


                                                                                                                                  nd
- 13 of 14 -                                                                                                          Friday 22        June, 2012

               This document is for private circulation, and must be read in conjunction with the disclaimer on the last page.
Financials and Projections
        Y/E March, Fig in Rs. Cr       FY 2011    FY 2012 FY 2013e FY 2014e        Y/E March, Fig in Rs. Cr           FY 2011    FY 2012 FY 2013e FY 2014e
        Profit & Loss Statement                                                    Per Share Data (Rs)
        Net Sales                        1307.1    1858.6     2332.0    2915.2     EPS                                   32.3       40.2     48.7          61.3
        % Chg.                                       42.2       25.5       25.0    Cash EPS                              36.4       44.8     54.7          68.4
        Total Expenditure                 815.6    1173.6     1455.5    1819.4     DPS                                   10.0       10.0     10.0          10.0
        % Chg.                                       43.9       24.0       25.0    Book Value                           135.4      160.6    192.9         237.8
        EBITDA                            491.5     685.0      876.5    1095.8    Capital, Liquidity, Returns Ratio
        EBITDA Margin %                    37.6      36.9       37.6       37.6    Debt / Equity (x)                       0.0        0.0      0.0           0.0
        Other Income                       36.5      61.5       46.8       60.3    Current Ratio (x)                       2.5        2.7      2.6           2.6
        Exceptional items                   0.0        0.0       0.0        0.0    ROE (%)                               23.9       25.0     25.2          25.8
        PBDIT                             528.0     746.5      923.4    1156.1     ROCE (%)                              28.2       33.2     34.5          35.4
        Depreciation                       53.4      62.1       79.4       94.5    Dividend Yield (%)                      1.1        1.1      1.1           1.1
        Interest                            2.2        3.7       4.7        4.7    Valuation Ratio (x)
        PBT                               472.4     680.6      839.2    1056.8     P/E                                   29.4       23.7     19.6          15.5
        Tax Provisions                     43.1     147.4      193.0     243.1     P/BV                                    7.0        5.9      4.9           4.0
        Reported PAT                      429.3     533.3      646.2     813.7     EV/Sales                                9.7        6.8      5.4           4.3
        PAT Margin (%)                     32.8      28.7       27.7       27.9    EV/EBIDTA                             25.8       18.5     14.4          11.6
                                                                                   Efficiency Ratio (x)
        Manpower cost / Sales (%)          39.2      41.0       40.0       40.0    Inventory (days)                     159.6      133.3    130.0         130.0
        Other Exp / Sales (%)               7.1      14.1       14.0       14.0    Debtors (days)                       102.6       97.3     95.0          95.0
        Tax Rate (%)                        9.1      21.7       23.0       23.0    Creditors (days)                      67.7       59.2     60.0          60.0


        Balance Sheet                                                              Cash Flow statement
        Share Capital                      26.5      26.6       26.6       26.6    Profit After Tax                     429.3      533.3    646.2         813.7
        Reserves & Surplus               1771.0    2105.0     2533.7    3130.0     Depreciation                          53.4       62.1     79.4          94.5
        Minority Interest & Others          0.0        0.0       0.0        0.0    Working Capital Changes               -78.6     -198.0   -176.1        -248.3
        Total Loans                        23.0      52.8       52.8       52.8    Others                                 -3.9      -43.9      0.0           0.0
        Deferred Tax Iiability             50.0      60.9       60.9       60.9    Operating Cash Flow                  400.1      353.4    549.5         660.0
        Total Liabilities                1870.6    2245.2     2673.9    3270.2     Capital Expenditure                   -52.8     -232.5   -300.0        -270.0
        Goodwill                            0.0        0.0       0.0        0.0    Change in Investment                 -189.9      17.9     -20.4        -151.7
        Gross Block                       885.7    1118.2     1418.2    1688.2     Cash Flow from Investing             -242.7     -214.6   -320.4        -421.7
        Less: Acc. Depreciation           295.8     357.8      437.3     531.8     Proceeds from equity issue              7.7        0.0      0.0           0.0
        Net Block                         589.9     760.4      981.0    1156.4     Inc/ Dec in Debt                       -9.8      29.7       0.0           0.0
        Capital Work in Progress          129.3     160.0       85.0       65.0    Dividend and DDT                     -154.1     -155.3   -217.4        -217.4
        Investments                       525.6     477.0      572.4     744.2     Cash Flow from Financing             -156.2     -125.6   -217.4        -217.4
        Net Current Assets                625.7     847.7     1035.5    1304.6     Net Change in Cash                      1.2      13.3     11.7          20.8
        Deferred Tax Assets                 0.0        0.0       0.0        0.0    Opening Cash Balance                  16.5       17.7     30.9          42.6
        Total Assets                     1870.6    2245.2     2673.9    3270.2     Closing Cash Balance                  17.7       30.9     42.6          63.4


   Ventura Securities Limited

   Corporate Office: C-112/116, Bldg No. 1, Kailash Industrial Complex, Park Site, Vikhroli (W), Mumbai – 400079

   This report is neither an offer nor a solicitation to purchase or sell securities. The information and views expressed herein are believed to be reliable, but
   no responsibility (or liability) is accepted for errors of fact or opinion. Writers and contributors may be trading in or have positions in the securities
   mentioned in their articles. Neither Ventura Securities Limited nor any of the contributors accepts any liability arising out of the above
   information/articles. Reproduction in whole or in part without written permission is prohibited. This report is for private circulation.


                                                                                                                                                   nd
- 14 of 14 -                                                                                                                           Friday 22        June, 2012

                   This document is for private circulation, and must be read in conjunction with the disclaimer on the last page.

More Related Content

What's hot

Mosquito Repellent Marketing Strategy
Mosquito Repellent Marketing StrategyMosquito Repellent Marketing Strategy
Mosquito Repellent Marketing StrategyChandresh Dedhia
 
distribution channel of dabur
distribution channel of daburdistribution channel of dabur
distribution channel of daburMj Payal
 
CASE_STUDY ON SIEMENS COMPANY
CASE_STUDY ON SIEMENS COMPANYCASE_STUDY ON SIEMENS COMPANY
CASE_STUDY ON SIEMENS COMPANYDevansh Sharma
 
STRATEGIC MARKETING "SBU" AND "BCG MATRIX" OF HAVELLS
STRATEGIC MARKETING "SBU" AND "BCG MATRIX" OF HAVELLS STRATEGIC MARKETING "SBU" AND "BCG MATRIX" OF HAVELLS
STRATEGIC MARKETING "SBU" AND "BCG MATRIX" OF HAVELLS NavendraDubey
 
Mekanism- Engineering Viral Marketing
Mekanism- Engineering Viral MarketingMekanism- Engineering Viral Marketing
Mekanism- Engineering Viral MarketingPrasith Ashok
 
Porter's five forces model for Indian Telecom industry
Porter's five forces model for Indian Telecom industryPorter's five forces model for Indian Telecom industry
Porter's five forces model for Indian Telecom industryHarnoor Singh
 
Rapido enters fast lane with
Rapido enters fast lane withRapido enters fast lane with
Rapido enters fast lane withmanishapant10
 
Team: Faded Flame, IIM Kozhikode, HUL L.I.M.E Season 4
Team: Faded Flame, IIM Kozhikode, HUL L.I.M.E Season 4Team: Faded Flame, IIM Kozhikode, HUL L.I.M.E Season 4
Team: Faded Flame, IIM Kozhikode, HUL L.I.M.E Season 4Anshul Kumar
 
Dabur presentation
Dabur presentationDabur presentation
Dabur presentationPankaj Baid
 
HUL Distribution Model
HUL Distribution ModelHUL Distribution Model
HUL Distribution ModelAnurag Gupta
 
Nirdosh case analysis Marketing
Nirdosh case analysis MarketingNirdosh case analysis Marketing
Nirdosh case analysis MarketingAlok C
 
It industry & tcs strategic analysis
It industry & tcs strategic analysisIt industry & tcs strategic analysis
It industry & tcs strategic analysisAbhigyan Singh
 
Tata Consultancy Services: Selling Certainty
Tata Consultancy Services: Selling Certainty Tata Consultancy Services: Selling Certainty
Tata Consultancy Services: Selling Certainty KukHwa Kim
 
Distribution & Channel Management, Promotion Decisions OF ITC Limited
Distribution & Channel Management, Promotion Decisions OF ITC LimitedDistribution & Channel Management, Promotion Decisions OF ITC Limited
Distribution & Channel Management, Promotion Decisions OF ITC LimitedReyaz Jafar
 
Pidilite Channelmgmt
Pidilite ChannelmgmtPidilite Channelmgmt
Pidilite Channelmgmtankushmit
 
Asian Paints - Strategies, Entry Mode, Structure
Asian Paints - Strategies, Entry Mode, StructureAsian Paints - Strategies, Entry Mode, Structure
Asian Paints - Strategies, Entry Mode, StructureTony Sebastian
 

What's hot (20)

Rural Marketing Dabur
Rural Marketing DaburRural Marketing Dabur
Rural Marketing Dabur
 
Mosquito Repellent Marketing Strategy
Mosquito Repellent Marketing StrategyMosquito Repellent Marketing Strategy
Mosquito Repellent Marketing Strategy
 
Chick shampoo case study
Chick shampoo   case studyChick shampoo   case study
Chick shampoo case study
 
distribution channel of dabur
distribution channel of daburdistribution channel of dabur
distribution channel of dabur
 
CASE_STUDY ON SIEMENS COMPANY
CASE_STUDY ON SIEMENS COMPANYCASE_STUDY ON SIEMENS COMPANY
CASE_STUDY ON SIEMENS COMPANY
 
STRATEGIC MARKETING "SBU" AND "BCG MATRIX" OF HAVELLS
STRATEGIC MARKETING "SBU" AND "BCG MATRIX" OF HAVELLS STRATEGIC MARKETING "SBU" AND "BCG MATRIX" OF HAVELLS
STRATEGIC MARKETING "SBU" AND "BCG MATRIX" OF HAVELLS
 
Mekanism- Engineering Viral Marketing
Mekanism- Engineering Viral MarketingMekanism- Engineering Viral Marketing
Mekanism- Engineering Viral Marketing
 
Tata strategy
Tata strategyTata strategy
Tata strategy
 
Porter's five forces model for Indian Telecom industry
Porter's five forces model for Indian Telecom industryPorter's five forces model for Indian Telecom industry
Porter's five forces model for Indian Telecom industry
 
Rapido enters fast lane with
Rapido enters fast lane withRapido enters fast lane with
Rapido enters fast lane with
 
Team: Faded Flame, IIM Kozhikode, HUL L.I.M.E Season 4
Team: Faded Flame, IIM Kozhikode, HUL L.I.M.E Season 4Team: Faded Flame, IIM Kozhikode, HUL L.I.M.E Season 4
Team: Faded Flame, IIM Kozhikode, HUL L.I.M.E Season 4
 
Dabur presentation
Dabur presentationDabur presentation
Dabur presentation
 
HUL Distribution Model
HUL Distribution ModelHUL Distribution Model
HUL Distribution Model
 
Nirdosh case analysis Marketing
Nirdosh case analysis MarketingNirdosh case analysis Marketing
Nirdosh case analysis Marketing
 
It industry & tcs strategic analysis
It industry & tcs strategic analysisIt industry & tcs strategic analysis
It industry & tcs strategic analysis
 
Mortein
MorteinMortein
Mortein
 
Tata Consultancy Services: Selling Certainty
Tata Consultancy Services: Selling Certainty Tata Consultancy Services: Selling Certainty
Tata Consultancy Services: Selling Certainty
 
Distribution & Channel Management, Promotion Decisions OF ITC Limited
Distribution & Channel Management, Promotion Decisions OF ITC LimitedDistribution & Channel Management, Promotion Decisions OF ITC Limited
Distribution & Channel Management, Promotion Decisions OF ITC Limited
 
Pidilite Channelmgmt
Pidilite ChannelmgmtPidilite Channelmgmt
Pidilite Channelmgmt
 
Asian Paints - Strategies, Entry Mode, Structure
Asian Paints - Strategies, Entry Mode, StructureAsian Paints - Strategies, Entry Mode, Structure
Asian Paints - Strategies, Entry Mode, Structure
 

Similar to Divis' lab ltd

ICICI Direct aurobindo_pharma_initiating coverage March 2011
ICICI Direct aurobindo_pharma_initiating coverage March 2011ICICI Direct aurobindo_pharma_initiating coverage March 2011
ICICI Direct aurobindo_pharma_initiating coverage March 2011MasterSun Goldbird
 
Dai Ichi Karkaria: Buy at CMP and add on declines
Dai Ichi Karkaria: Buy at CMP and add on declinesDai Ichi Karkaria: Buy at CMP and add on declines
Dai Ichi Karkaria: Buy at CMP and add on declinesIndiaNotes.com
 
61107576 rallis-india
61107576 rallis-india61107576 rallis-india
61107576 rallis-indiajeetay
 
ecolab FinancialDiscussion
ecolab  FinancialDiscussionecolab  FinancialDiscussion
ecolab FinancialDiscussionfinance37
 
Annual Report 2008
Annual Report 2008Annual Report 2008
Annual Report 2008guest2f467f
 
Investment Idea - POLYPLEX CORPORATION LTD - "BUY"
Investment Idea - POLYPLEX CORPORATION LTD - "BUY"Investment Idea - POLYPLEX CORPORATION LTD - "BUY"
Investment Idea - POLYPLEX CORPORATION LTD - "BUY"Fullerton Securities
 
Report: Industry Analysis
Report: Industry AnalysisReport: Industry Analysis
Report: Industry AnalysisMarco Bennett
 
Investor Presentation, March 2013
Investor Presentation, March 2013Investor Presentation, March 2013
Investor Presentation, March 2013VulcanMaterials
 
Orchid chemicals event update-10-06-10
Orchid chemicals event update-10-06-10Orchid chemicals event update-10-06-10
Orchid chemicals event update-10-06-10Angel Broking
 
Orchid chemicals event update-10-06-10
Orchid chemicals event update-10-06-10Orchid chemicals event update-10-06-10
Orchid chemicals event update-10-06-10Angel Broking
 
csx Citigroup11.06.07
csx  Citigroup11.06.07csx  Citigroup11.06.07
csx Citigroup11.06.07finance27
 

Similar to Divis' lab ltd (20)

Vivimed labs ltd
Vivimed labs ltdVivimed labs ltd
Vivimed labs ltd
 
Bajaj corp initiating coverage report
Bajaj corp initiating coverage reportBajaj corp initiating coverage report
Bajaj corp initiating coverage report
 
ICICI Direct aurobindo_pharma_initiating coverage March 2011
ICICI Direct aurobindo_pharma_initiating coverage March 2011ICICI Direct aurobindo_pharma_initiating coverage March 2011
ICICI Direct aurobindo_pharma_initiating coverage March 2011
 
Gcpl
GcplGcpl
Gcpl
 
Wockhardt ltd
Wockhardt ltdWockhardt ltd
Wockhardt ltd
 
Dai Ichi Karkaria: Buy at CMP and add on declines
Dai Ichi Karkaria: Buy at CMP and add on declinesDai Ichi Karkaria: Buy at CMP and add on declines
Dai Ichi Karkaria: Buy at CMP and add on declines
 
61107576 rallis-india
61107576 rallis-india61107576 rallis-india
61107576 rallis-india
 
Wockhardt ltd result update
Wockhardt ltd result updateWockhardt ltd result update
Wockhardt ltd result update
 
Initiating coverage Mahindra & Mahindra ltd
Initiating coverage  Mahindra & Mahindra ltdInitiating coverage  Mahindra & Mahindra ltd
Initiating coverage Mahindra & Mahindra ltd
 
Solazyme Q3 2012 earnings
Solazyme Q3 2012 earningsSolazyme Q3 2012 earnings
Solazyme Q3 2012 earnings
 
ecolab FinancialDiscussion
ecolab  FinancialDiscussionecolab  FinancialDiscussion
ecolab FinancialDiscussion
 
Annual Report 2008
Annual Report 2008Annual Report 2008
Annual Report 2008
 
Investment Idea - POLYPLEX CORPORATION LTD - "BUY"
Investment Idea - POLYPLEX CORPORATION LTD - "BUY"Investment Idea - POLYPLEX CORPORATION LTD - "BUY"
Investment Idea - POLYPLEX CORPORATION LTD - "BUY"
 
Report: Industry Analysis
Report: Industry AnalysisReport: Industry Analysis
Report: Industry Analysis
 
AR2004
AR2004AR2004
AR2004
 
Dfm foods limited
Dfm foods limitedDfm foods limited
Dfm foods limited
 
Investor Presentation, March 2013
Investor Presentation, March 2013Investor Presentation, March 2013
Investor Presentation, March 2013
 
Orchid chemicals event update-10-06-10
Orchid chemicals event update-10-06-10Orchid chemicals event update-10-06-10
Orchid chemicals event update-10-06-10
 
Orchid chemicals event update-10-06-10
Orchid chemicals event update-10-06-10Orchid chemicals event update-10-06-10
Orchid chemicals event update-10-06-10
 
csx Citigroup11.06.07
csx  Citigroup11.06.07csx  Citigroup11.06.07
csx Citigroup11.06.07
 

More from Vinit Bolinjkar LION bolinjkar.vinit@gmail.com

More from Vinit Bolinjkar LION bolinjkar.vinit@gmail.com (20)

Burger King Equity Research & Valuation Webinar Slide Deck| School of Market ...
Burger King Equity Research & Valuation Webinar Slide Deck| School of Market ...Burger King Equity Research & Valuation Webinar Slide Deck| School of Market ...
Burger King Equity Research & Valuation Webinar Slide Deck| School of Market ...
 
Varun Beverages Equity Research & Valuation | School of Market Studies Webina...
Varun Beverages Equity Research & Valuation | School of Market Studies Webina...Varun Beverages Equity Research & Valuation | School of Market Studies Webina...
Varun Beverages Equity Research & Valuation | School of Market Studies Webina...
 
Voltas Equity Research & Valuation | School of Market Studies Webinar Learnin...
Voltas Equity Research & Valuation | School of Market Studies Webinar Learnin...Voltas Equity Research & Valuation | School of Market Studies Webinar Learnin...
Voltas Equity Research & Valuation | School of Market Studies Webinar Learnin...
 
HUL Equity Research & Valuation | School of Market Studies Webinar Learning S...
HUL Equity Research & Valuation | School of Market Studies Webinar Learning S...HUL Equity Research & Valuation | School of Market Studies Webinar Learning S...
HUL Equity Research & Valuation | School of Market Studies Webinar Learning S...
 
Get LinkedIn₹ - Ask Me Anything
Get LinkedIn₹ - Ask Me AnythingGet LinkedIn₹ - Ask Me Anything
Get LinkedIn₹ - Ask Me Anything
 
#Coronavirus Important Facts We Should Know
#Coronavirus Important Facts We Should Know#Coronavirus Important Facts We Should Know
#Coronavirus Important Facts We Should Know
 
Metal Pipe Stocks - Technical Analysis (Weekly Charts)
Metal Pipe Stocks - Technical Analysis (Weekly Charts)Metal Pipe Stocks - Technical Analysis (Weekly Charts)
Metal Pipe Stocks - Technical Analysis (Weekly Charts)
 
Webinar: 10 Businesses With Superlative Moats
Webinar: 10 Businesses With Superlative MoatsWebinar: 10 Businesses With Superlative Moats
Webinar: 10 Businesses With Superlative Moats
 
Multibagger stock picking_using_8_criteria_elimination
Multibagger stock picking_using_8_criteria_eliminationMultibagger stock picking_using_8_criteria_elimination
Multibagger stock picking_using_8_criteria_elimination
 
Dematerialization: A Silent Revolution in the Indian Capital Markets
Dematerialization: A Silent Revolution in the Indian Capital MarketsDematerialization: A Silent Revolution in the Indian Capital Markets
Dematerialization: A Silent Revolution in the Indian Capital Markets
 
Ocl India - Explosive Growth Ahead
Ocl India - Explosive Growth AheadOcl India - Explosive Growth Ahead
Ocl India - Explosive Growth Ahead
 
South Indian Bank
South Indian BankSouth Indian Bank
South Indian Bank
 
India Union Budget 2014-15 | A Holistic Plan of Action
India Union Budget 2014-15 | A Holistic Plan of ActionIndia Union Budget 2014-15 | A Holistic Plan of Action
India Union Budget 2014-15 | A Holistic Plan of Action
 
Technical analysis-select-commodities-april-2013
Technical analysis-select-commodities-april-2013Technical analysis-select-commodities-april-2013
Technical analysis-select-commodities-april-2013
 
India budget-2013-14
India budget-2013-14India budget-2013-14
India budget-2013-14
 
Indian_Pharma_Sector_Technical_Outlook_Dec_2012
Indian_Pharma_Sector_Technical_Outlook_Dec_2012Indian_Pharma_Sector_Technical_Outlook_Dec_2012
Indian_Pharma_Sector_Technical_Outlook_Dec_2012
 
Initiating coverage gmdc_ltd_buy_for_36_per_appreciation
Initiating coverage gmdc_ltd_buy_for_36_per_appreciationInitiating coverage gmdc_ltd_buy_for_36_per_appreciation
Initiating coverage gmdc_ltd_buy_for_36_per_appreciation
 
Petronet lng
Petronet lngPetronet lng
Petronet lng
 
Tata motors update
Tata motors updateTata motors update
Tata motors update
 
Initiating coverage tata motors ltd
Initiating coverage tata motors ltdInitiating coverage tata motors ltd
Initiating coverage tata motors ltd
 

Recently uploaded

Case study on tata clothing brand zudio in detail
Case study on tata clothing brand zudio in detailCase study on tata clothing brand zudio in detail
Case study on tata clothing brand zudio in detailAriel592675
 
Call Us 📲8800102216📞 Call Girls In DLF City Gurgaon
Call Us 📲8800102216📞 Call Girls In DLF City GurgaonCall Us 📲8800102216📞 Call Girls In DLF City Gurgaon
Call Us 📲8800102216📞 Call Girls In DLF City Gurgaoncallgirls2057
 
Innovation Conference 5th March 2024.pdf
Innovation Conference 5th March 2024.pdfInnovation Conference 5th March 2024.pdf
Innovation Conference 5th March 2024.pdfrichard876048
 
Global Scenario On Sustainable and Resilient Coconut Industry by Dr. Jelfina...
Global Scenario On Sustainable  and Resilient Coconut Industry by Dr. Jelfina...Global Scenario On Sustainable  and Resilient Coconut Industry by Dr. Jelfina...
Global Scenario On Sustainable and Resilient Coconut Industry by Dr. Jelfina...ictsugar
 
International Business Environments and Operations 16th Global Edition test b...
International Business Environments and Operations 16th Global Edition test b...International Business Environments and Operations 16th Global Edition test b...
International Business Environments and Operations 16th Global Edition test b...ssuserf63bd7
 
Kenya’s Coconut Value Chain by Gatsby Africa
Kenya’s Coconut Value Chain by Gatsby AfricaKenya’s Coconut Value Chain by Gatsby Africa
Kenya’s Coconut Value Chain by Gatsby Africaictsugar
 
Organizational Structure Running A Successful Business
Organizational Structure Running A Successful BusinessOrganizational Structure Running A Successful Business
Organizational Structure Running A Successful BusinessSeta Wicaksana
 
/:Call Girls In Indirapuram Ghaziabad ➥9990211544 Independent Best Escorts In...
/:Call Girls In Indirapuram Ghaziabad ➥9990211544 Independent Best Escorts In.../:Call Girls In Indirapuram Ghaziabad ➥9990211544 Independent Best Escorts In...
/:Call Girls In Indirapuram Ghaziabad ➥9990211544 Independent Best Escorts In...lizamodels9
 
Flow Your Strategy at Flight Levels Day 2024
Flow Your Strategy at Flight Levels Day 2024Flow Your Strategy at Flight Levels Day 2024
Flow Your Strategy at Flight Levels Day 2024Kirill Klimov
 
2024 Numerator Consumer Study of Cannabis Usage
2024 Numerator Consumer Study of Cannabis Usage2024 Numerator Consumer Study of Cannabis Usage
2024 Numerator Consumer Study of Cannabis UsageNeil Kimberley
 
8447779800, Low rate Call girls in Kotla Mubarakpur Delhi NCR
8447779800, Low rate Call girls in Kotla Mubarakpur Delhi NCR8447779800, Low rate Call girls in Kotla Mubarakpur Delhi NCR
8447779800, Low rate Call girls in Kotla Mubarakpur Delhi NCRashishs7044
 
8447779800, Low rate Call girls in Uttam Nagar Delhi NCR
8447779800, Low rate Call girls in Uttam Nagar Delhi NCR8447779800, Low rate Call girls in Uttam Nagar Delhi NCR
8447779800, Low rate Call girls in Uttam Nagar Delhi NCRashishs7044
 
(Best) ENJOY Call Girls in Faridabad Ex | 8377087607
(Best) ENJOY Call Girls in Faridabad Ex | 8377087607(Best) ENJOY Call Girls in Faridabad Ex | 8377087607
(Best) ENJOY Call Girls in Faridabad Ex | 8377087607dollysharma2066
 
Marketplace and Quality Assurance Presentation - Vincent Chirchir
Marketplace and Quality Assurance Presentation - Vincent ChirchirMarketplace and Quality Assurance Presentation - Vincent Chirchir
Marketplace and Quality Assurance Presentation - Vincent Chirchirictsugar
 
Youth Involvement in an Innovative Coconut Value Chain by Mwalimu Menza
Youth Involvement in an Innovative Coconut Value Chain by Mwalimu MenzaYouth Involvement in an Innovative Coconut Value Chain by Mwalimu Menza
Youth Involvement in an Innovative Coconut Value Chain by Mwalimu Menzaictsugar
 
NewBase 19 April 2024 Energy News issue - 1717 by Khaled Al Awadi.pdf
NewBase  19 April  2024  Energy News issue - 1717 by Khaled Al Awadi.pdfNewBase  19 April  2024  Energy News issue - 1717 by Khaled Al Awadi.pdf
NewBase 19 April 2024 Energy News issue - 1717 by Khaled Al Awadi.pdfKhaled Al Awadi
 
MAHA Global and IPR: Do Actions Speak Louder Than Words?
MAHA Global and IPR: Do Actions Speak Louder Than Words?MAHA Global and IPR: Do Actions Speak Louder Than Words?
MAHA Global and IPR: Do Actions Speak Louder Than Words?Olivia Kresic
 
Ten Organizational Design Models to align structure and operations to busines...
Ten Organizational Design Models to align structure and operations to busines...Ten Organizational Design Models to align structure and operations to busines...
Ten Organizational Design Models to align structure and operations to busines...Seta Wicaksana
 
Call Girls In Radisson Blu Hotel New Delhi Paschim Vihar ❤️8860477959 Escorts...
Call Girls In Radisson Blu Hotel New Delhi Paschim Vihar ❤️8860477959 Escorts...Call Girls In Radisson Blu Hotel New Delhi Paschim Vihar ❤️8860477959 Escorts...
Call Girls In Radisson Blu Hotel New Delhi Paschim Vihar ❤️8860477959 Escorts...lizamodels9
 
8447779800, Low rate Call girls in Saket Delhi NCR
8447779800, Low rate Call girls in Saket Delhi NCR8447779800, Low rate Call girls in Saket Delhi NCR
8447779800, Low rate Call girls in Saket Delhi NCRashishs7044
 

Recently uploaded (20)

Case study on tata clothing brand zudio in detail
Case study on tata clothing brand zudio in detailCase study on tata clothing brand zudio in detail
Case study on tata clothing brand zudio in detail
 
Call Us 📲8800102216📞 Call Girls In DLF City Gurgaon
Call Us 📲8800102216📞 Call Girls In DLF City GurgaonCall Us 📲8800102216📞 Call Girls In DLF City Gurgaon
Call Us 📲8800102216📞 Call Girls In DLF City Gurgaon
 
Innovation Conference 5th March 2024.pdf
Innovation Conference 5th March 2024.pdfInnovation Conference 5th March 2024.pdf
Innovation Conference 5th March 2024.pdf
 
Global Scenario On Sustainable and Resilient Coconut Industry by Dr. Jelfina...
Global Scenario On Sustainable  and Resilient Coconut Industry by Dr. Jelfina...Global Scenario On Sustainable  and Resilient Coconut Industry by Dr. Jelfina...
Global Scenario On Sustainable and Resilient Coconut Industry by Dr. Jelfina...
 
International Business Environments and Operations 16th Global Edition test b...
International Business Environments and Operations 16th Global Edition test b...International Business Environments and Operations 16th Global Edition test b...
International Business Environments and Operations 16th Global Edition test b...
 
Kenya’s Coconut Value Chain by Gatsby Africa
Kenya’s Coconut Value Chain by Gatsby AfricaKenya’s Coconut Value Chain by Gatsby Africa
Kenya’s Coconut Value Chain by Gatsby Africa
 
Organizational Structure Running A Successful Business
Organizational Structure Running A Successful BusinessOrganizational Structure Running A Successful Business
Organizational Structure Running A Successful Business
 
/:Call Girls In Indirapuram Ghaziabad ➥9990211544 Independent Best Escorts In...
/:Call Girls In Indirapuram Ghaziabad ➥9990211544 Independent Best Escorts In.../:Call Girls In Indirapuram Ghaziabad ➥9990211544 Independent Best Escorts In...
/:Call Girls In Indirapuram Ghaziabad ➥9990211544 Independent Best Escorts In...
 
Flow Your Strategy at Flight Levels Day 2024
Flow Your Strategy at Flight Levels Day 2024Flow Your Strategy at Flight Levels Day 2024
Flow Your Strategy at Flight Levels Day 2024
 
2024 Numerator Consumer Study of Cannabis Usage
2024 Numerator Consumer Study of Cannabis Usage2024 Numerator Consumer Study of Cannabis Usage
2024 Numerator Consumer Study of Cannabis Usage
 
8447779800, Low rate Call girls in Kotla Mubarakpur Delhi NCR
8447779800, Low rate Call girls in Kotla Mubarakpur Delhi NCR8447779800, Low rate Call girls in Kotla Mubarakpur Delhi NCR
8447779800, Low rate Call girls in Kotla Mubarakpur Delhi NCR
 
8447779800, Low rate Call girls in Uttam Nagar Delhi NCR
8447779800, Low rate Call girls in Uttam Nagar Delhi NCR8447779800, Low rate Call girls in Uttam Nagar Delhi NCR
8447779800, Low rate Call girls in Uttam Nagar Delhi NCR
 
(Best) ENJOY Call Girls in Faridabad Ex | 8377087607
(Best) ENJOY Call Girls in Faridabad Ex | 8377087607(Best) ENJOY Call Girls in Faridabad Ex | 8377087607
(Best) ENJOY Call Girls in Faridabad Ex | 8377087607
 
Marketplace and Quality Assurance Presentation - Vincent Chirchir
Marketplace and Quality Assurance Presentation - Vincent ChirchirMarketplace and Quality Assurance Presentation - Vincent Chirchir
Marketplace and Quality Assurance Presentation - Vincent Chirchir
 
Youth Involvement in an Innovative Coconut Value Chain by Mwalimu Menza
Youth Involvement in an Innovative Coconut Value Chain by Mwalimu MenzaYouth Involvement in an Innovative Coconut Value Chain by Mwalimu Menza
Youth Involvement in an Innovative Coconut Value Chain by Mwalimu Menza
 
NewBase 19 April 2024 Energy News issue - 1717 by Khaled Al Awadi.pdf
NewBase  19 April  2024  Energy News issue - 1717 by Khaled Al Awadi.pdfNewBase  19 April  2024  Energy News issue - 1717 by Khaled Al Awadi.pdf
NewBase 19 April 2024 Energy News issue - 1717 by Khaled Al Awadi.pdf
 
MAHA Global and IPR: Do Actions Speak Louder Than Words?
MAHA Global and IPR: Do Actions Speak Louder Than Words?MAHA Global and IPR: Do Actions Speak Louder Than Words?
MAHA Global and IPR: Do Actions Speak Louder Than Words?
 
Ten Organizational Design Models to align structure and operations to busines...
Ten Organizational Design Models to align structure and operations to busines...Ten Organizational Design Models to align structure and operations to busines...
Ten Organizational Design Models to align structure and operations to busines...
 
Call Girls In Radisson Blu Hotel New Delhi Paschim Vihar ❤️8860477959 Escorts...
Call Girls In Radisson Blu Hotel New Delhi Paschim Vihar ❤️8860477959 Escorts...Call Girls In Radisson Blu Hotel New Delhi Paschim Vihar ❤️8860477959 Escorts...
Call Girls In Radisson Blu Hotel New Delhi Paschim Vihar ❤️8860477959 Escorts...
 
8447779800, Low rate Call girls in Saket Delhi NCR
8447779800, Low rate Call girls in Saket Delhi NCR8447779800, Low rate Call girls in Saket Delhi NCR
8447779800, Low rate Call girls in Saket Delhi NCR
 

Divis' lab ltd

  • 1. Divi’s Laboratories Ltd. BUY Target Price ` 1287 CMP ` 952 FY14 PE 15.5x Index Details We initiate coverage on Divi's Laboratories Ltd as a BUY with a Sensex 16,973 Price Objective of `1,287 (target 21.0x FY14 P/E). At CMP of ` 952, Nifty 5,146 the stock is trading at 19.6x and 15.5x its estimated earnings for BSE 100 5,141 FY13 & FY14 respectively, representing a potential upside of ~35% Industry Pharma over a period of 18 months. Being a leading player in the CRAMs space, Divi’s will be a key beneficiary of the increased generic Scrip Details opportunities emanating from the patent expiry cliff on the back of its expertise in complex chemistry, efficient and cost conscious Mkt Cap (` cr) 12,636 processes and relationships with the top 25 global innovators. We BVPS (`) 160.6 expect Divi's revenues and earnings to post a CAGR of 25.2% and O/s Shares (Cr) 13.3 23.5% to `2915 crore and `814 crore, respectively by FY14. Av Vol (Lacs) 0.1 Further, timely approvals for ready to market products can be a 52 Week H/L 968/690 game changer for the company and further accelerate the pace of Div Yield (%) 1.4 STOCK POINTER growth. FVPS (`) 2.0  Continuous growth of the matured API product portfolio and Shareholding Pattern impending sales of the new ready to market API’s to fuel growth Shareholders % Promoters  52.2 In the generic API segment, Divi’s enjoys a significant market share in its key products and derives 47% of its revenue from the top 5 products, which are in the DIIs 17.3 matured stage. The company also has a strong pipeline of ready to market products, FIIs 9.6 in addition to its developmental pipeline, which provides Divi’s with strong revenue Public 20.9 visibility over the long term. Seeing the robust growth potential in the API space, we Total 100 expect revenues from this segment to grow at a CAGR of 19.6% to `1306.9 crore by FY14.  Divi’s Lab. vs. Sensex  CRAMS on growth path leading to profitability Backed by the strong relationship with the innovators, presence across the entire CRAMS value chain and its ability to support the innovator in late life-cycle strategies has enabled Divi’s to establish itself as a leading player in the CRAMS space. Further, the increased focus of MNCs on outsourcing led by cost arbitrage and strong R&D capabilities will only benefit Divi’s. We expect this custom synthesis business to grow at a CAGR of 25% to ` 1277 crore by FY14. Key Financials (` in Cr) Net EPS Growth RONW ROCE P/E EV/EBITDA Y/E Mar EBITDA PAT EPS Revenue (%) (%) (%) (x) (x) 2011 1307.1 491.5 429.3 32.3 23.8 23.9 28.2 29.4 25.8 2012 1858.6 685.0 533.3 40.2 24.2 25.0 33.2 23.7 18.5 2013E 2332.0 876.5 646.2 48.7 21.2 25.2 34.5 19.6 14.4 2014E 2915.2 1095.8 813.7 61.3 25.9 25.8 35.4 15.5 11.6 nd - 1 of 14 - Friday 22 June, 2012 This document is for private circulation, and must be read in conjunction with the disclaimer on the last page.
  • 2.  Strong execution and effective control to ensure sustained margin Compared to peers, Divi's have been able to maintain strong margins on account of its ability to swiftly execute capex and ensure quick capacity ramp up. Divi’s policy of adding capacities, only post clear visibility of orders ensures that there is no spare capacity and strong cash flows from the very 1st week of operations leads to ROCE being much higher than peers.  Valuation At the CMP of ` 952, Divi's is trading at 19.6x and 15.5x its estimated earnings for FY13 and FY14, respectively. Divi’s is trading at a considerable premium to its counterparts in the domestic market i.e. Biocon, Jubilant as well as to the international players. However, considering the high margin business, steady organic growth, strong cash flows and high return ratios, we believe the premium is completely justified. We initiate coverage on Divi's Laboratories Ltd as a BUY with a Price Objective of `1287 (target 21.0x FY14 P/E) representing a potential upside of 35% over the next 18 months. nd - 2 of 14 - Friday 22 June, 2012 This document is for private circulation, and must be read in conjunction with the disclaimer on the last page.
  • 3.  Company Background Divi's Laboratories Ltd (Divi's) has a significant presence in both Generic APIs and CRAMS business, with each of these segments contributing equally to the topline. The company operates predominately in the export market, which accounts for nearly 93% of its overall revenue with ~75% of it coming from developed markets like the US and EU. Geographical break-up ROW Asia 5% 4% North America Europe 44% 30% Far East India 9% 8% Source: Divi’s Labs, Ventura Research Divi’s has grown to emerge as a preferred supplier of generic APIs and key ingredients for MNCs in the pharmaceutical segments, primarily on the back of its understanding of complex chemistries and development of new process, which are globally acceptable and cost efficient. In addition, the company has an unassailable track record of being a leading player in the CRAMS segment and has one of the strongest custom chemical synthesis (CCS) pipelines with presence in the entire life cycle of a pharmaceutical product. This makes it a preferred one stop solution provider for the pharma giants. Recently, Divi’s has entered into the lucrative carotenoid segment, which would help in diversifying its API product mix. nd - 3 of 14 - Friday 22 June, 2012 This document is for private circulation, and must be read in conjunction with the disclaimer on the last page.
  • 4. Divi’s Business Model Source: Divi’s Labs, Ventura Research Divi’s currently owns four manufacturing facilities including the recently commissioned DSN SEZ, Vishakhapatnam. The other three facilities being one in Nalgonda near Hyderabad and two in Vishakhapatnam. DLL also owns four research centres with functional focus across all verticals. Divi’s Manufacturing Facilities Plant Location Remarks/Approvals Choutuppal Unit AP, India USFDA, cGMP, ISO-9001, ISO-14001 Chippada Unit AP, India 100% EOU,USFDA, cGMP, ISO-9001, ISO-14001 Chippada Unit-SEZ AP, India USFDA, cGMP, ISO-9001, ISO-14001 DSN SEZ AP, India Awaiting International Approvals Source: Divi’s Labs, Ventura Research nd - 4 of 14 - Friday 22 June, 2012 This document is for private circulation, and must be read in conjunction with the disclaimer on the last page.
  • 5.  Key Investment Highlights  Continuous growth of the matured API product portfolio and impending sales of the new ready to market API’s to fuel growth  In the generic API segment, Divi’s enjoys a significant market share in its key products and derives 47% of its revenue from the top 5 products, which are in the matured stage. Apart from this, the company also has a strong pipeline of ready to market products, in addition to its developmental pipeline, which provides Divi’s with strong revenue visibility over the long term. Seeing the robust growth potential in the API space, we expect revenues from this segment to grow at a CAGR of 19.6% to `1306.9 crore by FY14. Revenue- Generic API’s 1400 Rs.Crore 60% 1200 50% 40% 1000 30% 800 20% 600 10% 0% 400 -10% 200 -20% 0 -30% FY10 FY11 FY12 FY13E FY14E Generics APIs Growth (%) RHS Source: Divi’s Labs, Ventura Research Ripened product portfolio yielding long term benefits Divi's focus on complex chemistry and expertise to develop proprietary, efficient process to manufacture APIs lends the company a strong position in the competitive market with its discernible pricing power. Presently, the company garners 47% of its revenue from its top 5 products and is a market leader with significant market share (>70%) in two key products (Naproxen and Dextromethorphan Hydrobromide). Since Divi’s product portfolio consists of matured products, which have already undergone significant price erosion due to generic competition, they are now unlikely to see any pricing pressure, ensuring long term visibility of revenues and margin stability. Further, the company‘s presence in complimentary therapies ensures limited threat from newer therapies. nd - 5 of 14 - Friday 22 June, 2012 This document is for private circulation, and must be read in conjunction with the disclaimer on the last page.
  • 6. Top Five Products Product name Therapeutics Used for Global Sales ($,mn) Naproxen Osteoarthitris Anti Inflammatory Drug 377 Dextromethorphan Cold Medications Cough Supressant 249 Nabumetone Osteoarthitris Anti Inflammatory Drug 66.8 Levodopa CNS Parkinsion's Disease 79 Phenylephrine HCI CNS Decongestant, Dilate Pupils 26 Source: Divi’s Labs, Ventura Research Anti Inflammatory drugs, Naproxen and Nabumetone used in the treatment of arthritis, spondylitis, and other inflammatory conditions contributes around 25% to Divi's generic API’s topline and are expected to grow at a annual rate of 10-15% over the forecast period. Dextromethorphan Hydrobromide (70% market share), another key product which contributes to around 15% to topline is widely used as the main ingredient in the formulation of cough syrups and tablets. Prices of Dextromethorphan Hydrobromide have been rising steadily due to global shortage enabling Divi’s to take a price hike of 8% during the previous fiscal. New products awaiting approval to catapult growth further In addition to the existing portfolio, Divi's also has a strong developmental portfolio, representing a market potential of USD 14.6 bn. Further, the company has products awaiting USFDA approvals with market potential of $ 8.7 bn. Considering, Divi's strong expertise and swift execution abilities demonstrated in the past, we expect Divi's to effectively monetize the opportunity leading to strong revenue growth over the forecast period. However, we have not factored the same in our valuations. Product Available to be marketed Product name Therapeutics Used for Global Sales ($, mn) Candesartan Cilexetil CVS Hyper Tension 1500 Entacapone CNS Parkinsions Disease 100 Losartan potassium CVS Hyper Tension 1580.4 Olmesartan Medoxomil CVS Hyper Tension 2500 Pregabalin CNS Anti Convulsant Drug 3063 Source: Divi’s Labs, Ventura Research So far, Divi’s has registered 41 (Drug Master Files) DMFs with the US Food & Drug Administration (USFDA) and 12 DMFs with the European Directorate for the Quality of Medicine & Healthcare (EDQM). nd - 6 of 14 - Friday 22 June, 2012 This document is for private circulation, and must be read in conjunction with the disclaimer on the last page.
  • 7. Product under Development PRODUCT NAME THERAPEUTICS USED FOR Global Sales ($, mn) Aliskirin Hemifumarate CVS Lower Blood cholesterol 557 Atazanavir CNS HIV 1400 Atorvastatin CVS Lower Blood cholesterol 12000 Bazedoxifene CNS Post Menopausal Osteoporosis Chlophedianol HCL CNS Cough Supressant 275 Fesoterodine Fumarate CNS Anti- Diuretic 140 Fondaparinex CVS Anti Coagulant 340 Saxagliptin Anti Diabetic Anti Diabetic 160 Seletracetam CNS Anti Convulsant Drug Valgaciclovir Anti Infectives Anti Viral 575 Source: Divi’s Labs, Ventura Research Foray into the fast growing Carotenoids market to enhance product depth Considering the huge potential of the carotenoids market, Divi’s has made a strategic entry into the carotenoids business in FY09 through the launch of six key products. This has helped Divi’s diversify into the food and processing industry, a marginal shift from the current focus on pharmaceutical industry. Global Carotenoids Market Divi’s Carotenoid Segment Revenue 1.3 $ bn 250 Rs.Crore 1.2 200 1.2 1.1 150 1.1 100 1.0 50 1.0 0.9 0 2012 2015E 2012 2013E 2014E Source: Divi’s Labs, Ventura Research Source: Divi’s Labs, Ventura Research nd - 7 of 14 - Friday 22 June, 2012 This document is for private circulation, and must be read in conjunction with the disclaimer on the last page.
  • 8. Globally, carotenoid is a $1 bn industry with the adroit players like BASP and DSM leading the market. This business is expected to grow to $1.2 bn by 2015. At present, carotenoids business contributes ` 82 crore (4.4%) to Divi's top-line and the management expects it to grow to ` 150 and ` 250 crore by FY13 and FY14, respectively. Considering the robust market potential and Divi’s strong execution skills, we are confident about management abilities to achieve the desired levels of growth. Carotenoids product portfolio Product name Therapeutics Used for Beta-Carotene Dietary Supplements Geranylgeranyl Pyrophosphate Lycopene Anti-hyperlipidemic Photosynthetic Organisms Astaxanthin Anti-hyperlipidemic Terpenes Apocarotenal Anti-hyperlipidemic Spinach & Citrus Lutein Eye Preparations Xanthophyll Canthaxanthin Anti-hyperlipidemic Terpenoids Source: Divi’s Labs, Ventura Research  CRAMS business on growth path, leading to profitability Backed by the strong relationship with the innovators, presence across the entire CRAMS value chain and its ability to support the innovator companies in late life-cycle strategies has enabled Divi’s to establish itself as a leading player in the CRAMS space. Further, the increased focus of MNCs on outsourcing led by cost arbitrage and strong R&D capabilities will only benefit Divi’s. We expect this custom synthesis business to grow at a CAGR of 25% to ` 1277 crore by FY14. Revenue- Custom Synthesis 1400 Rs.Crore 50% 1200 40% 30% 1000 20% 800 10% 600 0% 400 -10% 200 -20% 0 -30% FY10 FY11 FY12 FY13E FY14E Custom Synthesis Growth (%) RHS Source: Divi’s Labs, Ventura Research nd - 8 of 14 - Friday 22 June, 2012 This document is for private circulation, and must be read in conjunction with the disclaimer on the last page.
  • 9. Indian CRAMS industry has grown at a CAGR of 47% over the past three years led by enhanced outsourcing budgets of Big Pharma companies. Currently MNCs, outsource only 25-35% of the CRO activities but with enhanced capabilities, the chunk is all likely to increase. Going ahead, the scenario is expected to get more favorable on account of the impending patent cliff. Divi’s presence in the entire life cycle of a pharmaceutical product makes it the most preferred one - stop solution provider for leading pharmaceutical companies. This is re-iterated by the fact that the Top 25 innovators are already customers to Divi’s. The company also provides complete regulatory supports, including DMF filing and large scale component manufacturing, which helps innovators to meet their requirement under one roof. Life cycle of pharmaceutical product Identifying/disc overing new Drug molecule Discovery Patent Filing Pre Custom clinical/Phase I, Drug Synthesis Phase IIa, Phase Development IIb & Phase III Regulatory Approval Commercial launch End of Patent protection Generic Generics APIs entering Source: Divi’s Labs, Ventura Research  Strong execution, product portfolio selection, and weakening rupee to ensure sustain margin Compared to peers, Divi's have been able to maintain strong margins on account of its ability to swiftly execute capex and ensure quick capacity ramp up. Divi’s policy of adding capacities, only post clear visibility of orders ensures that there is no spare capacity and strong cash flows from the very 1st week of operations leads to ROCE being much higher than peers. Unlike its peers, Divi’s limits its focus to complex chemistry and development of cost efficient processes to manufacture them. This cost competitiveness helps Divi’s to acquire market share and command premium. Source: Divi’s Lab, Ventura Research nd - 9 of 14 - Friday 22 June, 2012 This document is for private circulation, and must be read in conjunction with the disclaimer on the last page.
  • 10. Margin Charts (%) Peer Comparison Charts 60 35 55 Affected by inventory Divi's Lab Ltd 30 50 destocking by global pharma giant 25 45 PAT Margin (%) 40 20 35 Biocon Ltd. 30 15 Piramal Jubilant Life 25 Healthcare Sciences. Ltd 10 20 15 5 Dishman Pharma 10 0 FY06 FY07 FY08 FY09 FY10 FY11 FY12 FY13E FY14E - 10.00 20.00 30.00 40.00 EBITDA Margin (%) EBITDA Margin RHS (%) PAT Margin RHS(%) Source: Divi’s Labs, Ventura Research Source: Divi’ Labs, Ventura Research Rupee depreciation to further boost margins The Rupee depreciation is expected to positively impact margins by 100- 150 bps. Factoring for imports (~13.5% of net sales) and fixed currency contracts, 42% of net revenues would be a net beneficiary of the currency movement. However we have not factored this in our model and represents an upside risk to our estimates.  Strong cash flow and healthy balance sheet Divi's has maintained strong cash flows for FY12 despite higher capex spend. The company has invested nearly ` 200 crore on the 2nd SEZ facility in Vizag and when fully commissioned expects to garner close to ` 400 crore of revenue annually. Currently, the company has capitalized ` 78 crore towards the two commissioned blocks of the Vizag facility and expects to capitalize `120 crore for the remaining three blocks by Q2FY13. The company further intends to spend `150 crore each in the next two years on expansion of existing facilities. Strong capex cycle and capitalization of Vizag facility is positive for the company and would boost its revenues and profitability. Strong cash flow despite capex Particulars (Rs.Crore) FY 11 FY 12 FY 13E FY 14E Capex -158.3 -263.2 -225.0 -250.0 Working Capital Changes -81.3 -208.8 -176.1 -248.3 Cash Flow Net of Capex 241.8 90.2 324.5 410.0 Debt/Equity Ratio (x) 0.0 0.0 0.0 0.0 Increase In Reserves 276.6 334.0 428.7 596.3 Source: Divi’s Labs, Ventura Research nd - 10 of 14 - Friday 22 June, 2012 This document is for private circulation, and must be read in conjunction with the disclaimer on the last page.
  • 11.  Key Concerns Delay in USFDA approval Divi's recently commissioned DSN SEZ at Vizag is awaiting USFDA approvals and any delay in receiving the same would be a risk to our forecast. The management expects to receive USDFA approval by H1FY13 and we remain confident of achieving the same. However, any regulatory delays would impact revenue and profitability of the company adversely. Higher tax incidence to impact profitability Divi’s manufacturing facilities are located in areas offering tax subsidies and hence had a very low tax outgo. However, with Nalgenda facility tax benefit expiring and two units of the Vizag SEZ being eligible only for 50% exemption of export profits for the next 5 years (instead of 100% earlier) tax impact has enhanced to 20-23% from the earlier 7-11%. Financial performance Divi’s Laboratories Ltd has witnessed a robust 49.9% yoy growth in its top line to ` 718.0 crore in Q4FY12 as against ` 479.1 crore in Q4FY11 led by strong growth across segments. The EBITDA margins were maintained at 40.0% due to increasing contribution of the low margins generic API business. However, the PAT margins were lower by 640 bps on account of its higher tax expense. Quarterly Financial Performance Particulars Q4FY12 Q4FY11 FY12 FY11 Net Sales 718.0 479.1 1858.6 1310.3 Growth % 49.9 41.8 Total Expenditure 431.2 286.9 1173.6 816.4 EBIDTA 286.9 192.2 685.0 494.0 EBDITA Margin % 40.0 40.1 36.9 37.7 Depreciation 16.6 13.5 62.1 53.4 EBIT (EX OI) 270.2 178.7 622.9 440.6 Other Income 4.5 10.7 61.5 33.3 EBIT 274.7 189.4 684.4 473.9 Margin % 38.3 39.5 36.8 36.2 Interest 2.73 0.99 3.74 1.52 Exceptional items 0.0 0.0 0.0 0.0 PBT 271.9 188.4 680.6 472.4 Margin % 37.9 39.3 36.6 36.0 Provision for Tax 55.0 13.2 147.4 43.1 PAT 216.9 175.2 533.3 429.3 PAT Margin (%) 30.2 36.6 28.7 32.8 Source: Divi’s Labs, Ventura Research nd - 11 of 14 - Friday 22 June, 2012 This document is for private circulation, and must be read in conjunction with the disclaimer on the last page.
  • 12. Financial outlook Aided by its unique product portfolio and continuous proven capability in the CRAMS segment, we expect Divi’s revenues to grow at a CAGR of 25.2 % to ` 2915.2 crore over the forecast period FY12-14. In addition, we haven’t factored additional revenues coming in from the ready to market products, which should also help boost revenues and profitability going ahead. We expect the PAT to grow at a CAGR of 23.5% to ` 813.7 crore in FY14E as compared to `533.3 crore in FY12. Revenue and Profitability trend 3500 Rs.Crore 40 3000 35 30 2500 25 2000 (%) 20 1500 15 1000 10 500 5 0 0 FY11 FY12 FY13E FY14E Revenue EBITDA Margin (%) PAT Margin (%) Source: Divi’s Labs, Ventura Research Valuation At the CMP of ` 952, Divi's is trading at 19.6x and 15.5x its estimated earnings for FY13 and FY14, respectively. Divi’s is trading at a considerable premium to its counterparts in the domestic market i.e. Biocon, Jubilant as well as to the international players. However, considering the high margin business, steady organic growth, strong cash flows and high return ratios, we believe the premium is completely justified. We initiate coverage on Divi's Laboratories Ltd as a BUY with a Price Objective of `1287 (target 21.0x FY14 P/E) representing an potential upside of 35% over the next 18 months. Peer Comparison Sales Particulars (FY 14) Sales EBITDA (%) PAT (%) ROE(%) Growth (%) On all DiviS Laboratories Ltd. 2915.2 25.2 37.6 27.9 25.8 parameters, Dishman Pharma & Chemicals Ltd. 1420.3 15.0 20.1 7.0 9.5 Divi’s emerges Biocon Ltd. 2698.2 15.9 26.1 15.6 15.8 strong compared Jubilant Life Sciences Ltd. 5745.9 18.4 20.1 8.9 17.5 to its peers Piramal Healthcare Ltd. 2674.2 17.4 9.7 9.0 1.6 *Consenus estimates for players other than Divi’s Labs Source: Divi’s Labs, Ventura Research nd - 12 of 14 - Friday 22 June, 2012 This document is for private circulation, and must be read in conjunction with the disclaimer on the last page.
  • 13. P/E 1600 1400 1200 1000 800 600 400 200 0 Apr-06 Apr-08 Apr-10 Apr-12 CMP 14X 17.5X 21X 24.5X 28X Source: Divi’s Labs, Ventura Research P/B 2000 1800 1600 1400 1200 1000 800 600 400 200 0 Apr-06 Apr-08 Apr-10 Apr-12 CMP 4.5X 5.75X 7X 8.25X 9.5X Source: Divi’s Labs, Ventura Research EV/EBITDA 18000 16000 14000 12000 10000 8000 6000 4000 2000 0 Apr-06 Apr-08 Apr-10 Apr-12 EV 11X 13X 15X 17X 19X Source: Divi’s Labs India, Ventura Research nd - 13 of 14 - Friday 22 June, 2012 This document is for private circulation, and must be read in conjunction with the disclaimer on the last page.
  • 14. Financials and Projections Y/E March, Fig in Rs. Cr FY 2011 FY 2012 FY 2013e FY 2014e Y/E March, Fig in Rs. Cr FY 2011 FY 2012 FY 2013e FY 2014e Profit & Loss Statement Per Share Data (Rs) Net Sales 1307.1 1858.6 2332.0 2915.2 EPS 32.3 40.2 48.7 61.3 % Chg. 42.2 25.5 25.0 Cash EPS 36.4 44.8 54.7 68.4 Total Expenditure 815.6 1173.6 1455.5 1819.4 DPS 10.0 10.0 10.0 10.0 % Chg. 43.9 24.0 25.0 Book Value 135.4 160.6 192.9 237.8 EBITDA 491.5 685.0 876.5 1095.8 Capital, Liquidity, Returns Ratio EBITDA Margin % 37.6 36.9 37.6 37.6 Debt / Equity (x) 0.0 0.0 0.0 0.0 Other Income 36.5 61.5 46.8 60.3 Current Ratio (x) 2.5 2.7 2.6 2.6 Exceptional items 0.0 0.0 0.0 0.0 ROE (%) 23.9 25.0 25.2 25.8 PBDIT 528.0 746.5 923.4 1156.1 ROCE (%) 28.2 33.2 34.5 35.4 Depreciation 53.4 62.1 79.4 94.5 Dividend Yield (%) 1.1 1.1 1.1 1.1 Interest 2.2 3.7 4.7 4.7 Valuation Ratio (x) PBT 472.4 680.6 839.2 1056.8 P/E 29.4 23.7 19.6 15.5 Tax Provisions 43.1 147.4 193.0 243.1 P/BV 7.0 5.9 4.9 4.0 Reported PAT 429.3 533.3 646.2 813.7 EV/Sales 9.7 6.8 5.4 4.3 PAT Margin (%) 32.8 28.7 27.7 27.9 EV/EBIDTA 25.8 18.5 14.4 11.6 Efficiency Ratio (x) Manpower cost / Sales (%) 39.2 41.0 40.0 40.0 Inventory (days) 159.6 133.3 130.0 130.0 Other Exp / Sales (%) 7.1 14.1 14.0 14.0 Debtors (days) 102.6 97.3 95.0 95.0 Tax Rate (%) 9.1 21.7 23.0 23.0 Creditors (days) 67.7 59.2 60.0 60.0 Balance Sheet Cash Flow statement Share Capital 26.5 26.6 26.6 26.6 Profit After Tax 429.3 533.3 646.2 813.7 Reserves & Surplus 1771.0 2105.0 2533.7 3130.0 Depreciation 53.4 62.1 79.4 94.5 Minority Interest & Others 0.0 0.0 0.0 0.0 Working Capital Changes -78.6 -198.0 -176.1 -248.3 Total Loans 23.0 52.8 52.8 52.8 Others -3.9 -43.9 0.0 0.0 Deferred Tax Iiability 50.0 60.9 60.9 60.9 Operating Cash Flow 400.1 353.4 549.5 660.0 Total Liabilities 1870.6 2245.2 2673.9 3270.2 Capital Expenditure -52.8 -232.5 -300.0 -270.0 Goodwill 0.0 0.0 0.0 0.0 Change in Investment -189.9 17.9 -20.4 -151.7 Gross Block 885.7 1118.2 1418.2 1688.2 Cash Flow from Investing -242.7 -214.6 -320.4 -421.7 Less: Acc. Depreciation 295.8 357.8 437.3 531.8 Proceeds from equity issue 7.7 0.0 0.0 0.0 Net Block 589.9 760.4 981.0 1156.4 Inc/ Dec in Debt -9.8 29.7 0.0 0.0 Capital Work in Progress 129.3 160.0 85.0 65.0 Dividend and DDT -154.1 -155.3 -217.4 -217.4 Investments 525.6 477.0 572.4 744.2 Cash Flow from Financing -156.2 -125.6 -217.4 -217.4 Net Current Assets 625.7 847.7 1035.5 1304.6 Net Change in Cash 1.2 13.3 11.7 20.8 Deferred Tax Assets 0.0 0.0 0.0 0.0 Opening Cash Balance 16.5 17.7 30.9 42.6 Total Assets 1870.6 2245.2 2673.9 3270.2 Closing Cash Balance 17.7 30.9 42.6 63.4 Ventura Securities Limited Corporate Office: C-112/116, Bldg No. 1, Kailash Industrial Complex, Park Site, Vikhroli (W), Mumbai – 400079 This report is neither an offer nor a solicitation to purchase or sell securities. The information and views expressed herein are believed to be reliable, but no responsibility (or liability) is accepted for errors of fact or opinion. Writers and contributors may be trading in or have positions in the securities mentioned in their articles. Neither Ventura Securities Limited nor any of the contributors accepts any liability arising out of the above information/articles. Reproduction in whole or in part without written permission is prohibited. This report is for private circulation. nd - 14 of 14 - Friday 22 June, 2012 This document is for private circulation, and must be read in conjunction with the disclaimer on the last page.