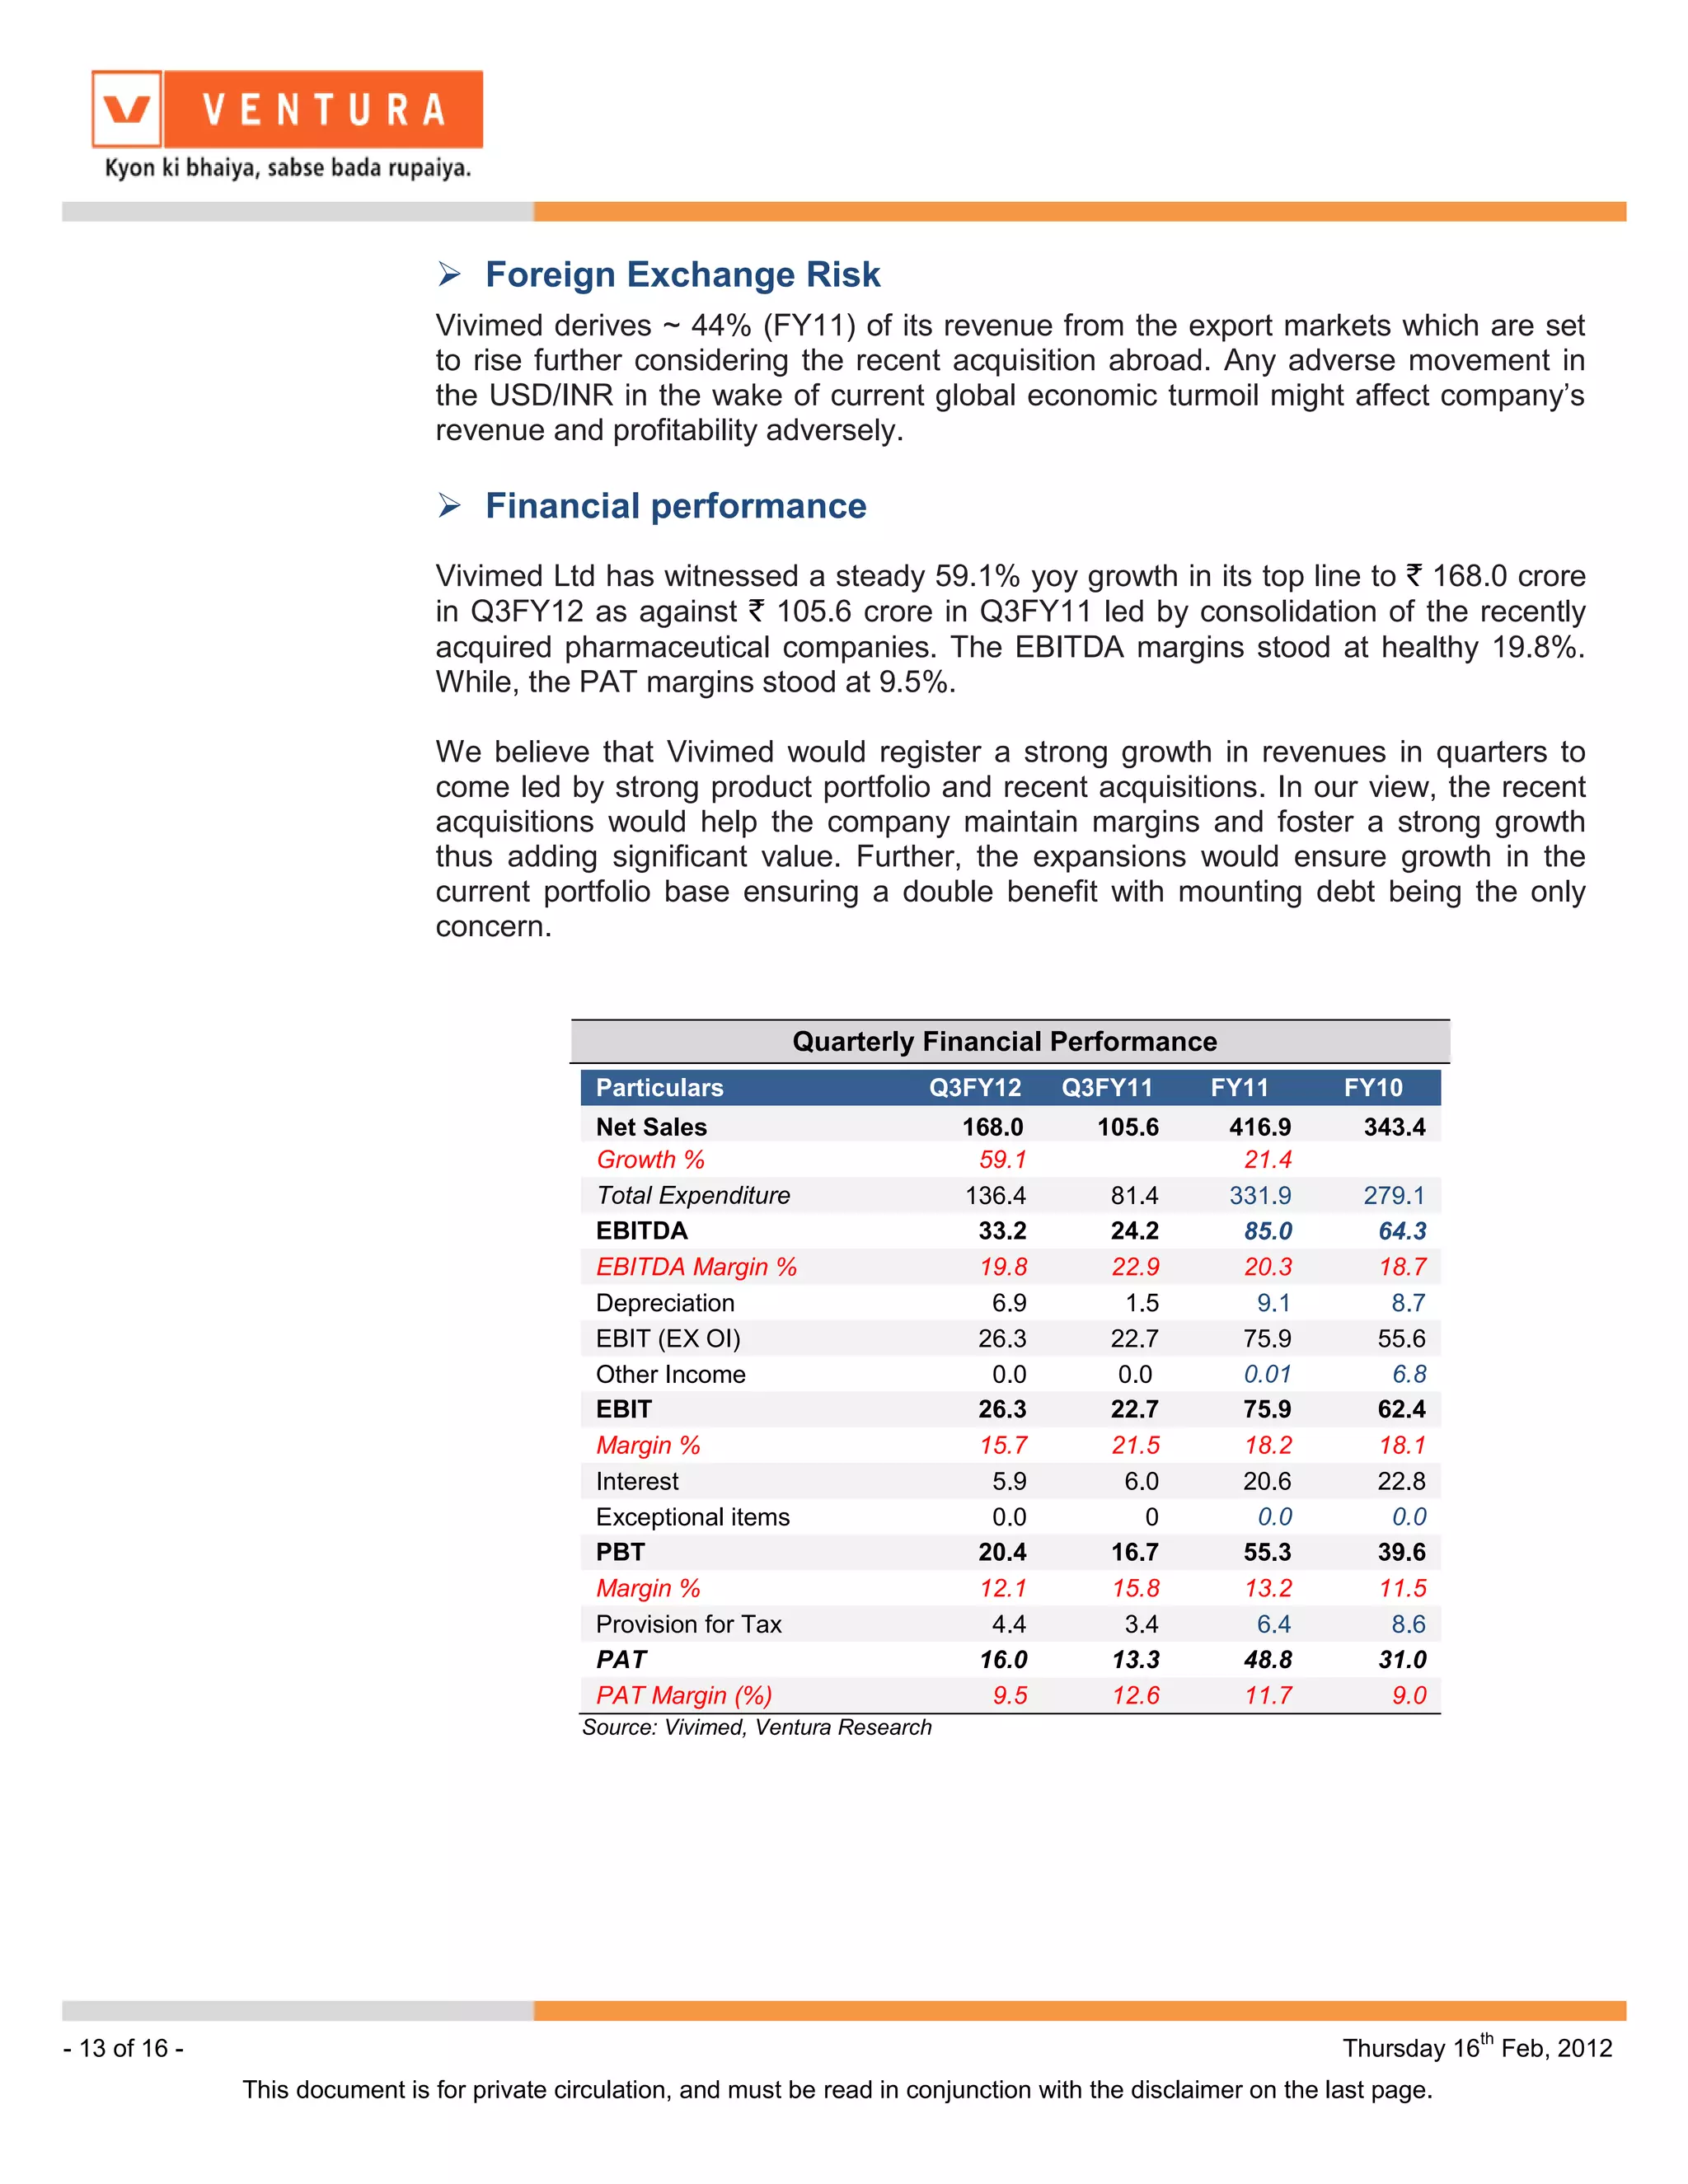
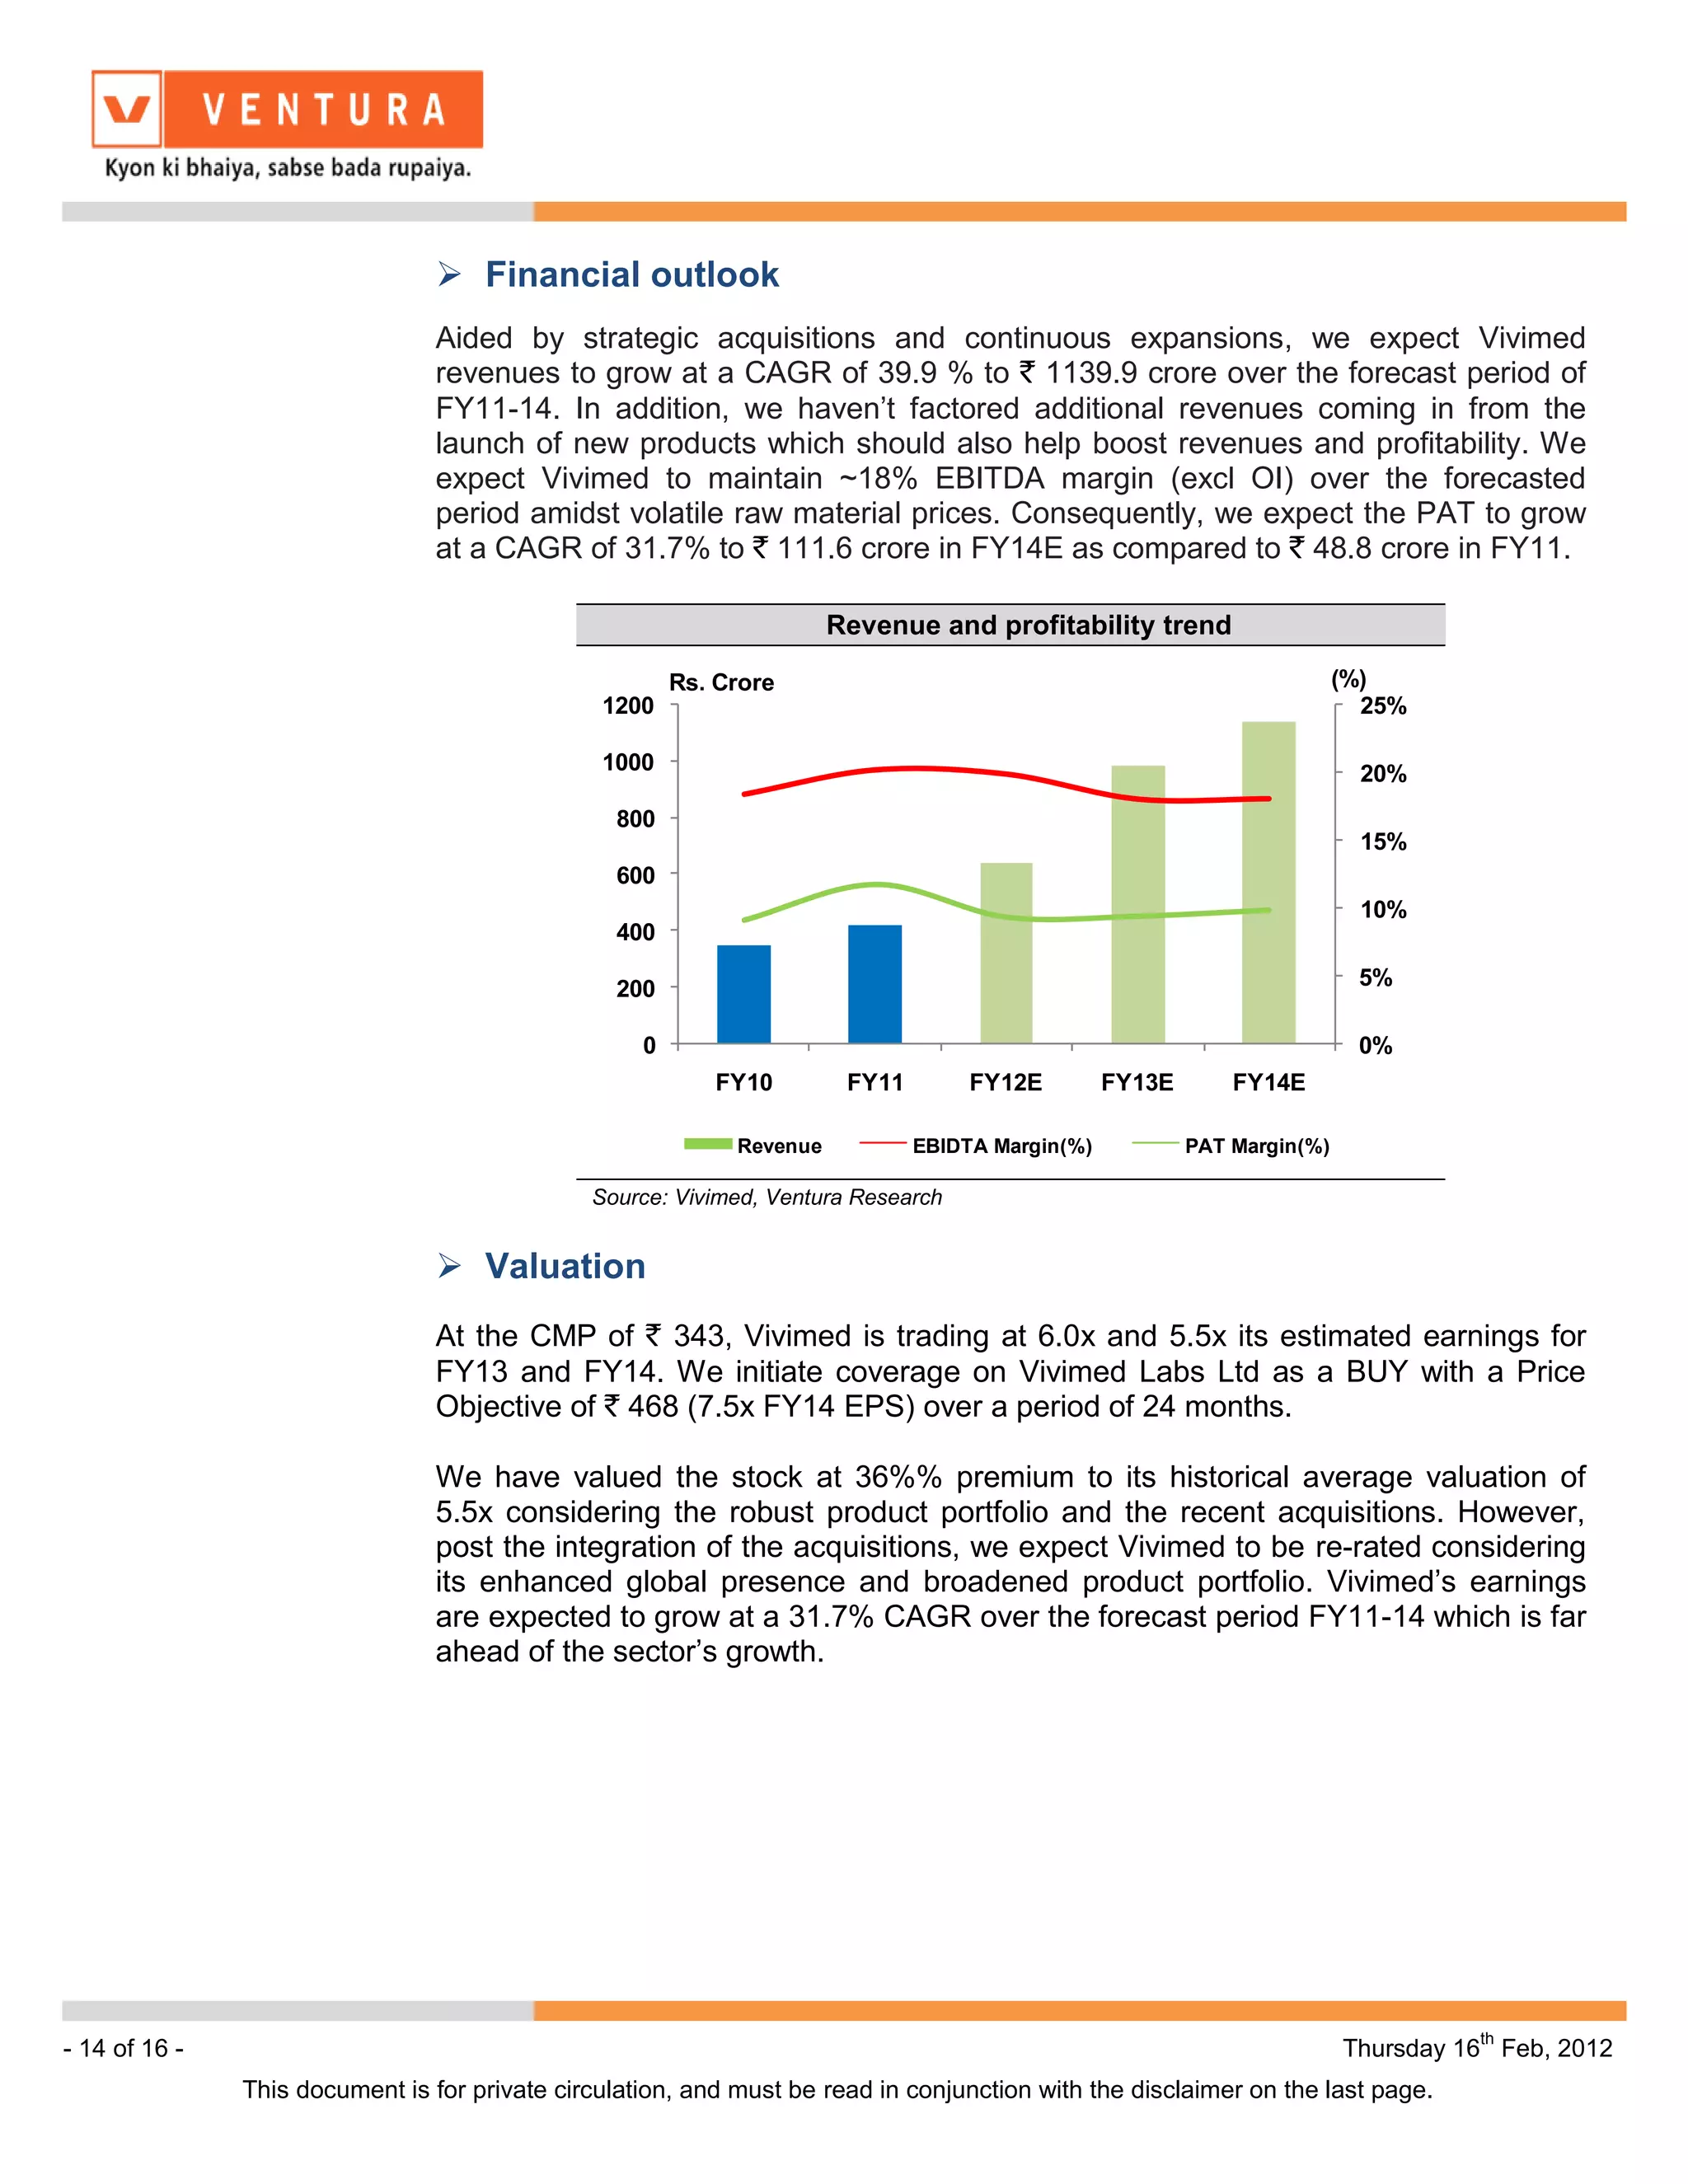
Vivimed Labs is initiating coverage as a buy recommendation with a target price of Rs. 468 per share. At the current market price of Rs. 343, the stock is trading at earnings multiples of 6.0-5.5x for FY13-FY14, representing upside of 36% over 24 months. Vivimed has a diversified portfolio of specialty chemicals and pharmaceuticals and will benefit from expected growth in these industries. Recent acquisitions will also help fuel revenue growth through expanded market reach and synergies. However, mounting debt remains a risk.
The Performance of Every Dividend Aristocrat During The Great RecessionSure Dividend
This presentation investigates the performance of every Dividend Aristocrat during the Great Recession by looking at both earnings trends and stock price performance.
You can view the full list of Dividend Aristocrats below (sorted by sector):
Consumer Staples
Archer-Daniels-Midland (ADM)
Brown-Forman (BF-B)
Colgate-Palmolive (CL)
Clorox (CLX)
Coca-Cola (KO)
Hormel Foods (HRL)
Kimberly-Clark (KMB)
McCormick & Company (MKC)
PepsiCo (PEP)
Procter & Gamble (PG)
Sysco Corporation (SYY)
Wal-Mart (WMT)
Walgreens Boots Alliance (WBA)
Industrials
A.O. Smith (AOS)
Cintas (CTAS)
Dover (DOV)
Emerson Electric (EMR)
Illinois Tool Works (ITW)
3M (MMM)
Pentair (PNR)
Roper Technologies (ROP)
Stanley Black & Decker (SWK)
W.W. Grainger (GWW)
General Dynamics (GD)
Health Care
Abbott Laboratories (ABT)
AbbVie (ABBV)
Becton, Dickinson & Company (BDX)
Cardinal Health (CAH)
Johnson & Johnson (JNJ)
Medtronic (MDT)
Consumer Discretionary
Genuine Parts Company (GPC)
Leggett & Platt (LEG)
Lowe’s (LOW)
McDonald’s (MCD)
Target (TGT)
V.F. Corporation (VFC)
Financials
Aflac (AFL)
Cincinnati Financial (CINF)
Franklin Resources (BEN)
S&P Global (SPGI)
T. Rowe Price Group (TROW)
Materials
Air Products and Chemicals (APD)
Ecolab (ECL)
PPG Industries (PPG)
Praxair (PX)
Sherwin-Williams (SHW)
Nucor (NUE)
Energy
Chevron (CVX)
Exxon Mobil (XOM)
Information Technology
Automatic Data Processing (ADP)
Real Estate
Federal Realty Investment Trust (FRT)
Telecommunication Services
AT&T (T)
Utilities
Consolidated Edison (ED)
We initiate coverage on Wockhardt Limited (Wockhardt) as a BUY with a
Price Objective of ` 978 (target 10.0x FY14 P/E). At CMP of ` 565 the stock
is trading at 3.4x and 5.8x its estimated earnings for FY2013E & FY2014E
representing a potential upside of ~73% over a period of 18 months. With
the contingent liability concerns addressed and bulk of FCCBs already
repaid, the sale of nutrition business will lead to a substantial increase in
cash which could be used to draw down debt or pursue organic / inorganic
grow opportunities. Further its portfolio of high margin niche products and
impressive FTF launches should provide for strong growth in revenues
(12.3% FY11-14 CAGR) to ` 5311.2 crore and earnings (123.6% FY11-14
CAGR) of ` 97.8 /share by FY14.
During the period 2003 through 2008, Wockhardt has traded mostly in line
with the 1 Year forward PE multiple of its peers viz: Sun Pharma, Cipla,
Lupin and Glenmark. However, post its derivative losses, Wockhardt’s EPS
turned negative. Now that the balance sheet is all cleaned up and all
contingent liabilities addressed, we expect that going forward, Wockhardt
will catch up with its peers leading to a substantial re-rating of the stock.
Fibrocell Science, Inc. (OTCBB: FCSC) is a cell therapy company focused on the development of a line of autologous tissue regeneration products for aesthetic, medical, and scientific applications. Using Fibrocell Science's patented process, a patient’s own fibroblast cells are harvested using a minimally invasive skin procedure, then processed, multiplied, purified, cryopreserved and re-injected as personalized therapy. Fibroblasts are cells that contribute to the production of collagen essential in the formation of connective tissue fibers. These matrix fibers are critical to the strength and elasticity of the skin.
Dai Ichi Karkaria: Buy at CMP and add on declinesIndiaNotes.com
At CMP of Rs 85, the company is trading at 6.1x its FY14 Adjusted EPS of Rs 13.9. Investors could buy the stock at the CMP and add on dips to Rs.70-76 band (~5.25 xFY14 EPS) for sequential target prices of Rs 111 and 125.
Burger King represents a unique opportunity to own equity of the second largest QSR branded franchise in the world's fastest going market India.
Learn how Burger King is ramping up to emerge as the fastest-growing food chain. given its fiery pace, global brand, and strong execution we believe that it presents an opportunity for multi-bagger value creation.
In this webinar, we explore how any business should be analyzed to evaluate its true value. And this is the exact process taught in the Mastercourse in Equity Research and Valuation https://wa.me/message/6ALEXA634QLGK1
For the webinar replay https://youtu.be/_WX7t5fRdrM
The Mastercourse is conducted bu Vinit Bolinjkar who has 29 years of experience investing and trading
This presentation was done by Yash Bhansali & Varun Bisen both students of the School of Market Studies' Mastercourse in Equity Research & Valuation. It is a realtime demonstration of the skills that you will acquire once you finish the course.
The Mastercourse in Equity Research & Valuation has enabled both Yash and Varun to prepare and present a financial model on Varun Beverages Ltd with forecasting and calculation of intrinsic value using DCF Valuation methodology absolutely independently.
Normally a research analyst takes two years to "officially" be termed as a sector specialist. However, under the able guidance of Vinit Bolinjkar who has 28 years of market experience your process of learning the ropes of equity research, financial modeling, and forecasting goes much faster.
In fact, he virtually guarantees that after 4 months of the internship (following the two months of online learning) you will be able t easily forecast 80% of the market and be as good as any analyst on Dalal Street with two years of work experience.
This presentation was done by Stuti Dang & Kirti Gumber both students of the School of Market Studies' Mastercourse in Equity Research & Valuation.
The Mastercourse in Equity Research & Valuation has enabled both Stuti and Kirti to prepare and present a financial model on Voltas Ltd with forecasting and calculation of intrinsic value using DCF Valuation methodology absolutely independently.
Normally a research analyst takes two years to "officially" be termed as a sector specialist. However, under the able guidance of Vinit Bolinjkar who has 28 years of market experience your process of learning the ropes of equity research, financial modeling, and forecasting goes much faster.
In fact, he virtually guarantees that after 4 months of the internship (following the two months of online learning) you will be able t easily forecast 80% of the market and be as good as any analyst on Dalal Street with two years of work experience.
So what are you waiting for? JOIN NOW https://wa.me/919730836363
This is the outcome of what a student learns in the Mastercourse in Equity Research & Valuation that is organized by the School of Market Studies.
After two months of intense training, we have a 4-month internship. During the first month of internship Varsha Bezzam, a student made this absolutely detailed presentation on HUL.
This include
leadership analysis,
industry study
MOATS for HUL
Business outlook & strategy
Financial modeling
Equity Valuation using price earning method and DCF valuation
Peer comparison
Get LinkedIn₹ : LinkedIn Mastery for Job Search, Lead Gen & Sales, and Personal Branding online course is set to be launched on June 8.
Helping you master LinkedIn for your job search, personal branding & zero cost leads 4 B2B sales
Get Linkedin Podcast: Srinivasan Iyengar, COO Nippon Life on using LinkedIn for Job Search, Sales & Personal Branding https://bit.ly/3cn1e2a
#CoronaVirus update:
#AskVinit
The only solution for preventing its spread is ISOLATION.
Work from home should be encouraged.
All public places of congregation for social & cultural activities must be stopped
Infected areas must be locked down
Government & corporate leaders should act decisively to promote best practices for the same
For every death, there are potential 800 people infected.
The fatality is higher than that of H1N1, SARS & MERS
We should adopt the Taiwan model which despite being so close to China is not impacted.
The concept of economic moats was first made popular by Warren Buffett. In actuality, a moat is a water body around a wonderful castle that helps prevent being raided by enemies. The attractiveness of the castle would have lured enemies to attack. In a similar way, the superior returns of a business venture would invariably attract competition.
To protect your business you would have to build significant competitive advantages that would help secure it.
Branding
Superior product offering
Great distribution
Size of operation
Scalability
Management quality
Technology adoption
IPR / patents / copyrights
are some of the factors which help to build a moat. And several of these together help to broaden and deepen the moat.
Businesses without moats are waiting to get raided. And we must watch the economic moats with a hawks eye to ensure that they are not being eroded. Especially in today’s times, when disruptive forces erode competitive advantages, we must ensure that it is enduring.
However, it is not easy to understand whether the moat is eroding or not. Cause the effect of no moat or an eroding moat will show up much later in the deteriorating financial performance of the business. Hence the time to engage in a “moat checkup and review” is when the business is at its peak.
Quick & easy system for finding stocks with multibagger potential
If you were asked to find a multibagger from the listed universe of stocks you would obviously get bogged down. The sheer effort of having to go through each of the 5000 stocks and deciding on its multibagger potential would be, to put it mildly, overwhelming! And I guarantee that you would reach nowhere!
Yet there has to be a better way of doing this. So why not invert the whole process and de-select stocks that that do meet the requirements of being investment grade. What you are left with is purely stocks that you would invest in. Next, we apply the proprietary tools to understand whether a stock can be a multibagger. At India Investors Club we refer to this process as the Criteria of Elimination in Stock Picking
Please find attached, the Initiating Coverage Report on OCL India Ltd.
OCL India Ltd (OCL) is well poised to benefit from the focused emphasis of the newly elected government on infrastructural development in East India. In line with this emphasis, OCLs timing of hiking cement grinding capacity to 6.7 MTPA in March 2014 could not have been better. With the expanded capacity, we expect OCL to report healthy revenue 2 year CAGR of 26% to Rs.3067 crore and PAT growth of 65% to Rs.292 crore by FY16E.
We initiate coverage on OCL as a BUY with a Price Objective of Rs.536 representing a potential upside of ~91% over a period of 18 months. At the CMP of Rs.280, the stock is trading at an EV/EBITDA multiple of 2.7x FY16E and at an EV/Tonne of cement sold in FY16 of $60 ($42 EV/Tonne of capacity). The replacement cost currently is in the range of US$120-140 per tonne.
At the CMP of Rs 33, the stock is trading at an Adj P/BV of 1.3x and 1.1x for FY15E and FY16E, respectively. With the new government stepping-up reforms and making efforts to remove the bottlenecks in the economy, we expect the economic growth to pick up going forward. Consequently, we expect the strong growth momentum seen in SIB over past few years to continue. We expect advances and deposits to grow at a CAGR of ~19% each over the forecasted period of FY14-16E.
With business further expected to grow at CAGR of 19.5% over FY14-16E; NIMs remaining stable at ~3.0% and cost-to-income ratio improving to ~45% (currently ~50%), we expect a robust PAT growth of 22.6% CAGR over FY14-16E to Rs 763 crore.
Asset quality of SIB has improved in FY14 with GNPA and Net NPA standing at 1.2% and 0.8% in FY14 against 1.4% and 0.8% in FY13, respectively (which compares favourably with peers).
On the capital adequacy front, SIB is comfortably placed to support the future business needs of the bank over the period FY14-16E. The management has stated that it does not require any Tier-I capital funding during the current year. However, it plans to raise Tier-II capital of Rs 200 crore in FY15 to fund future growth.
In comparison to the less than ordinary and unimaginative budgetary proposals of yester years, Modi’s maiden budget comes as a welcome change from the norm. The proposals and reforms suggested in the Union Budget 2014-15 are ground breaking, specific with a good measure of thought & common sense and vastly catered for holistic growth of the economy.
The challenging circumstances of a slowing economy, soaring energy prices, inflation, fiscal and current account deficits do not provide adequate leeway to maneuver and hit the path of high growth. Yet the Budget provides a comprehensive plan and directional footprint towards overcoming these hurdles to sustainable growth of 7-8% over the next few years along with providing macro economic stability, lowered inflation, realistic fiscal health targeting and a manageable current account deficit.
The Finance Minister while presenting the budget takes cognizance of the fact that decisive action to fuel growth without populism is the need of the hour. And that resources for developmental expenditure cannot be raised at the cost of burdening the future generations with the legacy of debt. He goes on to emphasize the need to mobilize resources through both tax and non-tax revenues to feed the aspirational developmental expenditure.
In order to achieve this objective the Modi Government has taken head on the various issues plaguing the Indian economy and come out with imaginative and yet very practical and implementable reforms and measures.
Most commodities futures have been in a narrow trading range for quite a while now. However with volatility returning many have started to show signs of movement In this blog post we look at the commodities which hold promise. Corn, copper and soyabean are clear shorts while silver is on the verge of a break down. Gold though in a sideways consolidation could be a short term sell. Meanwhile crude oil and natural gas are hitting strong overhead resistances and could over the next few days put in some pullback. Platinum is still undecisive, sugar is a stock to watch for a buying opportunity and palladium is one lone metal which seems headed higher.
The Indian Pharmaceutical sector has been on a roll ever since the global economy picked itself up post the 2007 mayhem. Given the strong fundamentals of the Indian Pharmaceutical industry and the global opportunity due to the patent cliff in the western world, listed pharmaceutical stocks have responded well and rallied substantially. While the international opportunities have been good for the bottom line, pharmaceutical stocks with a larger or significant share of the domestic pharma market have come in for a rude shock as the implementation of the new pricing policy outline of the NPPA can sharply erode profitability. As the policy elements are still not clear, it would be premature to judge how individual companies would be affected.
With a view to having a mid journey outlook on expected price performance of pharmaceutical stocks, we decided to conduct a study of the major pharmaceutical stocks using technical analysis and analyse which stocks offer the best opportunity both from a long and short point of view. The exhaustive analysis was done on 29 of the major stocks, the details of which one can obtained from the slideshow.
The analysis was done using weekly chart data to get a more longer term picture and some of the results we found were quite contrary to general market expectation; yet others were quite revealing of exciting investment opportunities. We could have easily summed up our analysis and provided an instant listing of our analysis and recommendations for the benefit of our blog readers, but we thought it more appropriate that the reader “visualize” our analysis as “one picture is worth more than a thousand words.”
Technical analysis is a great science for stock price forecasting, but the overall investment decision can be more solid if backed by hard core fundamental study. In part 2 of the Indian Pharmaceutical Outlook, we would be providing extremely high quality fundamental evaluation on the fortunes of these very 29 stocks so that our faithful blog readers can make investment decisions based on comprehensive analysis.
As with all the content on this blog, the report will be provided FREE. However in order to make a point of the exclusivity of the content, we request blog readers to send us an email so that we could deliver it directly in your email inbox. This we request so that we could obtain your feedback on the same report so that we can improve on the content. We would also like to solicit your opinion on the type of content that readers find interesting so that future blog posts could be based more on reader interest rather than just what we think you should read.
We initiate coverage on Petronet LNG Limited(Petronet) as a BUY with a Price Objective of Rs 151 (target PE of 11x
FY2013) over a period of 15-18 months. At CMP of Rs 132.1, the stock is trading at 13.6x and 9.6x its estimated earnings
for FY2012E & FY2013E representing a potential upside of ~13.6%. Petronet LNG is majorly engaged in the business of
LNG procurement, transportation and regasification. Burgeoning natural gas demand supply mismatch in the country
makes it inevitable that the additional demand would be met by imported LNG. Petronet LNG, with its Kochi terminal set
to commission in Q4FY12 and expansion at its Dahej terminal, is all set to benefit from the current scenario. In addition,
diversification plans into the power segment add further value to the company. We expect revenue & earnings growth of
26.1% & 36.5% CAGR respectively over the next three years.
Favourable natural gas demand and supply to augur well for PLNG
On the back of growing consumption, demand for natural gas is expected to
grow at a faster rate of 16.3% (5 year CAGR) to 381 mmscmd compared to
supply which is expected to grow at a 5 year CAGR of 6.8% to 202.9 mmscmd.
This burgeoning demand supply gap is expected to be met through LNG
imports and Petronet LNG with its expanded capacity is well placed to garner a
major portion of this incremental demand. We expect the revenues of Petronet
LNG to grow at a CAGR of 26.1% to Rs 21343.7 crore over the forecast
period.
Kochi terminal & Dahej expansion to drive volume growth
The USD 850 mn Kochi LNG terminal of 2.5 MMTPA capacity is expected to
commission in Q4FY12 which would be later expanded to 5.0 MMTPA by the
end of FY13. Kochi terminal can help serve the Southern market where the
landed cost of domestic gas is higher. The Dahej expansion to 12.5 MMTPA is
expected to commence by FY13 with an additional jetty at Dahej at a cost of
~USD 980 million. Both these projects are to funded in a 70:30 Debt to Equity
ratio. We expect the LNG volumes to grow from the 7.6 MMTPA in FY10 to
10.4 MMTPA in FY13.
LNG pricing not a major concern
Although the LNG pricing is linked to JCC, over the forecast period we do not
expect significant cost increases as there is a fixed formula for pricing the
sourced LNG. Also, with the company having back to back off-take
agreements, we do not foresee any risk in passing on any of the increased
costs. While the recent nuclear
We initiate coverage on Mahindra & Mahindra Ltd (M&M) as a BUY with a Price Objective of `975. At CMP of `727, the stock is trading at 16.2x and 14.1x its estimated earnings for FY13 & FY14 respectively, representing a potential upside of ~34% over a period of 15 months. UV sales (XUV500 and Xylo) and LCVs (Maximmo, Genio and Gio) are expected to be the key drivers of growth, while the tractor business is expected to weather the cyclical downturn and experience moderate traction. In addition the tangible benefits of the Ssangyong acquisition would be felt over the medium term as the joint R&D efforts and new product launches materialize. We forecast revenues and earnings to grow at a CAGR of 15.6% and 10.7% to `40,062.3 and `3,169.7 crore, respectively over FY12-14.
XUV 500 and refurbished Xylo to sustain volume growth in the UV segment
After having witnessed a CAGR of 23% over FY09-12, M&M UV sales are expected to moderate going ahead on account of new launches by competitors, rising fuel prices and higher interest rates. We expect M&M UV sales to post a CAGR of 13.2% over FY12-14 to ~2,60,000 units led by capacity ramp up of XUV 500 and strong demand for its existing products.
Weathering the cyclical downturn in tractor sales
The tractor industry being cyclical in nature has been witnessing a downturn since November 2011, after posting robust growth in the preceding two years. We expect this moderation in growth to continue in the near term led by a host of new capacity additions which will affect pricing power, expectation of an unfavorable monsoon and rising interest rates, which would affect serviceability of tractor loans. However, favorable factors like increasing budgetary allocation towards the rural sector, rising non-farm usage, higher MSP among others are likely to partially offset the downturn. While CMIE expects the volumes to grow by 8% for the entire industry, we are less optimistic and expect much lower growth of ~6%. However, southern India which is under penetrated is expected to grow much faster than the industry growth. On the back drop of its new facility of 1,00,000 units p.a. being commissioned at Zaheerabad in Karnataka, we expect M&M the market leader to grow faster than the industry.
We expect M&M (market leader with a share of ~40%) to post a CAGR of 7.5% over FY12-14 to reach ~2,72,000 units by FY14 and consequently revenues from this segment are expected to reach ~`11,500 crore by FY14 (CAGR of 8.6%). However, we expect significant pressure on margins led by higher raw material costs and lack of pricing power given the large capacity expansions across the industry.
LCV growth momentum to continue
Despite being a late entrant in the commercial vehicles (CV) market, M&M has carved for itself an enviable market share of ~30% in a relatively short span of time. Although the growth in the LCV markets is expected to tone down to a CAGR of 14% (from a 3 year CAGR of 32.9% over FY09-11), we expect M&M to outperform th
Currently pi network is not tradable on binance or any other exchange because we are still in the enclosed mainnet.
Right now the only way to sell pi coins is by trading with a verified merchant.
What is a pi merchant?
A pi merchant is someone verified by pi network team and allowed to barter pi coins for goods and services.
Since pi network is not doing any pre-sale The only way exchanges like binance/huobi or crypto whales can get pi is by buying from miners. And a merchant stands in between the exchanges and the miners.
I will leave the telegram contact of my personal pi merchant. I and my friends has traded more than 6000pi coins successfully
Tele-gram
@Pi_vendor_247
how can i use my minded pi coins I need some funds.DOT TECH
If you are interested in selling your pi coins, i have a verified pi merchant, who buys pi coins and resell them to exchanges looking forward to hold till mainnet launch.
Because the core team has announced that pi network will not be doing any pre-sale. The only way exchanges like huobi, bitmart and hotbit can get pi is by buying from miners.
Now a merchant stands in between these exchanges and the miners. As a link to make transactions smooth. Because right now in the enclosed mainnet you can't sell pi coins your self. You need the help of a merchant,
i will leave the telegram contact of my personal pi merchant below. 👇 I and my friends has traded more than 3000pi coins with him successfully.
@Pi_vendor_247
Even tho Pi network is not listed on any exchange yet.
Buying/Selling or investing in pi network coins is highly possible through the help of vendors. You can buy from vendors[ buy directly from the pi network miners and resell it]. I will leave the telegram contact of my personal vendor.
@Pi_vendor_247
Introduction to Indian Financial System ()Avanish Goel
The financial system of a country is an important tool for economic development of the country, as it helps in creation of wealth by linking savings with investments.
It facilitates the flow of funds form the households (savers) to business firms (investors) to aid in wealth creation and development of both the parties
where can I find a legit pi merchant onlineDOT TECH
Yes. This is very easy what you need is a recommendation from someone who has successfully traded pi coins before with a merchant.
Who is a pi merchant?
A pi merchant is someone who buys pi network coins and resell them to Investors looking forward to hold thousands of pi coins before the open mainnet.
I will leave the telegram contact of my personal pi merchant to trade with
@Pi_vendor_247
how to sell pi coins in South Korea profitably.DOT TECH
Yes. You can sell your pi network coins in South Korea or any other country, by finding a verified pi merchant
What is a verified pi merchant?
Since pi network is not launched yet on any exchange, the only way you can sell pi coins is by selling to a verified pi merchant, and this is because pi network is not launched yet on any exchange and no pre-sale or ico offerings Is done on pi.
Since there is no pre-sale, the only way exchanges can get pi is by buying from miners. So a pi merchant facilitates these transactions by acting as a bridge for both transactions.
How can i find a pi vendor/merchant?
Well for those who haven't traded with a pi merchant or who don't already have one. I will leave the telegram id of my personal pi merchant who i trade pi with.
Tele gram: @Pi_vendor_247
#pi #sell #nigeria #pinetwork #picoins #sellpi #Nigerian #tradepi #pinetworkcoins #sellmypi
Financial Assets: Debit vs Equity Securities.pptxWrito-Finance
financial assets represent claim for future benefit or cash. Financial assets are formed by establishing contracts between participants. These financial assets are used for collection of huge amounts of money for business purposes.
Two major Types: Debt Securities and Equity Securities.
Debt Securities are Also known as fixed-income securities or instruments. The type of assets is formed by establishing contracts between investor and issuer of the asset.
• The first type of Debit securities is BONDS. Bonds are issued by corporations and government (both local and national government).
• The second important type of Debit security is NOTES. Apart from similarities associated with notes and bonds, notes have shorter term maturity.
• The 3rd important type of Debit security is TRESURY BILLS. These securities have short-term ranging from three months, six months, and one year. Issuer of such securities are governments.
• Above discussed debit securities are mostly issued by governments and corporations. CERTIFICATE OF DEPOSITS CDs are issued by Banks and Financial Institutions. Risk factor associated with CDs gets reduced when issued by reputable institutions or Banks.
Following are the risk attached with debt securities: Credit risk, interest rate risk and currency risk
There are no fixed maturity dates in such securities, and asset’s value is determined by company’s performance. There are two major types of equity securities: common stock and preferred stock.
Common Stock: These are simple equity securities and bear no complexities which the preferred stock bears. Holders of such securities or instrument have the voting rights when it comes to select the company’s board of director or the business decisions to be made.
Preferred Stock: Preferred stocks are sometime referred to as hybrid securities, because it contains elements of both debit security and equity security. Preferred stock confers ownership rights to security holder that is why it is equity instrument
<a href="https://www.writofinance.com/equity-securities-features-types-risk/" >Equity securities </a> as a whole is used for capital funding for companies. Companies have multiple expenses to cover. Potential growth of company is required in competitive market. So, these securities are used for capital generation, and then uses it for company’s growth.
Concluding remarks
Both are employed in business. Businesses are often established through debit securities, then what is the need for equity securities. Companies have to cover multiple expenses and expansion of business. They can also use equity instruments for repayment of debits. So, there are multiple uses for securities. As an investor, you need tools for analysis. Investment decisions are made by carefully analyzing the market. For better analysis of the stock market, investors often employ financial analysis of companies.
how to swap pi coins to foreign currency withdrawable.DOT TECH
As of my last update, Pi is still in the testing phase and is not tradable on any exchanges.
However, Pi Network has announced plans to launch its Testnet and Mainnet in the future, which may include listing Pi on exchanges.
The current method for selling pi coins involves exchanging them with a pi vendor who purchases pi coins for investment reasons.
If you want to sell your pi coins, reach out to a pi vendor and sell them to anyone looking to sell pi coins from any country around the globe.
Below is the contact information for my personal pi vendor.
Telegram: @Pi_vendor_247
If you are looking for a pi coin investor. Then look no further because I have the right one he is a pi vendor (he buy and resell to whales in China). I met him on a crypto conference and ever since I and my friends have sold more than 10k pi coins to him And he bought all and still want more. I will drop his telegram handle below just send him a message.
@Pi_vendor_247
Empowering the Unbanked: The Vital Role of NBFCs in Promoting Financial Inclu...Vighnesh Shashtri
In India, financial inclusion remains a critical challenge, with a significant portion of the population still unbanked. Non-Banking Financial Companies (NBFCs) have emerged as key players in bridging this gap by providing financial services to those often overlooked by traditional banking institutions. This article delves into how NBFCs are fostering financial inclusion and empowering the unbanked.
Falcon stands out as a top-tier P2P Invoice Discounting platform in India, bridging esteemed blue-chip companies and eager investors. Our goal is to transform the investment landscape in India by establishing a comprehensive destination for borrowers and investors with diverse profiles and needs, all while minimizing risk. What sets Falcon apart is the elimination of intermediaries such as commercial banks and depository institutions, allowing investors to enjoy higher yields.
The secret way to sell pi coins effortlessly.DOT TECH
Well as we all know pi isn't launched yet. But you can still sell your pi coins effortlessly because some whales in China are interested in holding massive pi coins. And they are willing to pay good money for it. If you are interested in selling I will leave a contact for you. Just telegram this number below. I sold about 3000 pi coins to him and he paid me immediately.
Telegram: @Pi_vendor_247
US Economic Outlook - Being Decided - M Capital Group August 2021.pdfpchutichetpong
The U.S. economy is continuing its impressive recovery from the COVID-19 pandemic and not slowing down despite re-occurring bumps. The U.S. savings rate reached its highest ever recorded level at 34% in April 2020 and Americans seem ready to spend. The sectors that had been hurt the most by the pandemic specifically reduced consumer spending, like retail, leisure, hospitality, and travel, are now experiencing massive growth in revenue and job openings.
Could this growth lead to a “Roaring Twenties”? As quickly as the U.S. economy contracted, experiencing a 9.1% drop in economic output relative to the business cycle in Q2 2020, the largest in recorded history, it has rebounded beyond expectations. This surprising growth seems to be fueled by the U.S. government’s aggressive fiscal and monetary policies, and an increase in consumer spending as mobility restrictions are lifted. Unemployment rates between June 2020 and June 2021 decreased by 5.2%, while the demand for labor is increasing, coupled with increasing wages to incentivize Americans to rejoin the labor force. Schools and businesses are expected to fully reopen soon. In parallel, vaccination rates across the country and the world continue to rise, with full vaccination rates of 50% and 14.8% respectively.
However, it is not completely smooth sailing from here. According to M Capital Group, the main risks that threaten the continued growth of the U.S. economy are inflation, unsettled trade relations, and another wave of Covid-19 mutations that could shut down the world again. Have we learned from the past year of COVID-19 and adapted our economy accordingly?
“In order for the U.S. economy to continue growing, whether there is another wave or not, the U.S. needs to focus on diversifying supply chains, supporting business investment, and maintaining consumer spending,” says Grace Feeley, a research analyst at M Capital Group.
While the economic indicators are positive, the risks are coming closer to manifesting and threatening such growth. The new variants spreading throughout the world, Delta, Lambda, and Gamma, are vaccine-resistant and muddy the predictions made about the economy and health of the country. These variants bring back the feeling of uncertainty that has wreaked havoc not only on the stock market but the mindset of people around the world. MCG provides unique insight on how to mitigate these risks to possibly ensure a bright economic future.
how to sell pi coins effectively (from 50 - 100k pi)DOT TECH
Anywhere in the world, including Africa, America, and Europe, you can sell Pi Network Coins online and receive cash through online payment options.
Pi has not yet been launched on any exchange because we are currently using the confined Mainnet. The planned launch date for Pi is June 28, 2026.
Reselling to investors who want to hold until the mainnet launch in 2026 is currently the sole way to sell.
Consequently, right now. All you need to do is select the right pi network provider.
Who is a pi merchant?
An individual who buys coins from miners on the pi network and resells them to investors hoping to hang onto them until the mainnet is launched is known as a pi merchant.
debuts.
I'll provide you the Telegram username
@Pi_vendor_247
what is the future of Pi Network currency.DOT TECH
The future of the Pi cryptocurrency is uncertain, and its success will depend on several factors. Pi is a relatively new cryptocurrency that aims to be user-friendly and accessible to a wide audience. Here are a few key considerations for its future:
Message: @Pi_vendor_247 on telegram if u want to sell PI COINS.
1. Mainnet Launch: As of my last knowledge update in January 2022, Pi was still in the testnet phase. Its success will depend on a successful transition to a mainnet, where actual transactions can take place.
2. User Adoption: Pi's success will be closely tied to user adoption. The more users who join the network and actively participate, the stronger the ecosystem can become.
3. Utility and Use Cases: For a cryptocurrency to thrive, it must offer utility and practical use cases. The Pi team has talked about various applications, including peer-to-peer transactions, smart contracts, and more. The development and implementation of these features will be essential.
4. Regulatory Environment: The regulatory environment for cryptocurrencies is evolving globally. How Pi navigates and complies with regulations in various jurisdictions will significantly impact its future.
5. Technology Development: The Pi network must continue to develop and improve its technology, security, and scalability to compete with established cryptocurrencies.
6. Community Engagement: The Pi community plays a critical role in its future. Engaged users can help build trust and grow the network.
7. Monetization and Sustainability: The Pi team's monetization strategy, such as fees, partnerships, or other revenue sources, will affect its long-term sustainability.
It's essential to approach Pi or any new cryptocurrency with caution and conduct due diligence. Cryptocurrency investments involve risks, and potential rewards can be uncertain. The success and future of Pi will depend on the collective efforts of its team, community, and the broader cryptocurrency market dynamics. It's advisable to stay updated on Pi's development and follow any updates from the official Pi Network website or announcements from the team.
1. Vivimed Labs Ltd.
BUY
Target Price ` 468 CMP ` 343 FY14 PE 5.5x
Index Details We initiate coverage on Vivimed Labs Ltd as a BUY with a Price
Sensex 18,154 Objective of ` 468 (target 7.5x FY14 EPS). At CMP of ` 343, the stock is
Nifty 5,522 trading at 6.0x and 5.5x its estimated earnings for FY13 & FY14
BSE 100 9,568
representing a potential upside of ~36% over a period of 24 months.
Vivimed Labs Ltd is a diversified global company with a unique
Industry Pharma
portfolio of products in the Specialty Chemicals and Pharmaceuticals
categories. Niche product portfolio in specialty chemicals coupled with
Scrip Details significant inorganic growth through its recent acquisitions in the
Mkt Cap (` cr) 348 pharma space should help the company post an earnings growth of
BVPS (`) 194 31.7% CAGR over the period FY11 to FY14.
O/s Shares (Cr) 1.4
Niche product portfolio and expansions to drive future growth
AvgVol Lacs) 0.7
52 Week H/L 354/213 The matured Home and Personal care (H&PC) global markets are expected to
Div Yield (%) 0.6 grow at CAGR of 3.2% to USD 368 bn by 2015 while in India the H&PC markets
STOCK POINTER
are expected to grow at a faster pace of 12.2% to USD 8 bn by 2015. Vivimed
FVPS (`) 10.0
being well embedded as a global quality supplier of active ingredient to the H&PC
industry is best placed to benefit from this growth. We expect Vivimed’s overall
Shareholding Pattern revenues to grow at a CAGR of 39.9% to ` 1139.9 crore over the forecast period of
Shareholders % FY11-14 with 50.0% of the revenues coming for the specialty chemicals product
portfolio and the balance from the capacity expansions and inorganic growth in the
Promoters 43.6
pharmaceutical space.
DIIs 1.6
FIIs 18.2 Recent acquisitions to fuel revenue growth
Public 36.6
In a strategic move, to enhance presence across the value chain and hasten entry
Total 100
to the regulated markets (which generally has a 36-48 months penetration lead
time), Vivimed acquired Uquifa, a 75 year old API and intermediates manufacturing
Vivimed vs. Sensex company. Considering Vivimed’s, strong track record of successful acquisitions, we
expect the company to effectively leverage these acquisitions and add value.
Besides Uquifa, Vivimed has also acquired two small formulation companies Klar
Sehen Pvt Ltd & Octtantis Nobel Labs for a consideration of ` 24 crore and ` 5
crore, respectively. These acquisitions would help Vivimed reduce costs by
achieving manufacturing synergies and expand sales and profitability by increasing
market and client penetration. We expect, Vivimed to earn revenues to the tune of `
352 crore in FY14 from these acquisitions.
Key Financials (` in Cr)
Net EPS Growth RONW ROCE EV/
Y/E Mar EBITDA PAT EPS P/E (X)
Revenue (%) (%) (%) EBITDA(X)
2011 416.0 84.1 48.8 48.0 - 24.8 16.4 7.1 11.9
2012E 636.2 126.5 58.9 42.3 -12.0 13.0 14.8 8.1 7.9
2013E 982.1 176.7 91.6 57.1 35.0 16.9 16.6 6.0 5.7
2014E 1139.9 205.5 111.6 62.4 9.3 17.2 17.5 5.5 4.9
- 1 of 16 - Thursday 16th Feb, 2012
This document is for private circulation, and must be read in conjunction with the disclaimer on the last page.
2. Significant entry barriers to ensure limited competition leading
to sustainability of revenues
In the active ingredients market where product quality has precedence over price,
becoming a preferred supplier to global majors is a strenuous and prolonged process.
Vivimed with its quality offering has established strong relationships with global
majors and over time has embedded itself within these multinationals and now is a
supplier across a wide range of products.
Valuation
At the CMP of ` 343, Vivimed is trading at 6.0x and 5.5x its estimated earnings for
FY13 and FY14. We initiate coverage on Vivimed Labs Ltd as a BUY with a Price
Objective of ` 468 (7.5x FY14 EPS) over a period of 24 months.
We have valued the stock at 36% premium to its historical average valuation of 5.5x
considering the robust product portfolio and the recent acquisitions. Vivimed’s
earnings are expected to grow at a 31.7% CAGR over the forecast period FY11-14
which is far ahead of the sector’s growth. Post the integration of the acquisitions, we
expect Vivimed to be re-rated considering its enhanced global presence and
broadened product portfolio. Though, mounting debt remains an overhang on the
stock.
th
- 2 of 16 - Thursday 16 Feb, 2012
This document is for private circulation, and must be read in conjunction with the disclaimer on the last page.
3. Company background
Vivimed was established in 1989 as a single product (VIV-20) and single location
company. Since then the company has grown by leaps and bounds to emerge as a
preferred supplier of several key ingredients to MNCs in the specialty chemicals &
pharmaceutical segments.
In the specialty chemical division, Vivimed is engaged in the manufacturing and
marketing of active ingredients within the Home & Personal Care products, and
Industrial care products. While, in the pharmaceutical division, the company provides
contract manufacturing services as well as undertakes manufacturing and marketing
of branded formulations. In addition, Vivimed through timely acquisitions of James
Robinson, Harmet International as well as the recent acquisition of Uquifa, has
maintained its growth trajectory as well as further enhanced its presence in the global
markets.
Vivimed Labs- Business Organization
VIVIMED LABS
Specialty
Pharmaceuticals
Chemicals
CRAMs Formulations APIs
Active Industrial
Ingredients Care
Uquifa
Vivimed Labs India
Prod.,Sales and
(Prod, Dist & R&D)
Klar Sehen Prod & Marketing
Marketing
Vivimed Labs
(Marketing &Distribution)
Creative Healthcare Octtantis Nobel
Vivimed Labs UK (Prod & Dist) Distribution
(Sales, Marketing and R&D)
Vivimed Labs USA
(Production, Sales and
R&D)
Source: Vivimed, Ventura Research
th
- 3 of 16 - Thursday 16 Feb, 2012
This document is for private circulation, and must be read in conjunction with the disclaimer on the last page.
4. Headquartered in Hyderabad, Vivimed operates out of 9 manufacturing facilities (6
domestic and 3 overseas), 3 R&D facilities (1 domestic and 2 overseas). It has a
customer base spread across 50 countries with SBUs based in America (Vivimed Labs
USA Inc) and Europe (Vivimed Labs Europe) along with a marketing office in China.
Manufacturing Plants of Vivimed Labs
Plant Location Manufacturing Details
Bidar Northern Karnataka Specialty Chemicals Sunscreens, Anti Microbial and Preservatives
Bonthapally Hyderabad Specialty Chemicals Home & Personal Care actives
Jeedimetla Hyderabad Formulation and R&D Dosage formulations
Haridwar Uttarakhand Formulations Sterile products - Small Volume Parentals
Kashipur Uttarakhand Formulations Non-Sterile Syrups, tablets, Capulses and dry powders.
Cuernavaca Mexico APIs Acquired through Uquifa Acquisition
Sant Celoni Spain APIs Acquired through Uquifa Acquisition
Llica de Vall Spain APIs Acquired through Uquifa Acquisition
Chouttuppal* Hyderabad Formulations Tablets & Capsules
Srikakulam** AP SEZ Synthetic organic chemicals
Source: Vivimed, Ventura Research
Niche product portfolio and expansions to drive future growth
The matured Home and Personal Care (H&PC) global markets are expected to grow
to USD 368 bn by 2015 while the Indian H&PC markets are expected to grow at a
faster pace of 12.2% to USD 8 bn by 2015. Vivimed being well embedded as a global
quality supplier of the active ingredient to the H&PC industry is best placed to benefit
from this growth. We expect Vivimed’s overall revenues to grow at a CAGR of 39.9%
to ` 1139.9 crore over the forecast period of FY11-14 with 50.0% of the revenues
coming for the specialty chemicals product portfolio and the balance from the
capacity expansions and inorganic growth in the pharmaceutical space.
Revenue and Profitability trend
Rs. Crore (%)
1200 25%
1000 Triclosan Triclosan CaGp
Triclosan CaGp 20% Avobenzone
800 CaGp Avobenzone Climbazole Ben 4
Triclosan Avobenzone Climbazole 15% TCC
Triclosan CaGp Climbazole Ben 4 Starcat
Triclossan 600
CaGp Avobenzone Ben 4 TCC ZnPTO
CaGP Avobenzone Climbazole Starcat 10%
TCC SAP*
400 ZnPTO
200 5%
0 0%
FY10 FY11 FY12E FY13E FY14E
Revenue EBIDTA Margin(%) PAT Margin(%)
Source: Vivimed, Ventura Research
Avis
Avis Ben-4
Avis Avis Ben-4 Dantuff-z
Ben 4 Ben 4 Dantuff-z Etone
Etone Co-Guars
Vivinol th
- 4 of 16 - Thursday 16 Feb, 2012
This document is for private circulation, and must be read in conjunction with the disclaimer on the last page.
5. Specialty chemical business - a major contributor to growth
Led by ` 25 crore worth of expansions at its existing two specialty chemical plants,
we expect the specialty chemical division to grow at a three year CAGR of 21.7% to `
570.3 crore by FY14. Vivimeds portfolio of active ingredients caters to nearly 75% of
the global H&PC market (USD 268 bn, 3.2% CAGR) and with these enhanced
capacities the company is expected to benefit immensely.
Specialty Chemicals-Revenue and EBITDA Margin
Rs. Crore (%)
600 25
500 20
400
15
300
10
200
100 5
0 -
FY11 FY12E FY13E FY14E
Revenue EBIDTA Margin RHS (%)
Source: Vivimed, Ventura Research
H&PC Products dominates the specialty segments business
1% 1%
2%
Hair Care
6%
Pharmace Antimicrobles
6% 26%
uticals Sun Care
22%
Intermediaries
9%
Oral Care
Photohromics
13% Other Chemicals
Specialty
Chemicals
18% Imaging
78% Skin Care
18% Preservatives
Source: Vivimed, Ventura Research
th
- 5 of 16 - Thursday 16 Feb, 2012
This document is for private circulation, and must be read in conjunction with the disclaimer on the last page.
6. Robust Industry growth to support revenue growth
Global Personal Care Market Domestic Personal Care Ingredient Market
USD bn USD mn
400 368 900
354 800
328 341 800
350 315
291 303
300 280 700
250 600
200 500
150 400 350
100 300
50 200
0 100
2008 2009 2010 2011 2012 2013 2014 2015 0
2009 2015
Source:Vivimed,Ventura Research Source:Vivimed,Ventura Research
Global Personal Care Ingredient Market Global Personal Care Ingredient Market Breakup
USD bn Oral Others
20 Care 6%
9%
15
15
10
10
Skin
care
Hair 50%
5 Care
35%
0
2009 2015
Source:Vivimed,Ventura Research Source:Vivimed,Ventura Research
James Robinson acquisition - complete portfolio offering in the Hair care
segment.
Vivimed’s product portfolio is dominated by the products in the Sun Care, Hair Care
and Anti microbial segments. Post the acquisition of James Robinson’s, Vivimed has
a complete portfolio of Hair Care products catering to each sub segment of
Shampoos, Conditioners, and Hair Dyes. Vivimed also has a tie up with International
Specialty Products (ISP) for the joint marketing of various sunscreen products thus
expanding its base in Sun Care segment.
th
- 6 of 16 - Thursday 16 Feb, 2012
This document is for private circulation, and must be read in conjunction with the disclaimer on the last page.
7. Product portfolio in Home & Personal Care
Divisions Products Description & End Uses Key Clients
VIV-20 Antibacterial For Toothpastes & Mouthwash
Unilever,
VIVCAL-G Nutraceutical, Dental enamel protection
Oral Care P&G, Dabur,
VIVHEX Antibacterial for Mouthwash BDF
VIVHEX-G Antibacterial for Mouthwash
AVIS Broad Spectrum UV-A Filter
CINNAMON UV- B Category 1 Filter
Unilever,
BEN-3 Oil Soluble UV-A & UV -B Filter
Sun Care P&G, L'Oreal,
Ben-4 Water Soluble UV-A & UV -B Filter BDF
OCTYNE-B Oil Soluble UV- B Filter
ETONE UA-A & UV- B Filter
VINTOX Anti-Oxidant & Anti-aging Molecule
VIVINOL Skin Lightening agent BASF,
Skin Care
TRU ALOE Skin Moisturizer Sederma
C-VITE Anti Wrinkle
DANTUFF-Z Broad Spectrum Anti Dandruff agent
DANTUFF-C Anti-Fungal agent in transparent Shampoos
DANTUFF-K Anti dandruff & Anti-Fungal agent
Hair Care Unilever, ITC,
VIPIROX Anti dandruff agent
Dabur
VIVIDINE Hair growth agent
CO-GUAR Emollients & Conditioners
COSVAT Anti-Fungal & Anti bacterial
Preservatives
VIVILIDE Wide Spectrum bacteriostatic
Unilever,
VIVMAX Antimicrobial & Germicidal
Antimicrobials BASF, J&J
VIV-20 Antibacterial For Cosmetic & Toiletries
Source: Vivimed, Ventura Research
Industrial segment to complement growth in H&PC
In addition to Home & Personal Care segment, Vivimed caters to the Industrial
Segment with products in photo chromatic dyes and imaging chemicals. In the photo
chromatic segment, Vivimed is a world leader in the development of innovative photo
chromic dyes manufactured and marketed under the name of Reversacol.
Product Portfolio in Industrial Care
Category Key Products Description End Uses Key Clients
Photochromic Lenses, toys, films, Clothes, Keystone, Corning,
Reversacol Patented high Performance dyes
Dyes Cosmetics like nail Varnish Mildex Optical
Phenidone Black and White development agent
Imaging
Dimezone Black and white developing agent Anti- X-rays, Photography Kodak, Fuji, LG
Chemicals
Nitroindazole fogging agent
Source: Vivimed, Ventura Research
th
- 7 of 16 - Thursday 16 Feb, 2012
This document is for private circulation, and must be read in conjunction with the disclaimer on the last page.
8. SEZ facility on the cards
Vivimed is also establishing a SEZ in Andhra Pradesh at a cost of ` 120 crore to cater
to the growing export demand of synthetic organic chemicals in the H&PC segment.
In addition, the company is expanding its product base by foraying into new segments
with the development of a Skin lightening ingredient and chemicals for Printed
Electronics. Since the SEZ is expected to commission post FY14, we have not
factored these in our revenues.
Product portfolio and expansions in Pharma to further enhance
value
Vivimed has a wide range of formulation products across therapeutic segments with
significant presence in CRAMs.This segment is poised for major growth fuelled by
capacity expansions and acquisitions. Vivimed is setting up a green field plant in
Hyderabad, at an investment of ` 40 crore and is undertaking some de-bottlenecking
exercises at its existing Jeedimetla plant. Further the company has acquired Uquifa,
Klar Sehen and Octtantis Nobel in the API and branded formulations space. Aided by
these expansions and recent acquisitions, we expect the revenues to receive a major
boost and grow at a CAGR of 78.8% to ` 569.6 crore over the forecast period (2011-
14).
Pharma - Revenue and EBIDTA Margin
Rs. Crore (%)
600 25
500 20
400
15
300
10
200
100 5
0 -
FY11 FY12E FY13E FY14E
Revenue EBIDTA Margin RHS (%)
Source: Vivimed, Ventura Research
th
- 8 of 16 - Thursday 16 Feb, 2012
This document is for private circulation, and must be read in conjunction with the disclaimer on the last page.
9. Vivimed Pharmaceutical Product Portfolio
CAPSULES/TABLETS SYRUPS & LIQUIDS SMALL VOLUME
PARENTALS
FLEXASUR CODAREX OTRIVIN
SPASMOCIP PLUS INALGEL NASIVION MOIST
CODARIN VISCODYNE NASIVION
BUTAPROXIVON BROZEDEX CANDBIOTIC EAR
VALENZIA TABLETS CELADRIN DROP
ARACHITOL TABLET MITS CODEINE OTRIVIN NASAL
C PINK TABLET LINCTUS SPRAY
CANDID LOTION TOBROP
CANDID MOUTH
PAINT
MERCK
CRAMS NOVARTIS
RANBAXY
GLENMARK
CIPLA
LUPIN
Source: Vivimed, Ventura Research
Recent acquisitions to fuel revenue growth
In a strategic move, to enhance presence across the value chain and hasten entry to
the regulated markets (which generally has a 36-48 months penetration time),
Vivimed acquired Uquifa, a 75 year old API and intermediates manufacturing
company. Considering Vivimed’s, strong track record of successful acquisitions, we
expect the company to effectively leverage the acquisition and add value. Besides
Uquifa, Vivimed has also acquired two small formulation companies Klar Sehen Pvt
Ltd & Octtantis Nobel Labs for a consideration of ` 24 crore and ` 5 crore
respectively. These acquisitions would help Vivimed reduce costs by achieving
manufacturing synergies and expand sales and profitability by increasing market and
client penetration. We estimate Vivimed to earn revenues to the tune of ` 352 crore in
FY14 from these acquisitions.
th
- 9 of 16 - Thursday 16 Feb, 2012
This document is for private circulation, and must be read in conjunction with the disclaimer on the last page.
10. Profile of Major strategic acquisitions
James Robinson Harmet Klar Sehen Pvt Octtantis Nobel Uquifa, Spain &
Acquisition Ltd International Ltd Labs Mexico
Year of
2008 2009 2011 2011 2011
Acquisition
Cost of
USD 21 mn USD 3 mn Rs 24 crore Rs 5 crore USD 55 mn
Acquisition
Stake 100% 100% 100% 60% 100%
Photochromic Dyes Active
Sales and Pharmaceuticals &
and Imaging Ophthalmic Products Pharmaceutical
Distribution Nutraceuticals
Products Chemicals Products
Complements Strong marketing
Direct entry to Foray into booming
Rationale of Niche product Vivimed’s portfolio in field force to help
the developed generic API
Acquisition portfolio. high growth expand distribution
markets. segment.
ophthalmic segment. reach.
Source: Vivimed, Ventura research
Uquifa- a unique value proposition
Vivimed has acquired it for a consideration of USD 55 million (` 286 crore) funded
through a debt equity mix of 65:35. Vivimed’s equity infusion of USD 20 million is via
an SPV (Vivimed Labs Spain S.L), debt financing of USD 25 million has been
provided by Exim Bank and balance USD 10 million is by the way of deferred
payments.
Benefits of Uquifa acquisition
Source: Vivimed, Ventura Research
Other two acquisitions in branded formulations to enhance
presence in domestic biz
In addition to Uquifa, Vivimed in its acquisition spree acquired two formulation
companies in India, Klar Sehen Pvt Ltd (KSPL) (100% stake) and Octtantis Nobel
th
- 10 of 16 - Thursday 16 Feb, 2012
This document is for private circulation, and must be read in conjunction with the disclaimer on the last page.
11. Labs (50% stake) in 2011 for ` 24 crore and ` 5 crore respectively with presence in
manufacturing and marketing of branded formulations.
Benefits KSPL and Octtantis acquisition
Presence in North-
150 MRs East, Bihar & AP Strong
Distribution
Reach
KSPL
Presence in
Octtantis Pharmaceutical
Nobel & Nutraceutical
50 Trade
cGMP compliant
Labs Segment
Marks
manuf acturing f acility
at Kolkata &
Hyderbad
Source: Vivimed, Ventura Research
Significant entry barriers to ensure limited competition and
sustainability of growth
In the active ingediants market where product quality has precedence over price,
becoming a preferred supplier to global majors is a strenuous and prolonged process.
Vivimed with its quality offering has established strong relationships with global
majors and over a time period has embedded itself within these multinationals and
now is a supplier across a wide range of products.
Timeline of Product Basket Expansion
Unilever
L’oreal
P&G
Source: Vivimed, Ventura Research
th
- 11 of 16 - Thursday 16 Feb, 2012
This document is for private circulation, and must be read in conjunction with the disclaimer on the last page.
12. Typical time-line to be embedded as a vendor to an MNC is 5-7 years thus raising the
competitive bar. Further, the contracts are long term in nature ensuring stable
revenues for a longer period of time. Considering these huge entry barriers, and
expanding product portfolio of Vivimed, we are very comfortable with regards to
revenue visibility.
Activity Timelines
Sample Quantities 3 to 6 months
Small/Trial Batches 6 to 9 months
Stabilization period 15 to 18 months
Commercial Quantities 6 to 9 Months
Source: Vivimed, Ventura Research
Vivimed’s strong skill set for innovations, research based idea-generation right from
creation of a molecule to partnering with a manufacturer provides the company with a
significant competitive edge.
KEY CONCERNS
Mounting debt, a key risk to profitability
Especially in the current high interest environment, Vivimed’s debt by FY14 would be
very high at `515 crore (debt equity ratio of 0.8). Since along with debt, significant
equity dilution has already been done leaving with very little scope for further
expansion of equity. As the cash flows are strong, we forsee no issues with regards
to debt serviceability. However, a sharp deterioration of economic environment & rise
in interest rates can impact adversely.
Debt to Equity Interest Coverage to Debt/EBIDTA
(Rs.Crore) (%) (%)
1400 1.8 7.0 4.0
1200 1.6 6.0 3.5
1.4 3.0
1000 5.0
1.2
2.5
800 1 4.0
0.8 2.0
600 3.0
0.6 1.5
400
0.4 2.0
1.0
200 0.2 1.0 0.5
0 0
0.0 0.0
FY11 FY12E FY12E FY14E
FY11 FY12E FY13E FY14E
Debt Debt to Equity
Interest Coverage Ratio Debt/EBIDTA (RHS)
Source:Vivimed, Ventura Research Source: Vivimed, Ventura Research
th
- 12 of 16 - Thursday 16 Feb, 2012
This document is for private circulation, and must be read in conjunction with the disclaimer on the last page.
13. Foreign Exchange Risk
Vivimed derives ~ 44% (FY11) of its revenue from the export markets which are set
to rise further considering the recent acquisition abroad. Any adverse movement in
the USD/INR in the wake of current global economic turmoil might affect company’s
revenue and profitability adversely.
Financial performance
Vivimed Ltd has witnessed a steady 59.1% yoy growth in its top line to ` 168.0 crore
in Q3FY12 as against ` 105.6 crore in Q3FY11 led by consolidation of the recently
acquired pharmaceutical companies. The EBITDA margins stood at healthy 19.8%.
While, the PAT margins stood at 9.5%.
We believe that Vivimed would register a strong growth in revenues in quarters to
come led by strong product portfolio and recent acquisitions. In our view, the recent
acquisitions would help the company maintain margins and foster a strong growth
thus adding significant value. Further, the expansions would ensure growth in the
current portfolio base ensuring a double benefit with mounting debt being the only
concern.
Quarterly Financial Performance
Particulars Q3FY12 Q3FY11 FY11 FY10
Net Sales 168.0 105.6 416.9 343.4
Growth % 59.1 21.4
Total Expenditure 136.4 81.4 331.9 279.1
EBITDA 33.2 24.2 85.0 64.3
EBITDA Margin % 19.8 22.9 20.3 18.7
Depreciation 6.9 1.5 9.1 8.7
EBIT (EX OI) 26.3 22.7 75.9 55.6
Other Income 0.0 0.0 0.01 6.8
EBIT 26.3 22.7 75.9 62.4
Margin % 15.7 21.5 18.2 18.1
Interest 5.9 6.0 20.6 22.8
Exceptional items 0.0 0 0.0 0.0
PBT 20.4 16.7 55.3 39.6
Margin % 12.1 15.8 13.2 11.5
Provision for Tax 4.4 3.4 6.4 8.6
PAT 16.0 13.3 48.8 31.0
PAT Margin (%) 9.5 12.6 11.7 9.0
Source: Vivimed, Ventura Research
th
- 13 of 16 - Thursday 16 Feb, 2012
This document is for private circulation, and must be read in conjunction with the disclaimer on the last page.
14. Financial outlook
Aided by strategic acquisitions and continuous expansions, we expect Vivimed
revenues to grow at a CAGR of 39.9 % to ` 1139.9 crore over the forecast period of
FY11-14. In addition, we haven’t factored additional revenues coming in from the
launch of new products which should also help boost revenues and profitability. We
expect Vivimed to maintain ~18% EBITDA margin (excl OI) over the forecasted
period amidst volatile raw material prices. Consequently, we expect the PAT to grow
at a CAGR of 31.7% to ` 111.6 crore in FY14E as compared to ` 48.8 crore in FY11.
Revenue and profitability trend
Rs. Crore (%)
1200 25%
1000 20%
800
15%
600
10%
400
200 5%
0 0%
FY10 FY11 FY12E FY13E FY14E
Revenue EBIDTA Margin(%) PAT Margin(%)
Source: Vivimed, Ventura Research
Valuation
At the CMP of ` 343, Vivimed is trading at 6.0x and 5.5x its estimated earnings for
FY13 and FY14. We initiate coverage on Vivimed Labs Ltd as a BUY with a Price
Objective of ` 468 (7.5x FY14 EPS) over a period of 24 months.
We have valued the stock at 36%% premium to its historical average valuation of
5.5x considering the robust product portfolio and the recent acquisitions. However,
post the integration of the acquisitions, we expect Vivimed to be re-rated considering
its enhanced global presence and broadened product portfolio. Vivimed’s earnings
are expected to grow at a 31.7% CAGR over the forecast period FY11-14 which is far
ahead of the sector’s growth.
th
- 14 of 16 - Thursday 16 Feb, 2012
This document is for private circulation, and must be read in conjunction with the disclaimer on the last page.
15. P/E
800
700
600
500
400
300
200
100
0
Apr-07 Apr-09 Apr-11 Apr-13
CMP 3X 4X 5X 6X 7X
P/Adj.BV
800
700
600
500
400
300
200
100
0
Apr-07 Apr-09 Apr-11 Apr-13
CMP 0.8X 1X 1.2X 1.4X 1.6X
EV/EBIDTA
1600
1400
1200
1000
800
600
400
200
0
Apr-07 Apr-09 Apr-11 Apr-13
EV 3.45X 4.45X 5.45X 6.45X 7.45X
Source: Ventura Research
th
- 15 of 16 - Thursday 16 Feb, 2012
This document is for private circulation, and must be read in conjunction with the disclaimer on the last page.
16. Financials & Projections
Y/E March, Fig in Rs. Cr FY 2011 FY 2012e FY 2013e FY 2014e Y/E March, Fig in Rs. Cr FY 2011 FY 2012e FY 2013e FY 2014e
Profit & Loss Statement Per Share Data (Rs)
Net Sales 416.0 636.2 982.1 1139.9 EPS 48.0 42.3 57.1 62.4
% Chg. 52.9 54.4 16.1 Cash EPS 53.9 73.5 106.8 127.8
Total Expenditure 331.9 509.7 805.3 934.5 DPS 2.0 2.0 2.0 2.0
% Chg. 53.6 58.0 16.0 Book Value 193.5 326.3 337.8 363.2
EBDITA 84.1 126.5 176.7 205.5 Capital, Liquidity, Returns Ratio
EBDITA Margin % 20.2 19.9 18.0 18.0 Debt / Equity (x) 1.6 0.9 0.9 0.8
Other Income 0.9 0.9 1.1 1.2 Current Ratio (x) 4.6 2.6 3.6 3.5
PBDIT 85.0 127.5 177.8 206.7 ROE (%) 24.8 13.0 16.9 17.2
Depreciation 9.1 26.1 27.2 29.0 ROCE (%) 16.4 14.8 16.6 17.5
Interest 20.6 26.8 34.7 36.5 Dividend Yield (%) 0.6 0.6 0.6 0.6
PBT 55.3 74.5 116.0 141.3 Valuation Ratio (x)
Tax Provisions 6.4 15.7 24.4 29.7 P/E 7.1 8.1 6.0 5.5
Reported PAT 48.8 58.9 91.6 111.6 P/BV 1.8 1.1 1.0 0.9
PAT Margin (%) 11.7 9.3 9.3 9.8 EV/Sales 2.4 1.6 1.0 0.9
EV/EBIDTA 11.9 7.9 5.7 4.9
Raw Materials / Sales (%) 58.1 59.0 61.0 61.0 Efficiency Ratio (x)
Manpower cost / Sales (%) 4.8 5.0 5.0 5.0 Inventory (days) 74.1 75.0 75.0 75.0
Other Exp / Sales (%) 7.4 7.3 7.3 7.3 Debtors (days) 111.9 110.0 110.0 110.0
Tax Rate (%) 11.6 21.0 21.0 21.0 Creditors (days) 41.0 45.0 45.0 45.0
Balance Sheet Cash Flow statement
Share Capital 10.2 140.9 76.1 17.9 Profit After Tax 48.8 58.9 91.6 111.6
Reserves & Surplus 186.5 313.7 466.4 632.0 Depreciation 9.1 26.1 27.2 29.0
Minority Interest & Others 0.0 0.0 0.0 0.0 Working Capital Changes -106.2 -25.3 -170.6 -69.0
Total Loans 307.7 391.7 511.8 514.5 Others 0.5 1.2 0.0 0.0
Deferred Tax Liability 14.7 14.7 14.7 14.7 Operating Cash Flow -47.8 60.9 -51.8 71.6
Total Liabilities 519.1 861.0 1069.0 1179.0 Capital Expenditure -28.7 -35.8 -55.2 -84.7
Goodwill 84.6 32.6 32.6 32.6 Change in Investment 9.4 -315.0 0.0 0.0
Gross Block 223.3 791.8 823.0 877.7 Cash Flow from Investing -19.3 -350.8 -55.2 -84.7
Less: Acc. Depreciation 43.5 251.7 278.8 307.8 Proceeds from equity issue 1.9 201.2 0.0 0.0
Net Block 179.7 540.1 544.2 569.9 Inc/ Dec in Debt 72.4 84.0 120.1 2.7
Capital Work in Progress 1.7 18.0 42.0 72.0 Dividend and DDT -1.7 -3.3 -3.8 -4.2
Investments 0.0 0.0 0.0 0.0 Cash Flow from Financing 72.5 281.9 116.3 -1.5
Net Current Assets 246.4 263.6 443.5 497.8 Net Change in Cash 5.5 -8.0 9.2 -14.6
Misc Expenses 6.7 6.7 6.7 6.7 Opening Cash Balance 5.6 11.1 3.1 12.3
Total Assets 519.1 861.0 1069.0 1179.0 Closing Cash Balance 11.1 3.1 12.3 -2.3
Ventura Securities Limited
Corporate Office: C-112/116, Bldg No. 1, Kailash Industrial Complex, Park Site, Vikhroli (W), Mumbai – 400079
This report is neither an offer nor a solicitation to purchase or sell securities. The information and views expressed herein are believed to be reliable, but no
responsibility (or liability) is accepted for errors of fact or opinion. Writers and contributors may be trading in or have positions in the securities mentioned in their
articles. Neither Ventura Securities Limited nor any of the contributors accepts any liability arising out of the above information/articles. Reproduction in whole or
in part without written permission is prohibited. This report is for private circulation.
th
- 16 of 16 - Thursday 16 Feb, 2012
This document is for private circulation, and must be read in conjunction with the disclaimer on the last page.