This document discusses diversifying African trade. It provides a snapshot of current African trade, which remains highly dependent on commodities, with minerals and ores making up over two-thirds of exports. While the EU and US are still major trade partners, Chinese trade with Africa has surged significantly in recent years. The report examines partnerships with emerging economies like India and Turkey that are increasing trade with Africa. It also looks at regional trade blocs and external trade policies, identifying obstacles to trade and providing recommendations to further diversify African trade and promote sustainable economic growth.


![8 ATLANTIC COUNCIL
DIVERSIFYING AFRICAN TRADE: THE ROAD TO PROGRESS
• Turkey hosted the inaugural Turkey-Africa Cooperation
Summit in Istanbul in 2008, prompting the African
Union (AU) to declare Turkey a strategic partner.23
A
second summit followed in 2014. Turkish investors
have been particularly attracted to Ethiopia’s low labor
costs and access to the port of Djibouti. Turkey has
targeted Ethiopia’s fast-growing and export-oriented
textile industry, which has been enhanced by Ethiopia’s
participation in several tariff preference programs.
Turkish textile giant Ayka Textile began production in
Ethiopia in 2010 with its Ayka Addis Group.24
• India has capitalized on its strong cultural ties and
geographic proximity to Eastern and Southern Africa
to become one of the continent’s largest trade partners,
with bilateral trade projected to reach $100 billion this
year.25
Large Indian diaspora communities and their
descendants live in Eastern and Southern Africa, and
many are involved in business. Two of East Africa’s
largest companies were founded by Africans of Indian
23 Alpaslan Özerdem, “How Turkey Is Emerging as a Key Development
Partner in Africa,” Guardian, April 10, 2013, http://www.theguardian.
com/global-development-professionals-network/2013/apr/10/tur-
key-development-partner-africa.
24 Ayka Textile, http://www.aykatextile.com/index.htm.
25 “One Among Many,” Economist, January 17, 2015, http://www.econ-
omist.com/news/middle-east-and-africa/21639554-china-has-become-
big-africa-now-backlash-one-among-many.
descent, including the Ugandan Madhvani Group,
which employs more than ten thousand people in its
manufacturing and industry operations in East Africa,
and Kenya’s Chandaria Group, which manufactures
nearly all of its tissue and hygiene products in country.26
India’s Tata Group, estimated to have a combined
market capitalization of more than $130 billion, first
expanded into Africa in 1994.27
As Tata Africa Managing
Director-designate Thamsanqa Mbele noted, “[Tata
International] has built itself a reputation as a credible
partner by its willingness to invest in building long-term
relationships.”28
The dividends received from doing
so are clear—Tata Africa now has a manufacturing
presence in twelve countries.29
• Brazil has historically traded with the Portuguese-
speaking African countries, but is branching out to
anglophone nations. Brazilian firm Odebrecht began
26 Kakira Sugar, “Madhvani Group,” http://www.kakirasugar.com/content/
madhvani-group; Chandaria Industries Limited, “Company Profile,” http://
www.chandaria.com/about-chandaria-industries/company-profile.
27 Tata, “Tata Group Profile,” http://www.tata.com/aboutus/sub_index/
Leadership-with-trust.
28 Tata, “African Safari,” July 2013, http://www.tataafrica.com/Mediar-
oom/articles_and_interview_african_safari.htm.
29 Tata, “Tata in Africa,” July 2013, http://www.tata.com/tataworldwide/
index/Tata-in-Africa.
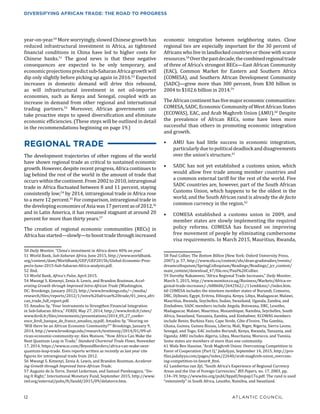
0
100
200
300
400
500
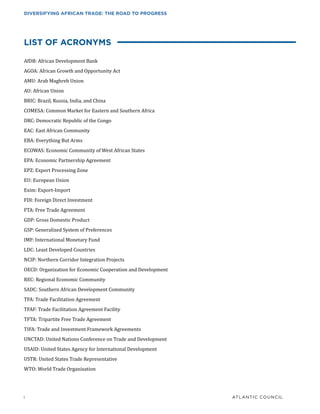
Petroleum
Minerals/Precious Stones
Metals
Textiles
Chemicals
Transportation Equipment
Other
2005 2006 2007 2008 2009 2010 2011 2012 2013 2014
174
266
322
433
306
408
485
473
416
281
Figure 3. Export Product Diversity (all of Africa, in millions of US dollars)
Source: World Bank, World Integrated Trade Solution Database, http://wits.worldbank.org. Author calculations.](https://image.slidesharecdn.com/835df0dc-f288-4336-9a71-f5a78fc18089-160115173239/85/Diversifying_African_Trade-13-320.jpg)


![ATLANTIC COUNCIL 17
DIVERSIFYING AFRICAN TRADE: THE ROAD TO PROGRESS
Multilateral Trade Programs
In addition to US and EU trade agreements with African
countries, additional attempts by the international
community to further integrate Africa into the global
economy are ongoing, and experts have long argued that
African countries have the most to gain from restructuring
the international trading system. Moreover, African
countries make up the World Trade Organization (WTO)’s
largest regional bloc, including forty-three countries with
voting rights.81
The WTO’s Fourth Ministerial Conference began in Doha,
Qatar, in 2001—and was dubbed the “development round”
for its attempt to negotiate more favorable trade policies
for LDCs. But the Doha round failed to reach an agreement.
During the 2013 Bali round, WTO members finished
negotiating a trade facilitation agreement, which will
expedite the movement of goods and better align customs
policies. The landmark agreement—the first successfully
negotiated by the WTO—promises to cut trade costs and
increase profits, for LDCs and developed economies alike.
In order for a member to ratify the agreement, the country
must first comply with customs and trade-efficiency
requirements as spelled out in the Trade Facilitation
Agreement (TFA); the agreement enters into force after
two-thirds of the WTO’s 160 members ratify it.82
The TFA represents a watershed moment for the WTO.
Particularly after the failure of past WTO rounds to come to a
consensus on similar agreements, many global powers have
recently opted for “super” bilateral agreements, such as the
Transatlantic Trade and Investment Partnership and Trans-
Pacific Partnership, which exclude many developing countries
from the conversation on global trade, and may push WTO
efforts to the background of international trade policy.
By requiring each member to comply with efficiency
measures, the agreement—once it is fully ratified and
implemented—is projected to increase global trade by more
than $1 trillion, and reduce trade costs for lower-income
countries by 14 percent.83
While there is no set deadline, it
is widely hoped that this majority can be achieved in 2016.
The TFA is unique in that it allows individual countries the
81 World Trade Organization, “Groups in the Negotiations,” https://www.
wto.org/english/tratop_e/dda_e/negotiating_groups_e.htm#grp002.
Notably, the following African countries are not WTO members: Algeria,
Comoros, Equatorial Guinea, Eritrea, Ethiopia, Liberia, Libya, São Tomé
and Príncipe, Somalia, South Sudan, and Sudan.
82 World Trade Organization, “Encouraging Signs on Acceptance of WTO’s
Trade Facilitation Agreement,” March 24, 2015, https://www.wto.org/
english/news_e/news15_e/fac_24mar15_e.htm; World Trade Organiza-
tion, “Azevêdo Welcomes European Union Ratification of Trade Facilita-
tion Agreement,” October 5, 2015, https://www.wto.org/english/news_e/
news15_e/fac_05oct15_e.htm.
83 World Trade Organization, Trade Facilitation Agreement: Easing the
Flow of Goods across Borders, May 18, 2015, http://allafrica.com/view/
resource/main/main/id/00091886.html.
flexibility to identify which provisions they can implement
immediately, which they can enact in the near future without
assistance, and which require assistance from the WTO.
The challenge, however, is the complex political ratification
process at the national level. As WTO Director-General
Roberto Azevêdo explained, “[The WTO TFA] is global
trade’s equivalent of the shift from dial-up Internet access
to broadband—and it will have a similar impact.”84
Thus
far, fifty WTO members—including Botswana, Mauritius,
Niger, and Togo from the African bloc—have ratified the
agreement.85
OBSTACLES TO DEEPENING
TRADE
African countries face a range of challenges that impede
increased trade flows. These challenges include geographic,
structural, and infrastructure barriers, as well as trade
inefficiencies and a broader lack of institutional capacity.
• Geographic challenges. High transport costs and
longer wait times will always be a disadvantage for
Africa’s landlocked countries, as their goods face longer,
more expensive journeys to reach their destination
markets. For example, it costs more for a cargo truck
to move a container from Djibouti to Ethiopia than to
send the same cargo from China to Djibouti.86
Regional
economic-integration efforts aim to mitigate some of
these difficulties.
• Structural challenges. Many neighboring African
countries have similar export profiles—a feature of
similar topography and climate—which makes exporting
84 “WTO’s TFA Can Have Positive Impact on Developing Countries,” World
Grain, October 27, 2015, http://www.world-grain.com/articles/news_
home/World_Grain_News/2015/10/WTOs_TFA_can_have_positive_imp.
aspx?ID=%7BD6532813-A0B1-4945-A484-3DDFEEC2512C%7D&cck=1.
85 Mike Godfrey, “50 Nations Have Ratified WTO’s Trade Facilitation
Pact,” Tax News, October 20, 2015, http://www.tax-news.com/news/50_
Nations_Have_Ratified_WTOs_Trade_Facilitation_Pact____69454.html. The
United States and the EU have also ratified.
86 “Oceans Ahoy!”, Economist, April 21, 2012, http://www.economist.
com/node/21553050.
EXPERTS HAVE LONG
ARGUED THAT AFRICAN
COUNTRIES HAVE THE
MOST TO GAIN FROM
RESTRUCTURING THE
INTERNATIONAL TRADING
SYSTEM.](https://image.slidesharecdn.com/835df0dc-f288-4336-9a71-f5a78fc18089-160115173239/85/Diversifying_African_Trade-22-320.jpg)


![20 ATLANTIC COUNCIL
DIVERSIFYING AFRICAN TRADE: THE ROAD TO PROGRESS
the political will and resources needed for integration,
including enhanced financial and technical support of
RECs.
To Address Structural Challenges
• Export Processing Zones (EPZs) are specialized
industrial zones that offer incentives, such as tax breaks,
to companies investing in manufacturing in the zone,
and are a potential avenue for creating competitive
export-oriented clusters. EPZs also offer a chance for
countries to strengthen their diversification efforts,
especially in the manufacturing sector. Particularly for
countries in which the economy has traditionally been
dependent on a small number of commodities, EPZs
offer incentives for investment in alternate industries.
In Asia, EPZs have been used extensively to attract
investment and build a robust export base. But despite
the creation of more than ninety African EPZs as of
2012,98
African EPZs have yet to deliver meaningful
development results. African governments should
critically assess the performance of EPZs to date, and
partner with and learn from Asian countries that have
successfully utilized EPZs to spur growth. Potential
partners might include the United Arab Emirates
and China, both of which have been global leaders in
creating profitable EPZs.
Policy predictability and regulatory certainty is a
particular challenge in most African countries. African
governments should ensure and maintain policy
consistency with partner companies on EPZs or
other bilateral trade deals. Foreign investors need to
have confidence, for example, that the terms of their
agreement with a host government (including, for
example, tax breaks or other financial incentives) will
be upheld in the coming years, or in the case of a change
of government. Moroccan success with specialized free
zones, particularly around Tangier, or Ethiopian success
with Chinese-built Special Economic Zones, may be
models to replicate.99
• African governments should ratify and implement
the WTO TFA, which will lower trade barriers for
developed and developing economies alike. But in
order to ratify the TFA, many African countries will
have to push the TFA requirements through their
legislative bodies, adding a layer of difficulty to the
already complex process. In 2014, the WTO announced
the formation of a TFA Facility (TFAF), designed to
98 African Center for Economic Transformation, “Africa’s Export Process-
ing Zones–It’s Time to Lift the Game,” August 17, 2012, http://acetforafri-
ca.org/whats-new/post/africas-export-processing-zones-its-time-to-lift-
the-game/.
99 Oxford Business Group, “Manufacturing Sector Boosts Moroccan
Export Revenue.”
provide trade facilitation-related assistance, capacity-
building, help finding sources of implementation
assistance, and “ensur[ance] that no WTO member
is left behind.”100
While the TFAF has just recently
become operational, African countries should seek its
support in preparation for implementation. The United
States and its European partners have also backed
international efforts to implement specific provisions of
the TFA: USAID and United States Trade Representative
(USTR)-led Global Alliance for Trade Facilitation, for
example, focuses on improving developing countries’
border management needed for TFA implementation.101
Within the WTO, African governments should also form
a working group on rules of origin in trade agreements
that seeks to capitalize on the success of trade programs
with liberal rules of origin (for example, AGOA’s success
in promoting garment manufacturing in Africa) and
harmonize the United States and EU programs for
African benefit.
To Address a Lack of Infrastructure
• African governments and international partners—
both public and private—should continue to invest in
African infrastructure, with a focus on the power sector.
According to a recent infrastructure report by the
Brookings Institution, external financing commitments
rose from $5 billion in 2003 to nearly $30 billion per
year in 2012102
—and this trend should continue.
Improved roads, bridges, ports, and communications
infrastructure will make African goods only more
competitive in the global market. Similarly, investment
in the power sector will make production and shipping
more reliable and cost-effective.
100 World Trade Organization, Trade Facilitation Agreement: Easing the
Flow of Goods across Borders.
101 Mission of the United States, Geneva, press release, “USAID An-
nounces Global Public-Private Trade Alliance,” July 1, 2015, https://
geneva.usmission.gov/2015/07/01/usaid-announces-global-public-pri-
vate-trade-alliance/.
102 Jeffrey Gutman, Amadou Sy, and Soumya Chattopadhyay, Financing
African Infrastructure: Can the World Deliver? (Washington, DC: Brookings,
March 2015), http://www.brookings.edu/~/media/Research/Files/
Reports/2015/03/financing-african-infrastructure-gutman-sy-chattopad-
hyay/AGIFinancingAfricanInfrastructure_FinalWebv2.pdf?la=en.
POLICY PREDICTABILITY
AND REGULATORY
CERTAINTY IS A
PARTICULAR CHALLENGE IN
MOST AFRICAN COUNTRIES.](https://image.slidesharecdn.com/835df0dc-f288-4336-9a71-f5a78fc18089-160115173239/85/Diversifying_African_Trade-25-320.jpg)


