Download as PDF, PPTX


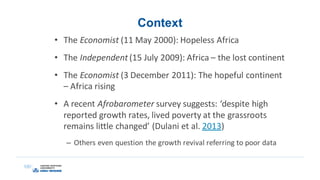

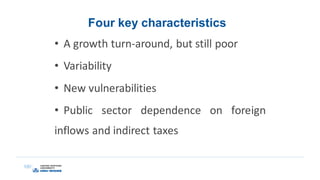
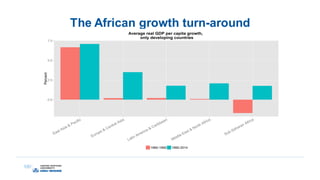
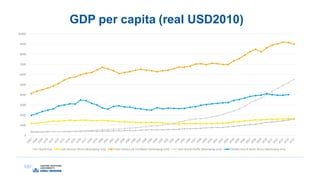
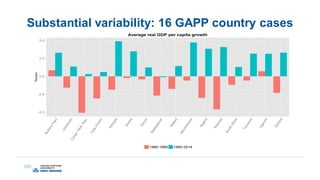
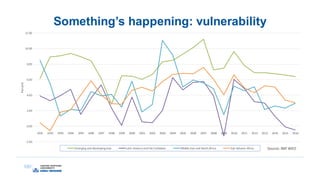


This document provides an overview and analysis of economic development in Africa. It discusses four key points: 1. Africa has experienced economic growth in recent decades but poverty remains widespread and there is substantial variability between countries. 2. The growth has made Africa more vulnerable to external economic conditions like commodity price fluctuations. 3. Africa faces structural challenges like a lack of economic transformation, high population growth, poor infrastructure, and weak human capital development. 4. Two large research projects - GAPP and L2C - examined the dynamics of growth, poverty, and industrialization in Africa in more depth at the country level.


