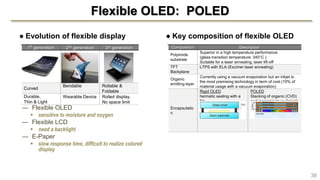
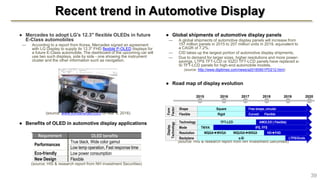
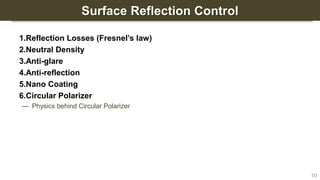
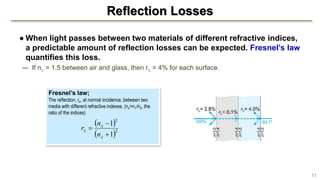
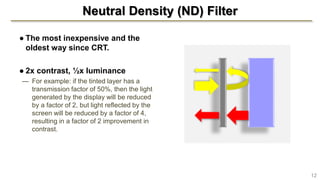
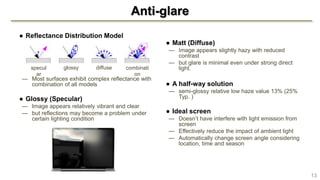
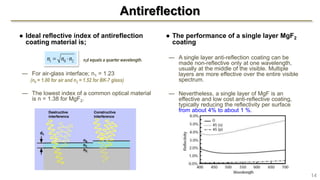
Sep. 15, 2016
Brian Kim, PhD
brian.kim.phd@gmail.com
Review of display
performance &
their physics
Contents
● Introduction & some physics
● Surface Reflection Control
1. Neutral Density
2. Anti-glare
3. Anti-reflection
4. Nano Coating
5. Circular Polarizer
● Backlight
1. Color Gamut of Backlight Technologies
2. Stack-up of TFT LCD
3. Analysis of Backlight Operation
4. Prism (BEF)
5. Reflective Polarizer: Dual Brightness
Enhancement Film
● Liquid Crystal
— LC Anisotropy
— Birefringence
— Viewing Angle
— What about AMOLED?
● Performance Measurement
— ISO 15008
— The effect of AR film on Ambient Contrast
— Ambient contrast of several displays
● What’s coming next?
— AMOLED vs. TFT-LCD
— LED in Apple
— AMOLED: Samsung vs. LG Display
— QLED (Quantum Dot LED)
— Flexible OLED: POLED
— Recent trend in Automotive Display
2
A Real-world Scenes vs. Digital Images
● Real-world scenes ≠ Digital images
— The restricted color gamut and even more constrained
luminance and contrast ranges
— Although tremendous progress can be observed in recent
years towards improving the quality of captured and
displayed digital images and video, the reproduction of
real world appearance is still a farfetched goal.
● High dynamic range imaging (HDRI)
— manipulate all colors and brightness levels captured by
a camera
— offer brighter and more colorful than their digital
reproductions, but also contain much higher contrast
 whites are whiter and blacks are blacker, therefore the image
seems to have more “depth".
 The range of colors have also been increased so even colors can
be more detailed.
Dynamic Range: The ratio between the max. and min. 3
An evolution of display system and color gamut
NTSC (1953)
REC 709 (1990)
sRGB (1996)
Adobe RGB
(1988)
DCI-P3
(2012)
The first official Color
Gamut Standard for the
beginning of US color
television broadcasting.
Too much saturated, not
realistic
2014 Sochi Winter Olympic
For printing industry by
Adobe system, 96% NTSC
17% larger than
sRGB/Rec709
For digital cinema
production by the Digital
Cinema Initiatives (DCI)
organization .
26% larger than
sRGB/Rec709
ITU Recommendation, the standards for
UHDTV (UHD 4K and UHD 8K) based on
NHK’s Super Hi-Vision
•Intended for RGB lasers
•Covers ~100% of Pointer’s Gamut
•2 dynamic ranges
LCD=0.05~1000nit, OLED: 0.0005~540 nit
99.9% of Pointer’s gamut
72% larger than sRGB/Rec709
2020 Tokyo Olympic
sRGB:PC standard by
IEC
Rec.709: HDTV standard
Same 3 primary color with
different curve
71% of NTSC
4http://www.nhk.or.jp/8k/index_e.html#
1941
NTSC standards are
set for B&W TV
1939 RCA presents TV at
New York World’s Fair
1948 Television in homes
gradually transitioned from black-and-
white to color television between 1953
and 1974.
1964 NHK begins
HDTV development
1999 Stations begin broadcasting
Digital TV and wide screen HDTV.
2009 Broadcast TV
in U.S. goes all
digital
1988 test HD TV broadcasting in Japan
2016 Rio Olympic
2018 Pyeongchang
Winter Olympic
2004 3 million HDTV
sets in homes.
1950 Korean War slows color TV progress
REC 2020
(2020)
UHD Phase 3
8K, 4K
HDR
120Hz
Rec 2020
10 bit / 12 bit /14 bit
Color Space
● Color gamut
— The horse shoe area
 Represents all the colors that human eye can see
— The Pointer’s gamut is
 The real surface colors can be seen by the human eye,
based on the research by Michael R. Pointer (1980).
— D65, Standard White Color
 The color of outdoor at noon with color temperature
close to 6500K
● CIE 1931 vs. CIE 1973
— CIE 1931
 Very non-uniform and distorted representation of
human eye perception
 Equal distance ≠ equal perceived color distance
— CIE 1973
 Perceptually uniform for human color vision
5
Perception of color by the human eye
Physical Physiological Psychological
6
Luminance vs. Brightness
● Luminance
— Measured amount of light in [cd/m2]
— Physical quantity
 the light energy weighted by the spectral sensitivity function of the
human visual system
 independent of the luminances of the surrounding objects
● Brightness
— Perceived amount of light (perceived luminance)
— Psychophysical quantity
 depends on luminance of the surround (lateral inhibition, contrast)
7
BrightnessLuminance 
Effect of colors on brightness?
● Which patch looks brighter ?
— The red and pink patches look by far the
brightest, while blue, green, and amber are
less bright. Dimmest of all is the green-
yellow patch, third from the left.
— Lights of these colors will behave in the
same way as these printed examples. Red
and pink lights will always look much
brighter to the eye than a green or yellow
light of the same luminance
● Helmholtz–Kohlrausch effect
— The impact of color saturation on perceived
brightness; the more saturated the colors,
the brighter they appear.
— Certain colors (green and yellow) do not
have significant effect, however, any hue of
colored lights still seem brighter than white
light that has the same luminance.
seven differently colored patches against a grey
background. (all patches are same lightness )
8
— The strength of the H-K
effect depends upon
color and the
saturation level, but it
can increase the
perceived brightness.
Contrast effect & Weber’s law
● The simultaneous contrast effect
— The perceived brightness depends on the
contrast.
— The perceived brightness of inner circle are
different due to a different background
intensity levels even they are identical.
— As the background gets darker, the
perceived brightness of the circles
increases.
● Weber’s law
— Human's ability to resolve two visual stimuli
with different intensities, L and L+ ∆L, is
determined by the ratio ∆L/L over a wide
intensity range.
— The higher L needs a larger ∆L for a target
to be detected rather than a small L.
 x,y axis can be either “Stimulus Intensity and
Sensation Intensity” or “Luminance and
Brightness”.
9
∆L/L=
constant (~0.01)
Surface Reflection Control
1.Reflection Losses (Fresnel’s law)
2.Neutral Density
3.Anti-glare
4.Anti-reflection
5.Nano Coating
6.Circular Polarizer
— Physics behind Circular Polarizer
10
Reflection Losses
● When light passes between two materials of different refractive indices,
a predictable amount of reflection losses can be expected. Fresnel’s law
quantifies this loss.
— If n = 1.5 between air and glass, then r = 4% for each surface.
Fresnel’s law;
The reflection, rλ, at normal incidence, between two
media with different refractive indexes. (nλ=n1/n2, the
ratio of the indices)
 
 2
2
1
1






n
n
r
11
Neutral Density (ND) Filter
12
● The most inexpensive and the
oldest way since CRT.
● 2x contrast, ½x luminance
— For example: if the tinted layer has a
transmission factor of 50%, then the light
generated by the display will be reduced
by a factor of 2, but light reflected by the
screen will be reduced by a factor of 4,
resulting in a factor of 2 improvement in
contrast.
Anti-glare
● Reflectance Distribution Model
— Most surfaces exhibit complex reflectance with
combination of all models
● Glossy (Specular)
— Image appears relatively vibrant and clear
— but reflections may become a problem under
certain lighting condition
● Matt (Diffuse)
— Image appears slightly hazy with reduced
contrast
— but glare is minimal even under strong direct
light.
● A half-way solution
— semi-glossy relative low haze value 13% (25%
Typ. )
● Ideal screen
— Doesn’t have interfere with light emission from
screen
— Effectively reduce the impact of ambient light
— Automatically change screen angle considering
location, time and season
13
specul
ar
glossy diffuse combinati
on
Antireflection
● Ideal reflective index of antireflection
coating material is;
— For air-glass interface; n1 = 1.23
(n0 = 1.00 for air and n2 = 1.52 for BK-7 glass)
— The lowest index of a common optical material
is n = 1.38 for MgF2.
● The performance of a single layer MgF2
coating
— A single layer anti-reflection coating can be
made non-reflective only at one wavelength,
usually at the middle of the visible. Multiple
layers are more effective over the entire visible
spectrum.
— Nevertheless, a single layer of MgF is an
effective and low cost anti-reflective coating,
typically reducing the reflectivity per surface
from about 4% to about 1 %.
201 nnn  nid equals a quarter wavelength.
Destructive
interference
Constructive
interference
n0
n1
n2
d1
14
Nano coating
● Nikon's Nano Crystal Coating
— This ultra-low refractive index film is called
"Nano Crystal Coat" as it comprises
particles which are as small as several
nanometers to 10-20 nm.
— The technology achieves extremely high
antireflection performance over a wide
wavelength range, exceeding the levels of
conventional antireflection coating.
● Canon's Moth eye structure
— Fresnel refractions occur at interfaces with a
sudden change in refractive index.
— A "smooth transition" with a Moth eye
structure reduce a reflection.
 the fraction of air around these structures
decreases gradually from the top of the tip to its
base, the effective RI changes gradually.
15
Circular Polarizer
● Stack-up
— A combination of a linear polarizer and a ¼
retardation film (quarter-wave plate)
● Function
— The optical oscillator forms a shape of
spiral, "circular polarization”
— Due to 180 phase shift at the reflecting
surface, the resulting linear polarized light
cannot pass the linear polarizer.
● Polarizer in OLED devices
— Theoretically, AMOLED is a self-emitting
diode, which does not require a polarizer.
— Enhance the contrast ratio by blocking the
reflected light from metal electrodes.
16
phase shift
http://www.cabrillo.edu/~jmccullough/Applets/Flash/Optics/CircPol.swf
Physics behind Circular Polarizer
● Phase change in reflection
— The reflected wave undergoes a 180
phase change when n1 < n2.
— There is no phase change when n1  n2.
 No contrast improvement with a circular
polarizer
● What happens with a partially
transmitted light?
— In general when a wave meets a
boundary between two materials it is
partial reflected and partially transmitted.
— What if the transmitted light is scattered
and depolarized?
17
n1  n2
180 phase change
n1  n2
No phase change
Specular reflection Scattering  Depolarization
Backlight
1.Color Gamut of Backlight Technologies
2.Stack-up of TFT LCD
3.Analytical Analysis of Backlight Operation
4.Prism (BEF)
5.Reflective Polarizer: Dual Brightness Enhancement Film
18
Color Gamut of Backlight Technologies
● Saturation level of primaries
— Band width of emission spectrums
● Coverage (color gamut)
— Assessment of Rec. 2020
Implementations
19
(source: QD Vision presentation, March 2016 Bay Area SID Conference)
Light Sources
FWHM
(Full Width Half Maximum)
Blue LED
based White
Y phosphor
Green: 85nm, Red: 56nm
(50~100nm)
R, G phosphor Same as above
Quantum Dots Green: 30nm, Red: 25nm
AMOLED
Phosphorescent: 30~70nm
Fluorescent: 80~100nm
RGB LED ~20nm
LASER 2~5nm
QD-LCD
● 3-different QD backlight technique ● Supply chain of QDs nano-material
20(source: DisplaySearch, Nanoco presentation)
ON-CHIP ON-EDGE ON-SURFACE
Installation of
QD
Supplier / OEM
Pacific Light
Technologies
QD Vision/ Sony's
Triluminous TVs.
Nanosys-3M
Nanoco
QD integration
QDs placed directly
within LED package,
which is coupled to light
guide
QDs placed between
LED package and light
guide
QDs placed in thin film,
covering entire display
surface
Operating temp
High (~ 150°C) moderate
(between that of on-
surface and on-chip)
near RT
Material usage low moderate high
Pros & Cons
•Most efficient
•High temperatures
•Sealing against oxygen
•Assembly issues
•Need additional room
in the device
•Ease of mass
production
•Easy to incorporate
into an existing device
same assembly
(source: NANOCO presentation data)
Cd-free
Cd-type
Cd-type
Exclusive
license
Stack-up of TFT LCD
21
Light
Enhancing
FilmBacklight
1st Polarizer
TFT Array
LC Material
Color
Filter
2nd Polarizer100%
55~60%
12~15%
5~8%
Waveguiding: the direction of an
incoming beam of polarized light will
follow the twist of director in traveling
through the LC layer.
(from: Optics of Liquid Crystal Displays [Pochi Yeh, Claire Gu])
The polarization axis of DBEF
needs to be same as that of the 1st
linear polarizer to maximize a
transmission efficiency.
Analysis of Backlight Operation
Light Guide
+ Diffuser
+ Prism
+ Reflective polarizer (DBEF)
1. Light Guide
— Rays from LED propagate through TIR light
guide and extracted toward display by the
scattering with textures.
2. Diffuser
— Align dispersion angle to upward with bigger
cone angle
— Randomizes the polarization state or light
direction
3. Prism (BEF)
— Collimate rays before wave guiding through
polarizer and LC molecules, and bounce back
rest of rays (color separation)
4. Recycling (DBEF)
— Transmit s-polarized rays and reflect
p-polarized rays for recycling
22
Prism (BEF: brightness enhancement film)
● The fundamental functions are collimation and recycling of randomized unpolarized rays.
● A full ray trace analysis of prism-up films is essential to understand its recycling
characteristics.
23•Prism angle:90, Prism pitch: 50m or less, Gain: single film=58%, crossed film=114%, Material: prism=acrylic resin, substrate=polyester, Thickness: 50~250m
Side lobe &
some loss
may result in light may be directed
into a desired viewing cone.
may result in light being
predominantly returned into the
backlight. For a Lambertian source,
approximately 46% of the light is
recycled
may result in light being redirected
into the undesirable ‘‘lobe’’ directions.
Collimation
(Refraction)
Recycling
(Double reflection)
● Reflection of light
— Like a multi-layered dielectric mirror, by properly
adjusting layer thickness to satisfy the Bragg
condition, a reflection band with high
reflectivity(greater than 95%) can be obtained. The
central peak wavelength is related to the product of
the thickness and refractive index of each layer.
● Recycling
— The reflected s-wave will hit the rough surface of
the diffuser and depolarized. Again at the DBEF, the
p-wave is transmitted and s-wave reflected back for
recycling..
Dual Brightness Enhancement Film (Reflective Polarizer)
● Transmission of light
— p-wave: The incident wave with its polarization
along the x-axis always encounters identical
refractive index values and can traverse the whole
system with high transmission.
— s-wave : In contrast, light polarized along the y-axis
has alternating high and low refractive indices
n1(1.64) and n2(1.88) resulting in multiple internal
reflections and interference effects that, in turn,
affect the overall reflection and transmission.
24
s-wave
Polarizer
Polarizer
TFTglass
Lightguide
Diffuse
r
Prism
DEBF
LCD: physics & performances
1.LC Anisotropy
2.Birefringence
3.Viewing Angle
4.What about AMOLED?
25
LC Anisotropy
● Shape of LC molecule
— Shape anisotropy: Length  Width
● Anisotropy
— Due to the uniaxial symmetry, the
dielectric constant and reflective
indies differ in value along the long axis
and the short axis.
— Dielectric anisotropy
 Dielectric constant difference
 Electrostatic energy
— Optical anisotropy
 Birefringence is defined by refractive index
difference (Birefringence =Double refraction)
26
Chemist’s View Physicist’s View oe  
EDU 
2
1 Where E is the electric field vector
and D is the displacement field vector
n1  n2 = n3
n1 = nparallel = nextraordinary
n2 = nperpendicular = nordinary
n1
  oe nnnceBirefringen 
— The angular dependent phase retardation of the LC
medium can be expressed as;
● Compensation with a retardation film
— A proper optical phase compensation films, an opposite
polarity birefringence film, can minimize the off-axis
leakage to cancel the residual LC phase retardation at
any oblique angles
Birefringence in anisotropic
27
● Phase retardation & Color Shift
— An incoming light is broken up into two components
when it travels through a birefringent material.
— Because two components travel at different velocities,
one ray becomes retarded relative to the other and
diverges.
— When the rays are recombined as they exit the
birefringent material, the polarization state has been
changed because of this phase difference.
 A superimposed waveform is different from an original waveform
v
c
n 
c : the speed of light in a vacuum,
v : the speed of light in that
substance
n : the index of refraction.
 


 effdn
ThicknessnceBirefringe
)(2
),(


n: birefringence
d: thickness of samples
0)()(  filmeff dndn
Color shift of LG 12.3” IPS FHD (1920 X RGB X 720)
From Top Left From Top Right
Viewing Angle
● Alignment of LC
— A typical IPS-LCD structure, where the
LC molecules are aligned
homogeneously and the striped
electrodes are lying in the same
plane, shows:
 Same polar component of LC director at any
states; “ON”, “OFF” and mid-tones
 Small nd along off-axis change
● Display mode
— IPS mode
 Steady value through wide off-set angle,
moderate value
— VA mode
 High CR at surface normal
 Steep decrease with increasing viewing angle
28
VA
IPS

VAIPS nn 
-80 -60 -40 -20 0 20 40 60 80
1k
10k
100k
DarkroomContrastRatio
Off-axis angle
VA
IPS
AMOLED
What about AMOLED?
● Viewing angle & contrast ratio
Extremely high and flat
● What about ambient performance?
29
e to the power
of -5 to -6
Max. Luminance Min. Luminance
Contrast Ratio
Performance Measurement
1.ISO 15008
2.The effect of AR film on Ambient Contrast
3.Ambient contrast of several displays
30
ISO 15008 (ambient contrast measurement condition)
● Minimum contrast
— 5:1 for night conditions
— 3:1 for day conditions
— 2:1 for sunlight conditions
 May not enough considering
Minimum Perceptible Color
Difference
31
1 photometer
2 display
3 Lambertian diffuser
4 light source (3 klx at
display)
1 photometer
2 display
3 light source (45 klx at display)
- 55° from right horizontal.
- 30° left horizontal.
- Upright position (shift relative to upright
position is possible for measurement
purposes).
reflectionroomdark
reflectionroomdark
LL
LL
RatioContrast





min@
max@
Set up for Sunlight MeasurementSet up for Daylight Measurement
The effect of AR film on Ambient Contrast
● Contrast improvement
— ~ 50% @  10,000 lux
— Contributed by a reduced reflection at a minimum luminance state
32
~50% Contrast ratio improvement using expensive AR treatment. However, a selection of display mode is more effective. See next slide!
Ambient contrast of several displays
● The sunlight readability is a critical display
performance for outdoor applications.
● Ambient light degrades image qualities
— Contrast ratio
— Grey level (low grey levels merge)
— Color (shrink of gamut)
● Case study from projector
— Rule of thumb for in-room contrast ratios
● Measurement result & Discussion
— Transfective>IPS-PRO>IPS>AMOLED>VA
— The high darkroom contrast ratio doesn’t bring up the high ambient
contrast ratio
— The selection of display mode / type is more important than the first
surface treatment.
● Possible root causes in contrast reduction
— Scattering in the inner layers
— Reflections formed from thin film multilayer: constructive interference
— Resonance from micro cavities
33
(From Christiedigital)
The AMOLED data was taken from Galaxy Note 2 without a circular polarizer. The CP
can improve ambient contrast ratio but reduces over 50% of luminance.
What’s coming next?
34
Quantum Dots
AMOLED vs. TFT-LCD
● Comparison of performances ● Comparison of specifications
35
TFT-LCD(1) AMOLED(2)
Resolution 800xRGB x 480 1280xRGB x 800
LC Mode Normally Black Normally Black
Backplane a Si TFT Low Temp. P-Si
Size 7'' 7.67”
Format 15:9 16:10
Pixel pitch 0,1905 x 0,1905 mm 0,129 x 0,129 mm
Contrast 1500:1 typ. 3400:1 min.
Luminance 1220 cd/m² typ 250cd/m2
Uniformity 80% typ. 80% typ.
NTSC Ratio 70% typ. 98% typ.
1. LCD-TFT: the best performances from AUO, JDI, SMD and TIANMA 7” TFT-LCD
2. AMOLED: SMD AMOLED (Model: AMS767KC04-0)
(Source: Korean Stock Trading Company)
TFT-LCD AMOLED
Thickness best is 0.8 mm Thinner, best is 0.05 mm
Viewing Angle Narrower, depends on LC mode Up to 180°
Contrast Ratio Lower Higher
Sunlight
Readability
Depend on LC mode & surface
treatment
?
Color Gamut
~70%, up to ~100% NTSC
(depend on backlight technology)
>100% NTSC (top emission),
~70% NTSC (bottom)
Color
Reproduction
gamut changes with viewing
angle and gray level
gamut independent of view angle
Response Time Slower, milliseconds Faster,(nsec), No motion blur,
Power
Consumption
Lower with full white with max.
luminance
Lower at typical video content if
~30% of pixels are on
Lifetime Much longer, above 50K hour Shorter, up to 30K hrs, improving
Material Cost Expensive buy parts Lower
Capital
Investment
Lower Higher
Production Cost
Cheaper than AMOLED Expensive; low yield, potential to
be low cost
Backplane
Driving Voltage Driving (1~2 TFT/pixel) Current driving (2~5 TFT/pixel)
TFT
a-Si Need a higher response TFT:
LTPS or Oxide (IGZO)
Passivation SiN (Silicon Nitride) SiOx (Silicon Oxide)*
Color
Production
Backlight + LC + Color Filter Electroluminescence with organic
emitting material
Encapsulation Epoxy sealing Hermetic sealing
*A leakage current is serious in a current driven device. A denser oxide layer reduce a leakage current .
(Source: Multiple sources, DisplaySearch OLED Technology Report)
LED in Apple
● Apple has been developing micro-LEDs after an acquisition of micro-LED developer
LuxVue in 2014.
● Micro-LED displays are composed of arrays of blue gallium nitride LEDs. It is more
efficient than an OLED display (as LEDs are currently more efficient than OLEDs).
— The main advantages that micro-LED displays have would be in improved color gamut, higher resolution,
brightness and power efficiency.
— In addition, Micro-LED displays can be thinner and lighter. It also does not suffer from the shorter
lifetimes of OLED
● Apple may switch to micro-LED displays for the Apple Watch in the second half of
2017 at the earliest, moving away from the current OLED technology.
36a micro-LED display fabricated at the Hong Kong University of Science and Technology
AMOLED: Samsung vs. LG Display
37
Requirement Samsung Display L G Display
Stack-up
Emitting Layer
Side-by-side deposition using a fine
metal mask
•High efficiency
•No color filter / separate RBG
•Mask sagging issue with a large size
screen: limited scalability, low yield
•Material utilization efficiency
•Differential aging
W, R, G, B Tandem + Color Filter (from
Kodak,$100M/2009)
•Affordable for mass production
(scalable, simple / fewer steps)
• Low efficiency due to CF
•Color gamut a function of white
spectrum
•Cost of color filter
Backplane LTPS Oxide process
Available Product Smart phone TV
(Source: update a presentation from DisplaySearch OLED Technology Report )
ITOHIL
Cathode
EIL
ETL
R G B
HTL
HIL
Cathode
B
Y (R + G)
HTL
BGR
EIL
ETL
Flexible OLED: POLED
● Evolution of flexible display
— Flexible OLED
 sensitive to moisture and oxygen
— Flexible LCD
 need a backlight
— E-Paper
 slow response time, difficult to realize colored
display
● Key composition of flexible OLED
38
1st
generation 2nd generation 3rd generation
Curved
Bendable Rollable &
Foldable
Durable,
Thin & Light
Wearable Device Rolled display,
No space limit
Composition Description
Polyimide
substrate
Superior in a high temperature performance
(glass transition temperature: 340C )
Suitable for a laser annealing, laser lift-off
TFT
Backplane
LTPS with ELA (Excimer laser annealing)
Organic
emitting layer
Currently using a vacuum evaporation but an inkjet is
the most premising technology in term of cost (10% of
material usage with a vacuum evaporation)
Encapsulatio
n
Rigid OLED
hermetic sealing with a
frit
POLED
Stacking of organic (CVD)
and inorganic layer (Inkjet)
Recent trend in Automotive Display
● Mercedes to adopt LG's 12.3" flexible OLEDs in future
E-Class automobiles
— According to a report from Korea, Mercedes signed an agreement
with LG Display to supply its 12.3" FHD flexible P-OLED displays for
a future E-Class automobile. The dashboard of the upcoming car will
use two such displays, side by side - one showing the instrument
cluster and the other information such as navigation.
(source: www.koreaherald.com on Mar 9, 2016)
● Benefits of OLED in automotive display applications
(source: HIS & research report from NH investment Securities)
● Global shipments of automotive display panels
— A global shipments of automotive display panels will increase from
157 million panels in 2015 to 207 million units in 2019, equivalent to
a CAGR of 7.2%.
— CID takes up the largest portion of automotive display shipments.
— Due to demand for larger sizes, higher resolutions and more power-
savings, LTPS TFT-LCD or IGZO TFT-LCD panels have replaced a-
Si TFT-LCD panels for high-end automobile models.
(source: http://www.digitimes.com/news/a20160901PD212.html)
● Road map of display evolution
(source: HIS & research report from NH investment Securities)
39
Requirement OLED benefits
Performances
True black, Wide color gamut
Low temp operation, Fast response time
Eco-friendly Low power consumption
New Design Flexible
2015 2016 2017 2018 2019 2020
Free shape, circularSquare
Rigid Curved Flexible
TFT-LCD AMOLED ( Flexible)
TN/VA IPS, FFS
WQGAWVGA WQUGAWXGA HDFHD
s-Si LTPS/Oxide
Shape
Flexible
Form
Factor
Display
Technology
Technology
Mode
Resolution
Backplane
40
Thank you!
Discussion and Questions
 to brian.kim.phd@gmail.com

Display performance and their physics

  • 1.
    Sep. 15, 2016 BrianKim, PhD brian.kim.phd@gmail.com Review of display performance & their physics
  • 2.
    Contents ● Introduction &some physics ● Surface Reflection Control 1. Neutral Density 2. Anti-glare 3. Anti-reflection 4. Nano Coating 5. Circular Polarizer ● Backlight 1. Color Gamut of Backlight Technologies 2. Stack-up of TFT LCD 3. Analysis of Backlight Operation 4. Prism (BEF) 5. Reflective Polarizer: Dual Brightness Enhancement Film ● Liquid Crystal — LC Anisotropy — Birefringence — Viewing Angle — What about AMOLED? ● Performance Measurement — ISO 15008 — The effect of AR film on Ambient Contrast — Ambient contrast of several displays ● What’s coming next? — AMOLED vs. TFT-LCD — LED in Apple — AMOLED: Samsung vs. LG Display — QLED (Quantum Dot LED) — Flexible OLED: POLED — Recent trend in Automotive Display 2
  • 3.
    A Real-world Scenesvs. Digital Images ● Real-world scenes ≠ Digital images — The restricted color gamut and even more constrained luminance and contrast ranges — Although tremendous progress can be observed in recent years towards improving the quality of captured and displayed digital images and video, the reproduction of real world appearance is still a farfetched goal. ● High dynamic range imaging (HDRI) — manipulate all colors and brightness levels captured by a camera — offer brighter and more colorful than their digital reproductions, but also contain much higher contrast  whites are whiter and blacks are blacker, therefore the image seems to have more “depth".  The range of colors have also been increased so even colors can be more detailed. Dynamic Range: The ratio between the max. and min. 3
  • 4.
    An evolution ofdisplay system and color gamut NTSC (1953) REC 709 (1990) sRGB (1996) Adobe RGB (1988) DCI-P3 (2012) The first official Color Gamut Standard for the beginning of US color television broadcasting. Too much saturated, not realistic 2014 Sochi Winter Olympic For printing industry by Adobe system, 96% NTSC 17% larger than sRGB/Rec709 For digital cinema production by the Digital Cinema Initiatives (DCI) organization . 26% larger than sRGB/Rec709 ITU Recommendation, the standards for UHDTV (UHD 4K and UHD 8K) based on NHK’s Super Hi-Vision •Intended for RGB lasers •Covers ~100% of Pointer’s Gamut •2 dynamic ranges LCD=0.05~1000nit, OLED: 0.0005~540 nit 99.9% of Pointer’s gamut 72% larger than sRGB/Rec709 2020 Tokyo Olympic sRGB:PC standard by IEC Rec.709: HDTV standard Same 3 primary color with different curve 71% of NTSC 4http://www.nhk.or.jp/8k/index_e.html# 1941 NTSC standards are set for B&W TV 1939 RCA presents TV at New York World’s Fair 1948 Television in homes gradually transitioned from black-and- white to color television between 1953 and 1974. 1964 NHK begins HDTV development 1999 Stations begin broadcasting Digital TV and wide screen HDTV. 2009 Broadcast TV in U.S. goes all digital 1988 test HD TV broadcasting in Japan 2016 Rio Olympic 2018 Pyeongchang Winter Olympic 2004 3 million HDTV sets in homes. 1950 Korean War slows color TV progress REC 2020 (2020) UHD Phase 3 8K, 4K HDR 120Hz Rec 2020 10 bit / 12 bit /14 bit
  • 5.
    Color Space ● Colorgamut — The horse shoe area  Represents all the colors that human eye can see — The Pointer’s gamut is  The real surface colors can be seen by the human eye, based on the research by Michael R. Pointer (1980). — D65, Standard White Color  The color of outdoor at noon with color temperature close to 6500K ● CIE 1931 vs. CIE 1973 — CIE 1931  Very non-uniform and distorted representation of human eye perception  Equal distance ≠ equal perceived color distance — CIE 1973  Perceptually uniform for human color vision 5
  • 6.
    Perception of colorby the human eye Physical Physiological Psychological 6
  • 7.
    Luminance vs. Brightness ●Luminance — Measured amount of light in [cd/m2] — Physical quantity  the light energy weighted by the spectral sensitivity function of the human visual system  independent of the luminances of the surrounding objects ● Brightness — Perceived amount of light (perceived luminance) — Psychophysical quantity  depends on luminance of the surround (lateral inhibition, contrast) 7 BrightnessLuminance 
  • 8.
    Effect of colorson brightness? ● Which patch looks brighter ? — The red and pink patches look by far the brightest, while blue, green, and amber are less bright. Dimmest of all is the green- yellow patch, third from the left. — Lights of these colors will behave in the same way as these printed examples. Red and pink lights will always look much brighter to the eye than a green or yellow light of the same luminance ● Helmholtz–Kohlrausch effect — The impact of color saturation on perceived brightness; the more saturated the colors, the brighter they appear. — Certain colors (green and yellow) do not have significant effect, however, any hue of colored lights still seem brighter than white light that has the same luminance. seven differently colored patches against a grey background. (all patches are same lightness ) 8 — The strength of the H-K effect depends upon color and the saturation level, but it can increase the perceived brightness.
  • 9.
    Contrast effect &Weber’s law ● The simultaneous contrast effect — The perceived brightness depends on the contrast. — The perceived brightness of inner circle are different due to a different background intensity levels even they are identical. — As the background gets darker, the perceived brightness of the circles increases. ● Weber’s law — Human's ability to resolve two visual stimuli with different intensities, L and L+ ∆L, is determined by the ratio ∆L/L over a wide intensity range. — The higher L needs a larger ∆L for a target to be detected rather than a small L.  x,y axis can be either “Stimulus Intensity and Sensation Intensity” or “Luminance and Brightness”. 9 ∆L/L= constant (~0.01)
  • 10.
    Surface Reflection Control 1.ReflectionLosses (Fresnel’s law) 2.Neutral Density 3.Anti-glare 4.Anti-reflection 5.Nano Coating 6.Circular Polarizer — Physics behind Circular Polarizer 10
  • 11.
    Reflection Losses ● Whenlight passes between two materials of different refractive indices, a predictable amount of reflection losses can be expected. Fresnel’s law quantifies this loss. — If n = 1.5 between air and glass, then r = 4% for each surface. Fresnel’s law; The reflection, rλ, at normal incidence, between two media with different refractive indexes. (nλ=n1/n2, the ratio of the indices)    2 2 1 1       n n r 11
  • 12.
    Neutral Density (ND)Filter 12 ● The most inexpensive and the oldest way since CRT. ● 2x contrast, ½x luminance — For example: if the tinted layer has a transmission factor of 50%, then the light generated by the display will be reduced by a factor of 2, but light reflected by the screen will be reduced by a factor of 4, resulting in a factor of 2 improvement in contrast.
  • 13.
    Anti-glare ● Reflectance DistributionModel — Most surfaces exhibit complex reflectance with combination of all models ● Glossy (Specular) — Image appears relatively vibrant and clear — but reflections may become a problem under certain lighting condition ● Matt (Diffuse) — Image appears slightly hazy with reduced contrast — but glare is minimal even under strong direct light. ● A half-way solution — semi-glossy relative low haze value 13% (25% Typ. ) ● Ideal screen — Doesn’t have interfere with light emission from screen — Effectively reduce the impact of ambient light — Automatically change screen angle considering location, time and season 13 specul ar glossy diffuse combinati on
  • 14.
    Antireflection ● Ideal reflectiveindex of antireflection coating material is; — For air-glass interface; n1 = 1.23 (n0 = 1.00 for air and n2 = 1.52 for BK-7 glass) — The lowest index of a common optical material is n = 1.38 for MgF2. ● The performance of a single layer MgF2 coating — A single layer anti-reflection coating can be made non-reflective only at one wavelength, usually at the middle of the visible. Multiple layers are more effective over the entire visible spectrum. — Nevertheless, a single layer of MgF is an effective and low cost anti-reflective coating, typically reducing the reflectivity per surface from about 4% to about 1 %. 201 nnn  nid equals a quarter wavelength. Destructive interference Constructive interference n0 n1 n2 d1 14
  • 15.
    Nano coating ● Nikon'sNano Crystal Coating — This ultra-low refractive index film is called "Nano Crystal Coat" as it comprises particles which are as small as several nanometers to 10-20 nm. — The technology achieves extremely high antireflection performance over a wide wavelength range, exceeding the levels of conventional antireflection coating. ● Canon's Moth eye structure — Fresnel refractions occur at interfaces with a sudden change in refractive index. — A "smooth transition" with a Moth eye structure reduce a reflection.  the fraction of air around these structures decreases gradually from the top of the tip to its base, the effective RI changes gradually. 15
  • 16.
    Circular Polarizer ● Stack-up —A combination of a linear polarizer and a ¼ retardation film (quarter-wave plate) ● Function — The optical oscillator forms a shape of spiral, "circular polarization” — Due to 180 phase shift at the reflecting surface, the resulting linear polarized light cannot pass the linear polarizer. ● Polarizer in OLED devices — Theoretically, AMOLED is a self-emitting diode, which does not require a polarizer. — Enhance the contrast ratio by blocking the reflected light from metal electrodes. 16 phase shift http://www.cabrillo.edu/~jmccullough/Applets/Flash/Optics/CircPol.swf
  • 17.
    Physics behind CircularPolarizer ● Phase change in reflection — The reflected wave undergoes a 180 phase change when n1 < n2. — There is no phase change when n1  n2.  No contrast improvement with a circular polarizer ● What happens with a partially transmitted light? — In general when a wave meets a boundary between two materials it is partial reflected and partially transmitted. — What if the transmitted light is scattered and depolarized? 17 n1  n2 180 phase change n1  n2 No phase change Specular reflection Scattering  Depolarization
  • 18.
    Backlight 1.Color Gamut ofBacklight Technologies 2.Stack-up of TFT LCD 3.Analytical Analysis of Backlight Operation 4.Prism (BEF) 5.Reflective Polarizer: Dual Brightness Enhancement Film 18
  • 19.
    Color Gamut ofBacklight Technologies ● Saturation level of primaries — Band width of emission spectrums ● Coverage (color gamut) — Assessment of Rec. 2020 Implementations 19 (source: QD Vision presentation, March 2016 Bay Area SID Conference) Light Sources FWHM (Full Width Half Maximum) Blue LED based White Y phosphor Green: 85nm, Red: 56nm (50~100nm) R, G phosphor Same as above Quantum Dots Green: 30nm, Red: 25nm AMOLED Phosphorescent: 30~70nm Fluorescent: 80~100nm RGB LED ~20nm LASER 2~5nm
  • 20.
    QD-LCD ● 3-different QDbacklight technique ● Supply chain of QDs nano-material 20(source: DisplaySearch, Nanoco presentation) ON-CHIP ON-EDGE ON-SURFACE Installation of QD Supplier / OEM Pacific Light Technologies QD Vision/ Sony's Triluminous TVs. Nanosys-3M Nanoco QD integration QDs placed directly within LED package, which is coupled to light guide QDs placed between LED package and light guide QDs placed in thin film, covering entire display surface Operating temp High (~ 150°C) moderate (between that of on- surface and on-chip) near RT Material usage low moderate high Pros & Cons •Most efficient •High temperatures •Sealing against oxygen •Assembly issues •Need additional room in the device •Ease of mass production •Easy to incorporate into an existing device same assembly (source: NANOCO presentation data) Cd-free Cd-type Cd-type Exclusive license
  • 21.
    Stack-up of TFTLCD 21 Light Enhancing FilmBacklight 1st Polarizer TFT Array LC Material Color Filter 2nd Polarizer100% 55~60% 12~15% 5~8% Waveguiding: the direction of an incoming beam of polarized light will follow the twist of director in traveling through the LC layer. (from: Optics of Liquid Crystal Displays [Pochi Yeh, Claire Gu]) The polarization axis of DBEF needs to be same as that of the 1st linear polarizer to maximize a transmission efficiency.
  • 22.
    Analysis of BacklightOperation Light Guide + Diffuser + Prism + Reflective polarizer (DBEF) 1. Light Guide — Rays from LED propagate through TIR light guide and extracted toward display by the scattering with textures. 2. Diffuser — Align dispersion angle to upward with bigger cone angle — Randomizes the polarization state or light direction 3. Prism (BEF) — Collimate rays before wave guiding through polarizer and LC molecules, and bounce back rest of rays (color separation) 4. Recycling (DBEF) — Transmit s-polarized rays and reflect p-polarized rays for recycling 22
  • 23.
    Prism (BEF: brightnessenhancement film) ● The fundamental functions are collimation and recycling of randomized unpolarized rays. ● A full ray trace analysis of prism-up films is essential to understand its recycling characteristics. 23•Prism angle:90, Prism pitch: 50m or less, Gain: single film=58%, crossed film=114%, Material: prism=acrylic resin, substrate=polyester, Thickness: 50~250m Side lobe & some loss may result in light may be directed into a desired viewing cone. may result in light being predominantly returned into the backlight. For a Lambertian source, approximately 46% of the light is recycled may result in light being redirected into the undesirable ‘‘lobe’’ directions. Collimation (Refraction) Recycling (Double reflection)
  • 24.
    ● Reflection oflight — Like a multi-layered dielectric mirror, by properly adjusting layer thickness to satisfy the Bragg condition, a reflection band with high reflectivity(greater than 95%) can be obtained. The central peak wavelength is related to the product of the thickness and refractive index of each layer. ● Recycling — The reflected s-wave will hit the rough surface of the diffuser and depolarized. Again at the DBEF, the p-wave is transmitted and s-wave reflected back for recycling.. Dual Brightness Enhancement Film (Reflective Polarizer) ● Transmission of light — p-wave: The incident wave with its polarization along the x-axis always encounters identical refractive index values and can traverse the whole system with high transmission. — s-wave : In contrast, light polarized along the y-axis has alternating high and low refractive indices n1(1.64) and n2(1.88) resulting in multiple internal reflections and interference effects that, in turn, affect the overall reflection and transmission. 24 s-wave Polarizer Polarizer TFTglass Lightguide Diffuse r Prism DEBF
  • 25.
    LCD: physics &performances 1.LC Anisotropy 2.Birefringence 3.Viewing Angle 4.What about AMOLED? 25
  • 26.
    LC Anisotropy ● Shapeof LC molecule — Shape anisotropy: Length  Width ● Anisotropy — Due to the uniaxial symmetry, the dielectric constant and reflective indies differ in value along the long axis and the short axis. — Dielectric anisotropy  Dielectric constant difference  Electrostatic energy — Optical anisotropy  Birefringence is defined by refractive index difference (Birefringence =Double refraction) 26 Chemist’s View Physicist’s View oe   EDU  2 1 Where E is the electric field vector and D is the displacement field vector n1  n2 = n3 n1 = nparallel = nextraordinary n2 = nperpendicular = nordinary n1   oe nnnceBirefringen 
  • 27.
    — The angulardependent phase retardation of the LC medium can be expressed as; ● Compensation with a retardation film — A proper optical phase compensation films, an opposite polarity birefringence film, can minimize the off-axis leakage to cancel the residual LC phase retardation at any oblique angles Birefringence in anisotropic 27 ● Phase retardation & Color Shift — An incoming light is broken up into two components when it travels through a birefringent material. — Because two components travel at different velocities, one ray becomes retarded relative to the other and diverges. — When the rays are recombined as they exit the birefringent material, the polarization state has been changed because of this phase difference.  A superimposed waveform is different from an original waveform v c n  c : the speed of light in a vacuum, v : the speed of light in that substance n : the index of refraction.      effdn ThicknessnceBirefringe )(2 ),(   n: birefringence d: thickness of samples 0)()(  filmeff dndn Color shift of LG 12.3” IPS FHD (1920 X RGB X 720) From Top Left From Top Right
  • 28.
    Viewing Angle ● Alignmentof LC — A typical IPS-LCD structure, where the LC molecules are aligned homogeneously and the striped electrodes are lying in the same plane, shows:  Same polar component of LC director at any states; “ON”, “OFF” and mid-tones  Small nd along off-axis change ● Display mode — IPS mode  Steady value through wide off-set angle, moderate value — VA mode  High CR at surface normal  Steep decrease with increasing viewing angle 28 VA IPS  VAIPS nn 
  • 29.
    -80 -60 -40-20 0 20 40 60 80 1k 10k 100k DarkroomContrastRatio Off-axis angle VA IPS AMOLED What about AMOLED? ● Viewing angle & contrast ratio Extremely high and flat ● What about ambient performance? 29 e to the power of -5 to -6 Max. Luminance Min. Luminance Contrast Ratio
  • 30.
    Performance Measurement 1.ISO 15008 2.Theeffect of AR film on Ambient Contrast 3.Ambient contrast of several displays 30
  • 31.
    ISO 15008 (ambientcontrast measurement condition) ● Minimum contrast — 5:1 for night conditions — 3:1 for day conditions — 2:1 for sunlight conditions  May not enough considering Minimum Perceptible Color Difference 31 1 photometer 2 display 3 Lambertian diffuser 4 light source (3 klx at display) 1 photometer 2 display 3 light source (45 klx at display) - 55° from right horizontal. - 30° left horizontal. - Upright position (shift relative to upright position is possible for measurement purposes). reflectionroomdark reflectionroomdark LL LL RatioContrast      min@ max@ Set up for Sunlight MeasurementSet up for Daylight Measurement
  • 32.
    The effect ofAR film on Ambient Contrast ● Contrast improvement — ~ 50% @  10,000 lux — Contributed by a reduced reflection at a minimum luminance state 32 ~50% Contrast ratio improvement using expensive AR treatment. However, a selection of display mode is more effective. See next slide!
  • 33.
    Ambient contrast ofseveral displays ● The sunlight readability is a critical display performance for outdoor applications. ● Ambient light degrades image qualities — Contrast ratio — Grey level (low grey levels merge) — Color (shrink of gamut) ● Case study from projector — Rule of thumb for in-room contrast ratios ● Measurement result & Discussion — Transfective>IPS-PRO>IPS>AMOLED>VA — The high darkroom contrast ratio doesn’t bring up the high ambient contrast ratio — The selection of display mode / type is more important than the first surface treatment. ● Possible root causes in contrast reduction — Scattering in the inner layers — Reflections formed from thin film multilayer: constructive interference — Resonance from micro cavities 33 (From Christiedigital) The AMOLED data was taken from Galaxy Note 2 without a circular polarizer. The CP can improve ambient contrast ratio but reduces over 50% of luminance.
  • 34.
  • 35.
    AMOLED vs. TFT-LCD ●Comparison of performances ● Comparison of specifications 35 TFT-LCD(1) AMOLED(2) Resolution 800xRGB x 480 1280xRGB x 800 LC Mode Normally Black Normally Black Backplane a Si TFT Low Temp. P-Si Size 7'' 7.67” Format 15:9 16:10 Pixel pitch 0,1905 x 0,1905 mm 0,129 x 0,129 mm Contrast 1500:1 typ. 3400:1 min. Luminance 1220 cd/m² typ 250cd/m2 Uniformity 80% typ. 80% typ. NTSC Ratio 70% typ. 98% typ. 1. LCD-TFT: the best performances from AUO, JDI, SMD and TIANMA 7” TFT-LCD 2. AMOLED: SMD AMOLED (Model: AMS767KC04-0) (Source: Korean Stock Trading Company) TFT-LCD AMOLED Thickness best is 0.8 mm Thinner, best is 0.05 mm Viewing Angle Narrower, depends on LC mode Up to 180° Contrast Ratio Lower Higher Sunlight Readability Depend on LC mode & surface treatment ? Color Gamut ~70%, up to ~100% NTSC (depend on backlight technology) >100% NTSC (top emission), ~70% NTSC (bottom) Color Reproduction gamut changes with viewing angle and gray level gamut independent of view angle Response Time Slower, milliseconds Faster,(nsec), No motion blur, Power Consumption Lower with full white with max. luminance Lower at typical video content if ~30% of pixels are on Lifetime Much longer, above 50K hour Shorter, up to 30K hrs, improving Material Cost Expensive buy parts Lower Capital Investment Lower Higher Production Cost Cheaper than AMOLED Expensive; low yield, potential to be low cost Backplane Driving Voltage Driving (1~2 TFT/pixel) Current driving (2~5 TFT/pixel) TFT a-Si Need a higher response TFT: LTPS or Oxide (IGZO) Passivation SiN (Silicon Nitride) SiOx (Silicon Oxide)* Color Production Backlight + LC + Color Filter Electroluminescence with organic emitting material Encapsulation Epoxy sealing Hermetic sealing *A leakage current is serious in a current driven device. A denser oxide layer reduce a leakage current . (Source: Multiple sources, DisplaySearch OLED Technology Report)
  • 36.
    LED in Apple ●Apple has been developing micro-LEDs after an acquisition of micro-LED developer LuxVue in 2014. ● Micro-LED displays are composed of arrays of blue gallium nitride LEDs. It is more efficient than an OLED display (as LEDs are currently more efficient than OLEDs). — The main advantages that micro-LED displays have would be in improved color gamut, higher resolution, brightness and power efficiency. — In addition, Micro-LED displays can be thinner and lighter. It also does not suffer from the shorter lifetimes of OLED ● Apple may switch to micro-LED displays for the Apple Watch in the second half of 2017 at the earliest, moving away from the current OLED technology. 36a micro-LED display fabricated at the Hong Kong University of Science and Technology
  • 37.
    AMOLED: Samsung vs.LG Display 37 Requirement Samsung Display L G Display Stack-up Emitting Layer Side-by-side deposition using a fine metal mask •High efficiency •No color filter / separate RBG •Mask sagging issue with a large size screen: limited scalability, low yield •Material utilization efficiency •Differential aging W, R, G, B Tandem + Color Filter (from Kodak,$100M/2009) •Affordable for mass production (scalable, simple / fewer steps) • Low efficiency due to CF •Color gamut a function of white spectrum •Cost of color filter Backplane LTPS Oxide process Available Product Smart phone TV (Source: update a presentation from DisplaySearch OLED Technology Report ) ITOHIL Cathode EIL ETL R G B HTL HIL Cathode B Y (R + G) HTL BGR EIL ETL
  • 38.
    Flexible OLED: POLED ●Evolution of flexible display — Flexible OLED  sensitive to moisture and oxygen — Flexible LCD  need a backlight — E-Paper  slow response time, difficult to realize colored display ● Key composition of flexible OLED 38 1st generation 2nd generation 3rd generation Curved Bendable Rollable & Foldable Durable, Thin & Light Wearable Device Rolled display, No space limit Composition Description Polyimide substrate Superior in a high temperature performance (glass transition temperature: 340C ) Suitable for a laser annealing, laser lift-off TFT Backplane LTPS with ELA (Excimer laser annealing) Organic emitting layer Currently using a vacuum evaporation but an inkjet is the most premising technology in term of cost (10% of material usage with a vacuum evaporation) Encapsulatio n Rigid OLED hermetic sealing with a frit POLED Stacking of organic (CVD) and inorganic layer (Inkjet)
  • 39.
    Recent trend inAutomotive Display ● Mercedes to adopt LG's 12.3" flexible OLEDs in future E-Class automobiles — According to a report from Korea, Mercedes signed an agreement with LG Display to supply its 12.3" FHD flexible P-OLED displays for a future E-Class automobile. The dashboard of the upcoming car will use two such displays, side by side - one showing the instrument cluster and the other information such as navigation. (source: www.koreaherald.com on Mar 9, 2016) ● Benefits of OLED in automotive display applications (source: HIS & research report from NH investment Securities) ● Global shipments of automotive display panels — A global shipments of automotive display panels will increase from 157 million panels in 2015 to 207 million units in 2019, equivalent to a CAGR of 7.2%. — CID takes up the largest portion of automotive display shipments. — Due to demand for larger sizes, higher resolutions and more power- savings, LTPS TFT-LCD or IGZO TFT-LCD panels have replaced a- Si TFT-LCD panels for high-end automobile models. (source: http://www.digitimes.com/news/a20160901PD212.html) ● Road map of display evolution (source: HIS & research report from NH investment Securities) 39 Requirement OLED benefits Performances True black, Wide color gamut Low temp operation, Fast response time Eco-friendly Low power consumption New Design Flexible 2015 2016 2017 2018 2019 2020 Free shape, circularSquare Rigid Curved Flexible TFT-LCD AMOLED ( Flexible) TN/VA IPS, FFS WQGAWVGA WQUGAWXGA HDFHD s-Si LTPS/Oxide Shape Flexible Form Factor Display Technology Technology Mode Resolution Backplane
  • 40.
    40 Thank you! Discussion andQuestions  to brian.kim.phd@gmail.com

Editor's Notes

  • #5 Assessing the coverage of the color space of Recommendation ITU-R BT.2020 (Rec. 2020) has become increasingly important in the design of wide-gamut displays Broadcasting plan Color gamut specification trend The Adobe RGB Color Gamut is 17 percent larger than sRGB / Rec.709. The DCI-P3 Color Gamut is 26 percent larger than sRGB / Rec.709. The Rec.2020 Color Gamut is 72 percent larger than sRGB / Rec.709 and 37 percent larger than DCI-P3.   The NTSC Color Gamut is 98 percent of the Adobe RGB Color Gamut. So while they are both very close in Gamut area and size, note how very different their triangular Gamut shapes and color regions are in Figure 3
  • #7 Growing Importance of Color in a World of Displays and Data Luminance, brightness, HDR and contrast works all together.
  • #10 Increase peak luminance HDR effect Local dimming Select highly saturated color HMI Graphic design considering contrast effect
  • #16 Low refractive coating MgF2 or special polymers for absorption of some of the ambient light. Example; Samsung’s ‘Ultra Clear Panel’ with silver nanoparticles coating.
  • #20  John Ho224 Views LCDs with Quantum dots can actually be more colorful than OLED, because the underlying spectra of the Quantum Dots (30 nm FWHM) are much narrower than traditional OLED materials (50-100 nm FWHM). This translates into less overlap between the RGB channels and therefore more pure color (higher color saturation). How much more colorful will depend on the combination of the QD backlight and the color filter array. But, as far as LCD technology goes, QDs offer the best color performance, in theory, being able to reach close to 95% overlap of the Rec. 2020 standard color gamut.
  • #34 Growing Importance of Color in a World of Displays and Data