Download to read offline

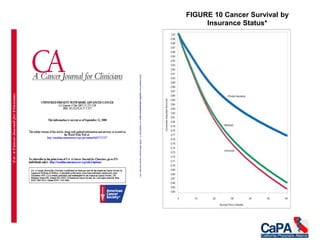


![Insurance Expansion Improved Care for Colorectal Cancer, October 04, 2016
Past research had shown that patients without health insurance typically presented with more
advanced colorectal cancer disease and had lower survival rates compared with patients with
private insurance. The expansion of healthcare in Massachusetts in 2006 was associated with
increased rates of resection, and a decreased likelihood of emergent resection, for patients with
colorectal cancer, according to the results of a study published in the Journal of Clinical Oncology. The
study identified 17,499 patients with government-subsidized, self-pay, or private insurance
admitted to the hospital between 2001 and 2011 in Massachusetts and compared them with
144,253 control patients from three states.
The 2006 Massachusetts health insurance expansion provided Medicaid coverage for people living
below 150% of the federal poverty limit, created a state-subsidized insurance program for people with
income less than 300% of the federal poverty limit but who remained ineligible for Medicaid, and
established an individual mandate requiring all residents to have health insurance.
The comparison showed that prior to the 2006 health insurance reform, those patients with
government-subsidized or self-pay insurance had significantly lower rates of resection for colorectal
cancer compared with patients with private insurance.
The health insurance reform was independently associated with a 44% increased rate of resection
for government-subsidized or self-pay patients (incident rate ratio [IRR], 1.44 [95% CI, 1.23–1.68]; P <
.001). More specifically, the reform was associated with a 49% increased rate of resection for colon
cancer and a 34% increase in resection for rectal cancer. The Massachusetts insurance expansion
was also associated with a 6.21 percentage point decreased probability of emergent admission (95%
CI, −11.88 to −0.54; P = .032) and an 8.13 percentage point increased probability of an elective
admission (95% CI, 1.34–14.91; P = .019) compared with the control states.](https://image.slidesharecdn.com/disparities-170615150659/85/Disparities-88-320.jpg)
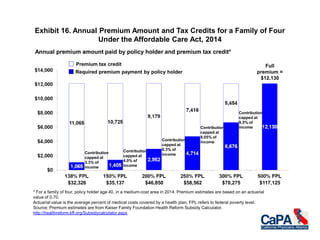
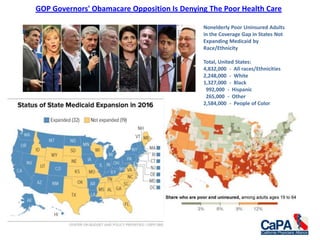
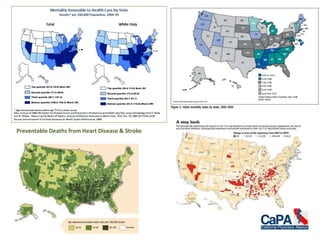
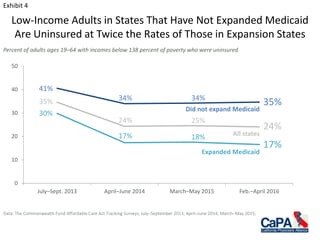
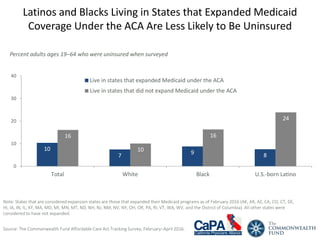
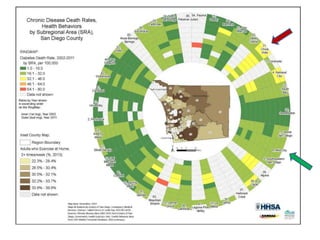
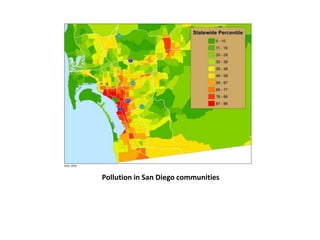
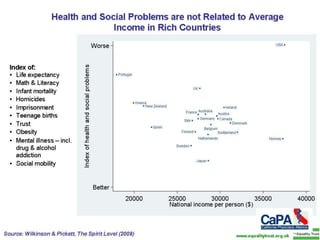
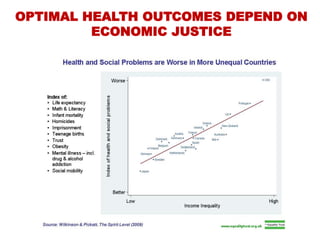
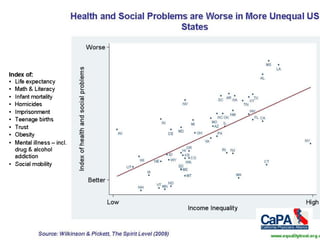
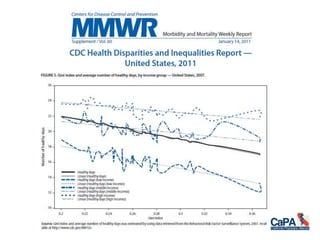


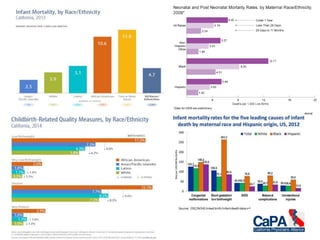
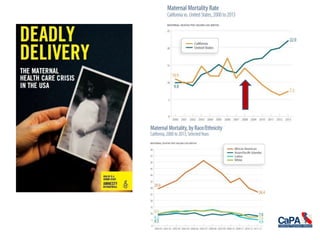
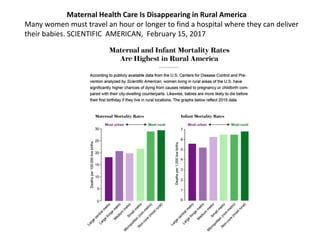
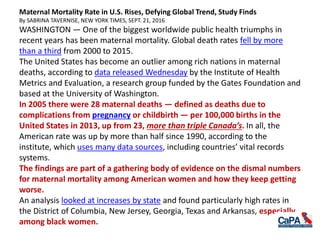
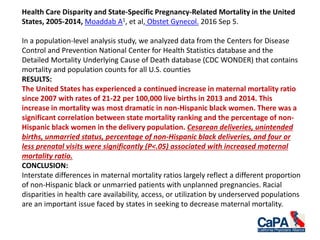
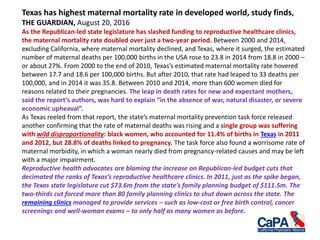
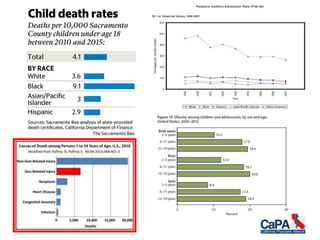
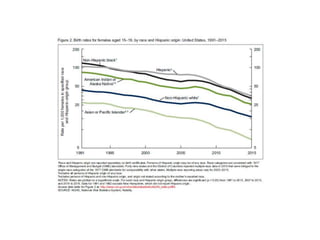
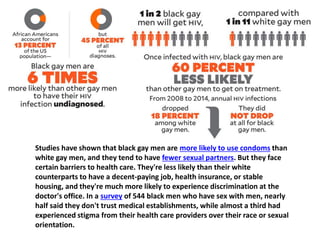
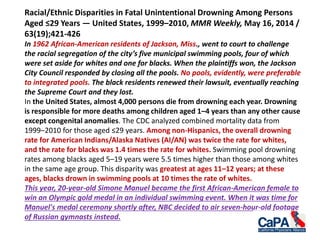
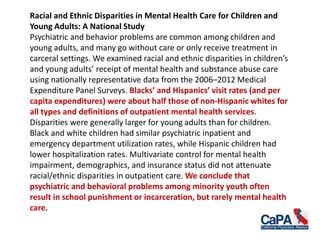
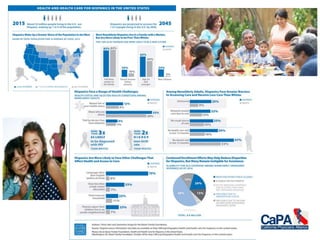
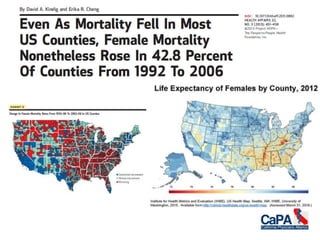
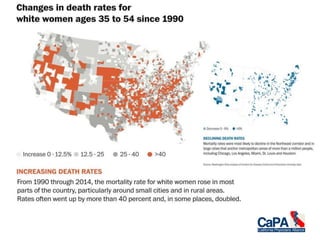
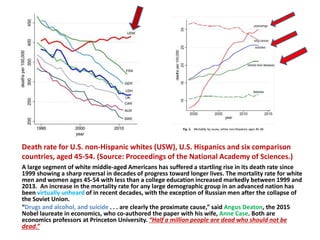
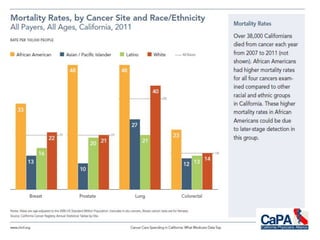
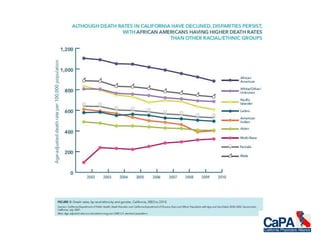
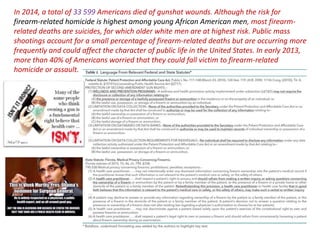
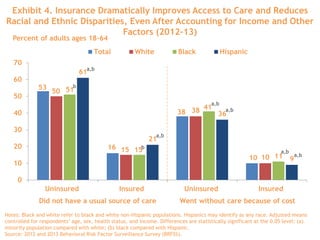
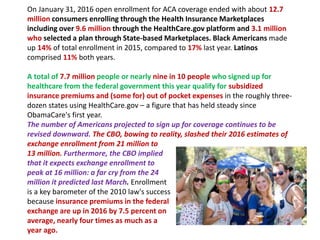
The document highlights significant disparities in maternal mortality rates among American women, particularly affecting black women and those in rural areas. It discusses the impact of healthcare access and socioeconomic factors, revealing alarming trends in states like Texas, where budget cuts have worsened outcomes. Additionally, it explores broader racial and ethnic disparities in health care, including mental health services and chronic illness treatment among various populations.


