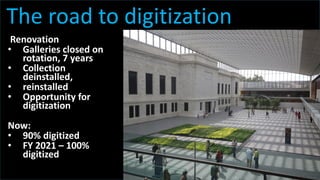
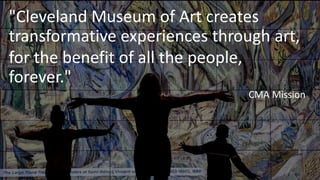
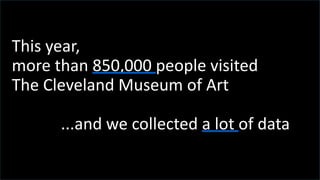
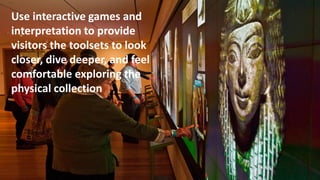
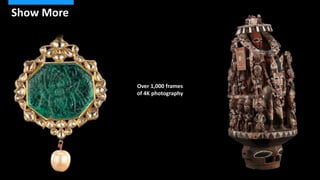
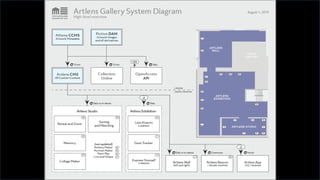
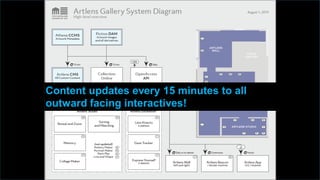
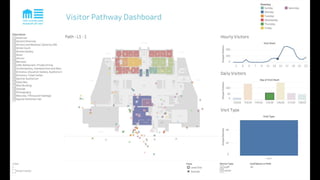
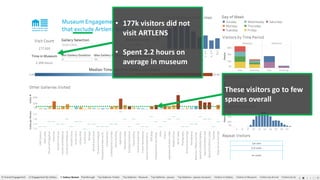
t
Digitization, Big Data, and the
Visitor Journey
Jane Alexander, Cleveland Museum of Art
Smithsonian Institution Digitization Conference
October 2-3, 2019
@janecalexander
t
Renovation
• Galleries closed on
rotation, 7 years
• Collection
deinstalled,
• reinstalled
• Opportunity for
digitization
Now:
• 90% digitized
• FY 2021 – 100%
digitized
The road to digitization
t
"Cleveland Museum of Art creates
transformative experiences through art,
for the benefit of all the people,
forever."
CMA Mission
t
"This is a logical and exciting outgrowth of the
CMA’s inclusive mission “to create transformative
experiences through art, for the benefit of all the
people forever.” The time is right to firmly bring
our mission into the 21st century."
Dr. William Griswold, Director
Cleveland Museum of Art
t
This year,
more than 850,000 people visited
The Cleveland Museum of Art
...and we collected a lot of data
t
But what do we want to learn
from this DATA ?
t
ARTLENS Gallery: Is it working?
t
Use interactive games and
interpretation to provide
visitors the toolsets to look
closer, dive deeper, and feel
comfortable exploring the
physical collection
t
Relate Physical to Digital
t
Over 1,000 frames
of 4K photography
Show More
t
CMA ARTLENS Exhibition
Cleveland, OH
Play with Scale
t
(The Old Label)
t
Author ‘New Labels’
t
To constantly create, you
need a flexible and
integrated backend
t
t
t
Content updates every 15 minutes to all
outward facing interactives!
t
Making Data
Transparent Since 2012
t
See it on the
wall
t
COLLECTS:
• Which game(s)?
• Time spent
• Repeat(s)
• Object(s) matched
• Share(s)
t
Top 10 Visitor Favorites
t
Visitors See Results
t
ANALYTICS
COLLECT
SHARE
ANALYZE
(well, best we could)
Individual attendance at the museum increased by 31%
The attendance of families increased by 29%.
But – were the learning goals
being met?
The Results of Gallery One 2013
t
2015 Gallery One Evaluation Report
• Data collecting occurred in
2013, but the study was not
internally published until 2015
• By time report was published,
many changes had already
taken place
Gallery One and ArtLens Evaluation Report by:
Elizabeth Bolander, Director of Research and Evaluation, and Meghan Stockdale, Research Analyst.
January 2015
In 2018, the CMA’s
Research and Evaluation
team and Rockman
concluded a two-year project
to examine new ways of
measuring the impact of
digital interactives in art
museums. They used
ARTLENS Gallery as a Case
Study
Bolander, E.,Ridenour, H.,Quimby, C. 2019. Art Museums and Technology: Developing New Metrics
to Measure Visitor Engagement. Project funding was generously provided by the National
Endowment for the Arts ArtWorks program.
Findings from Evaluation 2019
Bolander, E.,Ridenour, H.,Quimby, C. 2019. Art Museums and Technology: Developing New Metrics to Measure Visitor Engagement. Project funding was generously
provided by the National Endowment for the Arts ArtWorks program.
36% of the participants
spent time in ARTLENS
Gallery
People who visited
ARTLENS Gallery
demonstrated greater
gains in self-reported level
of art understanding and
knowledge
t
But... are people going
from ArtLens Gallery out
into the collection?
t
Then:
Gallery Guards used manual
counters at each entrance
t
Now:
Implemented an automated
counting system in 10 areas
of the Museum:
• Each entrance to the museum
• Exhibition Galleries
• Rotating Galleries
System has an API that can be
used for custom reporting
75,000 difference
t
Where Are People Going?
How Long Are They Staying There?
Where Do They Go Next?
What Are They Learning?
We Still Want To Know:
t
Analyzing Visitor Experience with
Meraki Wireless Access Points
Meraki allows us to collect data from any wireless antenna hitting our wifi
access points, whether they’ve logged onto our wireless network or not.
YES, we have “Big Data”
• 105 wireless access points
• 1-2 million rows of data per day
• 0.4 GB per day just for search indexes
• A system of 8 separate cloud services
(plus Tableau) to process it all
But there were some challenges
• Noisy data
• Translating devices to visitors
• Building trust
• Facilitating adoption
Noisy data – access points
Each router
spots a device
and estimates
a distance and
certainty
Noisy data – access points
We triangulate
most likely
coordinates
and certainty
Noisy data – data vs reality
1
2
3
4
5
The visitor
most likely
traveled this
way
What is a visitor?
•Multiple wearables
•Phones dynamically
generate MAC addresses
•Not all are wi-fi enabled
t
Getting this data into
the hands of users
t
t
ExperimentOperationalize
1. Discover
2. Explore
3. Build
4. Test
5. Proof of concept
6. Proof of
value
7. Scale
Data Science is iterative
Business
decisions
8. Educate
We had to build trust by
verifying known trends -
Kusama Exhibit
So we could look at new data,
like time…
t
• 177k visitors did not
visit ARTLENS
• Spent 2.2 hours on
average in museum
These visitors go to few
spaces overall
t
• 82k visitors visited
ARTLENS
• They spent 12 minutes
longer at the museum These visitors
interact with
almost 4 times
the number of
spaces!
• 37k visitors spent more than 5
minutes in ARTLENS
• They spent on average 36
minutes more at the museum!
These visitors
interact with
more spaces, for
even longer
periods of time
They’re likely
spending more
money at the café!
t
...visitors who spend at least 5 minutes in
ARTLENS Gallery are spending
approximately 35 minutes longer in the
museum compared to those who do not
visit ARTLENS Gallery.
And now we can ask questions like this
... Does the selection of artworks in
ARTLENS impact gallery visits?
51
We’re connecting ARTLENS games with gallery
visits…
WOW!
52
t
So What Comes Next?
t
t
Open Access brings CMA’s
mission “to create transformative
experiences through art, for the
benefit of all the people, forever”
into the digital age
t
Through this initiative, the CMA’s
collection is a part of the lives of
our users for the broadest
possibilities of artistic creation,
business innovation, education, and
scholarly practice.
t
t
Analytics – Wikimedia Artwork Views, 4 Months (May-Aug)
en.wikipedia.org:
www.clevelandart.org:
224,872
2,503,195
t
Top 10 Artworks on Collection Online
t
Top 10 CMA Artworks on Wikipedia
t
Artwork by Department
t
Artwork by Department
Decorative Art and Design
t
"After achieving record
attendance of nearly
865,000 in the fiscal year
ended June 30, the
Cleveland Museum of Art is
well on its way toward
achieving its goal of serving
1 million visitors a year"
- Cleveland Plain Dealer
t
Dr. William Griswold, Director of
The Cleveland Museum of Art
How do we show the connection
between Open Access and
physical attendance
and engagement ?
t
Thank You
Jane Alexander, Chief Information Officer
The Cleveland Museum of Art
@janecalexander

Digitization, Big Data, and the Visitor Journey

  • 1.
    t Digitization, Big Data,and the Visitor Journey Jane Alexander, Cleveland Museum of Art Smithsonian Institution Digitization Conference October 2-3, 2019 @janecalexander
  • 2.
    t Renovation • Galleries closedon rotation, 7 years • Collection deinstalled, • reinstalled • Opportunity for digitization Now: • 90% digitized • FY 2021 – 100% digitized The road to digitization
  • 3.
    t "Cleveland Museum ofArt creates transformative experiences through art, for the benefit of all the people, forever." CMA Mission
  • 4.
    t "This is alogical and exciting outgrowth of the CMA’s inclusive mission “to create transformative experiences through art, for the benefit of all the people forever.” The time is right to firmly bring our mission into the 21st century." Dr. William Griswold, Director Cleveland Museum of Art
  • 5.
    t This year, more than850,000 people visited The Cleveland Museum of Art ...and we collected a lot of data
  • 6.
    t But what dowe want to learn from this DATA ?
  • 7.
  • 8.
    t Use interactive gamesand interpretation to provide visitors the toolsets to look closer, dive deeper, and feel comfortable exploring the physical collection
  • 9.
  • 10.
    t Over 1,000 frames of4K photography Show More
  • 11.
  • 12.
  • 13.
  • 14.
    t To constantly create,you need a flexible and integrated backend
  • 15.
  • 16.
  • 17.
    t Content updates every15 minutes to all outward facing interactives!
  • 18.
  • 19.
    t See it onthe wall
  • 20.
    t COLLECTS: • Which game(s)? •Time spent • Repeat(s) • Object(s) matched • Share(s)
  • 21.
  • 22.
  • 23.
  • 24.
    Individual attendance atthe museum increased by 31% The attendance of families increased by 29%. But – were the learning goals being met? The Results of Gallery One 2013
  • 25.
    t 2015 Gallery OneEvaluation Report • Data collecting occurred in 2013, but the study was not internally published until 2015 • By time report was published, many changes had already taken place Gallery One and ArtLens Evaluation Report by: Elizabeth Bolander, Director of Research and Evaluation, and Meghan Stockdale, Research Analyst. January 2015
  • 26.
    In 2018, theCMA’s Research and Evaluation team and Rockman concluded a two-year project to examine new ways of measuring the impact of digital interactives in art museums. They used ARTLENS Gallery as a Case Study Bolander, E.,Ridenour, H.,Quimby, C. 2019. Art Museums and Technology: Developing New Metrics to Measure Visitor Engagement. Project funding was generously provided by the National Endowment for the Arts ArtWorks program.
  • 27.
    Findings from Evaluation2019 Bolander, E.,Ridenour, H.,Quimby, C. 2019. Art Museums and Technology: Developing New Metrics to Measure Visitor Engagement. Project funding was generously provided by the National Endowment for the Arts ArtWorks program. 36% of the participants spent time in ARTLENS Gallery People who visited ARTLENS Gallery demonstrated greater gains in self-reported level of art understanding and knowledge
  • 28.
    t But... are peoplegoing from ArtLens Gallery out into the collection?
  • 29.
    t Then: Gallery Guards usedmanual counters at each entrance
  • 30.
    t Now: Implemented an automated countingsystem in 10 areas of the Museum: • Each entrance to the museum • Exhibition Galleries • Rotating Galleries System has an API that can be used for custom reporting 75,000 difference
  • 31.
    t Where Are PeopleGoing? How Long Are They Staying There? Where Do They Go Next? What Are They Learning? We Still Want To Know:
  • 32.
    t Analyzing Visitor Experiencewith Meraki Wireless Access Points Meraki allows us to collect data from any wireless antenna hitting our wifi access points, whether they’ve logged onto our wireless network or not.
  • 33.
    YES, we have“Big Data” • 105 wireless access points • 1-2 million rows of data per day • 0.4 GB per day just for search indexes • A system of 8 separate cloud services (plus Tableau) to process it all
  • 34.
    But there weresome challenges • Noisy data • Translating devices to visitors • Building trust • Facilitating adoption
  • 35.
    Noisy data –access points
  • 36.
    Noisy data –access points Each router spots a device and estimates a distance and certainty
  • 37.
    Noisy data –access points We triangulate most likely coordinates and certainty
  • 38.
    Noisy data –data vs reality 1 2 3 4 5 The visitor most likely traveled this way
  • 39.
    What is avisitor? •Multiple wearables •Phones dynamically generate MAC addresses •Not all are wi-fi enabled
  • 40.
    t Getting this datainto the hands of users
  • 41.
  • 42.
  • 43.
    ExperimentOperationalize 1. Discover 2. Explore 3.Build 4. Test 5. Proof of concept 6. Proof of value 7. Scale Data Science is iterative Business decisions 8. Educate
  • 44.
    We had tobuild trust by verifying known trends - Kusama Exhibit
  • 45.
    So we couldlook at new data, like time…
  • 46.
    t • 177k visitorsdid not visit ARTLENS • Spent 2.2 hours on average in museum These visitors go to few spaces overall
  • 47.
    t • 82k visitorsvisited ARTLENS • They spent 12 minutes longer at the museum These visitors interact with almost 4 times the number of spaces!
  • 48.
    • 37k visitorsspent more than 5 minutes in ARTLENS • They spent on average 36 minutes more at the museum! These visitors interact with more spaces, for even longer periods of time They’re likely spending more money at the café!
  • 49.
    t ...visitors who spendat least 5 minutes in ARTLENS Gallery are spending approximately 35 minutes longer in the museum compared to those who do not visit ARTLENS Gallery.
  • 50.
    And now wecan ask questions like this ... Does the selection of artworks in ARTLENS impact gallery visits?
  • 51.
  • 52.
    We’re connecting ARTLENSgames with gallery visits… WOW! 52
  • 53.
  • 54.
  • 55.
    t Open Access bringsCMA’s mission “to create transformative experiences through art, for the benefit of all the people, forever” into the digital age
  • 56.
    t Through this initiative,the CMA’s collection is a part of the lives of our users for the broadest possibilities of artistic creation, business innovation, education, and scholarly practice.
  • 57.
  • 58.
    t Analytics – WikimediaArtwork Views, 4 Months (May-Aug) en.wikipedia.org: www.clevelandart.org: 224,872 2,503,195
  • 59.
    t Top 10 Artworkson Collection Online
  • 60.
    t Top 10 CMAArtworks on Wikipedia
  • 61.
  • 62.
  • 63.
    t "After achieving record attendanceof nearly 865,000 in the fiscal year ended June 30, the Cleveland Museum of Art is well on its way toward achieving its goal of serving 1 million visitors a year" - Cleveland Plain Dealer
  • 64.
    t Dr. William Griswold,Director of The Cleveland Museum of Art How do we show the connection between Open Access and physical attendance and engagement ?
  • 65.
    t Thank You Jane Alexander,Chief Information Officer The Cleveland Museum of Art @janecalexander