DIGITAL RISK MODEL
•
2 likes•99 views

DIGITAL RISK MODEL
Report
Share
Report
Share
Recommended
TRADING SURVEILLANCE ROADMAP
This document outlines a trading surveillance roadmap that covers governance, compliance, risk management, and regulatory requirements for trading activities. It includes concepts like portfolio management, trade execution, wash trading prevention, derivatives handling, network oversight, transparency reporting, and tools for monitoring risk tolerance and conduct issues across infrastructure platforms.
VRM
This document contains performance metrics and risk assessment scores for various business functions and processes, including contract compliance, version control, spend viability, affiliate audits, and escalations. It also includes data on business continuity risk, exit strategy risk, data mapping, and compliance assessment blocking. The document lists numerical values ranging from 0 to 1800 for these categories. It concludes with a chart showing percentage compliance over time.
CORPORATE GOVERNANCE MECHANICS
This document discusses various issues and challenges related to corporate governance. It outlines factors such as greenfield investments, green bonds, cybercrime management, audit processes, risk culture, sustainability, and human capital risk management that must be addressed. Challenges include stabilizing risk levels, governance of new technologies like blockchain, recovery modules, valuation of digital entities, and ensuring regulatory compliance across borders. Effective corporate governance requires implementing controls and managing risks to foster business continuity and integrated growth within an organization.
CREATIVE RISK MODEL
This document outlines a creative risk model with 6 factors - intrinsic motivation, value webs, capability innovation, creative climate alignment, creative tension - rated on a scale of 0-100%. The highest rated factors are intrinsic motivation at 100%, value webs at 90-100%, and capability innovation at 88-98%. The lowest rated factor is creative tension at 23-43%.
GEOSPATIAL FORENSIC RISK MODEL
This document discusses a geospatial forensic risk model that maps territorial risks using routine scenario tuning and geographic suppression logic tools. It analyzes key risk indicators and environmental risks at different levels (high, moderate, low) to assess resilience through methods like geo coding. Charts and equations are provided showing the relationship between different risk factors.
HUMAN CAPITAL RISK MODEL
This document presents a human capital risk model that evaluates various factors related to an organization's human capital and assigns scores from 0-100% to priorities like analysis, recruitment, skills gaps, compliance, and management. It also lists other metrics that contribute to intangible economic value and human capital maturity like social and cultural shifts, performance analytics, engagement, and digital transformation initiatives.
SILOED COMPLIANCE MODEL
The document discusses compliance mechanics across various technologies including SaaS, CAAT, ETL, and modules for CRM, data analytics, and visibility. It references risk assessment, capacity, vetting, response platforms, scheduling, discerning complex issues, and integration across tax, enterprise risk, and regulatory frameworks. Charts show indexes for plateau, risk scores, and environments with levels from low to intolerable.
CREDIT RISK MODEL
This document presents the results of a credit risk model. It includes credit risk index scores for various sectors, with automotive and retail having the highest risk. A quadratic regression equation is shown with an R2 value of 0.955 to model the relationship between credit risk concentration and return on risk-adjusted capital. Various credit risk assessment factors are listed and ranked in order of importance, with credit rating, collateral valuation, and governance being the top three factors.
TAX RISK & COMPLIANCE MODEL
The document contains charts and statistics about tax risk and compliance management. The largest risks are variable change management at 19.69% and risk incidence at 19.49%. Other key risks include VAT errors, transfer pricing controls, and the internal control environment. Charts also show levels of jurisdiction risk, legislative risk, product line affirmation, peer group analytics, and sectoral analytics compared to deterrent impact, quantitative easing options, and the OECD's base erosion and profit shifting initiative.
E-SPORTS COMPLIANCE MODEL
The document discusses various metrics related to e-sports compliance including percentages allocated to sponsorships, e-ticket modulation, revenue streams, network ratings, cyber space, latent capacity, virtual assets, betting, cloud surveillance, siloed retail management, gambling risks, compliance infractions, and online solutions architecture. It also mentions factors related to high potential entrepreneurs, millennial consumption patterns, and compliance gap variables.
ASSET BACKED RISK SIMULATION MODEL
This document contains a scatter plot showing two trend lines with equations and R-squared values. The x-axis ranges from 0 to 180 and the y-axis ranges from -20 to 160. Data points are scattered above and below the trend lines. Labels on the plot include terms related to market risk, credit risk, asset-backed risk simulation, stranded costs, utilities, mortgage-backed securities, asset liability management and sustainability risk.
COMPARTMENTAL COMPLIANCE MODULE
The document discusses various corporate compliance modules including initiation and maturity assessment, ICAAP, ILAA, SAR, AML, KYC, and risk event crystallization. It also mentions economic and social cohesion, GRC embedded matrix, strategic added value, and escalation metrics as part of corporate architecture and externalities.
AUDIT COMPLIANCE MODULE
The document discusses various topics related to audit compliance and risk management. It mentions hierarchical compliance statements, risk management of regulatory reforms, implementing financial crime compliance programs, assessing the impact of revenue complexities, prioritizing corporate interests, analyzing risk culture and data, managing risk change portfolios, addressing non-financial governance risks, ensuring audit scalability for new regulatory regimes, evaluating cyber crime audit collaboration, assessing digital economies, reviewing credit parameters and core data architecture, measuring audit market trends and valuation, maintaining audit independence, and performing deep dive audits and granular risk assessments.
FORECAST CAUSAL RISK MODEL
This document presents a forecast causal risk model that uses a quadratic equation (y = -0.0314x^2 + 4.2857x - 61.143) to model the relationship between an economic value index on the x-axis and a risk threshold on the y-axis, with an R2 value of 1 indicating a perfect fit to the data points provided.
COST PRESSURE TREND ANALYSIS
This document contains a scatter plot with data points and two trend lines showing the relationship between two indices. The scatter plot shows values for a retail index on the x-axis and a price index on the y-axis. A regression analysis was performed and the R-squared value provided indicates a moderate positive correlation between the two indices.
RETAIL RISK MANAGEMENT MODEL
The document appears to contain various statistics and terms related to emerging markets, economic downturns, industries such as real estate, energy, apparel and consumables, and retail strategies for volatile market conditions. Percentages and numbers are listed for emerging market penetration, recession impacts, e-commerce strategies, and market volatility for different industries. Additional retail-related terms are included such as value-based buying shifts, interactive trends, and strategies around technology, risk management, and leveraging emerging technologies.
COGNIZANT CORPORATE GOVERNANCE MODEL
The document outlines Cognizant's corporate governance model which includes stakeholder management, a board of directors, succession planning, remuneration frameworks, corporate accountability, sustainability implementation, performance monitoring, risk appetite, diversity and inclusion, data lineage, business intelligence, centralized governance, change management, corporate reporting, investor relations, and ethics modules to ensure effective governance, accountability, and compliance.
RADICAL GREENING RISK MODEL
This document contains charts and graphs analyzing sustainability and risk across various industries. It shows percentages for categories like economic resilience, human capital risk, and regulatory sensitivity for sectors including apparel, healthcare, oil and gas, and transportation. The largest human capital risk is in apparel at 39% while transportation has the lowest regulatory sensitivity at 0%.
COMPLIANCE STRESS TEST MECHANISM
This document outlines a compliance stress test mechanism used to evaluate capital balances, debt leverage ratios, and risk levels over time. Key metrics such as capital balance, net change in capital, total debt, total equity, and debt to equity ratios are calculated at the beginning and end of the period. The results are then used to determine compliance and risk levels on a scale from low to high risk. Actions such as product controls, asset pool stabilization, or regulatory intervention may be needed if the evaluation finds non-compliant or intolerably high risk levels.
DOWNGRADE RISK MODEL
The document outlines a risk model that downgrades ratings over time based on sectoral coverage, rating metrics, and an index mean. It provides a scale from 13 to 1 to measure downgrade risk and categorizes sectors from AA+ to B- based on various rating metrics like volatility and a normal cumulative distribution between 6-8 to 0-2.
INVESTMENT RISK MANAGEMENT MODEL
This document presents an investment risk management model with metrics and parameters. It includes numbers and terms related to volatility, attribution, allocation indexes, frequency intervals, interest rates, and Value at Risk (VaR) which are used to analyze risk and make investment decisions. The model provides a framework to measure and manage the risk of investment portfolios.
BLOCKCHAIN RISK & IMPACT MODEL
This document presents models for assessing risk and impact related to blockchain technology. It includes graphs showing the relationship between different variables over time or in relation to each other. The models aim to evaluate risks from factors like social engineering, digitization of assets, and distributed ledger technology, and determine appropriate risk tolerance levels.
INFRASTRUCTURE INTEGRATION RISK MODEL
This document presents a risk model for integrating infrastructure. It includes factors like cost pressure, key performance areas, modules, architecture, and a core index. The core index is segmented into three risk levels - high from 1E+43-1.5E+43, medium from 5E+42-1E+43, and low from 0-5E+42.
INVENTORY RISK MODEL
This document presents an inventory risk model showing production and warehouse capacity levels over four quarters, with overall production risk totaling 37.91% for the year. Various business operating modules like warehousing, production, and platform are assigned risk percentages, with the highest being 21.45% for capacity. The model provides a breakdown of inventory risk by quarter to assess overall risk.
SUPPLY CHAIN RISK MODEL
This document presents a supply chain risk model that graphs the relationship between a delta factoral and volatility factoral for local produce, imported produce, and bi-products. The model shows the risk levels associated with different factors over a range of values on the x-axis.
More Related Content
More from Maryam Hidayatallah CPFA,MIPA,MA,CICA
TAX RISK & COMPLIANCE MODEL
The document contains charts and statistics about tax risk and compliance management. The largest risks are variable change management at 19.69% and risk incidence at 19.49%. Other key risks include VAT errors, transfer pricing controls, and the internal control environment. Charts also show levels of jurisdiction risk, legislative risk, product line affirmation, peer group analytics, and sectoral analytics compared to deterrent impact, quantitative easing options, and the OECD's base erosion and profit shifting initiative.
E-SPORTS COMPLIANCE MODEL
The document discusses various metrics related to e-sports compliance including percentages allocated to sponsorships, e-ticket modulation, revenue streams, network ratings, cyber space, latent capacity, virtual assets, betting, cloud surveillance, siloed retail management, gambling risks, compliance infractions, and online solutions architecture. It also mentions factors related to high potential entrepreneurs, millennial consumption patterns, and compliance gap variables.
ASSET BACKED RISK SIMULATION MODEL
This document contains a scatter plot showing two trend lines with equations and R-squared values. The x-axis ranges from 0 to 180 and the y-axis ranges from -20 to 160. Data points are scattered above and below the trend lines. Labels on the plot include terms related to market risk, credit risk, asset-backed risk simulation, stranded costs, utilities, mortgage-backed securities, asset liability management and sustainability risk.
COMPARTMENTAL COMPLIANCE MODULE
The document discusses various corporate compliance modules including initiation and maturity assessment, ICAAP, ILAA, SAR, AML, KYC, and risk event crystallization. It also mentions economic and social cohesion, GRC embedded matrix, strategic added value, and escalation metrics as part of corporate architecture and externalities.
AUDIT COMPLIANCE MODULE
The document discusses various topics related to audit compliance and risk management. It mentions hierarchical compliance statements, risk management of regulatory reforms, implementing financial crime compliance programs, assessing the impact of revenue complexities, prioritizing corporate interests, analyzing risk culture and data, managing risk change portfolios, addressing non-financial governance risks, ensuring audit scalability for new regulatory regimes, evaluating cyber crime audit collaboration, assessing digital economies, reviewing credit parameters and core data architecture, measuring audit market trends and valuation, maintaining audit independence, and performing deep dive audits and granular risk assessments.
FORECAST CAUSAL RISK MODEL
This document presents a forecast causal risk model that uses a quadratic equation (y = -0.0314x^2 + 4.2857x - 61.143) to model the relationship between an economic value index on the x-axis and a risk threshold on the y-axis, with an R2 value of 1 indicating a perfect fit to the data points provided.
COST PRESSURE TREND ANALYSIS
This document contains a scatter plot with data points and two trend lines showing the relationship between two indices. The scatter plot shows values for a retail index on the x-axis and a price index on the y-axis. A regression analysis was performed and the R-squared value provided indicates a moderate positive correlation between the two indices.
RETAIL RISK MANAGEMENT MODEL
The document appears to contain various statistics and terms related to emerging markets, economic downturns, industries such as real estate, energy, apparel and consumables, and retail strategies for volatile market conditions. Percentages and numbers are listed for emerging market penetration, recession impacts, e-commerce strategies, and market volatility for different industries. Additional retail-related terms are included such as value-based buying shifts, interactive trends, and strategies around technology, risk management, and leveraging emerging technologies.
COGNIZANT CORPORATE GOVERNANCE MODEL
The document outlines Cognizant's corporate governance model which includes stakeholder management, a board of directors, succession planning, remuneration frameworks, corporate accountability, sustainability implementation, performance monitoring, risk appetite, diversity and inclusion, data lineage, business intelligence, centralized governance, change management, corporate reporting, investor relations, and ethics modules to ensure effective governance, accountability, and compliance.
RADICAL GREENING RISK MODEL
This document contains charts and graphs analyzing sustainability and risk across various industries. It shows percentages for categories like economic resilience, human capital risk, and regulatory sensitivity for sectors including apparel, healthcare, oil and gas, and transportation. The largest human capital risk is in apparel at 39% while transportation has the lowest regulatory sensitivity at 0%.
COMPLIANCE STRESS TEST MECHANISM
This document outlines a compliance stress test mechanism used to evaluate capital balances, debt leverage ratios, and risk levels over time. Key metrics such as capital balance, net change in capital, total debt, total equity, and debt to equity ratios are calculated at the beginning and end of the period. The results are then used to determine compliance and risk levels on a scale from low to high risk. Actions such as product controls, asset pool stabilization, or regulatory intervention may be needed if the evaluation finds non-compliant or intolerably high risk levels.
DOWNGRADE RISK MODEL
The document outlines a risk model that downgrades ratings over time based on sectoral coverage, rating metrics, and an index mean. It provides a scale from 13 to 1 to measure downgrade risk and categorizes sectors from AA+ to B- based on various rating metrics like volatility and a normal cumulative distribution between 6-8 to 0-2.
INVESTMENT RISK MANAGEMENT MODEL
This document presents an investment risk management model with metrics and parameters. It includes numbers and terms related to volatility, attribution, allocation indexes, frequency intervals, interest rates, and Value at Risk (VaR) which are used to analyze risk and make investment decisions. The model provides a framework to measure and manage the risk of investment portfolios.
BLOCKCHAIN RISK & IMPACT MODEL
This document presents models for assessing risk and impact related to blockchain technology. It includes graphs showing the relationship between different variables over time or in relation to each other. The models aim to evaluate risks from factors like social engineering, digitization of assets, and distributed ledger technology, and determine appropriate risk tolerance levels.
INFRASTRUCTURE INTEGRATION RISK MODEL
This document presents a risk model for integrating infrastructure. It includes factors like cost pressure, key performance areas, modules, architecture, and a core index. The core index is segmented into three risk levels - high from 1E+43-1.5E+43, medium from 5E+42-1E+43, and low from 0-5E+42.
INVENTORY RISK MODEL
This document presents an inventory risk model showing production and warehouse capacity levels over four quarters, with overall production risk totaling 37.91% for the year. Various business operating modules like warehousing, production, and platform are assigned risk percentages, with the highest being 21.45% for capacity. The model provides a breakdown of inventory risk by quarter to assess overall risk.
SUPPLY CHAIN RISK MODEL
This document presents a supply chain risk model that graphs the relationship between a delta factoral and volatility factoral for local produce, imported produce, and bi-products. The model shows the risk levels associated with different factors over a range of values on the x-axis.
More from Maryam Hidayatallah CPFA,MIPA,MA,CICA (20)
Recently uploaded
クイズでレクリエーション!企業向けクイズワークショップ「みんなのクイズ」の説明資料
クイズでレクリエーション!企業向けクイズワークショップ「みんなのクイズ」の説明資料です。社内イベント、内定者懇親会、研修前のアイスブレイクなどで利用可能です。
20240606_Service Design Exercise_Visual Report_vol.1.pdf
2024年度高知大学地域協働学部で開講されたサービスデザイン基礎演習Day1の様子をまとめたビジュアルレポートを公開しました。
本演習では、「LEGO® SERIOUS PLAY® (レゴ® シリアスプレイ®)メソッドと教材を活用したワークショップ」を取り入れ、デザイン思考/サービスデザイン、リーンスタートアップ、アイデアソン手法を組み合わせ、地域課題解決や社会課題解決に向けた商品/サービスの開発や政策形成の基本的な考え方と手法を学ぶことを目的に開講されています。
MMOLHolging株式会社|BtoC、D2C事業グロース支援・インターナルブランディング、採用ブランディング、社員エンゲージメント向上DX
MMOLHolgings_company_short.pdf
株式会社メンバーズ「脱炭素アクション100」2023年度実施レポート(2024.6.6)
メンバーズでは、デジタルクリエイター(当社社員)がお客さま企業の支援を中心とした日々の業務における行動の一つひとつを変えることで脱炭素社会の実現に貢献するために、2023年4月に「脱炭素アクション100」を全社に展開し社員による取り組みを開始しました。これらの脱炭素の取り組みを広く活用していただきたいと考え、メンバーズでの推進プロセスおよび実績をまとめたレポートを公開します。
Recently uploaded (18)
Business Strategy - ITIL Case Studies by Using ITIL 2011 (Japanese)
Business Strategy - ITIL Case Studies by Using ITIL 2011 (Japanese)
20240606_Service Design Exercise_Visual Report_vol.1.pdf
20240606_Service Design Exercise_Visual Report_vol.1.pdf
MMOLHolging株式会社|BtoC、D2C事業グロース支援・インターナルブランディング、採用ブランディング、社員エンゲージメント向上DX
MMOLHolging株式会社|BtoC、D2C事業グロース支援・インターナルブランディング、採用ブランディング、社員エンゲージメント向上DX
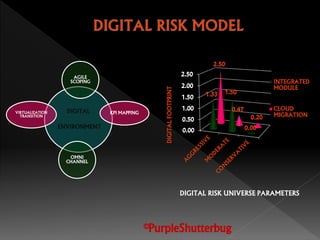
DIGITAL RISK MODEL
- 1. DIGITAL ENVIRONMENT AGILE SCOPING KPI MAPPING OMNI CHANNEL VIRTUALIZATION TRANSITION 0.00 0.50 1.00 1.50 2.00 2.50 1.33 1.50 0.00 2.50 0.47 0.20 DIGITALFOOTPRINT DIGITAL RISK UNIVERSE PARAMETERS INTEGRATED MODULE CLOUD MIGRATION ©PurpleShutterbug