Download to read offline


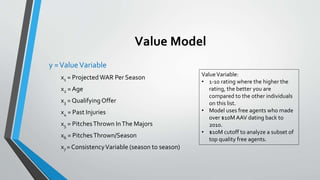
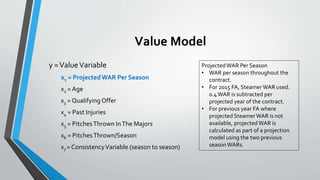
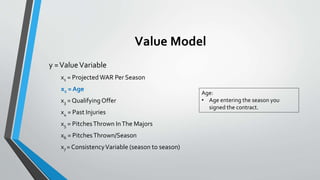


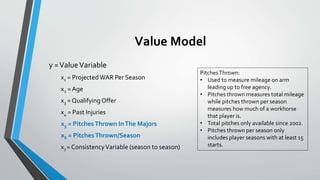
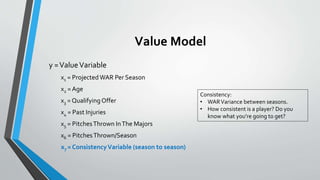

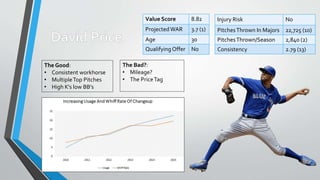

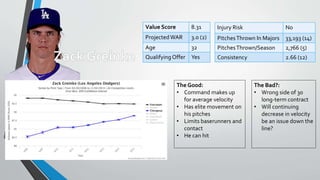
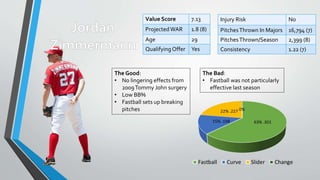

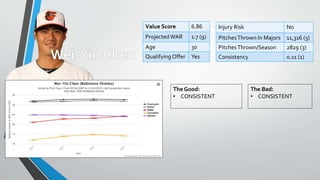


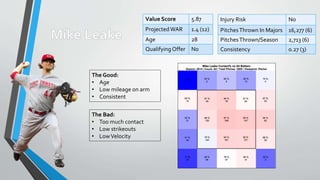
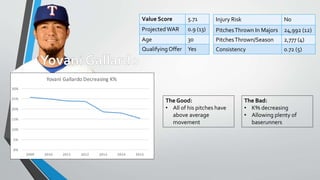
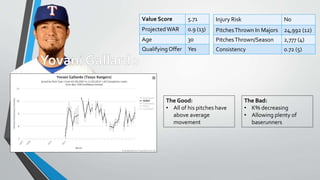
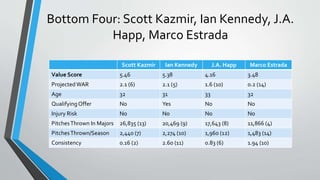


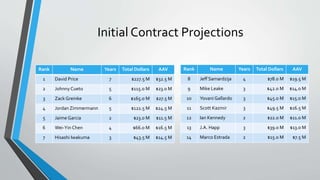
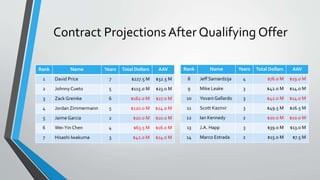
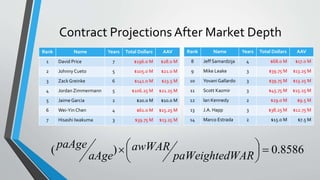
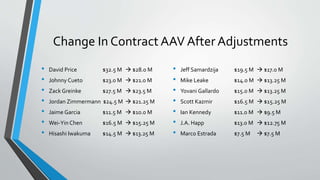


The document outlines a methodology for evaluating and ranking upcoming free agent pitchers in Major League Baseball. It describes factors used in a value model such as projected WAR, age, injury history, and consistency. Player profiles are provided for the top 14 free agents that include these statistics and a bulleted analysis of strengths and weaknesses. Initial contract projections are given followed by adjustments made after accounting for qualifying offers and market depth.


