Download to read offline

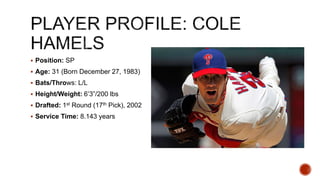
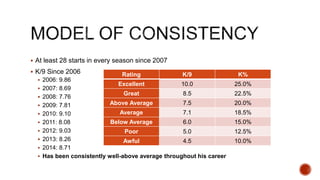
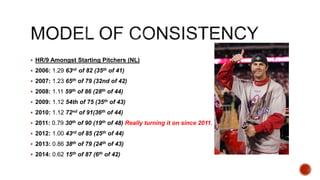
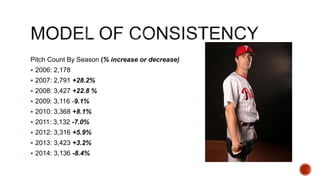
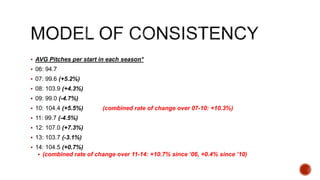
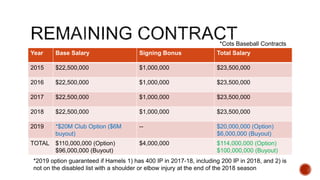
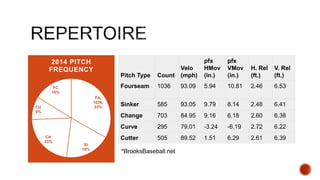

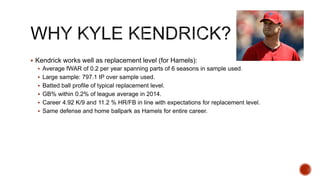
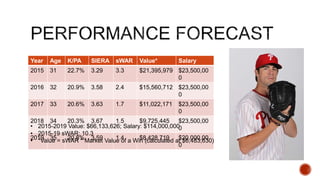
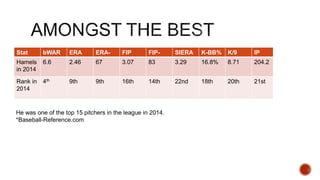
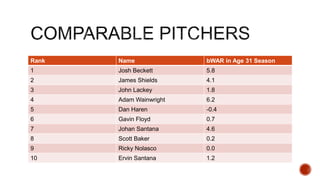
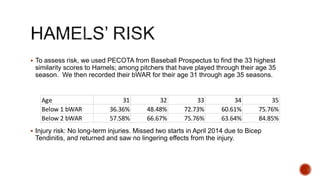
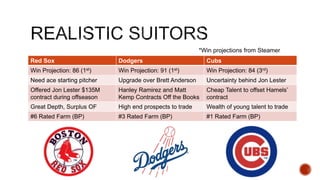
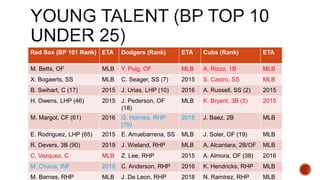
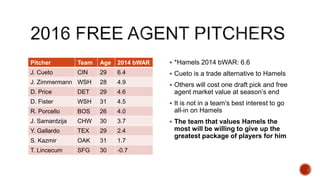


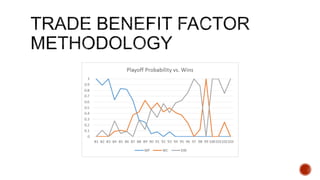

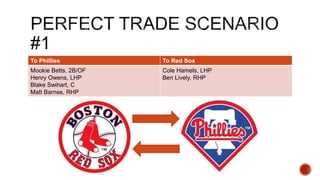

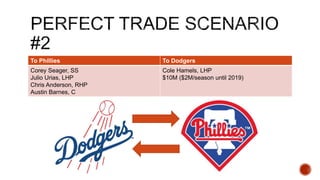
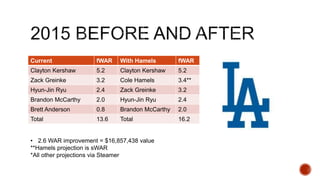
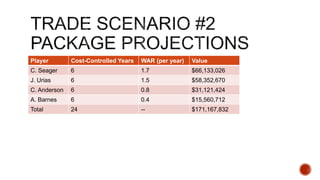

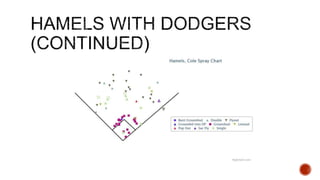

The document analyzes Cole Hamels' career statistics, performance, and potential trade value for the Philadelphia Phillies in relation to other Major League Baseball teams, particularly focusing on the Boston Red Sox, Los Angeles Dodgers, and Chicago Cubs. It highlights his strong track record, including consistent strikeout rates and salary comparisons, while assessing risk factors similar to players in his position. Additionally, the document elaborates on the strategic benefits of trading Hamels before the season starts to maximize value for both the Phillies and the acquiring team.


