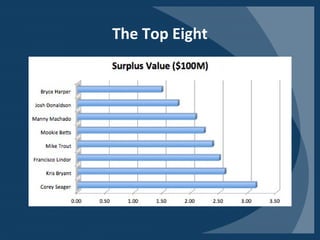
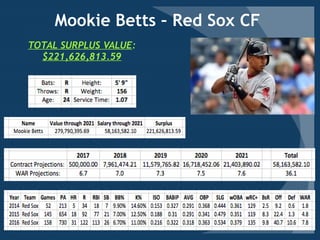
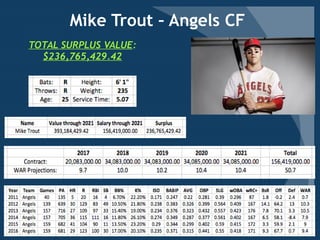
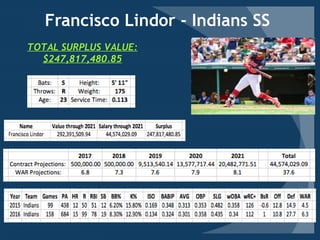
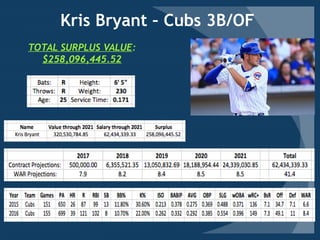
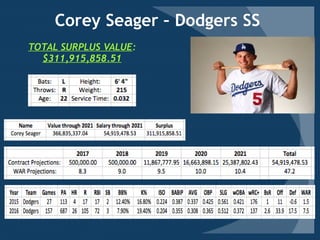
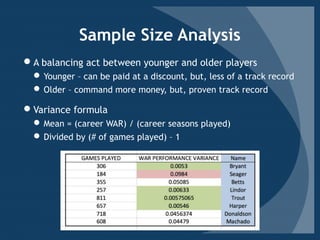
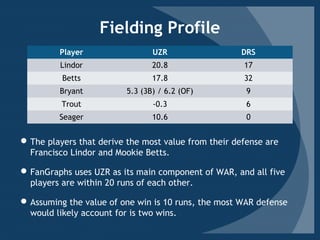
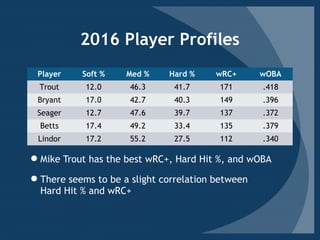
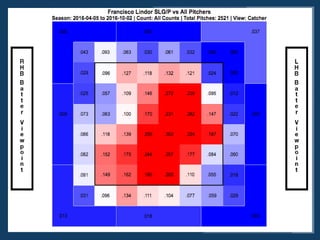
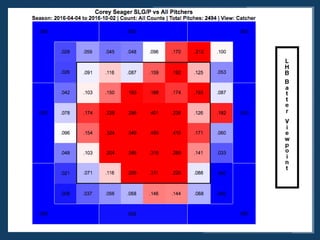
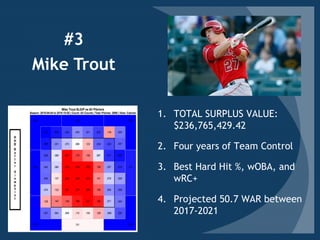
TheThree MostValuable
Position Players in MLB
University of Florida
Ronnie Socash
RJ Walsh
Tanner Crouch
Danny Lueck
Table of Contents
1.Preliminary Process – Find the original pool of players
2.Statistical Analysis – Projecting Future Performance
3.MarketValue – Comparable players; predict future contracts
4.Risks – Identify potential pitfalls
5.Identification – Five MostValuable Position Players
6.Case Study – Analysis of the final cut
7.The FinalThree
Preliminary Process
• Step 1: Identify the original pool of players
– Position playerWAR leaders
– Future and recent top prospects
• Step 2: Build a database of 20 possible players
– Name,Team, Age, Seasons Played, Games Played,WAR
over last three seasons (if applicable)
The Top Candidates
Projecting Future WAR
R2
= .91
Database of players
from 1986 - 2016
WAR = -3.9352 + 36*(age) - .0062*(age2
)
Statistical Analysis
Apply the percentage change
from year to year to each
player
Use the average of the last
two seasons of WAR for each
player
Example: Nolan Arenado
Age at 2017 Opening Day: 25
2015 WAR: 4.5
2016 WAR: 5.2
(5.2 + 4.5) / 2 = 4.9 WAR
2017 projection: 4.9 * (slope change from “24 to 25”)
= 4.9 * (1.049073) = 5.1 WAR
2018 projection: 5.1 * (slope change from “25 to “26”)
= 5.1 * (1.036205) = 5.3 WAR
Process repeated through the 2021 season
Converting WAR Into Dollars
$7 million per marginal win in 2017
 5% increase each year.
Nolan Arenado:
–2017: 5.1 predicted WAR * ($7,000,000) = $35,616,028.35
–2018: 5.3 predicted WAR * ($7,350,000) = $38,750,766.66
–Continue through 2021
–Add all five dollar figures to calculate total 5-year future value
in terms of WAR
–Over next 5 seasons: 26.7 WAR and $207,276,574.20 Production
Value
Projecting Future Salary
Step 1: Identify Comparable Players
Comparable Player Qualifications:
-Same Position
-Within 3 years of age at time of breakout/peak
- Peak/Breakout seasons within 1.5 WAR
League Projected Salary Increase
Similar to the Qualifying
Offer, we used the average
of the top 125 contracts
over the last 10 years
We then created a linear
model to predict future
increases
• R2
value of .96
• Avg. Salary = -1.14B +
573,300*(year)
Example: Manny Machado
Comparable Players: Pablo Sandoval and Kyle Seager
• Machado entered 1st
year of arbitration after 6.8 WAR
season
• Sandoval entered 1st
year of arbitration after 5.3 WAR
season
• Seager entered 1st
year of arbitration after 5.4 WAR
season
• Machado (24), Sandoval (25), Seager (27)
• All play third base
Projecting Arbitration
• Use the comparable
player salaries during
similar career points
• Calculate the
percentage of the QO
that players made in
those years
• Adjust the current
player’s salary to
reflect the percent
change
Adjusted for Salary Increase
Final Adjustment
 If Machado’s production was equal to Seager or Sandoval, we
would expect Machado to receive same percentage of the QO.
 In order to adjust for the difference in production of the current
player, we then multiplied the projected salary by the percent
difference in WAR over the three previous seasons.
Adjusted Salary Projection
The Top Eight
The Five Finalists
Mookie Betts – Red Sox CF
TOTAL SURPLUS VALUE:
$221,626,813.59
Mike Trout – Angels CF
TOTAL SURPLUS VALUE:
$236,765,429.42
Francisco Lindor - Indians SS
TOTAL SURPLUS VALUE:
$247,817,480.85
Kris Bryant – Cubs 3B/OF
TOTAL SURPLUS VALUE:
$258,096,445.52
Corey Seager – Dodgers SS
TOTAL SURPLUS VALUE:
$311,915,858.51
Sample Size Analysis
A balancing act between younger and older players
 Younger – can be paid at a discount, but, less of a track record
 Older – command more money, but, proven track record
Variance formula
 Mean = (career WAR) / (career seasons played)
 Divided by (# of games played) – 1
Fielding Profile
Player UZR DRS
Lindor 20.8 17
Betts 17.8 32
Bryant 5.3 (3B) / 6.2 (OF) 9
Trout -0.3 6
Seager 10.6 0
The players that derive the most value from their defense are
Francisco Lindor and Mookie Betts.
FanGraphs uses UZR as its main component of WAR, and all five
players are within 20 runs of each other.
Assuming the value of one win is 10 runs, the most WAR defense
would likely account for is two wins.
Defensive Metric Variability
According to the FanGraphs glossary, there is a high
level of variability in UZR. For example, UZR is
given a five-run error range in either direction.
Therefore, a UZR of +10 could be either +5 or +15.
Because FanGraphs’ WAR rating uses defensive
metrics that are less exact to evaluate, we believe
that offensive performance should be weighted
more heavily than defense in terms of predicting
future performance.
2016 Player Profiles
Player Soft % Med % Hard % wRC+ wOBA
Trout 12.0 46.3 41.7 171 .418
Bryant 17.0 42.7 40.3 149 .396
Seager 12.7 47.6 39.7 137 .372
Betts 17.4 49.2 33.4 135 .379
Lindor 17.2 55.2 27.5 112 .340
Mike Trout has the best wRC+, Hard Hit %, and wOBA
There seems to be a slight correlation between
Hard Hit % and wRC+
Accounting for Changes in the Game
In late May, ESPN reported that MLB’s Competition
Committee agreed to raise the strike zone.
The Strike Zone is to be moved to the top of the hitter’s
knees from “the hollow beneath the kneecap” currently.
With fastball velocity continuing to increase, we believe
that this will result in more pitchers challenging hitters
up in the zone.
The “bottom of the zone” will no longer belong to
pitchers.
Tying It All Together
We believe that Corey Seager and Kris Bryant are going
to be the most positively affected by an upward shift in
the strike zone.
Francisco Lindor is the player most likely to be
negatively affected by the strike zone shift.
We do not believe Mike Trout will be particularly
affected in any drastic way due to his five full seasons
of high-level performance. If pitchers have not figured
him out by now, there is no indication that they will.
Mike Trout
#3
1. TOTAL SURPLUS VALUE:
$236,765,429.42
2. Four years of Team Control
3. Best Hard Hit %, wOBA, and
wRC+
4. Projected 50.7 WAR between
2017-2021
1. TOTAL SURPLUS VALUE:
$258,096,445.52
2. Five years of Team Control
3. 2nd
best Hard Hit % and 2nd
highest wRC+
4. Projected 41.4 WAR from
2017-2021
Kris Bryant
#2
1. TOTAL SURPLUS VALUE:
$311,915,858.51
2. Five years of Team Control
3. 3rd
best Hard Hit % and 3rd
highest wRC+
4. Projected 47.2 WAR from
2017-2021
Corey Seager
#1
Questions?

Columbia University Baseball Analytics Case Competition

  • 1.
    TheThree MostValuable Position Playersin MLB University of Florida Ronnie Socash RJ Walsh Tanner Crouch Danny Lueck
  • 2.
    Table of Contents 1.PreliminaryProcess – Find the original pool of players 2.Statistical Analysis – Projecting Future Performance 3.MarketValue – Comparable players; predict future contracts 4.Risks – Identify potential pitfalls 5.Identification – Five MostValuable Position Players 6.Case Study – Analysis of the final cut 7.The FinalThree
  • 3.
    Preliminary Process • Step1: Identify the original pool of players – Position playerWAR leaders – Future and recent top prospects • Step 2: Build a database of 20 possible players – Name,Team, Age, Seasons Played, Games Played,WAR over last three seasons (if applicable)
  • 4.
  • 5.
    Projecting Future WAR R2 =.91 Database of players from 1986 - 2016 WAR = -3.9352 + 36*(age) - .0062*(age2 )
  • 6.
    Statistical Analysis Apply thepercentage change from year to year to each player Use the average of the last two seasons of WAR for each player
  • 7.
    Example: Nolan Arenado Ageat 2017 Opening Day: 25 2015 WAR: 4.5 2016 WAR: 5.2 (5.2 + 4.5) / 2 = 4.9 WAR 2017 projection: 4.9 * (slope change from “24 to 25”) = 4.9 * (1.049073) = 5.1 WAR 2018 projection: 5.1 * (slope change from “25 to “26”) = 5.1 * (1.036205) = 5.3 WAR Process repeated through the 2021 season
  • 8.
    Converting WAR IntoDollars $7 million per marginal win in 2017  5% increase each year. Nolan Arenado: –2017: 5.1 predicted WAR * ($7,000,000) = $35,616,028.35 –2018: 5.3 predicted WAR * ($7,350,000) = $38,750,766.66 –Continue through 2021 –Add all five dollar figures to calculate total 5-year future value in terms of WAR –Over next 5 seasons: 26.7 WAR and $207,276,574.20 Production Value
  • 9.
    Projecting Future Salary Step1: Identify Comparable Players Comparable Player Qualifications: -Same Position -Within 3 years of age at time of breakout/peak - Peak/Breakout seasons within 1.5 WAR
  • 10.
    League Projected SalaryIncrease Similar to the Qualifying Offer, we used the average of the top 125 contracts over the last 10 years We then created a linear model to predict future increases • R2 value of .96 • Avg. Salary = -1.14B + 573,300*(year)
  • 11.
    Example: Manny Machado ComparablePlayers: Pablo Sandoval and Kyle Seager • Machado entered 1st year of arbitration after 6.8 WAR season • Sandoval entered 1st year of arbitration after 5.3 WAR season • Seager entered 1st year of arbitration after 5.4 WAR season • Machado (24), Sandoval (25), Seager (27) • All play third base
  • 12.
    Projecting Arbitration • Usethe comparable player salaries during similar career points • Calculate the percentage of the QO that players made in those years • Adjust the current player’s salary to reflect the percent change
  • 13.
  • 14.
    Final Adjustment  IfMachado’s production was equal to Seager or Sandoval, we would expect Machado to receive same percentage of the QO.  In order to adjust for the difference in production of the current player, we then multiplied the projected salary by the percent difference in WAR over the three previous seasons.
  • 15.
  • 16.
  • 17.
  • 18.
    Mookie Betts –Red Sox CF TOTAL SURPLUS VALUE: $221,626,813.59
  • 19.
    Mike Trout –Angels CF TOTAL SURPLUS VALUE: $236,765,429.42
  • 20.
    Francisco Lindor -Indians SS TOTAL SURPLUS VALUE: $247,817,480.85
  • 21.
    Kris Bryant –Cubs 3B/OF TOTAL SURPLUS VALUE: $258,096,445.52
  • 22.
    Corey Seager –Dodgers SS TOTAL SURPLUS VALUE: $311,915,858.51
  • 23.
    Sample Size Analysis Abalancing act between younger and older players  Younger – can be paid at a discount, but, less of a track record  Older – command more money, but, proven track record Variance formula  Mean = (career WAR) / (career seasons played)  Divided by (# of games played) – 1
  • 24.
    Fielding Profile Player UZRDRS Lindor 20.8 17 Betts 17.8 32 Bryant 5.3 (3B) / 6.2 (OF) 9 Trout -0.3 6 Seager 10.6 0 The players that derive the most value from their defense are Francisco Lindor and Mookie Betts. FanGraphs uses UZR as its main component of WAR, and all five players are within 20 runs of each other. Assuming the value of one win is 10 runs, the most WAR defense would likely account for is two wins.
  • 25.
    Defensive Metric Variability Accordingto the FanGraphs glossary, there is a high level of variability in UZR. For example, UZR is given a five-run error range in either direction. Therefore, a UZR of +10 could be either +5 or +15. Because FanGraphs’ WAR rating uses defensive metrics that are less exact to evaluate, we believe that offensive performance should be weighted more heavily than defense in terms of predicting future performance.
  • 26.
    2016 Player Profiles PlayerSoft % Med % Hard % wRC+ wOBA Trout 12.0 46.3 41.7 171 .418 Bryant 17.0 42.7 40.3 149 .396 Seager 12.7 47.6 39.7 137 .372 Betts 17.4 49.2 33.4 135 .379 Lindor 17.2 55.2 27.5 112 .340 Mike Trout has the best wRC+, Hard Hit %, and wOBA There seems to be a slight correlation between Hard Hit % and wRC+
  • 27.
    Accounting for Changesin the Game In late May, ESPN reported that MLB’s Competition Committee agreed to raise the strike zone. The Strike Zone is to be moved to the top of the hitter’s knees from “the hollow beneath the kneecap” currently. With fastball velocity continuing to increase, we believe that this will result in more pitchers challenging hitters up in the zone. The “bottom of the zone” will no longer belong to pitchers.
  • 33.
    Tying It AllTogether We believe that Corey Seager and Kris Bryant are going to be the most positively affected by an upward shift in the strike zone. Francisco Lindor is the player most likely to be negatively affected by the strike zone shift. We do not believe Mike Trout will be particularly affected in any drastic way due to his five full seasons of high-level performance. If pitchers have not figured him out by now, there is no indication that they will.
  • 34.
    Mike Trout #3 1. TOTALSURPLUS VALUE: $236,765,429.42 2. Four years of Team Control 3. Best Hard Hit %, wOBA, and wRC+ 4. Projected 50.7 WAR between 2017-2021
  • 35.
    1. TOTAL SURPLUSVALUE: $258,096,445.52 2. Five years of Team Control 3. 2nd best Hard Hit % and 2nd highest wRC+ 4. Projected 41.4 WAR from 2017-2021 Kris Bryant #2
  • 36.
    1. TOTAL SURPLUSVALUE: $311,915,858.51 2. Five years of Team Control 3. 3rd best Hard Hit % and 3rd highest wRC+ 4. Projected 47.2 WAR from 2017-2021 Corey Seager #1
  • 37.

Editor's Notes

  • #6 Survivorship Bias 95% confidence interval: Understanding the lower and upper bounds is crucial.
  • #14 Assuming Machado, Sandoval and Seager are the same
  • #17 2012: Carlos Correa 1st, Addison Russell 11th, Corey Seager 18th