![GR Advisory & Training – Advanced Finance Program
The expected return can be defined as the probability-weighted average of possible return which is known as the
Mean in statistical parlance. To understand what the expected return means, let us consider a simple example of
scenarios where three returns 8%, 12% and 18% are possible with the chance of occurring at 40%, 30%, 30%
respectively. The expected return of the investment is:
Expected Return = (0.4 * 8%) + (0.3 * 12%) + (0.3*18%) = 12.2%
i.e. E(X) = X* P(X)
It may be noted that the probability of occurrence of the various possible returns has to be assigned by the
management based on various factors like the state of the economy, demand, competition, etc.
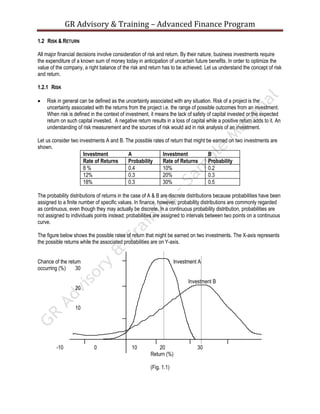
Going back to the figure, prima- facie, we find that the investment B offers higher return than A. But, there is another
factor to be considered before deciding on which investment to make - the variation in possible returns. A closer look
at the figure shows that the spread or dispersion of possible returns is much higher in the case of B i.e. from a
negative 10% to over 30% which indicates higher risk. Compared to B, possible returns from investment A is spread
to a lesser extent from a negative 5% to 22% signifying a lower risk. Thus, risk refers to the dispersion of possible
returns about an investment’s expected return. The considerable amount of bunching of returns in the case of A
means that the investment risk is low. The possible returns are less bunched or more dispersed about the expected
return in the case of B which indicates a high risk associated with it.
One way to measure this clustering tendency is to calculate a probability weighted average of the deviations of
possible returns from the expected return. One such average is the standard deviation of returns.
Possible Returns in Probability Deviation from expected Square of deviation from
% in Investment A return expected return
X P(X) (X - E(X)) P(X)*(X-E(X))2
8 0.4 -4.2 7.1
12 0.3 -0.2 0.0
18 0.3 5.8 10.1
Standard deviation = [0.4 * (8% -12.2%)2 + 0.3 * (12% - 12.2%)2 + (0.3 * (18% - 12.2%)2]
= 4.1%
i.e. SD = P(X) * (X- E(X))2
Thus standard deviation of expected returns from an investment is a measure of risk in the investment.
The details of calculating an investment’s mean return and standard deviation of returns is explained in Appendix 1.0
with examples.
1.2.2 SOURCES OF RISK
Consider an investor’s investment in a debenture issue of a company -of face value of Rs.100/-, a coupon rate of
14% for a tenure of 5 years. Let us look at factors which induce risk:
Market Risk: Market risk arises out of the general economic climate and factors affecting it like depression,
inflation, wars, political climate, government policy shift etc. In these situations the sentiment in the markets may
not as good as normal times and even if the company that issued the debenture may be doing well, the price of
the bond may be depressed as investors may not feel comfortable buying them given the overall pessimistic](data:image/gif;base64,R0lGODlhAQABAIAAAAAAAP///yH5BAEAAAAALAAAAAABAAEAAAIBRAA7)
Recommended
More Related Content
What's hot
What's hot (20)
Viewers also liked
Viewers also liked (20)
Similar to GR Advisory Advanced Finance Program Risk & Return
Similar to GR Advisory Advanced Finance Program Risk & Return (20)
Recently uploaded
Recently uploaded (20)
GR Advisory Advanced Finance Program Risk & Return
- 1. GR Advisory & Training – Advanced Finance Program 1.2 RISK & RETURN All major financial decisions involve consideration of risk and return. By their nature, business investments require the expenditure of a known sum of money today in anticipation of uncertain future benefits. In order to optimize the value of the company, a right balance of the risk and return has to be achieved. Let us understand the concept of risk and return. 1.2.1 RISK Risk in general can be defined as the uncertainty associated with any situation. Risk of a project is the uncertainty associated with the returns from the project i.e. the range of possible outcomes from an investment. When risk is defined in the context of investment, it means the lack of safety of capital invested or the expected return on such capital invested. A negative return results in a loss of capital while a positive return adds to it. An understanding of risk measurement and the sources of risk would aid in risk analysis of an investment. Let us consider two investments A and B. The possible rates of return that might be earned on two investments are shown. Investment A Investment B Rate of Returns Probability Rate of Returns Probability 8% 0.4 10% 0.2 12% 0.3 20% 0.3 18% 0.3 30% 0.5 The probability distributions of returns in the case of A & B are discrete distributions because probabilities have been assigned to a finite number of specific values. In finance, however, probability distributions are commonly regarded as continuous, even though they may actually be discrete. In a continuous probability distribution, probabilities are not assigned to individuals points instead; probabilities are assigned to intervals between two points on a continuous curve. The figure below shows the possible rates of return that might be earned on two investments. The X-axis represents the possible returns while the associated probabilities are on Y-axis. Chance of the return Investment A occurring (%) 30 Investment B 20 10 -10 0 10 20 30 Return (%) (Fig. 1.1)
- 2. GR Advisory & Training – Advanced Finance Program The expected return can be defined as the probability-weighted average of possible return which is known as the Mean in statistical parlance. To understand what the expected return means, let us consider a simple example of scenarios where three returns 8%, 12% and 18% are possible with the chance of occurring at 40%, 30%, 30% respectively. The expected return of the investment is: Expected Return = (0.4 * 8%) + (0.3 * 12%) + (0.3*18%) = 12.2% i.e. E(X) = X* P(X) It may be noted that the probability of occurrence of the various possible returns has to be assigned by the management based on various factors like the state of the economy, demand, competition, etc. Going back to the figure, prima- facie, we find that the investment B offers higher return than A. But, there is another factor to be considered before deciding on which investment to make - the variation in possible returns. A closer look at the figure shows that the spread or dispersion of possible returns is much higher in the case of B i.e. from a negative 10% to over 30% which indicates higher risk. Compared to B, possible returns from investment A is spread to a lesser extent from a negative 5% to 22% signifying a lower risk. Thus, risk refers to the dispersion of possible returns about an investment’s expected return. The considerable amount of bunching of returns in the case of A means that the investment risk is low. The possible returns are less bunched or more dispersed about the expected return in the case of B which indicates a high risk associated with it. One way to measure this clustering tendency is to calculate a probability weighted average of the deviations of possible returns from the expected return. One such average is the standard deviation of returns. Possible Returns in Probability Deviation from expected Square of deviation from % in Investment A return expected return X P(X) (X - E(X)) P(X)*(X-E(X))2 8 0.4 -4.2 7.1 12 0.3 -0.2 0.0 18 0.3 5.8 10.1 Standard deviation = [0.4 * (8% -12.2%)2 + 0.3 * (12% - 12.2%)2 + (0.3 * (18% - 12.2%)2] = 4.1% i.e. SD = P(X) * (X- E(X))2 Thus standard deviation of expected returns from an investment is a measure of risk in the investment. The details of calculating an investment’s mean return and standard deviation of returns is explained in Appendix 1.0 with examples. 1.2.2 SOURCES OF RISK Consider an investor’s investment in a debenture issue of a company -of face value of Rs.100/-, a coupon rate of 14% for a tenure of 5 years. Let us look at factors which induce risk: Market Risk: Market risk arises out of the general economic climate and factors affecting it like depression, inflation, wars, political climate, government policy shift etc. In these situations the sentiment in the markets may not as good as normal times and even if the company that issued the debenture may be doing well, the price of the bond may be depressed as investors may not feel comfortable buying them given the overall pessimistic
- 3. GR Advisory & Training – Advanced Finance Program outlook for the economy. Macro factors such as in instances mentioned above depress prices of assets and induce a risk of loss of capital invested and/or the returns. In the case of the bond investor, the bond price may fall to say Rs.95/- even though the company issuing it may be doing well and paying interest on time. This happens because in depressed conditions or situations where the outlook is depressed, there are more sellers than buyers for the asset, exercising a downward pressure on asset prices. Business Risk: This is the risk of carrying on a business in a particular industry or environment. For example, emergence of a strong competitor, removal of import protection given to the products of a company, a new substitute product emerging, a new technology coming up, etc. can affect the business prospects of a company and hence its sales / profits may fall and may lead to the company default in its payment of interest / principal. Interest Rate Risk: The interest rates keep changing due to Central Bank’s/ RBI’s credit policies which are tuned to the government’s plan on economic growth. Over the years interest rates moving up and down depending upon tight or easy money policy of the Central Bank. An investor in the above mentioned debenture is affected by the variability in the return due to change in interest rates. In the case of the debenture holder, if the overall interest rates have gone up and similar debentures are issued at coupons of 16% then the investor losses this opportunity and also suffers a notional loss of capital as the prices of the bond will also fall to adjust for the higher yield that is prevailing. Financial Risk: When the company leverages its equity capital beyond an optimum level then it runs a financial risk where its chances of defaulting on interest payments and principal repayments are high. The credit rating agencies may downgrade the company leading to a run on its short term borrowings leading to further problems. Default in interest / principal repayment may happen. In the above example if the company had a debt equity ratio of 1:1 when it issued the debenture and a year later if it borrows further money as a result of which the debt equity ratio becomes 1.5: 1, then it is more vulnerable to defaulting on principal and/or interest than a year before. Liquidity Risk: If the secondary market for the company’s debenture is not healthy, then the investor would not be able to immediately exit from the investment when desired. This means that the debenture does not have easy saleability leading to a liquidity risk for the investor. In the case of a company, an asset which can be bought and sold quickly without a significant price discount is considered liquid. If an asset or security does not have the liquidity then the investor is running a liquidity risk. Currency Risk : In the present Indian environment currency risks may not affect an investor’s exposure to a debenture directly (unless it is a debenture denominated in foreign currency), it has an indirect impact as a sharp depreciation in currency rates affect a company’s project if it has uncovered forex debt components which affect its returns. In the case of a company that has borrowed in foreign currency, depreciation in the value of rupee would mean higher outlay when the interest / principal repayment obligation comes up. Thus, a company that has borrowed $ 10 Mn. @ 10% p.a. when the Re was Rs.40/- to a US $ has an interest obligation of Rs.4 Mn. at the end of the year. However at the time of interest payment, if the Re has depreciated to Rs.45/- to a dollar, then the rupee outlay required is Rs.4.5 Mn. or Rs.0.5 Mn. more. This is the currency risk that the company carries. From the point of view of the debenture investor who is based outside India currency risk arises if the instrument is denominated in Indian Rupees. In such a situation the US $ equivalent will be lesser when 1$ = Rs.45/- compared to when 1 US$ = Rs.40/-.
- 4. GR Advisory & Training – Advanced Finance Program Note: Although the above risks have been mentioned in the context of an investor in a corporate debenture, the logic can be applied for a corporate / borrower point of view also. 1.2.3 RETURN The objective of any company is to maximize expected returns from its investments subject to the risk involved. The tangible returns to a company from a capital expenditure are in the form of cash inflows from the project. These cash flows are estimated using discounted cash flow techniques, which are discussed in detail under capital budgeting.