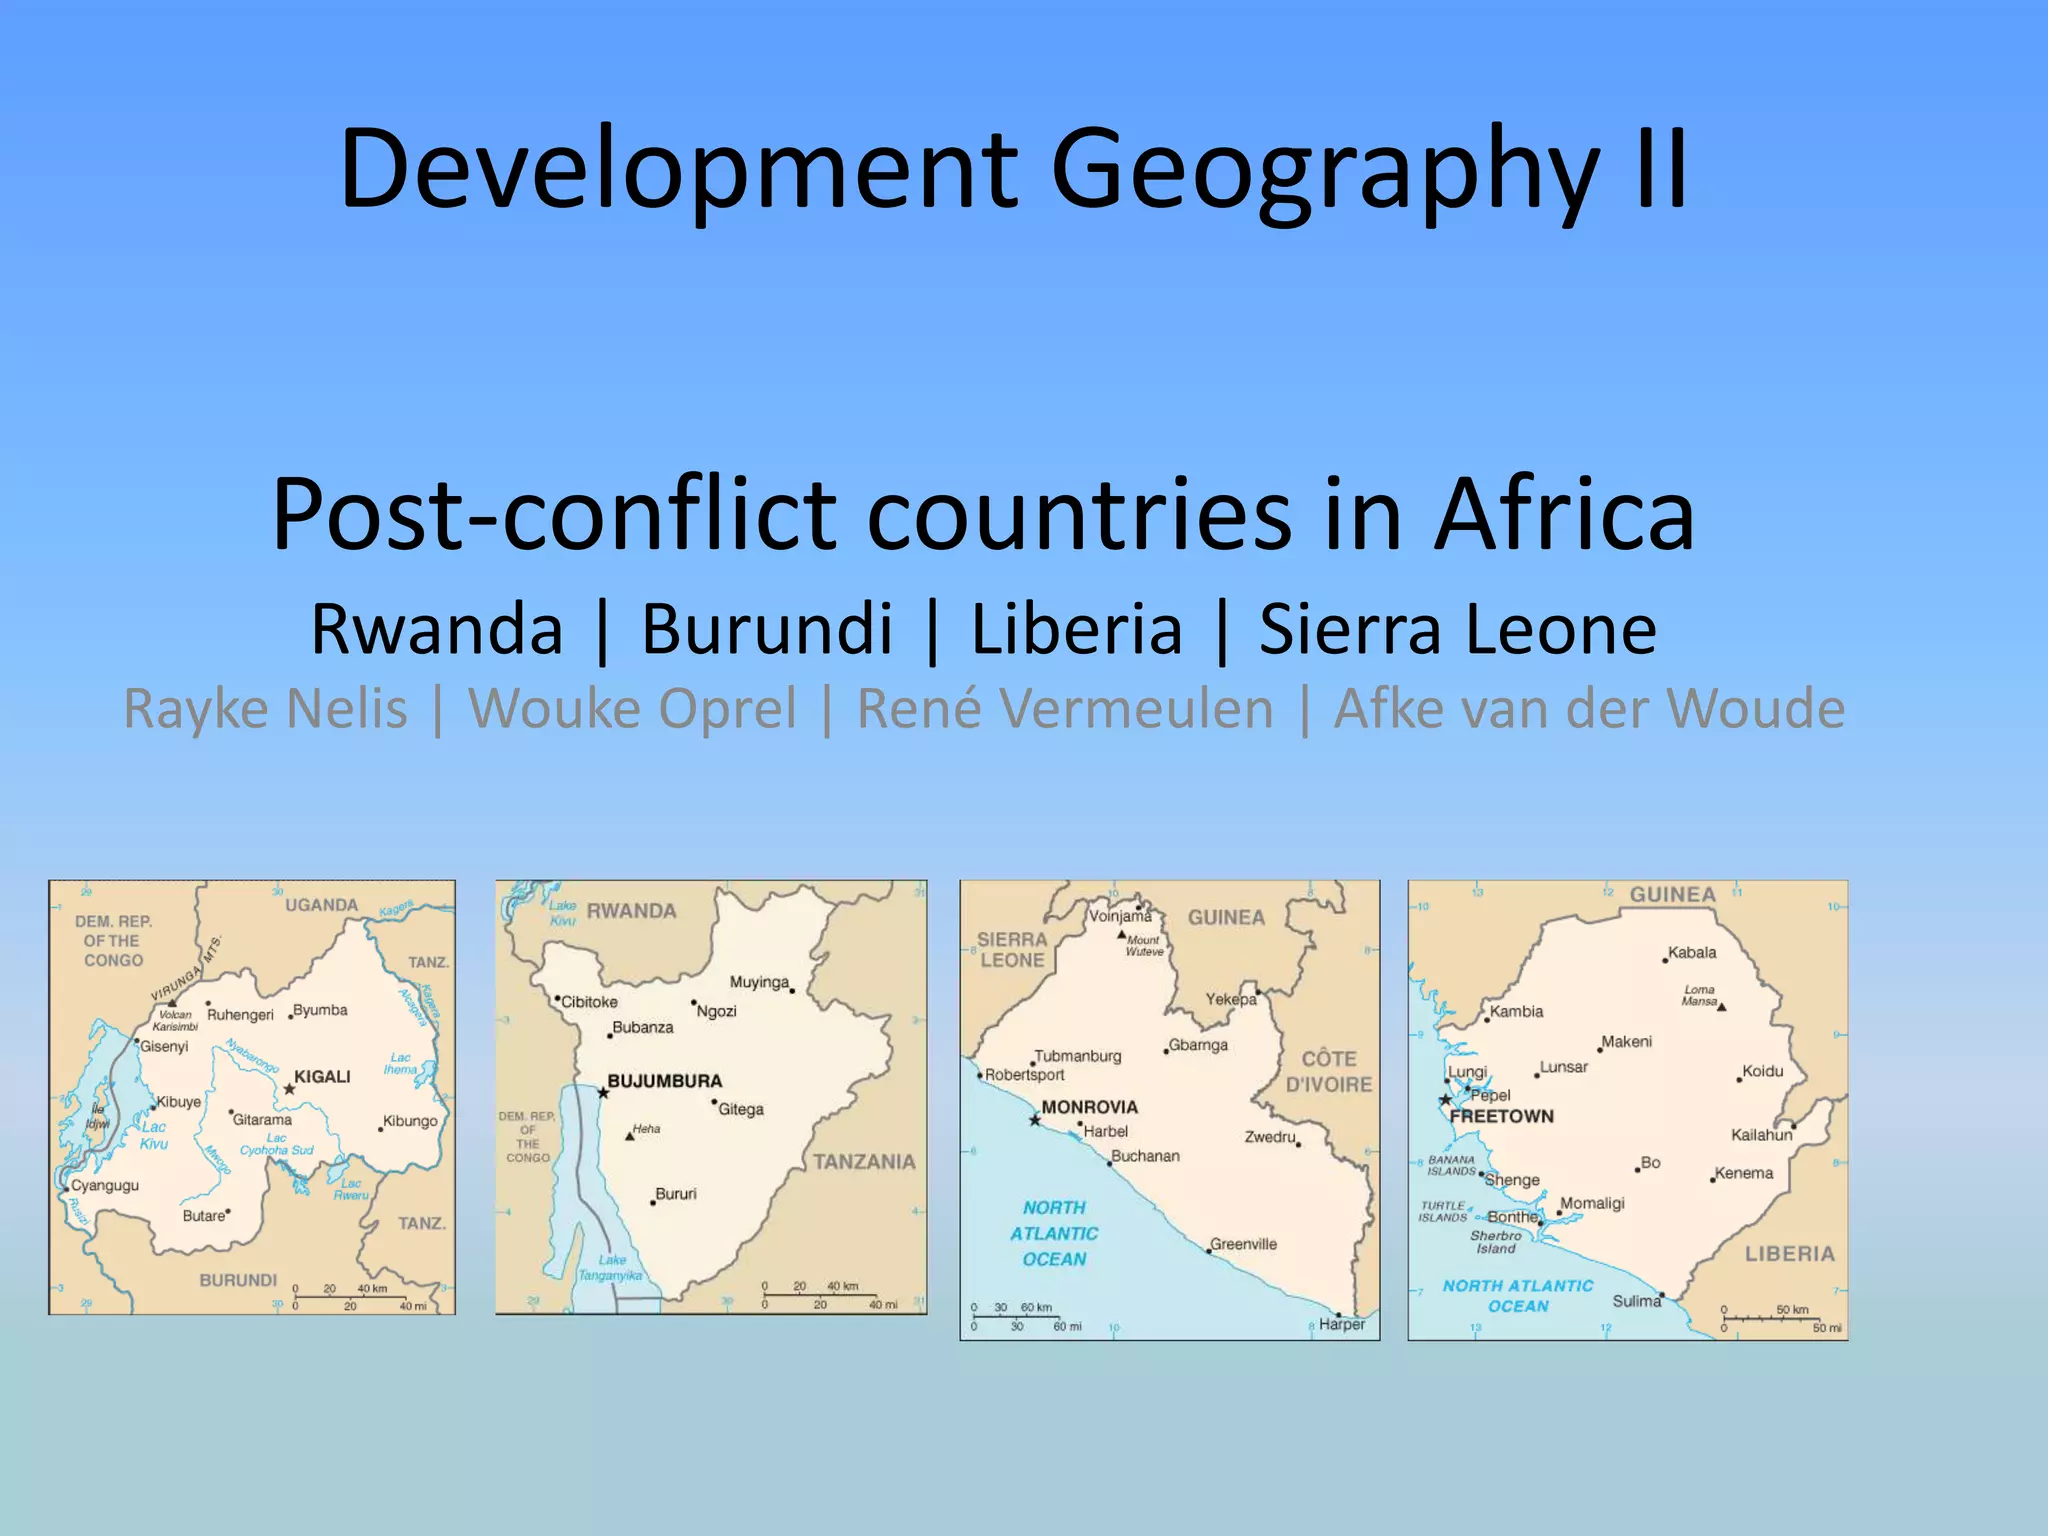
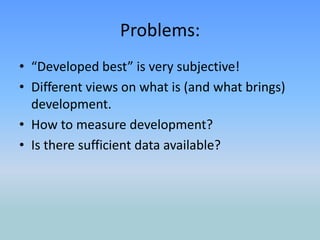
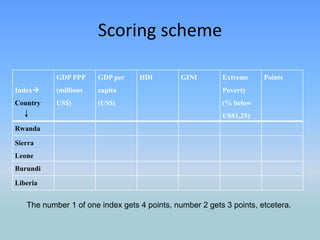
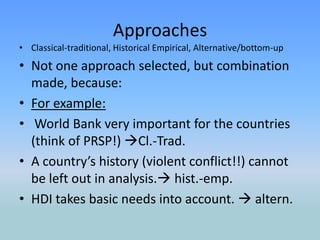
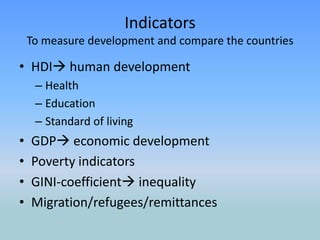
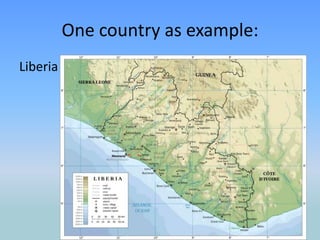
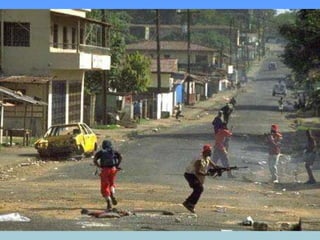
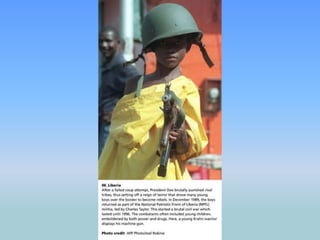
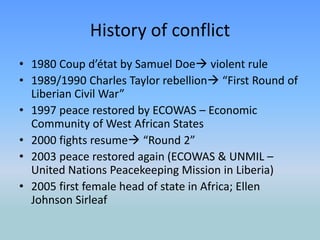
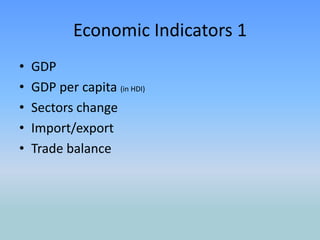
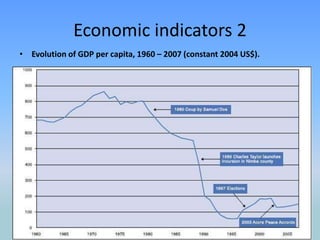
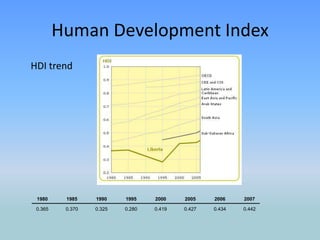
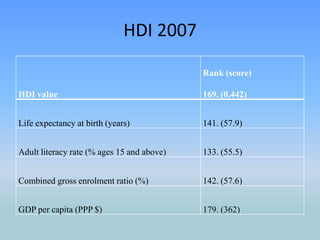
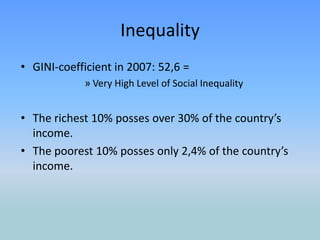
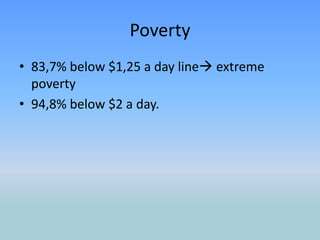
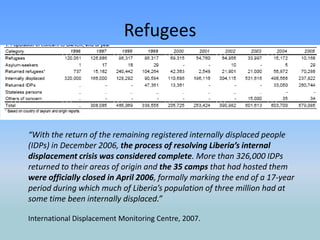
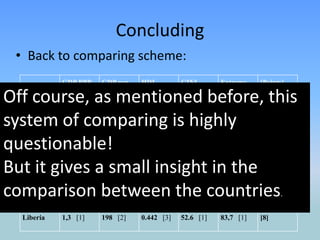
Development Geography IIPost-conflict countries in AfricaRwanda | Burundi | Liberia | Sierra LeoneRaykeNelis | Wouke Oprel | René Vermeulen | Afke van der Woude
Aim of the paper:To answer question:Which of the countries Rwanda, Burundi, Liberia and Sierra Leone performed best in the period 1990-2010?
Problems:“Developed best” is very subjective!Different views on what is (and what brings) development. How to measure development?Is there sufficient data available?
Scoring scheme The number 1 of one index gets 4 points, number 2 gets 3 points, etcetera.
ApproachesClassical-traditional, Historical Empirical, Alternative/bottom-upNot one approach selected, but combination made, because:For example: World Bank very important for the countries (think of PRSP!) Cl.-Trad.A country’s history (violent conflict!!) cannot be left out in analysis. hist.-emp.HDI takes basic needs into account.  altern.
IndicatorsTo measuredevelopment and compare the countriesHDI human developmentHealthEducationStandard of livingGDP economic developmentPoverty indicatorsGINI-coefficient inequalityMigration/refugees/remittances
One country as example:Liberia
Early historyFrom 1816 American Colonization Society 	(ASC)  resettled slaves to Africa.
1822 Settlement in Liberia.
1838 Commonwealth of Liberia.
1848 Recognition by other countries  20.000 	former slaves migrate from USA.
 Americo-Liberian elite unequal relation 	between returned slaves and indigenous 	groups.	History of conflict1980 Coup d’état by Samuel Doe violent rule
1989/1990 Charles Taylor rebellion “First Round of Liberian Civil War”
1997 peace restored by ECOWAS – Economic Community of West African States
2000 fights resume “Round 2”
2003 peace restored again (ECOWAS & UNMIL – United Nations Peacekeeping Mission in Liberia)
2005 first female head of state in Africa; Ellen Johnson SirleafTwo tracks for analysis:Economic Indicators “Human” (social) Indicators
Economic Indicators 1GDPGDP per capita (in HDI)Sectors changeImport/exportTrade balance
Economic indicators 2Evolution of GDP per capita, 1960 – 2007 (constant 2004 US$).
Economic Indicators 3Share of different sectors of the GDP in Liberia from 1987 to 2005Mind the gap
Economic Indicators 4Imports and exports in Liberia from 1978 to 2004.Mind the gap
Economic Indicators 5Trade balance of Liberia from 1978 to 2004 in millions US$.Trade balance in 2008  -500 million US$
Economic Indicators 6Real GDP and inflation in Liberia (outlook)Recently: influence World’s Credit Crisis.

Development Geography II