
Download as PDF, PPTX


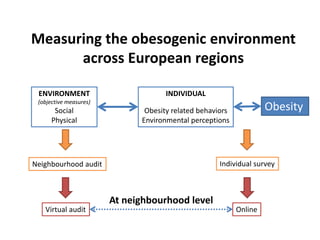
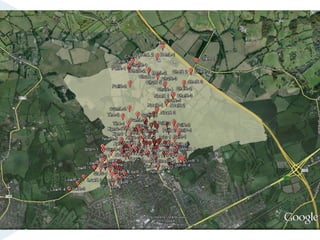
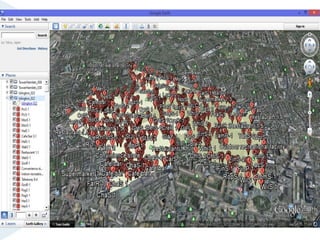
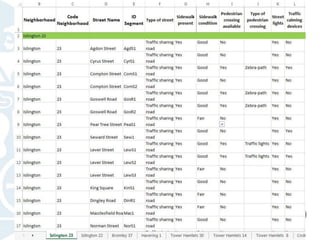
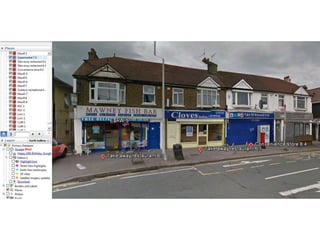
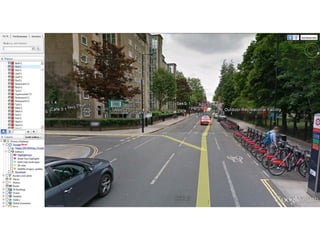
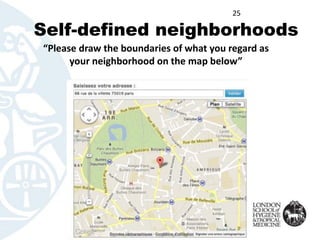
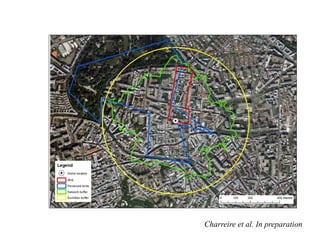
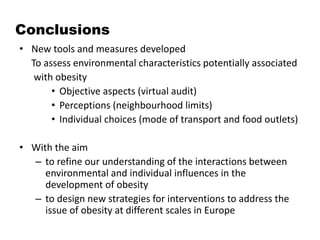

The document presents research on the relationship between physical environments and obesity, highlighting the concept of obesogenic environments that influence individual behaviors and weight status. It discusses the use of Google Street View for virtual audits to assess neighborhood characteristics and their impact on obesity-related factors in various European regions. The study aims to enhance understanding of environmental and individual interactions in obesity development and to inform intervention strategies.


