Detailed comparison of Brazilian and French obligation schemes to promote energy efficiency
•
0 likes•494 views

This document provides a detailed comparison of energy efficiency obligation schemes in Brazil and France. It summarizes the history and key aspects of Brazil's Utilities Energy Efficiency Program, which obligates electric utilities to invest 0.5% of revenues in energy efficiency projects. It describes how the program is monitored and evaluated, and presents data on investments and estimated energy savings from 1998-2011. Overall, the program has invested $1.74 billion and achieved estimated annual energy savings of over 1.54 GWh and peak demand reductions of 542 MW.

Recommended
More Related Content
What's hot
What's hot (20)
Viewers also liked
Viewers also liked (16)
Similar to Detailed comparison of Brazilian and French obligation schemes to promote energy efficiency
Similar to Detailed comparison of Brazilian and French obligation schemes to promote energy efficiency (20)
More from Gilberto De Martino Jannuzzi
More from Gilberto De Martino Jannuzzi (20)
Recently uploaded
Recently uploaded (20)
Detailed comparison of Brazilian and French obligation schemes to promote energy efficiency
- 1. Detailed comparison of Brazilian and French obligation schemes to promote energy efficiency Jean-Sébastien BROC, Ecole des Mines de Nantes, France Conrado Augustus MELO, UNICAMP, Brazil Gilberto JANNUZZI, UNICAMP, Brazil Abstract International comparisons of energy efficiency obligation schemes have provided a rich literature highlighting their key points and how complex they may be. This paper presents a detailed comparison of the Brazilian utilities’ Energy Efficiency Program and the French White Certificates Scheme, aiming at analyzing how they could learn from each other. The paper examines their preparation, implementation, and monitoring & evaluation system. Indeed, one always needs to go backstage to understand how it works in practice. This is essential when intending to replicating practices elsewhere. While in Brazil it was decided to set an obligation scheme based on expenditure targets, in France the introduction of White Certificates triggered a different approach with more emphasis on the technical aspects of projects and achievements of energy savings. Introduction Obligation schemes become increasingly important in energy efficiency policies, as in the current debates on the new Energy Efficiency Directive in the European Union. The proposal made by the European Commission in June 2011 would require Member States to establish national energy efficiency obligation schemes (article 6). This provision is supported by the European Parliament but rejected by many Member States. Therefore how it would be included in the final text remains uncertain. Whatever the result of this process, there is a clear trend for the development of obligation schemes, especially in the Eastern European countries (e.g., Poland, Hungary, Slovenia) (Lees, 2012). Brazil, Chile and Uruguay and other Latin American countries are also following this trend, but with different degrees of enforcement and success (Ruchansky et al 2011, CEPAL 2009). Such option has recently been investigated for India as well (Bhattacharya and Kapoor, 2012). There is thus a real interest in building detailed experience feedback from existing schemes in order to favor experience sharing. The literature about these schemes is rich, especially about explaining the main principles and theory, advantages/drawbacks, or reviewing achievements (Bertoldi et al., 2010; Capozza et al., 2006; Pavan, 2008; Vine and Hamrin, 2008)1. But there is very little practical experience feedback about how such schemes have been set up (rationales, preparation required, involvement of actors, etc.) and how the monitoring and evaluation are done in practice. This paper analyses two examples, the Brazilian and the French schemes. Both case studies review their history and rationales before focusing on the monitoring and evaluation practices. An overview of key achievements complements the comparison. Brazilian case 1 See also the deliverables of the EuroWhitCert project: http://www.ewc.polimi.it/
- 2. History and rationales of the utilities energy efficiency program in Brazil In Brazil there are three main public policy programs/mechanisms to promote electricity efficiency: 1) the National Electricity Energy Conservation Program (PROCEL) managed by Eletrobras2, a mix of support and market mechanism that promotes energy saving projects, the Procel Label, besides educational and informational practices; 2) the Minimum Energy Performance Standards (MEPS), a control mechanism that prohibits the commercialization of products not complying with specific limits of energy consumption and; 3) Utilities’ Energy Efficiency Program – EEP, a national public interest fund regulated by the Brazilian Electricity Regulatory Agency (ANEEL). This program is a mix of control and funding mechanism. Control because the electric utilities have 1% of their revenues regulated3 and funding because these resources are used to promote the utilities EEP and R&D activities. This fund is guaranteed by an increase in the value of the electricity tariff and growing electricity demand4. This paper only focuses on EEP. The EEP started in the mid-nineties with the power sector reform (privatizations and implemented changes in the management, organization and ownership of the utilities). After this reform, the initial concession contracts signed between electric power distribution companies and the granting authorities contained clauses that obliged these utilities to invest in energy efficiency and R&D activities. As described by Jannuzzi (2005) the focus on R&D activities changed over time and includes strategic research, electricity distribution and energy efficiency among others. In 1996 with the creation of ANEEL, these investments began to be monitored. In 1998, ANEEL established rules which defined more clearly the amount of annual investment, procedures for submission, approval and verification of utilities’ EEP. Table 1 shows the regulatory framework related to the evolution of EEP. Table 1. Regulatory framework related to utilities energy efficiency program (EEP). Year Bill/Decree/Resolution Description 1998 Resolution 242 Allocated 1% of revenues to EEP 1999 Resolution 261 Allocated 1% of revenues to EEP 2000 Resolution 271 Allocated 1% of revenues to EEP 2000 Bill 9991 Established that the electricity utilities should apply a minimum percentage of revenues in R&D and energy efficiency 2001 Decree 3867 Allocated 0.75% of revenues to R&D and 0.25 to end use EEP 2001 Resolutions 153 and 186 Allocated 0.5% of revenues to donation of compact fluorescent lamp (CFL) 2001 Resolution 394 Determined a maximum benefit- cost ratio of 0.85 2002 Resolution 492 Determined 0.5% of revenues to end use EEP 2004 Resolution 063 Regulated the penalties 2005 Resolution 176 Determined 0.5% of revenues to EEP up to 12/2005 and from 2006 0.25% 2006 Resolution 233 Establishes criteria for the calculation and application of resources of the Bill 9991 2007 Bill 11445 Postpones Bill 9991 up to12/2010 2008 Resolution 300 50% of resources for EEP should be invested in low income communities 2010 Bill 1212 Postpones the Bill 9991 up to12/2015 and establishes that 60% of the investments should be in households with social tariffs Source: ANEEL web site, http://www.aneel.gov.br/ 2 Eletrobras is a mixed economy and open capital stock corporation, with shares traded at São Paulo, Madrid and New York Stock Exchange. The Brazilian federal government is the majority stockholder. 3 The regulation set the levels of compulsory investments in EE and R&D done by electric utilities distributors. 4 The current formula used for tariff revisions is composed by 3 factors that include the variation of costs incurred by the distribution utility. One of these factors (representing 75% of the distributing utilities revenues) is based on the costs passed directly to consumers (transmission and energy purchases from generators, several taxes collected by the government through the utility Bill) and the investments in EE and R&D. These costs are not controllable by the utilities.
- 3. These initiatives culminated in the National Law 9.991/2000 that established that the electricity utilities should apply a minimum percentage of revenues in the EEP. This percentage has been 0.5% most of the time (even if reduced to 0.25% in some periods). The 0.5% is now guaranteed until December 2015 due to the Bill 12.212/2010. The regulator ANEEL is responsible for the operation of EEP, setting specific guidelines and supervising the utilities’ projects. During the period from 1997 until 2011, various types of projects and end uses have been introduced or prohibited. However, the most significant change was the resolutions and Bills which determined that a minimum of 50% (and since 2010, 60%) of the investments should be performed in low income communities and households with social tariffs. These low-income programs mainly consist up to now in donation of compact fluorescent lamps and refrigerators. The performed investments and the respective impacts by typology are described below. Main rules and working scheme of EEP All distribution utilities are obligated to invest in electricity efficiency and R&D activities. Up to now, no other type of energy is allowed, except for solar water heating in the replacement of electric showers. For generation and transmission companies this rule focuses on R&D activities whose aims are technology and innovation for the supply-side including renewable generation and smart grids. The fulfillment of this obligation involves the submission of a set of projects to ANEEL, on the date established in the concession contract. The projects must set goals, both in terms of concrete actions undertaken and of financial investments, pursuant to the guidelines defined in the Handbook of Energy Efficiency Programs - HEEP5: structure and presentation of projects, evaluation criteria and supervision, type of projects that can be performed with funds from EEP, and procedures for cost accounting and ownership of investments. There are penalties in case of non-compliance with the obligations. When the investments in the programs are not conducted in the period stipulated there is an incidence of a monthly interest rate based on the Selic6. Thus the failure of investment leads to greater investment requirement which penalizes the utilities. The distribution utilities can implement the projects by themselves or by contracting Energy Service Companies (ESCOs), which are usually engineering companies acting as energy companies. The actions are eligible in all sectors: industrial, commercial, public services, government buildings, rural, etc. At this point, it should be mentioned the political interest in setting a minimum of 60% of EEP investments in programs for low-income households. Monitoring & evaluation system ANEEL established that the utilities have the obligation of using the International Performance Measurement & Verification Protocol (IPMVP). This reference provides energy efficiency project buyers, sellers and financiers with a common set of terms to discuss key M&V project-related issues and establishes methods that can be used in energy performance contracts. However in the Brazilian case, the utilities have encountered several difficulties in the practical application of this methodology. First of all, there was not an extensive training program about the procedures of the IPMVP even less any kind of certification for people evaluating the projects. Moreover the main problem found by the companies is to adapt the IPMVP options for the projects. In a general way the utilities have chosen to make rapid measurements before and after the action, only considering power and energy consumption, for instance a week before and after of a refrigerator replacement. Other 5 This handbook is available at: http://www.aneel.gov.br/arquivos/PDF/aren2008300_2.pdf 6 Selic is applicable in the recovery, restitution or compensation of federal taxes and contributions.
- 4. variables that influence the energy consumption as weather conditions, seasonality, habit changes and level of occupation of the houses are not evaluated in most of the cases. In this way the estimates of reduction in peak demand and energy consumption are unreliable. This makes it difficult to predict the sustainability of implemented actions, without which the program loses its meaning. To comply with their obligations, the utilities should send reports for ANEEL to check the results. The main indicator checked by ANEEL is the cost benefit ratio, which should be at most 0.85. This evaluation considers the estimated energy savings and the respective investments. ANEEL does not perform ex-post verifications. The utilities are responsible for monitoring and evaluating their own projects. In practice there is no independent verification of the programs. Investments and energy saving impacts The EEP has a fundamental role in promoting energy efficiency market in Brazil: besides being the largest source of funding, its capillarity covers the whole country. Despite the difficulties in monitoring and verifying the impacts of program by utilities and the lack of ANEEL verification, this initiative has resulted in significant estimated impacts. Based on ANEEL data from 1998 to 2011, the EEP has invested nearly U$1.74 billion in energy efficiency in various sectors, generating electricity savings estimated of more than 1.54 GWh/year and avoiding a peak demand over 542 MW in the period of 2008 to 2011. These results are cumulative, e.g. for CFLs projects (Compacts Fluorescents Lamps) that are among the most frequent actions, the estimated energy savings take into account their lifetime. Table 2 shows the investments done in nominal terms (without correction for inflation). In the last period (2008-2011) the annual average of invested resources is more than 4 times the annual average of the previous period (1998 -2007). According to ANEEL data up to 2008, most of the investments were performed in the supply side (26%), public lighting (18.2%) and low income (12.6%). After the Resolution ANEEL 300/2008, the greater share (61%) was invested in low income households. Table 2. Investments made by typology for utilities energy efficiency programs (EEP). Typology 1998 - 2007 2008 - 2011 US$ 1000 Share projects US$ 1000 Share projects Low Income 78,795 12.6% 76 685,780 61.1% 171 Public Sector 60,020 9.6% 395 129,374 11.5% 204 Public Services 22,187 3.5% 114 71,125 6.3% 94 Solar Heating 5,582 0.9% 31 57,077 5.1% 29 Residential 50,721 8.1% 178 36,097 3.2% 19 Educational 13,974 2.2% 74 32,255 2.9% 34 Industrial 56,727 9.1% 285 26,430 2.4% 21 Trade and Services 36,346 5.8% 185 13,606 1.2% 108 Rural 8,609 1.4% 23 12,234 1.1% 56 Supply side 162,662 26.0% 221 3,217 0.3% 1 Municipal Energy Management 5,915 0.9% 27 2,368 0.2% 9 Energetic Audits 675 0.1% 11 0 0.0% 0 Public Lighting 113,954 18.2% 101 0 0.0% 0 Marketing 9,613 1.5% 114 0 0.0% 0 Training 683 0.1% 37 0 0.0% 0 Pilot Project 0 0.0% 0 14,994 1.3% 6 Co-generation 0 0.0% 0 37,763 3.4% 1 Total 626,466 100.0% 1872 1,122,319 100.0% 753 Source: ANEEL 2011 data. Table 3 presents the estimated impacts of energy saving. In the period 1998 to 2007, the industry was responsible for 52,5% of the energy savings while representing only 9.1% of the resources. A possible explanation is that the industrial sector is more intensive in the use of energy and provides
- 5. better conditions to perform the programs. As expected after 2008, 70.1% of the energy savings are related to the low income programs. Table 3. Energy saving and peak saving power of utilities energy efficiency program (EEP). Typology 1998 - 2007 2008 - 2011 Energy Share Peak saving Share Energy Share Peak saving Share savings power savings power GWh/ano % MW GWh/ano % MW Low income 217.3 4.0% 211.1 13.3% 1082.8 70.1% 413.6 76.4% Government 163.0 3.0% 97.4 6.1% 173.2 11.2% 39.6 7.3% Public services 108.6 2.0% 65.0 4.1% 77.8 5.0% 19.8 3.7% Solar heating 0.0 0.0% 0.0 0.0% 29.4 1.9% 14.2 2.6% Residential 543.2 9.9% 373.5 23.5% 51.8 3.4% 14.7 2.7% Educational 217.3 4.0% 32.5 2.0% 5.4 0.4% 1.6 0.3% Industrial 2.879.0 52.5% 97.4 6.1% 55.1 3.6% 18.7 3.4% Trade and Services 163.0 3.0% 48.7 3.1% 16.7 1.1% 5.3 1.0% Rural 54.3 1.0% 32.5 2.0% 27.6 1.8% 7.6 1.4% Supply side 760.5 13.9% 454.7 28.6% 0.5 0.0% 0.1 0.0% Public lighting 380.2 6.9% 178.6 11.2% - - - - Pilot project - - - - 22.5 1.5% 5.8 1.1% Co-generation - - - - 1.1 0.1% 0.3 0.1% Total 5.486.3 100.0% 1591.5 100.0% 1544.0 100.0% 541.2 100.0% Source: ANEEL 2011 data. French case Introducing the French White Certificates Scheme The French White Certificates Scheme (FWCS) has been established in July 2005 by the French Law n°2005-781 on the national energy strategy, after two years of national debates. It is one of the key instruments of the French energy efficiency policies (France, 2011). The energy savings obligations are decided by the government authorities, after consultation of the stakeholders (mainly the energy suppliers and ADEME, the French Agency for Environment and Energy Management). The accounting unit is in final energy savings cumulated over the action lifetime and discounted7, expressed in kWhcumac. The penalty in case of non compliance amounts to 2 c€/missing kWhcumac. The obligations are distributed among the obligated parties according to their respective market share in the residential and tertiary sectors (in terms of energy sales). For the first period, the two biggest suppliers (EDF and GDF-Suez) held respectively 55% and 25% of the obligations. Standardized actions have been defined in order to make the implementation more cost-effective, especially the registering and crediting of reported actions. Non-standardized (also called specific) actions may deliver certificates as well, but following a heavier process of validation. The eligibility and accounting rules for actions are detailed further on. The changes of the main general features between the first and second periods are summarized in Table 4. Then Figure 1 gives an overview of how the scheme works. 7 The certificates are delivered once when the action is registered after its implementation, and this amount of certificates represent the energy savings cumulated over the action lifetime. As the certificates are tradable goods, a discount rate (4%) has to be applied to take into account that the entire value is given once, while the energy savings will be achieved over time. For more details about the FWCS unit, see (Broc et al., 2011).
- 6. Table 4. Key features of the FWCS (based on data of DGEC, Directorate General for Energy and Climate). 1st period Transition 2nd period Timeline 01/07 2006 – 30/06/2009 01/07 2009 – 31/12/2010 01/01/2011 – 31/12/2013 Target 54 TWhcumac none 345 TWhcumac Achieve- 65.2 TWhcumac 98.1 TWhcumac effective target = 235.6 TWhcumac ment (or 21,7 TWhcumac /year) (or 65,4 TWhcumac /year) (whose 145.6 TWhcumac for “old” obligated parties, and 90 TWhcumac for “new” ones) (or 78,5 TWhcumac /year) Obligated suppliers of electricity, natural gas, n.a. same as 1st period + suppliers of fuel for parties fuel for heating, heat and cooling vehicles Eligible obligated parties + all organizations (for actions on their own obligated parties + local authorities, social parties8 estate or facilities or for actions outside their core business) housing landlords, and the national housing improvement agency (ANAH) FRENCH MINISTRY IN CHARGE OF ENERGY (DGEC) Defines the rules Set the obligations PUBLIC MONITORING AUTHORITIES Monitor the market Check & Deliver white (+database managed Check & Deliver white certificates certificates by a subcontractor) submit action files submit action files OTHER white buy OBLIGATED ELIGIBLE certificates PARTIES PARTIES MARKET energy savings sale obligations energy savings sale actions energy savings direct partnership actions Figure 1. Working scheme of the FWCS (based on (Cappe, 2006)). More information about implementation details can be found in (Capozza et al., 2006; Bodineau and Bodiguel, 2009, pp.32-40; Baudry and Osso, 2011). The FWCS rationale The move towards white certificates in France in the period 2004-2006 can be explained by a combination of factors. On the one hand, institutional reasons (opening process for electricity and gas markets from 2000 to 2007, change of government in 2002 from left to right9) pushed to consider new market-driven instruments. On the other hand, the context for energy efficiency (Kyoto protocol, increasing energy prices, etc.) implied increased ambitions transcribed in the first national action plan against climate change (2004) and then in the Law n°2005-781. Finally, the UK experience (Energy Efficiency Commitment) and on-going discussions in Italy about white certificates had also an influence on certain members of the DGEC and ADEME. From a theoretical point of view, a white certificates scheme offered key advantages to address this situation. By essence, its policy theory is in line with liberalized energy markets. And most of the costs of energy efficiency programs were supposed to be transferred from public bodies (i.e. ratepayers) to companies (i.e. consumers), thus limiting public expenses. Likewise, it should develop competition 8 The eligible parties are the bodies which can get white certificates for the energy savings actions they report. During the first period, the certificates of the eligible but non-obligated actors amounted to only 7.8% of the 65.2 TWhcumac. 9 Also in favor of the limitation of direct public expenses.
- 7. and markets for energy savings, leading to a higher cost-effectiveness of energy efficiency actions. Last but not least, it was meant to change the business model of energy companies, especially by mobilizing their commercial network and know-how to reach all energy consumers, and therefore to tackle the well- known large but scattered potentials in the residential and tertiary sectors (and to a lesser extent SME). The official priority of the scheme was indeed to support the energy efficiency improvement of the building stock. But the scheme is open to actions in other sectors to create a wider market and to involve as many actors as possible. There is very little public information about possible debates on the choice of a white certificates scheme. More is available about debates on the design and key features (Tabet, 2005): trading (or not) of certificates, scope of the scheme (list of obligated parties, criteria for eligible parties), definition of the target/obligations (unit, size), criteria for the eligibility of actions and related energy savings (especially baseline and additionality, see below), rules for the recovery of the costs (for the obligated parties), creating or not a public fund to ensure outlets for unsold certificates. One of the key success factors for launch of the scheme was the involvement of the stakeholders, in particular through the workgroups coordinated by ATEE10 (see below). Preparation of the scheme The concrete preparation of the scheme has started early 2004. But the effective start initially planned for the beginning of 2006 was delayed to July 2006. This was mainly due to the time needed for negotiations between public authorities and stakeholders for fixing the last practical details (especially rules for the registering and delivery of certificates) and finally for the legislative process (from the vote of the law to the publications of the related decrees and orders). Indeed the preparation of the scheme can be divided into three main parallel processes: 1) the general discussions between public authorities and stakeholders, 2) the definition of the administrative processes and technical rules, 3) the legislative process. This paper focuses on the definition of the administrative processes and technical rules, as this was very specific to the FWCS. It was mainly managed by three parties: the public authority (DGEC, Directorate General for Energy and Climate), ATEE (representing the stakeholders10) and ADEME. The public authority proposes the administrative processes (mainly for the registering and delivery of certificates), takes the final decisions for all rules (administrative and technical) and prepares the related official texts (decrees and orders of application). ATEE and ADEME provide their technical expertise, especially by preparing proposals of standardized actions. ATEE also gives a centralized stakeholders’ feedback about the administrative processes. Among all the tasks for preparing the scheme, the one requiring the largest work is the technical definition of the standardized actions. For each action, a standardized form has to be agreed upon, including the followings (see details in (Broc et al., 2011)): scope of the defined action, technical specifications, and calculations of the standardized unitary energy savings. The process to define and validate a new action/form is summarized in Figure 2 below. 10 Technical Association on Energy and Environment, whose members are energy suppliers, manufacturers of energy- using products, large energy consumers, professional organizations of the building sector, etc.; see www.atee.fr
- 8. 1-Proposal of a new action 2-Technical review of the 5-Review by ADEME action 3-Draft template and further discussions direct review of administrative with ATEE agreement compliance 4-Validation by ATEE 6-Final review and representative decision by DGEC 7-Official publication or rejection of by order the proposal DGEC Figure 2. Definition and validation of a standardized energy savings action in the French scheme11. About 150 experts have been involved in this process, which was organized in five workgroups (by sector). From April 2004 to August 2007, 75 meetings were held, leading to the proposal of 147 actions whose 93 were officially published at this time. This clearly represents significant costs for all parties, especially for the stakeholders. Moreover, this is an open process, as new actions can be proposed continuously or existing ones may need to be updated due to changes in regulations (see additionality below). Not to mention that once a period begins, the negotiations and discussions start about changes for the next one. These costs have not yet been assessed officially. Meanwhile, it is also the source of key benefits. The knowledge about energy savings potentials has increased substantially. The publication of the standardized actions (currently 239, covering all sectors12) has given them a valuable visibility and legitimacy. Even if not exhaustive (e.g., actions whose performance is not beyond the current regulation are not eligible), this offers a very rich view of opportunities of action. Perspectives of increased obligations push the actors to support innovation and development of new actions. Certain actions have also been proposed by professional organizations or manufacturers for their products or actions to be eligible for white certificates (e.g., actions in the agriculture sector). This is one of the reasons of the dynamic created in these workgroups. This dynamic has been a key success factor to involve the stakeholders and put energy efficiency on their agenda (including for companies outside the energy sector, like the building sector). To a certain extent, this has also prepared their involvement in the Grenelle de l’Environnement in 2007, which has been a major consultation process for environmental policies. These benefits would be even more difficult to quantify than the costs mentioned above. Another key element in the launch of the scheme is the series of workshops organized by ATEE and ADEME to inform the actors about its rules, opportunities, etc. The success encountered is also a good indicator of the interest raised about the scheme (15 workshops for a total of 450 participants for 2006-2007; and workshops have kept being held on a regular basis). Monitoring & evaluation system As mentioned above, the FWCS distinguishes two types of actions: standardized actions with fixed energy savings rates and standardized inquiry process, and non-standardized (or specific) actions following a case by case review process. Standardized actions are favored by the regulator, as their administrative costs are lower. They represented about 98% of the certificates delivered during the first 11 Based on guidelines published jointly by DGEC, ADEME and ATEE in 2011. 12 73 for residential, 97 for tertiary, 25 for industry, 19 for transport, 14 for agriculture and 11 for district heating.
- 9. period. Moreover the ADEME methodology for specific actions was not published until September 2011. The eligible actions are all actions saving energy or substituting fossil fuels by renewable sources for the heat consumption of buildings, implemented in all sectors except the ones covered by the Emission Trading Scheme (i.e. energy-intensive sectors). Further criteria apply in order to guarantee upstream the performance of the scheme: 1) the energy performance of the actions should be higher than the current regulation (technical or unitary additionality, compared to legal minimum requirements), 2) the actor submitting the actions to the public authority has to demonstrate its proactive role13 inducing the actions (additionality in terms of volume or activity14) and 3) the definition of the standardized actions include technical specifications, such as compliance with standards, conditions of implementation, etc. This latter provision is a quality insurance as regards the actions and their implementation. And this should be documented in the action file (see pieces required below). Due to policy objectives, special actions (against fuel poverty, training of building staff, R&D) are credited in terms of kWhcumac/euros invested, and bonuses may be applied. This offers flexibility for decision makers to define priority targets of actions. The roles of the main parties for monitoring & evaluation are summarized in Table 5 below. Table 5. Roles of the main parties as regards monitoring & evaluation. Public Authority ADEME Obligated parties Administration political supervision (DGEC) technical inquiry of specific preparation and submission of 15 16 actions action files central administration (PNCEE ) Monitoring regular state of progress monitoring of the energy internal monitoring (costs, etc.) efficiency markets subcontracting of the white feedback about administrative certificates registry17 process Evaluation global review of the scheme evaluation of the impacts internal evaluations (especially (energy savings, market cost-effectiveness) official reporting (see e.g., NEEAP) transformation)18 It is important to notice that the evaluation of the cost-effectiveness of the actions is implicitly transferred to the obligated parties, as no public funding is directly involved (no issue of best use of public money). They need to monitor the costs for ensuring their own cost-effectiveness, and for having evidences when negotiating the next period with the public authority. These data are strategic and kept confidential. ADEME and its subcontractors have to do their own estimates when performing a cost- benefit analysis of the scheme (Giraudet et al., 2011). Very few information is published by the obligated parties, and this remains often at an aggregated level (Baudry and Osso, 2011). 13 this requirement has been clarified for the second period, as it was not explicit in the official texts of the first period. It is now meant as any direct contribution (whatever its nature) to the person beneficiating of an energy saving action and making the implementation of this action possible. The proof of this contribution has to be included in the action file. 14 this was also ensured by the eligibility criteria for the actors submitting actions during the first period. 15 Inquiry of the actions files, random administrative controls, issuance of the certificates, etc. 16 A National Centre for White Certificates (PNCEE) has been created in September 2011. Before, the inquiry of the action files was done by the DRIRE (regional administration of the Ministry of Industry). However, the related activity varied a lot among regions, especially because the actors had to submit their files in the region of their headquarter (so mainly in Paris). Therefore, the national centre PNCEE was set up for efficiency reasons (its staff is specialized in the scheme) as well as to avoid discrepancies in the treatment of the files. 17 This registry is the official database where the amount, ownership and transactions of certificates are recorded. This online platform has also a public access where the global amount of transactions per month and the average price of certificates are published. This provides a monitoring of the certificates market. See www.emmy.fr 18 based on studies subcontracted to consultancies.
- 10. The administrative costs of the scheme amount to about 700 000€/year (France, 2011). The weight of the administrative process is a recurrent subject of criticism by the obligated parties. Baudry and Osso (2011) summarized the pieces required when submitting an action file19: • invoice or accounting file, as an evidence of the effective implementation of the action; • attestation of the installer as regards the same compliance purpose; • attestation of the beneficiary on the active and incentive role of the certificate claimer before the action20, giving the proof of its anteriority, and giving the exclusivity of certificates to the certificate claimer (to avoid multiple counting); • attestation of the beneficiary on the compliance of the actions with the specifications set in the forms of the related standardized actions. These two latter documents are new requirements for the second period. While bringing additional guarantees, this also increases the complexity of the scheme. Baudry and Osso report that the amount of paper to be classified for the 500,000 energy saving actions operated by EDF in the domestic market during the first period represented 500 linear meters. Due to the new rules and increased obligations, they expect this to be about 4 to 5 km for the second period. The experience feedback of the first period was also used to simplify the validation process. The concept of “action plan” was introduced. The principle is to certify beforehand the approach used by the eligible actor to induce actions (e.g., a commercial offer). Then all actions reported within this action plan can be validated more easily (as part of the required documents is similar). This offers a possibility of early check reducing the risk for an actor to prepare an action file that may be refused by the administration. Moreover, the maximum delay of inquiry by the administration for an action submitted by an eligible actor within an action plan is one month, being three months otherwise. This delay is a critical issue when the obligations increase, as it may create bottlenecks in the process. As regards the calculation methods, the process includes multiple consultation and reviews (see Figure 2 above) and is thus assumed to ensure the reliability of the ex-ante savings estimates: any participant in the workgroups can proposed a new action, but then 1) the details of this new action are discussed with the other participants (step 2 and 4), 2) ADEME experts give an independent opinion (step 5) and 3) DGEC takes the final decision (step 6). However, a few values may appear to overestimate certain energy savings, as for the case of condensing boilers analyzed in (Broc et al., 2011). This can be explained by political compromises in the negotiations of the scheme. The monitoring of the energy efficiency markets has been focused by ADEME on the analyses of the strategies and offers developed by the obligated parties, and on key indicators about the markets of building refurbishments. The latter is not specific to the FWCS, as this includes the impacts of complementary instruments, especially public financial incentives (tax credits and free loans). As regards ex-post evaluations, they have covered mostly the administrative process (experience feedback and random control of samples of action files). However, no ex-post evaluation about the verification of the energy savings is available yet. This should be now a priority. Achievements and trends 19 In addition, for around half of the action types, two additional documents are required to prove the compliance with their technical specifications (this applied already during the first period): the certificates related to materials or installed equipments, and the attestation of the installer qualification. 20 During the first period, the beneficiary of the action may not have been aware that the invoice of the action was given by the implementing company to an obligated party. End-users may have beneficiated (or not!) of an incentive linked to white certificates (e.g., soft loan, free energy audit) without being informed about the white certificates process.
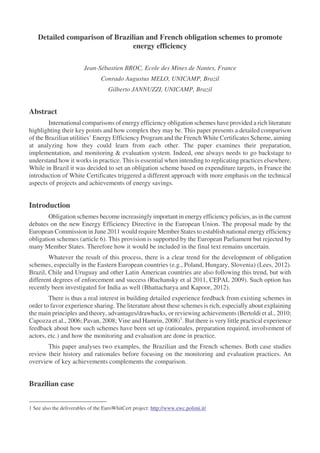
- 11. 12000 1st period transition 2nd period 600 250000 1st period transition 2nd period GWhcumac credited (cumulated over time) total credited savings (in GWh cumac) 10000 500 Non-detailed number of validated FWC files 200000 GWhcumac credited / month district heating VSD (elec. motors) Files validated / month 8000 400 150000 CFL 6540 insulation works 6000 300 SWH (overseas) 100000 biomass boilers 4000 200 heat pumps 50000 gas boilers 2000 100 1500 0 /0 0 7 /0 0 8 08 /1 0 8 /0 0 8 /0 0 9 /0 0 9 /0 0 9 09 0 /0 1 0 /0 1 0 10 10 30 /05 1 1 20 1 11 11 11 0 0 01 6/ 01 29 2/ 20 01 / 20 20 01 20 01 1/ 20 01 1/ 20 01 3/ 20 01 5/ 20 20 31 / 20 30 / 20 20 20 31 3/ 20 20 20 /2 /0 / 2 5/ 9/ 7/ 9/ 2/ 9/ 2/ 2 01 5 7 /1 /0 /0 /1 /0 /0 /1 Ap 08 Ap 09 Ap 10 Ap 11 O 08 O 09 O 10 O 11 / Ju 8 Ja 08 Ju 9 Ja 09 Ju 0 Ja 10 Ju 1 11 31 01 08 20 31 31 30 31 00 00 01 01 0 0 0 0 0 0 0 0 20 20 20 20 n2 n2 n2 n2 r2 r2 r2 r2 l2 l2 l2 l2 dates where data have been published by DGEC ct ct ct ct Ja (based on data published by DGEC every two to six months) Figure 3. (left) Monthly amount of certificates credited and files validated. Figure 4. (right) White certificates cumulated over time, per family of action type. In addition to the above monitoring results, Giraudet et al. ( 2011) have performed a cost-benefit analysis of the first period. Based on their estimates, the total costs would have been about €2 billion, whose €210 million borne by the obligated parties, €500 million by the beneficiaries and € 1.3 billion by other parties (mainly public funding through tax credits). This would represent on average 3.74 c€/kWh saved. The benefits would amount to about €4.32 billion in terms of avoided energy expenses. Moreover, as mentioned above, the first period has launched a true dynamic among the stakeholders. Interesting commercial offers have been developed, as well as partnerships with key implementing actors such as SME of the building sector (Bodineau and Bodiguel, 2009). In terms of market transformation, the quantitative impacts are difficult to assess already. The confirmation of the scheme until 2020 set the ground for the obligated parties to draw long-term strategies. However, the economic crisis is affecting households’ investment capacity. This adds uncertainties to the estimates made by DGEC about the contribution of the FWCS to French 2020 target for energy savings. Conclusions The two obligation schemes are quite different in their scope, implementation strategies and evaluation system. While in Brazil the approach has been controlling the expenditure on energy efficiency programs with some criteria regarding its cost-effectiveness (programs have to show a cost- benefit ratio no more than 0.85), the French case shows more focus on achieving actual or demonstrable energy savings. The need to have a credible certificate in the French case has implied a stronger effort to introduce a much more detailed procedure to define projects and evaluate them. This represents significant launching and learning costs, which can only be paid off on long term with obligation rates increased over time. In the short run the Brazilian approach is more easily implemented in such a large country with 64 very different distributing utilities serving different markets. However, overtime it seems that the procedures developed to design and validate the French White Certificate may be adapted to some utilities and regional markets in Brazil which also would have the necessary human expertise. Acknowledgements The Brazilian authors wish to thank FAPESP, the Research Council of the State of São Paulo, Brazil, for the grant received for the study of energy efficiency policy mechanisms and climate change mitigation options, FAPESP 08/580764.
- 12. References Baudry, P., Osso, D., 2011. Energy Saving Certificates in France: A new frame for the second period (2011-2013) and afterwards, Proceeding of the ECEEE 2011 Summer Study, 447-454. Bertoldi, P., Rezessy, S., Lees, E., Baudry, P., Jeandel, A., Labanca, N., 2010. Energy supplier obligations and white certificate schemes: Comparative analysis of experiences in the European Union. Energy Policy, 38(3), 1455-1469. Bhattacharya, T., Kapoor, R., 2012. Energy saving instrument – ESCerts in India. Renewable and Sustainable Energy Reviews, 16(2), 1311-1316. Bodineau, L., Bodiguel, A., 2009. Energy Savings Certificates (ESC) scheme in France: initial results, Proceeding of the ECEEE 2009 Summer Study, 669-675. Broc, J., Osso, D., Baudry, P., Adnot, J., Bodineau, L., Bourges, B., 2011. Consistency of the French white certificates evaluation system with the framework proposed for the European energy services. Energy Efficiency, 4(3), 371-392. Capozza, A., Devine, M., Enge, A.K., Grattieri, W., Monjon, S., Mundaca, L., et al., 2006. Market mechanisms for white certificates trading - Task XIV Final report. Prepared for the International Energy Agency (IEA- DSM). Cappe, D., 2006. Le dispositif des certificats d' économies d' énergie - stratégie et modalités pratiques, Réunion d'information et d' échanges sur les certificats d' économies d' énergie, avril 2006. CEPAL, 2009. Situación y Perspectivas De La Eficiência Energética En América Latina y El Caribe. CEPAL - Colección Documents De Proyectos. Santiago, Chile: Comissão Econômica das Nações Unidas para a América Latina - CEPAL. France, 2011. Energy Efficiency Action Plan for France. French 2nd NEEAP reported to the European Commission, prepared by MEDDTL and MINEFI. Giraudet, L.G., Bodineau, L., Finon, D., 2011. The costs and benefits of white certificates schemes. Energy Efficiency, Online First, 1-21. Jannuzzi, G.M. 2005. Power sector reforms in Brazil and its impacts on energy efficiency and research and development activities, Energy Policy, 33(13), 1753–1762. Jannuzzi, G.M., Rodrigues da Silva, A.L., DE MELO, C.A., Paccola, J.A. and Gomes, R.D.M., 2009. Measurement and verification of low income energy efficiency programs in Brazil: Methodological challenges, Proceedings of the ECEEE 2009 Summer Study, 521-526. Lees, E., 2012. Energy Efficiency Obligations - the EU experience. ECEEE briefing for DG Energy of the European Commission, 2 March 2012. Pavan, M., 2008. Tradable energy efficiency certificates: the Italian experience. Energy Efficiency, 1(4), 257-266. Ruchansky, B., de Buen, O., Jannuzzi, G. M., Romero, A., 2011. CEPAL - Eficacia Institucional De Los Programas Nacionales De Eficiencia Energética: Los Casos Del Brasil, Chile, México y El Uruguay. Recursos Naturales e Infraestrutura. Santiago, Chile: CEPAL. Tabet, J., 2005. A succinct synthesis of the French academic workshop on white certificates, IEA-DSM Task XIV workshop, Ecole des Mines de Paris, France, 9 March 2005. Vine, E., Hamrin, J., 2008. Energy savings certificates: A market-based tool for reducing greenhouse gas emissions. Energy Policy, 36(1), 467-476.