Download as PDF, PPTX

![Problem Definition
and Challenges
• Cancer Classification Problem
Challenges
1. Curse of dimensionality
2. Difficulty of data extraction
3. Only a few genes display relevancy to cancer diagnoses
4. In cancers domain we want to achieve, biological relevancy as well as
classification accuracy and reliability.
• DNA Microarray Technology [?]
• Gene Expression Profiles [?]](https://image.slidesharecdn.com/1-designofanintelligentsystemforimprovingclassificationofcancerdiseases-mrawippt-190528155333/75/Design-of-an-Intelligent-System-for-Improving-Classification-of-Cancer-Diseases-6-2048.jpg)

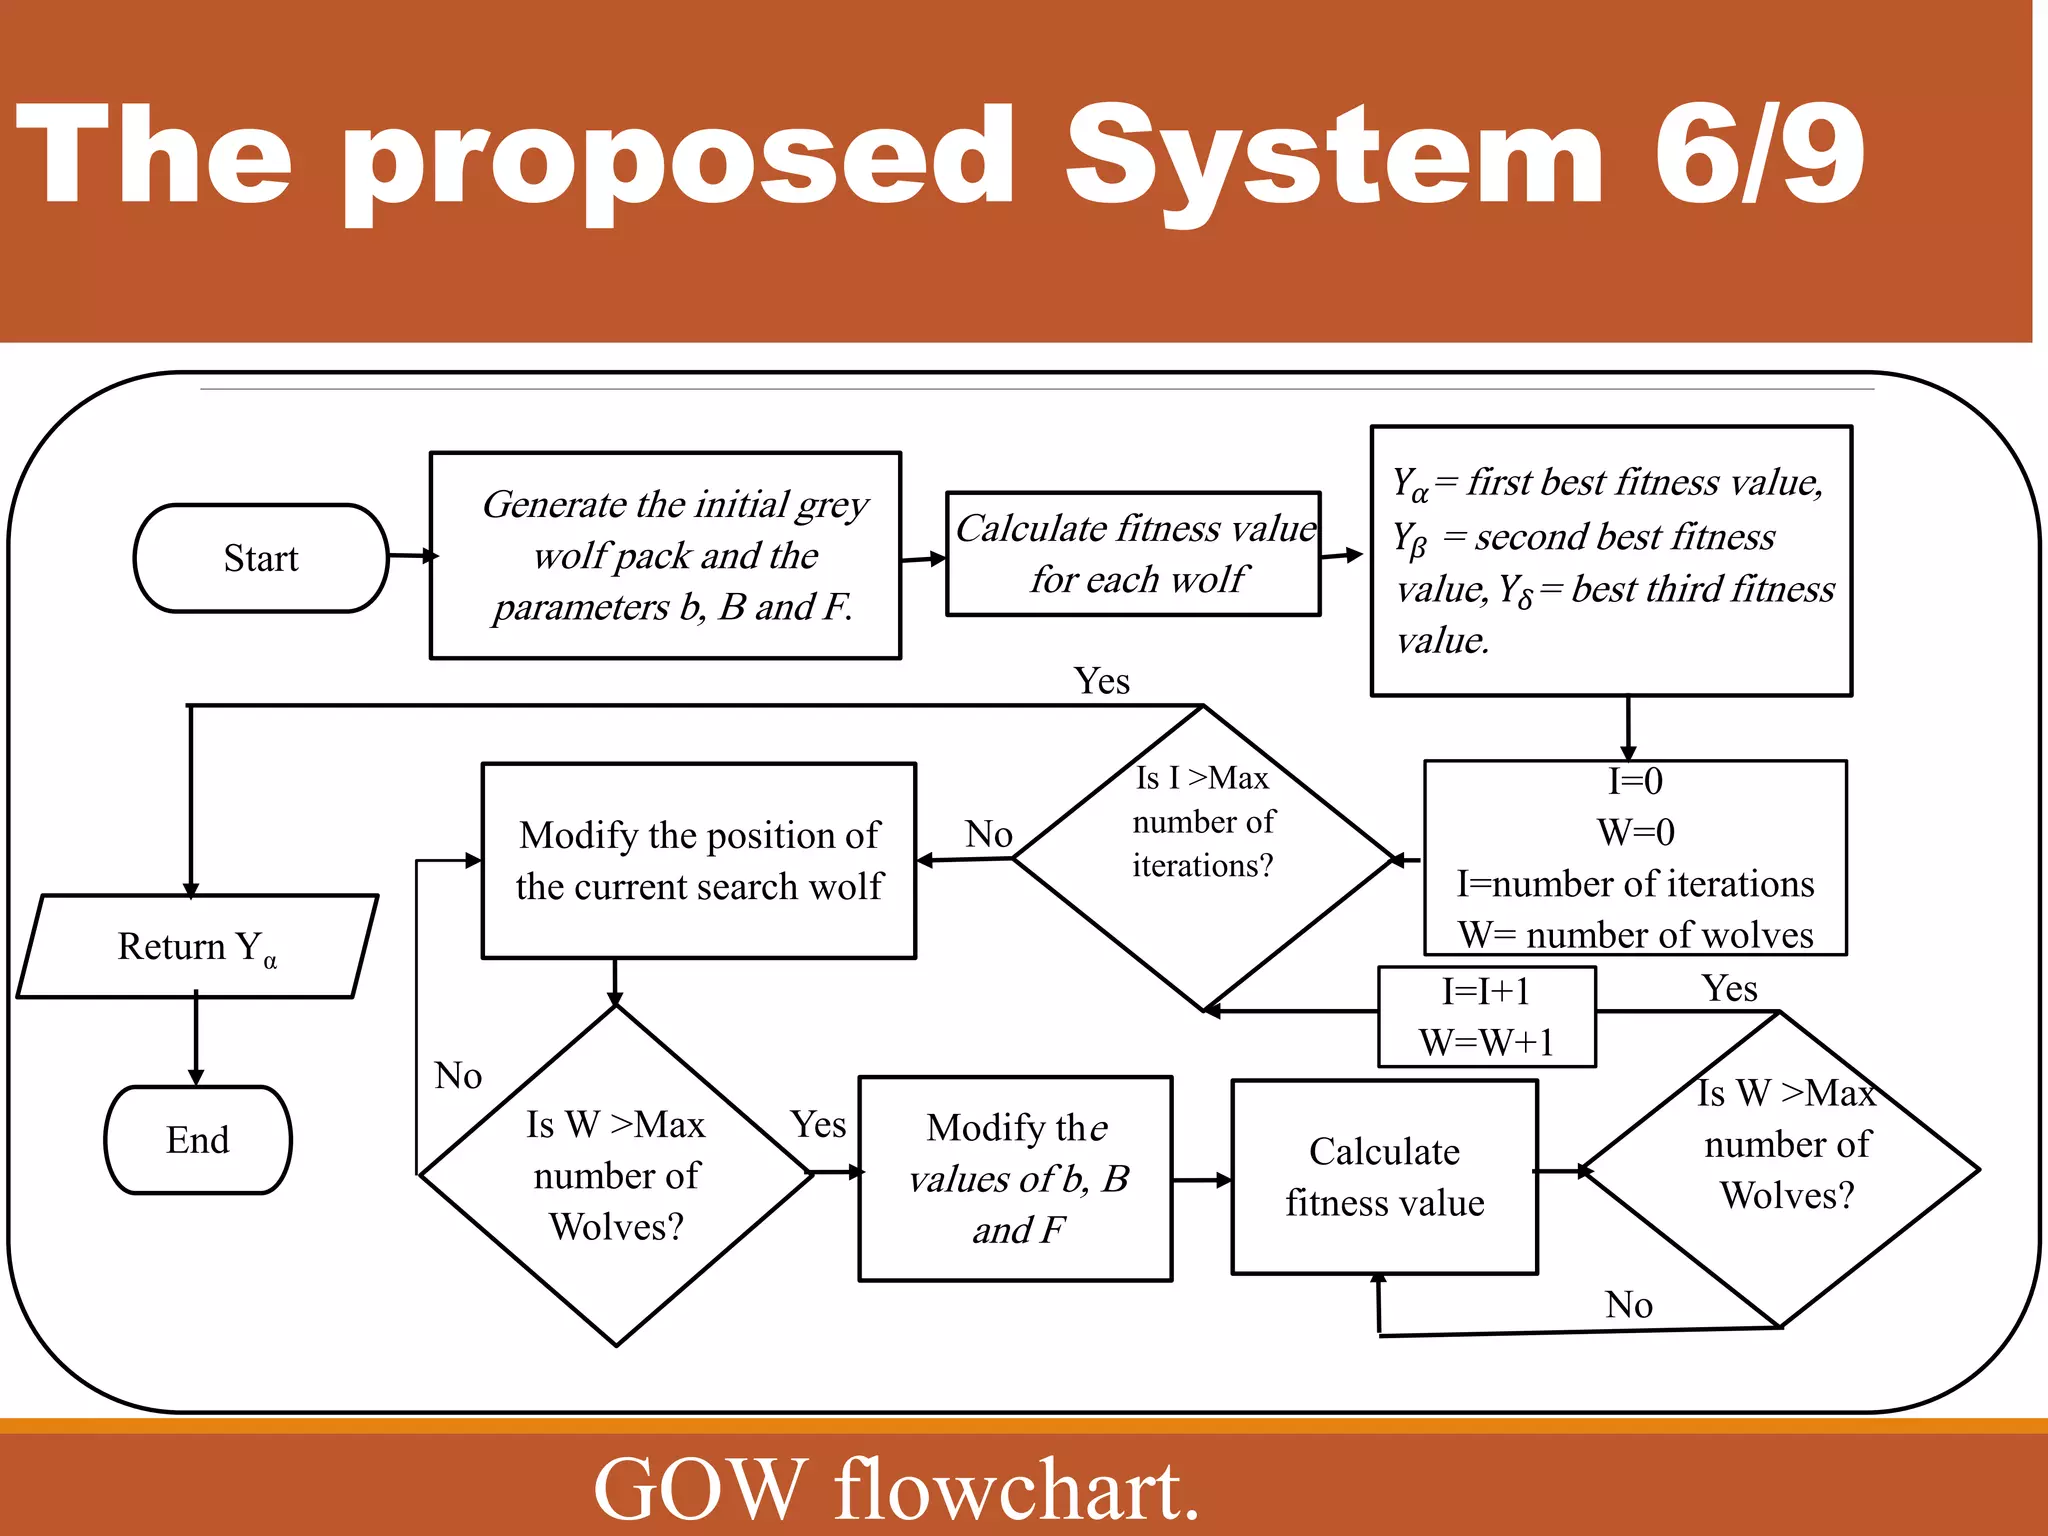
![The proposed System 7/9
Classification by Support Vector Machines
SVMs
Reference Dataset Classifier Accuracy in %
[6], weka tool CNS, Colon, Breast
C4.5 55, 76.19, 61
Naïve Bayes 63.3, 52.14, 51.89
IB1 55.79, 73.38, 60.22
In this work CNS, Colon, Breast SVM 70, 63, 65](https://image.slidesharecdn.com/1-designofanintelligentsystemforimprovingclassificationofcancerdiseases-mrawippt-190528155333/75/Design-of-an-Intelligent-System-for-Improving-Classification-of-Cancer-Diseases-15-2048.jpg)
![Results analysis and evaluation 8/10
The CAcc of the proposed methodology VS other methodologies on
Reference
Methodology
Accuracy in %
Filter Wrapper classifier
[1]
T-Statistics, SNR, F-Test GA SVM 81.25
T-Statistics, SNR, F-Test GA KNN 81.25
[2] IG GA GP 86.67
[3]
Collection of attribute selectors and classification
algorithms
75.49
[4] Optimized Fuzzy Rule Generation (OFRG) algorithm 95
This work IG GWO SVM 96.67](https://image.slidesharecdn.com/1-designofanintelligentsystemforimprovingclassificationofcancerdiseases-mrawippt-190528155333/75/Design-of-an-Intelligent-System-for-Improving-Classification-of-Cancer-Diseases-25-2048.jpg)
![Results analysis and evaluation 9/10
Reference Methodology Accuracy in %
[3] ReliefF + 3-NN 70.96
[4] Optimized Fuzzy Rule Generation (OFRG) algorithm 94
[5]
filtering and normalization + PSO + SVM
94
filtering and normalization + GA + SVM
This work IG GWO SVM 94.87
The CAcc of the proposed methodology VS other
methodologies on Breast.](https://image.slidesharecdn.com/1-designofanintelligentsystemforimprovingclassificationofcancerdiseases-mrawippt-190528155333/75/Design-of-an-Intelligent-System-for-Improving-Classification-of-Cancer-Diseases-26-2048.jpg)
![The CAcc of the proposed methodology VS
other methodologies on Colon.
Results analysis and evaluation 10/10
Reference Methodology Accuracy in %
[1]
T-Statistics, SNR, F-Test GA SVM 85
T-Statistics, SNR, F-Test GA KNN 85
[3] Random + SVM 88.41
[2] IG+GA+PG 85.48
This work IG GWO SVM 95.161](https://image.slidesharecdn.com/1-designofanintelligentsystemforimprovingclassificationofcancerdiseases-mrawippt-190528155333/75/Design-of-an-Intelligent-System-for-Improving-Classification-of-Cancer-Diseases-27-2048.jpg)
![Conclusion
• Despite the simplicity of the proposed system compared
to previous work, it has overcome it.
• The approach is superior to the system proposed by [1, 2,
3, 4, 5] in term of classification accuracy.
• The proposed system reducing the consumption of time
and memory that they are necessary for the classification
process.
• The experimental results indicate that the proposed
methodology is able to enhance the stability of the
classification accuracy as well as the features selection.](https://image.slidesharecdn.com/1-designofanintelligentsystemforimprovingclassificationofcancerdiseases-mrawippt-190528155333/75/Design-of-an-Intelligent-System-for-Improving-Classification-of-Cancer-Diseases-28-2048.jpg)


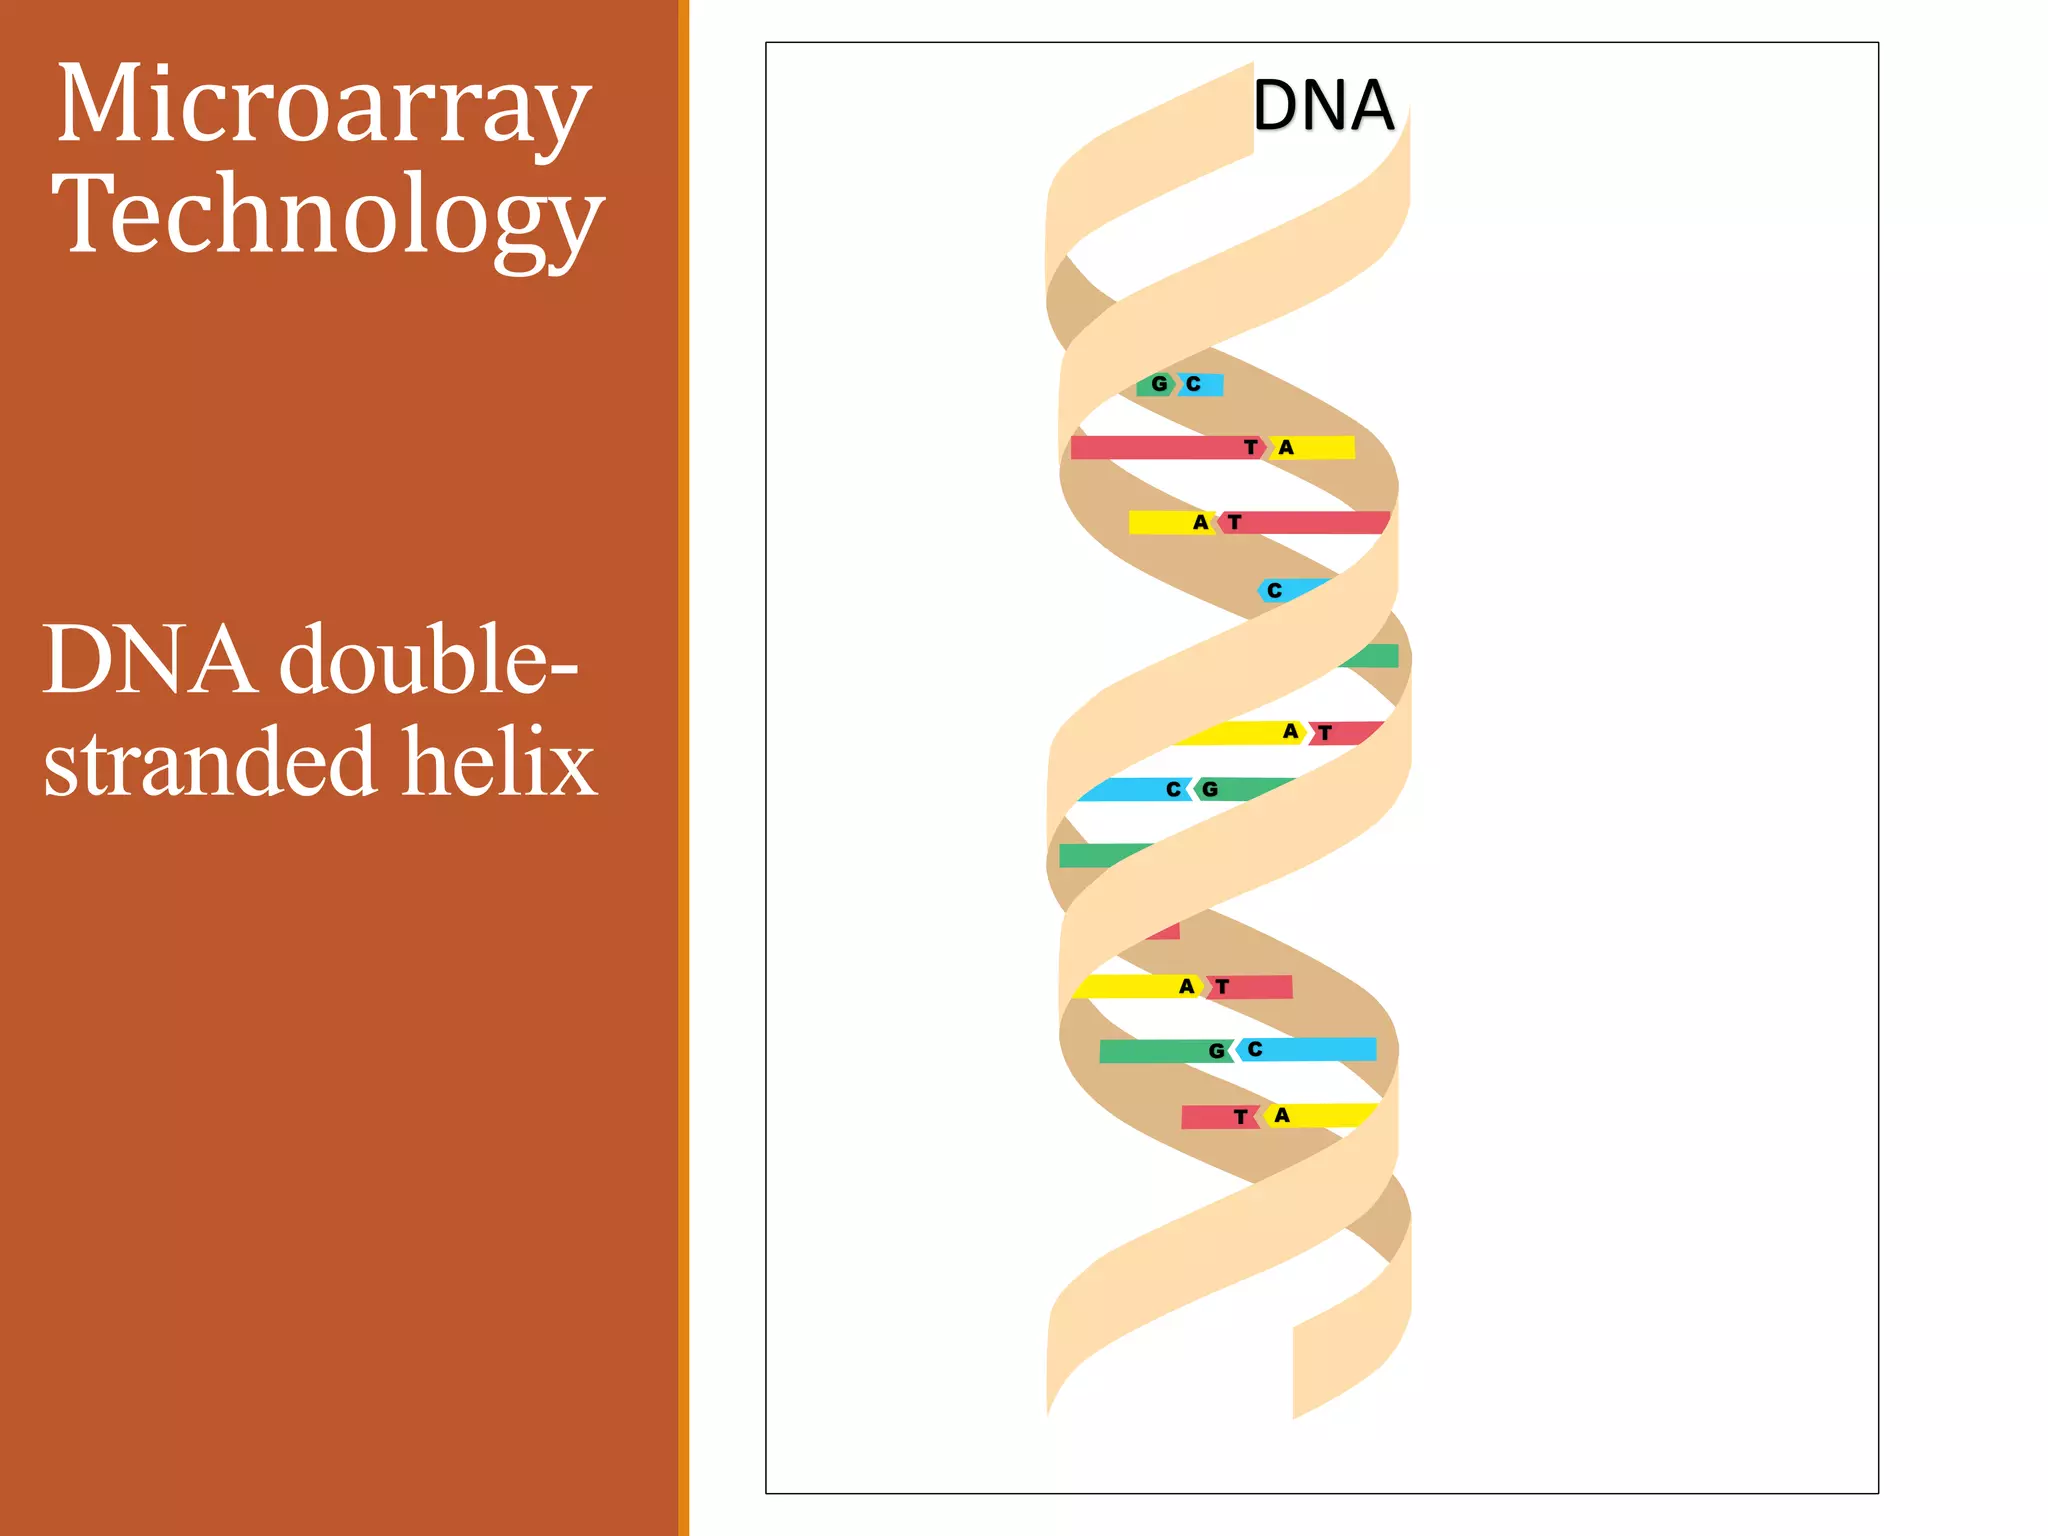
![Microarray Technology[back]
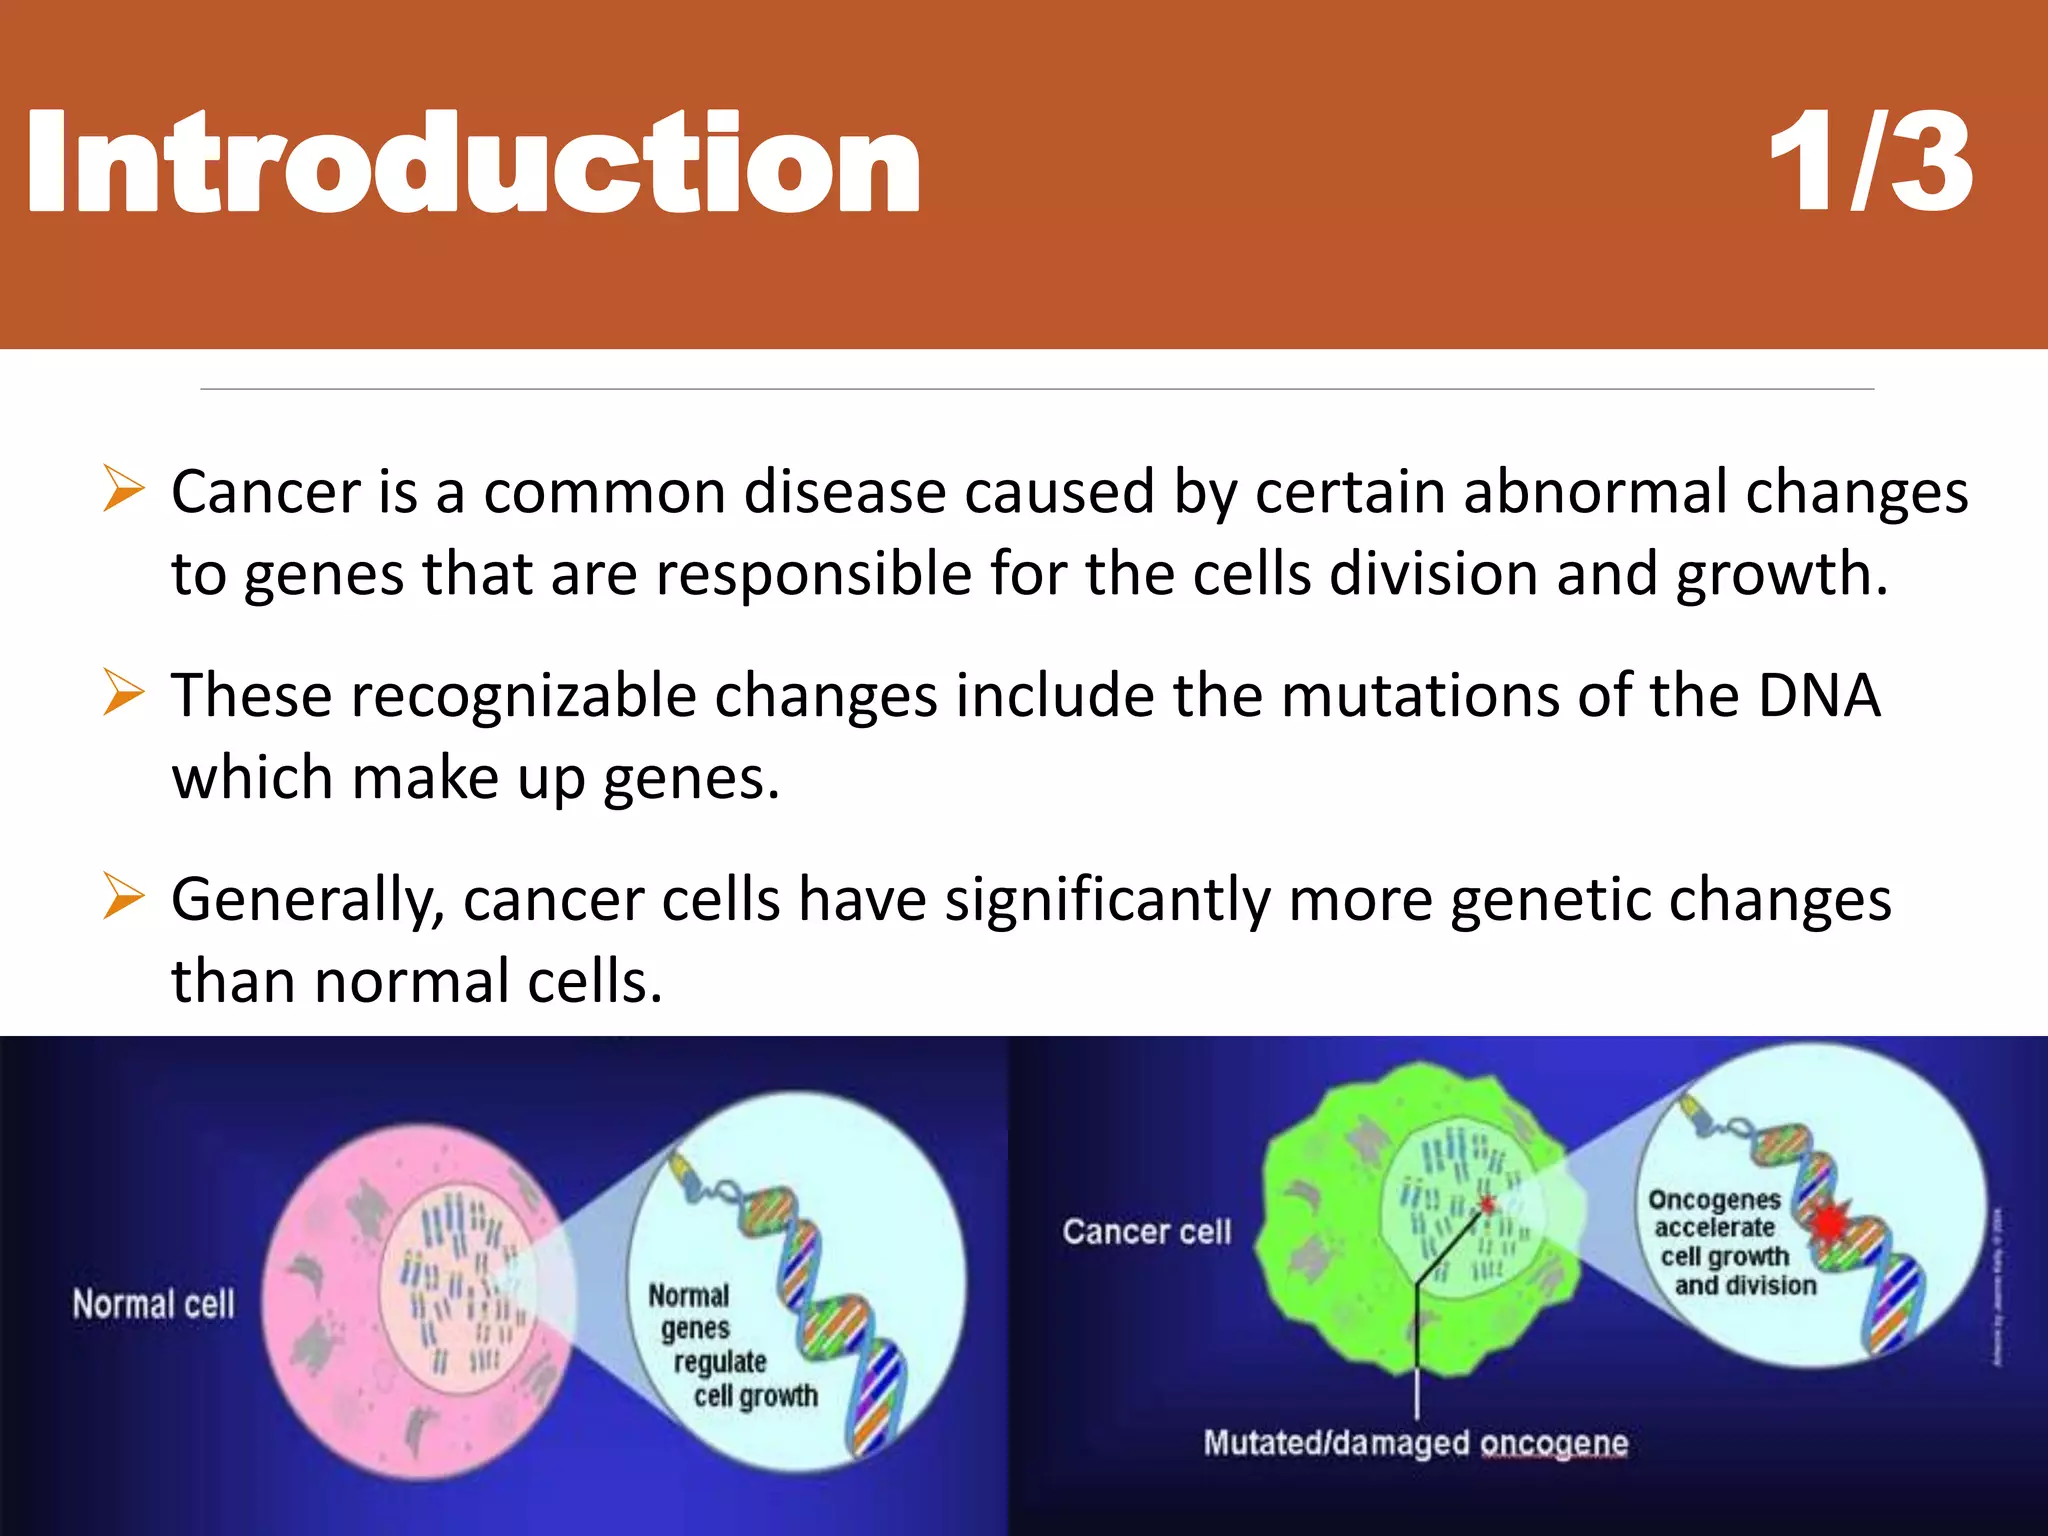
The most basic units for all organisms are Cells.
Each cell contains a nucleus.
In side the nucleus there are chromosomes which arranged by
deoxyribonucleic acid (DNA).
The nucleotides represent the basic units of DNA which consist of sugar
phosphate backbone and one of the four bases:
Adenine (A), cytosine (C), guanine (G), and thymine (T) .
The hereditary information coded by the DNA through the particular order of
these base pairs on a double-stranded helix for making future organisms.](https://image.slidesharecdn.com/1-designofanintelligentsystemforimprovingclassificationofcancerdiseases-mrawippt-190528155333/75/Design-of-an-Intelligent-System-for-Improving-Classification-of-Cancer-Diseases-33-2048.jpg)
![The Relationship Among the Cell, The Nucleus, a
Chromosome and a Gene.
Cell Nucleus where Chromosomes "live"
Cell Chromosomes
Contain All genetic material
DNA
The material from
which chromosomes
are constructed
Gene
A segment of
a chromosome
(made up of DNA)
Microarray Technology [back]](https://image.slidesharecdn.com/1-designofanintelligentsystemforimprovingclassificationofcancerdiseases-mrawippt-190528155333/75/Design-of-an-Intelligent-System-for-Improving-Classification-of-Cancer-Diseases-34-2048.jpg)
![Gene Expression Profiles [back]
• Amount of mRNA produced by each cell
• Can be monitored to detect alteration or mutations
• Each cell needs to construct protein in order to develop and function
• The process of constructing proteins :
• Transcription: coping the genetic information into mRNA molecules
• Translation: translate mRNA into proteins’ amino acid sequences
• Once the protein is constructed, gene is said to be expressed
• mRNA sequences are capable to hybridize with their complementary DNA (cDNA)
DNA
AA
CG
TA
AT
C
A
CG
AT
T
CG
T
transcription
RNA
translation
Amino Acid chain
folding protein](https://image.slidesharecdn.com/1-designofanintelligentsystemforimprovingclassificationofcancerdiseases-mrawippt-190528155333/75/Design-of-an-Intelligent-System-for-Improving-Classification-of-Cancer-Diseases-35-2048.jpg)

The document presents an intelligent decision support system designed for the early diagnosis of cancer by classifying gene expression profiles from datasets related to breast, colon, and central nervous system (CNS) cancers. The system overcomes challenges such as dimensionality and relevancy of gene data, utilizing advanced methodologies like information gain for feature selection and gray wolf optimization for feature reduction. Results indicate the proposed system has superior classification accuracy compared to existing methodologies, demonstrating a significant improvement in the reliability and efficiency of cancer diagnosis.