This document summarizes a presentation on using machine learning to diagnose breast cancer. It introduces machine learning and explains that it uses statistical techniques to allow computer systems to learn from data without being explicitly programmed. It then provides an overview of breast cancer, risk factors, and statistics. It states that machine learning will be used to analyze breast cancer biopsy data to make diagnoses. The document outlines the steps of collecting and exploring the biopsy data, preparing training and test datasets, training a k-nearest neighbors model on the data, and calculating the model's accuracy on the test data using a confusion matrix.


![Data preparation – creating training and test
datasets
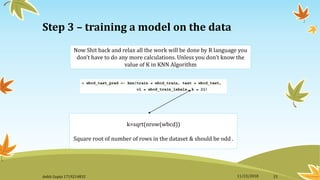
We will split the wbcd_n data frame into wbcd_train and wbcd_test:
If the preceding commands are confusing, remember that data is extracted from
dataframes using the [row, column] syntax. A blank value for the row or column
value indicates that all the rows or columns should be included. Hence, the first
line of code takes rows 1 to 469 and all columns, and the second line takes 100
rows from 470 to 569 and all columns.
Ankit Gupta 1719214832 11/23/2018 14](https://image.slidesharecdn.com/breastcancerdiagnosismachinelearningppt-181123031720/85/Breast-cancer-diagnosis-machine-learning-ppt-14-320.jpg)