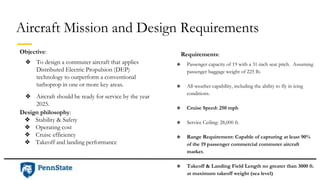
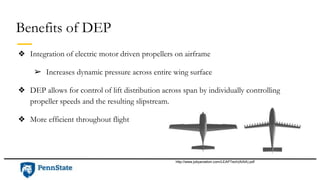
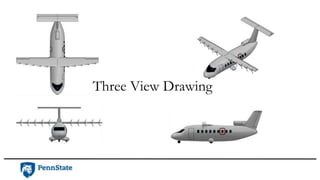
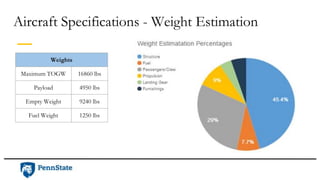
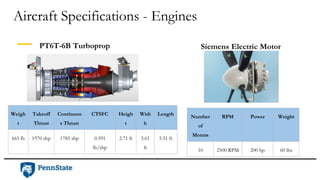
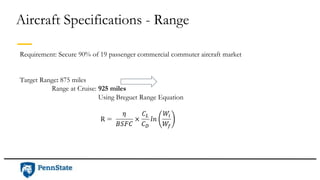
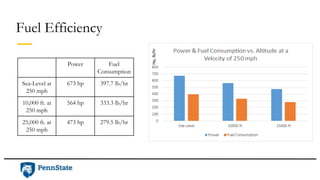
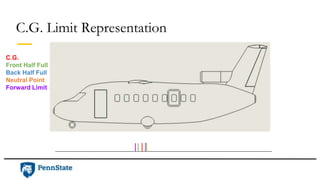
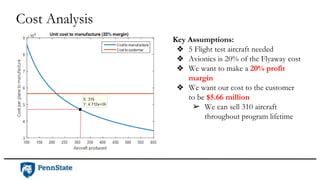
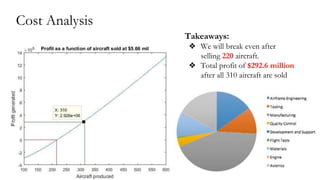
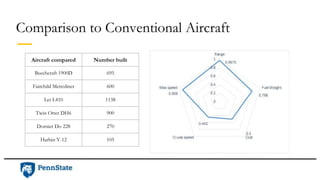
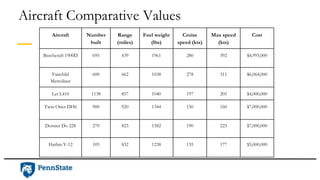
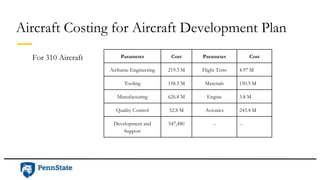
NASA’s Distributed
Electric Propulsion Aircraft
Final Presentation
Harley Austin, Nathan Brockett, Joseph Damis, Darren Slotnick, Ian
Fitzsimmons, John Macnamara, Nicholas Noell, Mitansh Shah
Aircraft Mission and Design Requirements
❖ To design a commuter aircraft that applies
Distributed Electric Propulsion (DEP)
technology to outperform a conventional
turboprop in one or more key areas.
❖ Aircraft should be ready for service by the year
2025.
Objective: Requirements:
❖ Passenger capacity of 19 with a 31-inch seat pitch. Assuming
passenger baggage weight of 225 lb.
❖ All-weather capability, including the ability to fly in icing
conditions.
❖ Cruise Speed: 250 mph
❖ Service Ceiling: 28,000 ft.
❖ Range Requirement: Capable of capturing at least 90%
of the 19 passenger commercial commuter aircraft
market.
❖ Takeoff & Landing Field Length no greater than 3000 ft.
at maximum takeoff weight (sea level)
Design philosophy:
❖ Stability & Safety
❖ Operating cost
❖ Cruise efficiency
❖ Takeoff and landing performance
Benefits of DEP
❖ Integration of electric motor driven propellers on airframe
➢ Increases dynamic pressure across entire wing surface
❖ DEP allows for control of lift distribution across span by individually controlling
propeller speeds and the resulting slipstream.
❖ More efficient throughout flight
http://www.jobyaviation.com/LEAPTech(AIAA).pdf
Trade & Concept Studies
Propeller Design
❖ Advanced Ratio
❖ Variable Pitch
Turbine Location
Three View Drawing
Top-Down View
Inboard Profile View
Aircraft Specifications - Sizing
Wing Parameters
Wing area 286 ft2
Span 58 ft.
AR 11.8
Taper Ratio 0.57
MAC 5.05 ft.
Airfoil LS(1) -0417
(GA(W)-1)
Vertical Tail
Span 15 ft.
Area 106 ft2
Chord 7.1 ft.
LVT 21 ft.
Horizontal Tail
Span 19 ft.
Area 106 ft2
Chord 5.5 ft.
LHT 19 ft.
Aircraft Specifications - Weight Estimation
Weights
Maximum TOGW 16860 lbs
Payload 4950 lbs
Empty Weight 9240 lbs
Fuel Weight 1250 lbs
Aircraft Specifications - Engines
Weigh
t
Takeoff
Thrust
Continuou
s Thrust
CTSFC Heigh
t
Widt
h
Length
665 lb 1970 shp 1785 shp 0.591
lb/shp
2.71 ft 3.61
ft
5.51 ft
PT6T-6B Turboprop
Number
of
Motors
RPM Power Weight
10 2500 RPM 200 hp 60 lbs
Siemens Electric Motor
Performance
Constraint Diagram
Design
Space
Drag Buildup (Sea Level)
Drag Buildup (Cruise @15,000 ft)
Cruise Speed @ Max L/D:
215 knots = 247 mph
Power Required vs. Power Available
Power Required vs. Power Available (15,000 ft)
Cruising Altitude
Rate-of-Climb vs. Altitude
Service Ceiling: 28,300 ft.
Absolute Ceiling: 30,600 ft.
Time to climb to cruise: 11 minutes
Aircraft Specifications - Range
Requirement: Secure 90% of 19 passenger commercial commuter aircraft market
Target Range: 875 miles
Range at Cruise: 925 miles
Using Breguet Range Equation
LS(1)-0417 (GA(W)-1) Airfoil & Lift-Curve Slope
CLmax (with flaps) 4.24
Wing CLalpha 0.098/deg
Horizontal Tail CLalpha 0.061/deg
LS(1)-0417 (GA(W)-1) Airfoil Reynolds Number = 6,000,000 Mach=0.36
Aircraft Specifications - Performance
Max Lift coefficient of 4.24 Landing Configuration: Single-
slotted Fowler Flaps
Stall speed = 98 ft/s
Parameter Sea Level Cruise (15,000 feet)
Stall speed w/ Fowler flaps deployed 98 ft/s = 67 mph 137 ft/s = 93 mph
Stall speed w/o Fowler split flaps deployed 135 ft/s = 92 mph 170 ft/s = 116 mph
Takeoff & Landing Distances
Takeoff
Ground Distance 590 ft.
Roll Distance 262 ft.
Transition Distance 1330 ft.
Climb Distance 74 ft.
Total 2257 ft.
Landing
Air Distance 1213 ft.
Free Roll Distance 339 ft.
Braking Distance 849 ft.
Total 2402 ft.
Fuel Efficiency
Power Fuel
Consumption
Sea-Level at
250 mph
673 hp 397.7 lb/hr
10,000 ft. at
250 mph
564 hp 333.3 lb/hr
25,000 ft. at
250 mph
473 hp 279.5 lb/hr
Hp,lb/hr
Stability and Control
Longitudinal Stability
Neutral Point 78% MAC
C.G. 59% MAC
Static Margin 19% MAC
Stick Free Neutral Point 68% MAC
C.G. 59% MAC
Stick Free Static Margin 9% MAC
Horizontal Tail Sizing
CHT 1.4
SHT 106 ft^2
Chord 5.5ft
Cabin Fill Case CG Location
Full 59 % MAC
Front half full 40 % MAC
Back half full 77 % MAC
Empty 61.5 % MAC
C.G. Limit Representation
C.G.
Front Half Full
Back Half Full
Neutral Point
Forward Limit
Vertical Tail (One Side Out)
SVT 106.5 ft^2
Max deflection 20°
% Chord for Rudder 22%
Elevator and Rudder Sizing
• Thin Airfoil Theory
results:
Horizontal Tail
CL max 1.0
Max deflection 20°
% Chord for Elevator 22%
Aileron Sizing
• 60 degree roll
•Takeoff: 10 seconds @1.2 Vstall
•Approach: 7 seconds @Vstall
• Maximum deflection: 25 degrees
• Outboard location: 95% of half-span
• 10.05 feet in length
• 15.23 square feet
Structures
V-n Diagrams: Sea Level MTOW
Vstall VA Vc VD
Velocity Load Factor
Vstall 64 kts 1.0
VA 112 kts 3.03
VB -- --
Vc 215 kts 3.03
VD 300 kts 3.03
V-n Diagrams: Start of Cruise
Vstall VA VB / Vc VD Velocity Load Factor
Vstall 97 kts 1.0
VA 169 kts 3.1
VB 215 kts 3.1
Vc 215 kts 3.1
VD 300 kts 3.1
V-n Diagrams: End of Cruise
Vstalll VA VB Vc VD
Velocity Load Factor
Vstall 89 kts 1.0
VA 159 kts 3.1
VB 193 kts 3.1
Vc 215 kts 3.33
VD 300 kts 3.1
Structures: Spar Sizing
Things to consider:
● Lift distribution
● Weight of the wing
● Fuel in the wing
● Props and engines
Spar Area Using 6061-T6 Aluminum
14.8 in2
Spar Cross-Section
7 ft.
14.5 in.
14.8 in2 Total
Cost Analysis
Cost Analysis
Key Assumptions:
❖ 5 Flight test aircraft needed
❖ Avionics is 20% of the Flyaway cost
❖ We want to make a 20% profit
margin
❖ We want our cost to the customer
to be $5.66 million
➢ We can sell 310 aircraft
throughout program lifetime
Cost Analysis
Takeaways:
❖ We will break even after
selling 220 aircraft.
❖ Total profit of $292.6 million
after all 310 aircraft are sold
DEP Comparison to
Conventional Aircraft
Comparison to Conventional Aircraft
Aircraft compared Number built
Beechcraft 1900D 695
Fairchild Metroliner 600
Let L410 1138
Twin Otter DH6 900
Dornier Do 228 270
Harbin Y-12 105
Appendix
Aircraft Comparative Values
Aircraft Number
built
Range
(miles)
Fuel weight
(lbs)
Cruise
speed (kts)
Max speed
(kts)
Cost
Beechcraft 1900D 695 439 1961 280 392 $4,995,000
Fairchild
Metroliner
600 662 1038 278 311 $6,064,000
Let L410 1138 857 1040 197 205 $4,000,000
Twin Otter DH6 900 920 1344 150 160 $7,000,000
Dornier Do 228 270 823 1582 190 223 $7,000,000
Harbin Y-12 105 832 1238 135 177 $5,000,000
Aircraft Costing for Aircraft Development Plan
Parameter Cost Parameter Cost
Airframe Engineering 219.3 M Flight Tests 4.97 M
Tooling 158.5 M Materials 150.5 M
Manufacturing 626.8 M Engine 3.8 M
Quality Control 52.8 M Avionics 243.4 M
Development and
Support
547,480 -- --
For 310 Aircraft

Dep final presentation

  • 1.
    NASA’s Distributed Electric PropulsionAircraft Final Presentation Harley Austin, Nathan Brockett, Joseph Damis, Darren Slotnick, Ian Fitzsimmons, John Macnamara, Nicholas Noell, Mitansh Shah
  • 2.
    Aircraft Mission andDesign Requirements ❖ To design a commuter aircraft that applies Distributed Electric Propulsion (DEP) technology to outperform a conventional turboprop in one or more key areas. ❖ Aircraft should be ready for service by the year 2025. Objective: Requirements: ❖ Passenger capacity of 19 with a 31-inch seat pitch. Assuming passenger baggage weight of 225 lb. ❖ All-weather capability, including the ability to fly in icing conditions. ❖ Cruise Speed: 250 mph ❖ Service Ceiling: 28,000 ft. ❖ Range Requirement: Capable of capturing at least 90% of the 19 passenger commercial commuter aircraft market. ❖ Takeoff & Landing Field Length no greater than 3000 ft. at maximum takeoff weight (sea level) Design philosophy: ❖ Stability & Safety ❖ Operating cost ❖ Cruise efficiency ❖ Takeoff and landing performance
  • 3.
    Benefits of DEP ❖Integration of electric motor driven propellers on airframe ➢ Increases dynamic pressure across entire wing surface ❖ DEP allows for control of lift distribution across span by individually controlling propeller speeds and the resulting slipstream. ❖ More efficient throughout flight http://www.jobyaviation.com/LEAPTech(AIAA).pdf
  • 4.
    Trade & ConceptStudies Propeller Design ❖ Advanced Ratio ❖ Variable Pitch Turbine Location
  • 5.
  • 6.
  • 7.
  • 8.
    Aircraft Specifications -Sizing Wing Parameters Wing area 286 ft2 Span 58 ft. AR 11.8 Taper Ratio 0.57 MAC 5.05 ft. Airfoil LS(1) -0417 (GA(W)-1) Vertical Tail Span 15 ft. Area 106 ft2 Chord 7.1 ft. LVT 21 ft. Horizontal Tail Span 19 ft. Area 106 ft2 Chord 5.5 ft. LHT 19 ft.
  • 9.
    Aircraft Specifications -Weight Estimation Weights Maximum TOGW 16860 lbs Payload 4950 lbs Empty Weight 9240 lbs Fuel Weight 1250 lbs
  • 10.
    Aircraft Specifications -Engines Weigh t Takeoff Thrust Continuou s Thrust CTSFC Heigh t Widt h Length 665 lb 1970 shp 1785 shp 0.591 lb/shp 2.71 ft 3.61 ft 5.51 ft PT6T-6B Turboprop Number of Motors RPM Power Weight 10 2500 RPM 200 hp 60 lbs Siemens Electric Motor
  • 11.
  • 12.
  • 13.
  • 14.
    Drag Buildup (Cruise@15,000 ft) Cruise Speed @ Max L/D: 215 knots = 247 mph
  • 15.
    Power Required vs.Power Available
  • 16.
    Power Required vs.Power Available (15,000 ft) Cruising Altitude
  • 17.
    Rate-of-Climb vs. Altitude ServiceCeiling: 28,300 ft. Absolute Ceiling: 30,600 ft. Time to climb to cruise: 11 minutes
  • 18.
    Aircraft Specifications -Range Requirement: Secure 90% of 19 passenger commercial commuter aircraft market Target Range: 875 miles Range at Cruise: 925 miles Using Breguet Range Equation
  • 19.
    LS(1)-0417 (GA(W)-1) Airfoil& Lift-Curve Slope CLmax (with flaps) 4.24 Wing CLalpha 0.098/deg Horizontal Tail CLalpha 0.061/deg LS(1)-0417 (GA(W)-1) Airfoil Reynolds Number = 6,000,000 Mach=0.36
  • 20.
    Aircraft Specifications -Performance Max Lift coefficient of 4.24 Landing Configuration: Single- slotted Fowler Flaps Stall speed = 98 ft/s Parameter Sea Level Cruise (15,000 feet) Stall speed w/ Fowler flaps deployed 98 ft/s = 67 mph 137 ft/s = 93 mph Stall speed w/o Fowler split flaps deployed 135 ft/s = 92 mph 170 ft/s = 116 mph
  • 21.
    Takeoff & LandingDistances Takeoff Ground Distance 590 ft. Roll Distance 262 ft. Transition Distance 1330 ft. Climb Distance 74 ft. Total 2257 ft. Landing Air Distance 1213 ft. Free Roll Distance 339 ft. Braking Distance 849 ft. Total 2402 ft.
  • 22.
    Fuel Efficiency Power Fuel Consumption Sea-Levelat 250 mph 673 hp 397.7 lb/hr 10,000 ft. at 250 mph 564 hp 333.3 lb/hr 25,000 ft. at 250 mph 473 hp 279.5 lb/hr Hp,lb/hr
  • 23.
  • 24.
    Longitudinal Stability Neutral Point78% MAC C.G. 59% MAC Static Margin 19% MAC Stick Free Neutral Point 68% MAC C.G. 59% MAC Stick Free Static Margin 9% MAC
  • 25.
    Horizontal Tail Sizing CHT1.4 SHT 106 ft^2 Chord 5.5ft Cabin Fill Case CG Location Full 59 % MAC Front half full 40 % MAC Back half full 77 % MAC Empty 61.5 % MAC
  • 26.
    C.G. Limit Representation C.G. FrontHalf Full Back Half Full Neutral Point Forward Limit
  • 27.
    Vertical Tail (OneSide Out) SVT 106.5 ft^2 Max deflection 20° % Chord for Rudder 22% Elevator and Rudder Sizing • Thin Airfoil Theory results: Horizontal Tail CL max 1.0 Max deflection 20° % Chord for Elevator 22%
  • 28.
    Aileron Sizing • 60degree roll •Takeoff: 10 seconds @1.2 Vstall •Approach: 7 seconds @Vstall • Maximum deflection: 25 degrees • Outboard location: 95% of half-span • 10.05 feet in length • 15.23 square feet
  • 29.
  • 30.
    V-n Diagrams: SeaLevel MTOW Vstall VA Vc VD Velocity Load Factor Vstall 64 kts 1.0 VA 112 kts 3.03 VB -- -- Vc 215 kts 3.03 VD 300 kts 3.03
  • 31.
    V-n Diagrams: Startof Cruise Vstall VA VB / Vc VD Velocity Load Factor Vstall 97 kts 1.0 VA 169 kts 3.1 VB 215 kts 3.1 Vc 215 kts 3.1 VD 300 kts 3.1
  • 32.
    V-n Diagrams: Endof Cruise Vstalll VA VB Vc VD Velocity Load Factor Vstall 89 kts 1.0 VA 159 kts 3.1 VB 193 kts 3.1 Vc 215 kts 3.33 VD 300 kts 3.1
  • 33.
    Structures: Spar Sizing Thingsto consider: ● Lift distribution ● Weight of the wing ● Fuel in the wing ● Props and engines
  • 34.
    Spar Area Using6061-T6 Aluminum 14.8 in2
  • 35.
  • 36.
  • 37.
    Cost Analysis Key Assumptions: ❖5 Flight test aircraft needed ❖ Avionics is 20% of the Flyaway cost ❖ We want to make a 20% profit margin ❖ We want our cost to the customer to be $5.66 million ➢ We can sell 310 aircraft throughout program lifetime
  • 38.
    Cost Analysis Takeaways: ❖ Wewill break even after selling 220 aircraft. ❖ Total profit of $292.6 million after all 310 aircraft are sold
  • 39.
  • 40.
    Comparison to ConventionalAircraft Aircraft compared Number built Beechcraft 1900D 695 Fairchild Metroliner 600 Let L410 1138 Twin Otter DH6 900 Dornier Do 228 270 Harbin Y-12 105
  • 41.
  • 42.
    Aircraft Comparative Values AircraftNumber built Range (miles) Fuel weight (lbs) Cruise speed (kts) Max speed (kts) Cost Beechcraft 1900D 695 439 1961 280 392 $4,995,000 Fairchild Metroliner 600 662 1038 278 311 $6,064,000 Let L410 1138 857 1040 197 205 $4,000,000 Twin Otter DH6 900 920 1344 150 160 $7,000,000 Dornier Do 228 270 823 1582 190 223 $7,000,000 Harbin Y-12 105 832 1238 135 177 $5,000,000
  • 43.
    Aircraft Costing forAircraft Development Plan Parameter Cost Parameter Cost Airframe Engineering 219.3 M Flight Tests 4.97 M Tooling 158.5 M Materials 150.5 M Manufacturing 626.8 M Engine 3.8 M Quality Control 52.8 M Avionics 243.4 M Development and Support 547,480 -- -- For 310 Aircraft

Editor's Notes

  • #3 Harley
  • #4 Harley
  • #5 Harley
  • #6 Johnny - smaller wing but act as “big” wing. DEP effect. Mention turbine location
  • #7 Johnny - Spar has to be on top
  • #8 Johnny - Spar has to be on top
  • #9 nick
  • #10 nick
  • #11 Nick - siemens motor DOES exist. 350 hp version that exist, but we will place an order for a specific scaled down version
  • #13 Ian
  • #14 Ian -
  • #15 Ian - the wing profile drag, from the last iteration was updated to account for the dep effect
  • #16 Ian
  • #17 Ian
  • #18 Ian
  • #19 Mitansh So one of the major requirements for our aircraft is that it must be able to secure 90% of the 19 passenger commercial aircraft market. So to achieve this goal, we analyzed the current aircraft that fall within this class and calculated The corresponding target range to be 875 miles in order to satisfy this requirement. We will go into further details on that at a later point in this presentation. So using the Breguet Range equations we calculated that our aircraft had a maximum cruise range Of 925 miles which satisfied this requirement and will give it the ability to secure a significant portion of the market segment.
  • #20 Mitansh Because our aircraft has a relatively small-sized wing, the wing loadings that the wing is expected to endure are substantially higher than for a conventional turboprop. For that reason, the airfoil we decided to choose was the ___________. This was believed to be the ideal airfoil because it is 17% thick, and will therefore provide the necessary structural reinforcement to sustain these high wing loadings. Additionally, the airfoil has gentle stall characteristics. This is essential because the propellers induce a freestream velocity with an array of angles of attack on the wing. These highly favorable stall characteristics will allow the aircraft to gently glide down upon landing.
  • #21 Mitansh
  • #22 Mitansh Well within the FAR requirement of 3000 ft. This leighway allows us to play around with the engine size and evaluate whether we can decrease our power and still meet the TO and Landing requirements.
  • #23 Mitansh The bar graph on the right offers insight into the performance characteristics and fuel efficiency of the aircraft. The graph clearly shows that at sea-level the power required to operate at 250 mph is 673 hp and the fuel consumed is 397.7 lb/hr. Higher altitudes require less power, yet offer a significantly better fuel efficiency for the aircraft. This can be seen at 25,000 feet, where for the same velocity the power required and fuel consumption decreased significantly. This performance data was a key factor in determining the optimal cruising altitude for the aircraft.
  • #25 Nathan - add pic
  • #26 Nathan - DEP effects were taken into account in the aerodynamic coeficients
  • #28 Nathan
  • #29 Harley
  • #31 Joe
  • #32 Joe
  • #33 Joe
  • #34 Joe
  • #35 Joe
  • #36 Joe
  • #37 Darren
  • #38 Darren
  • #39 Darren
  • #40 Darren
  • #41 Darren