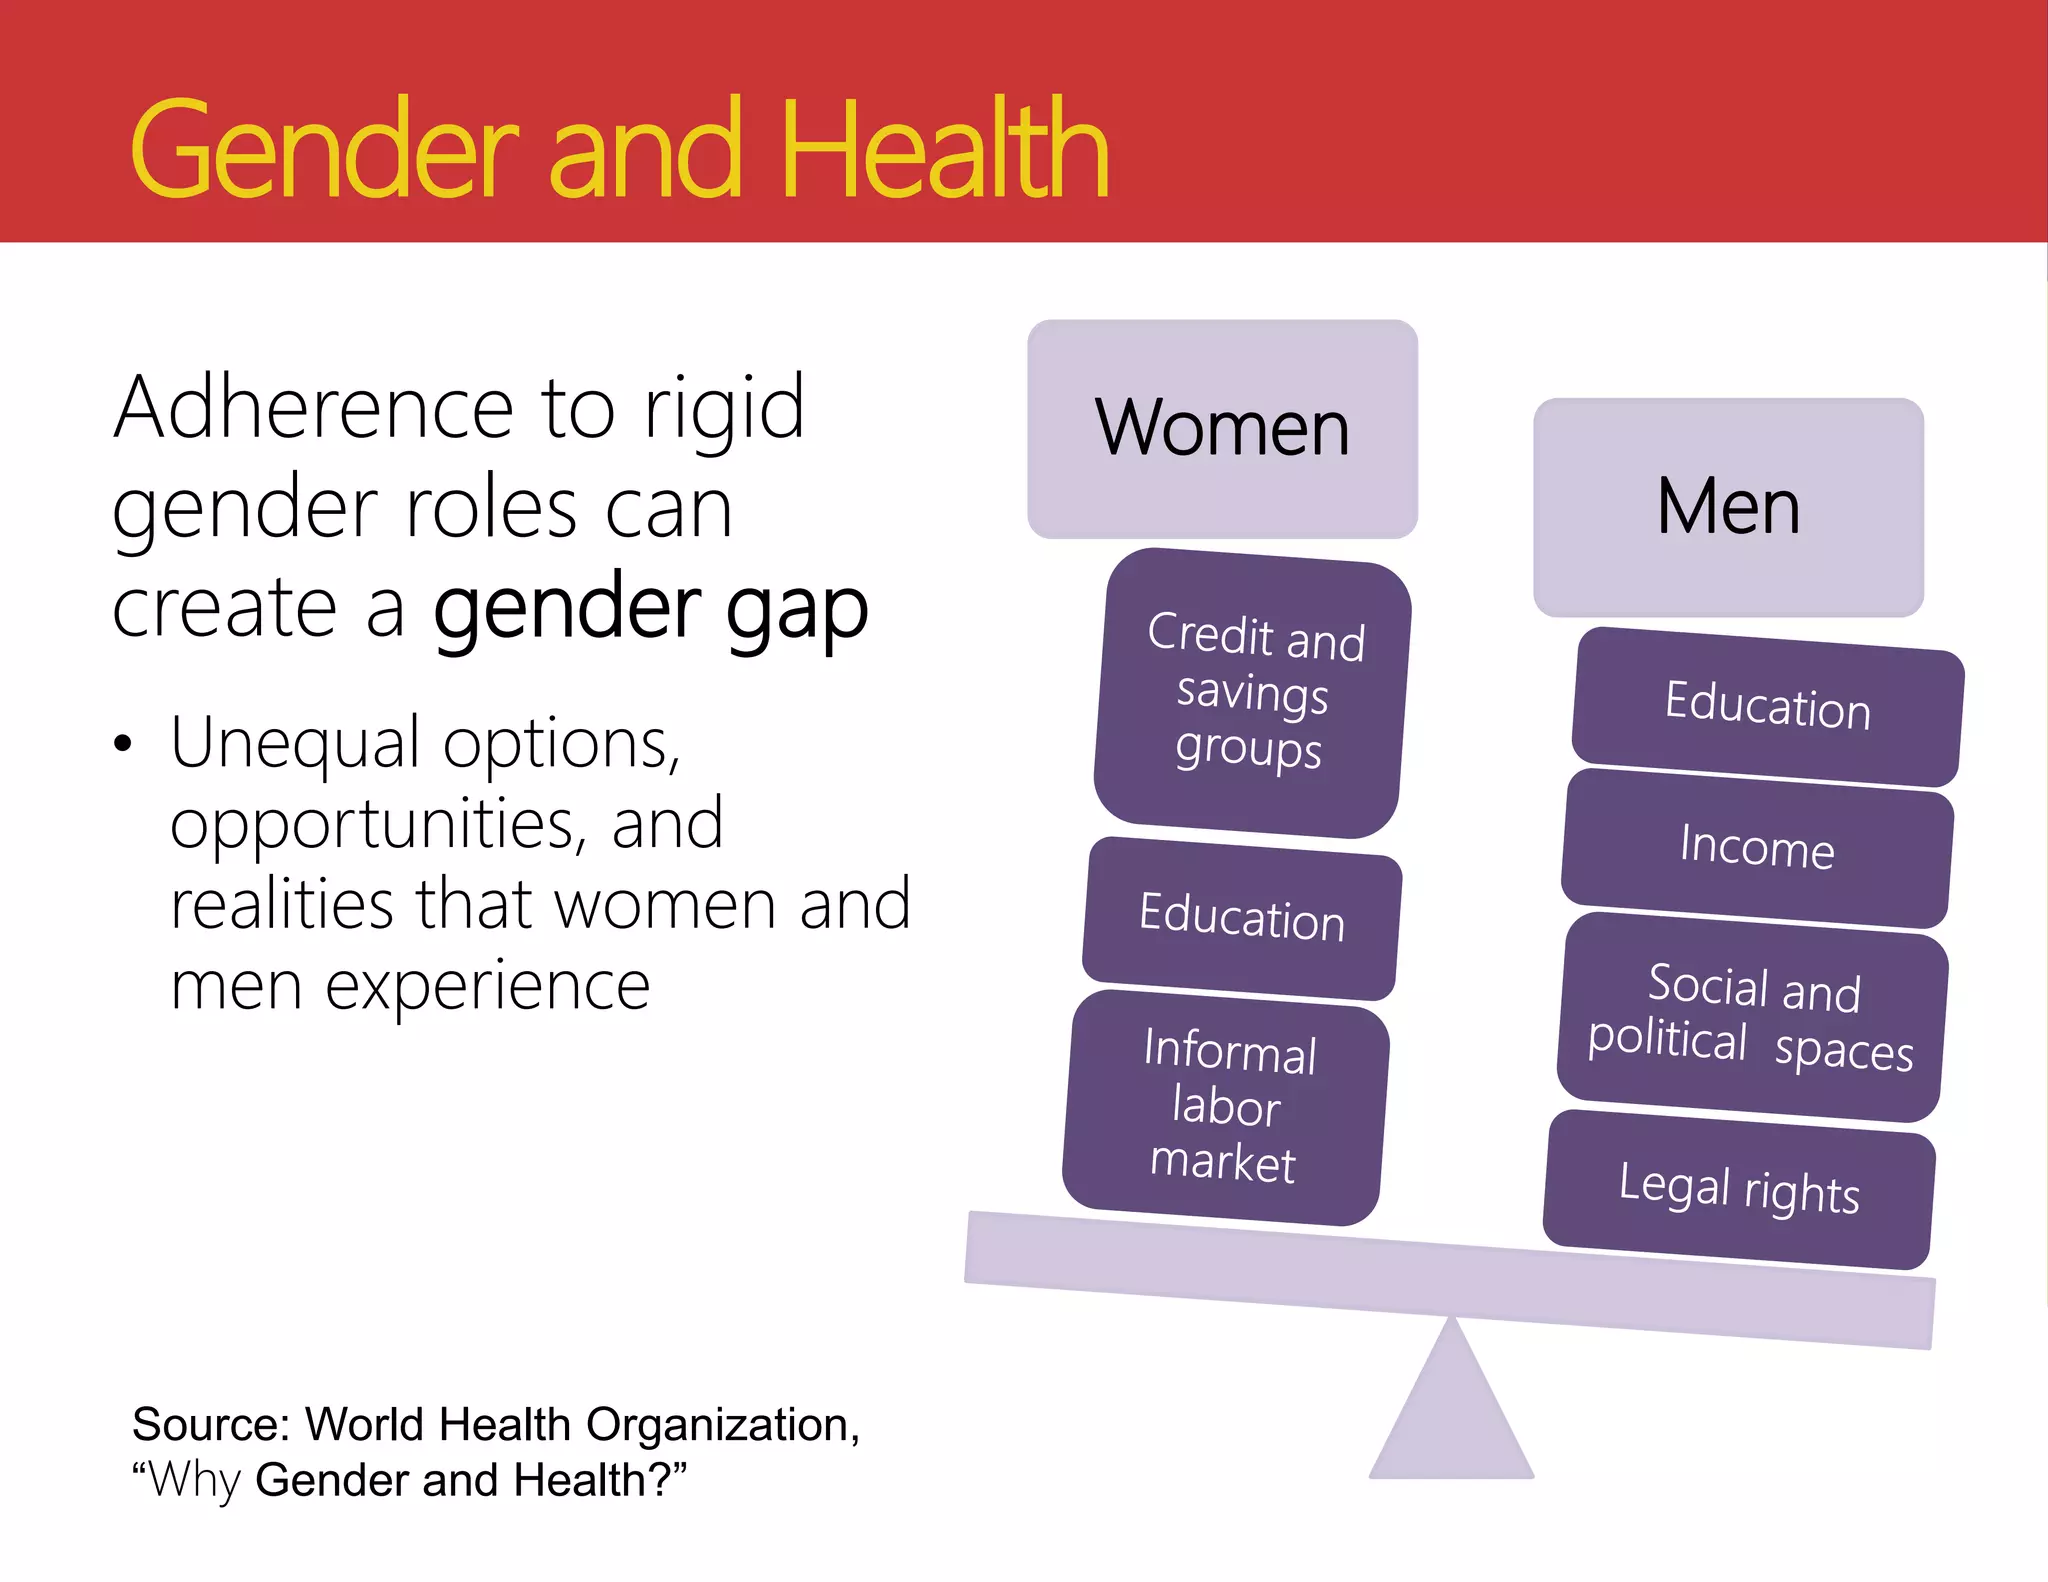
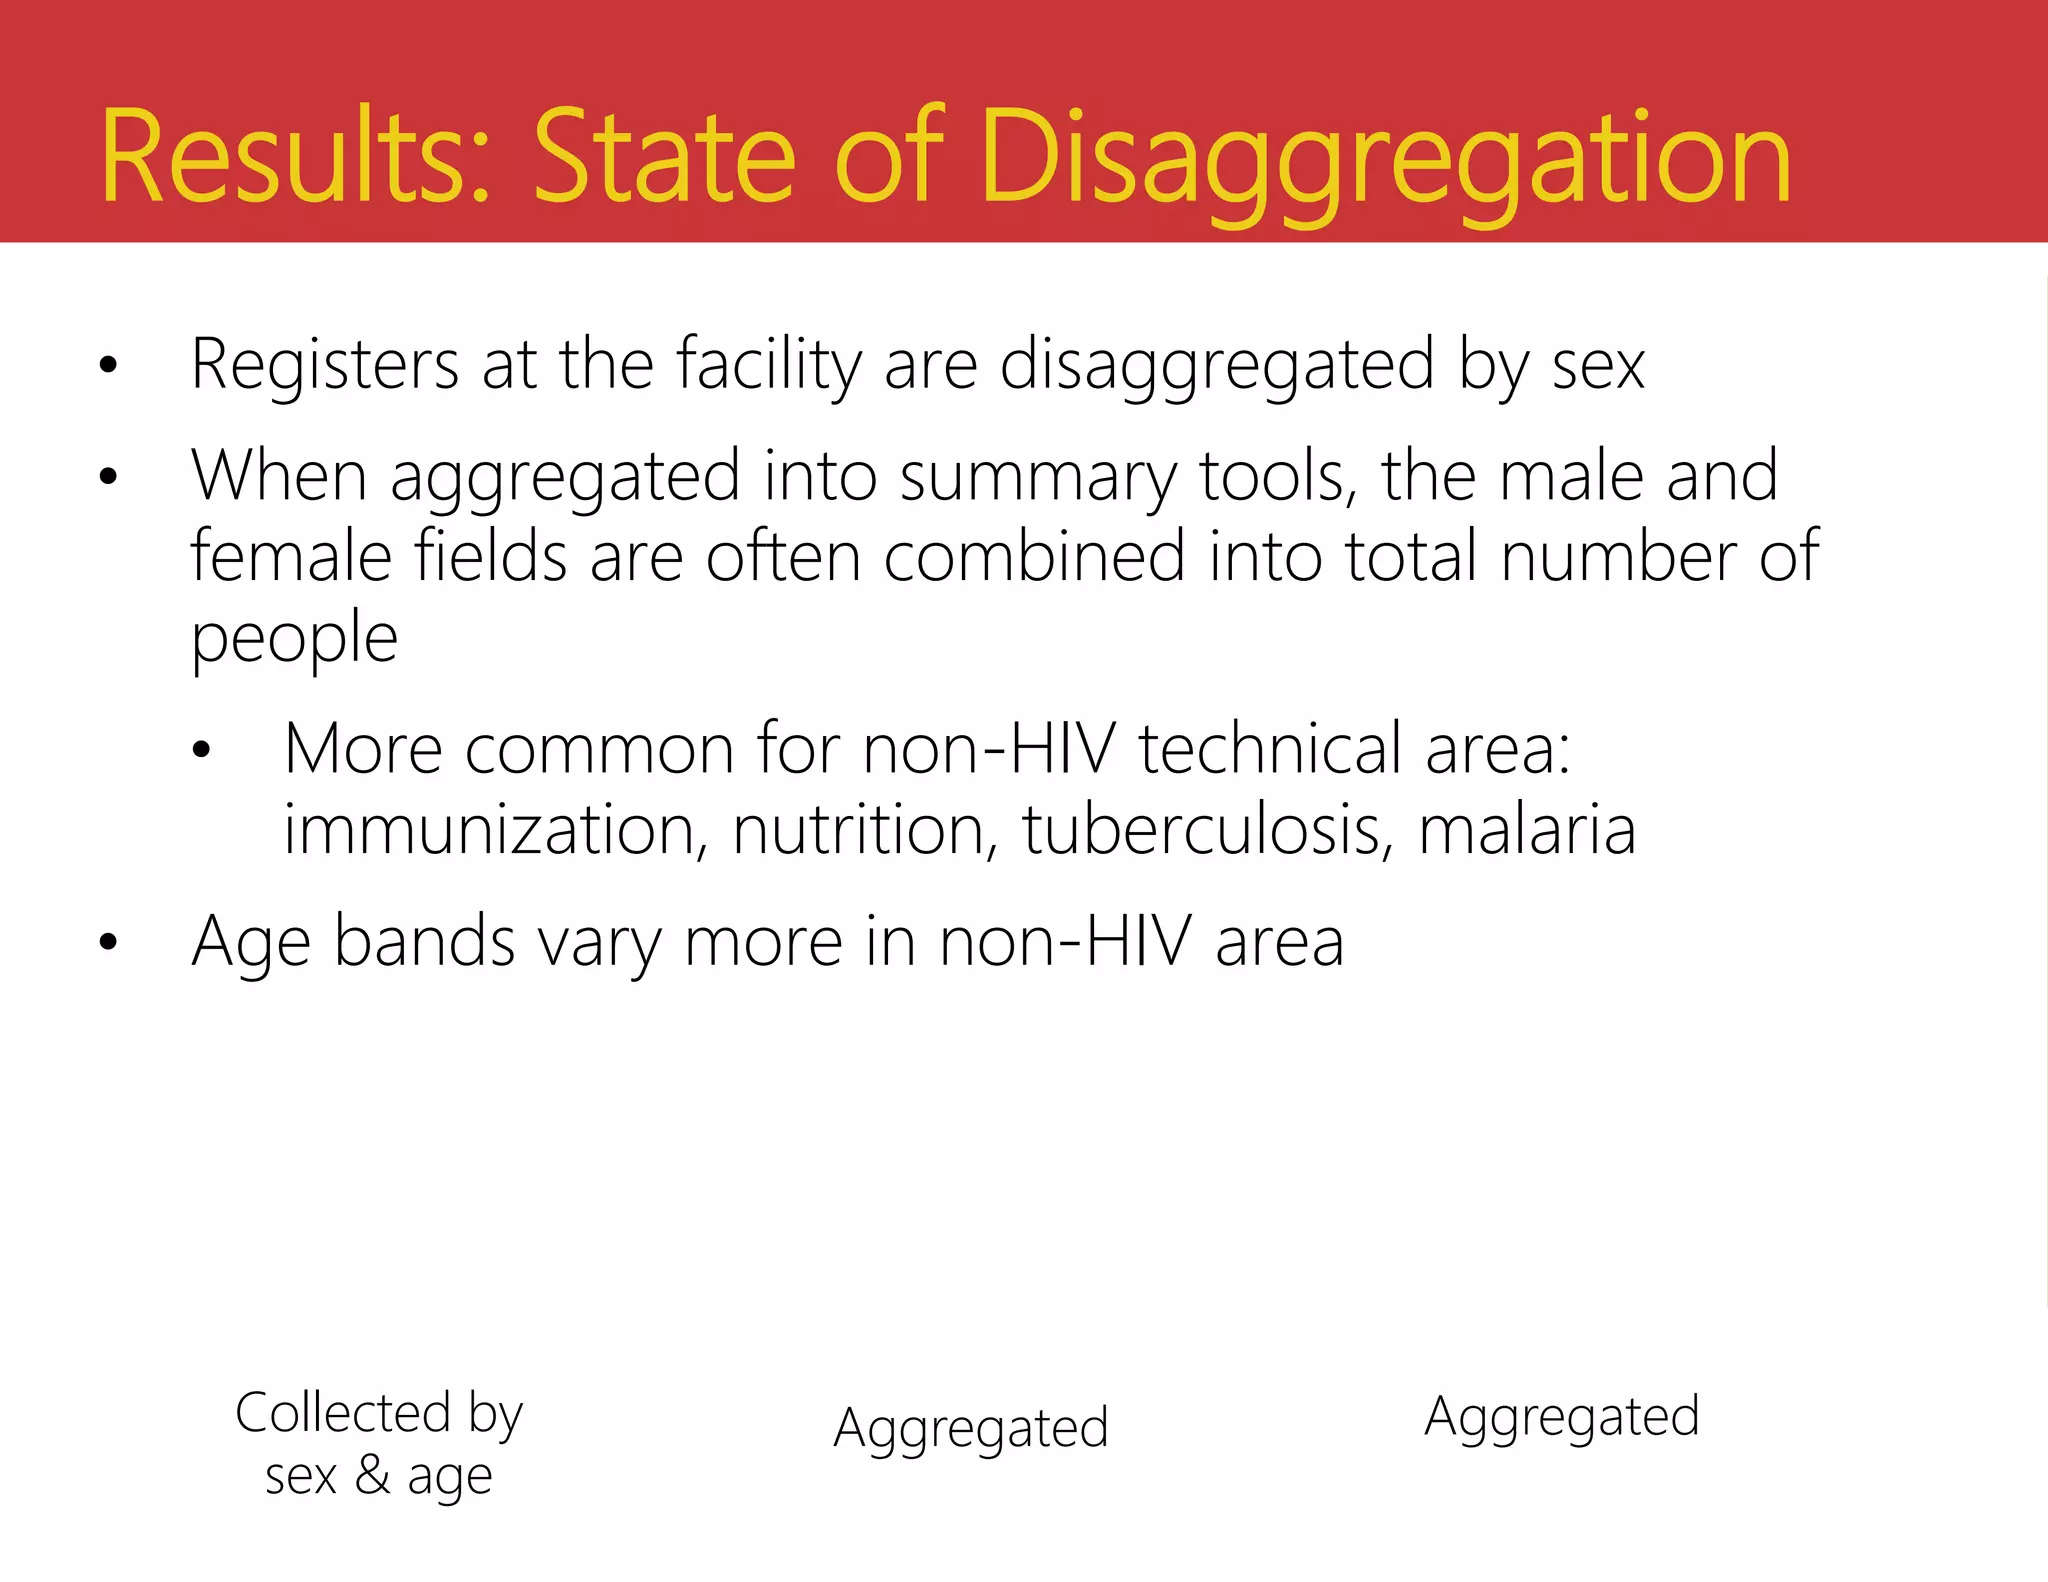
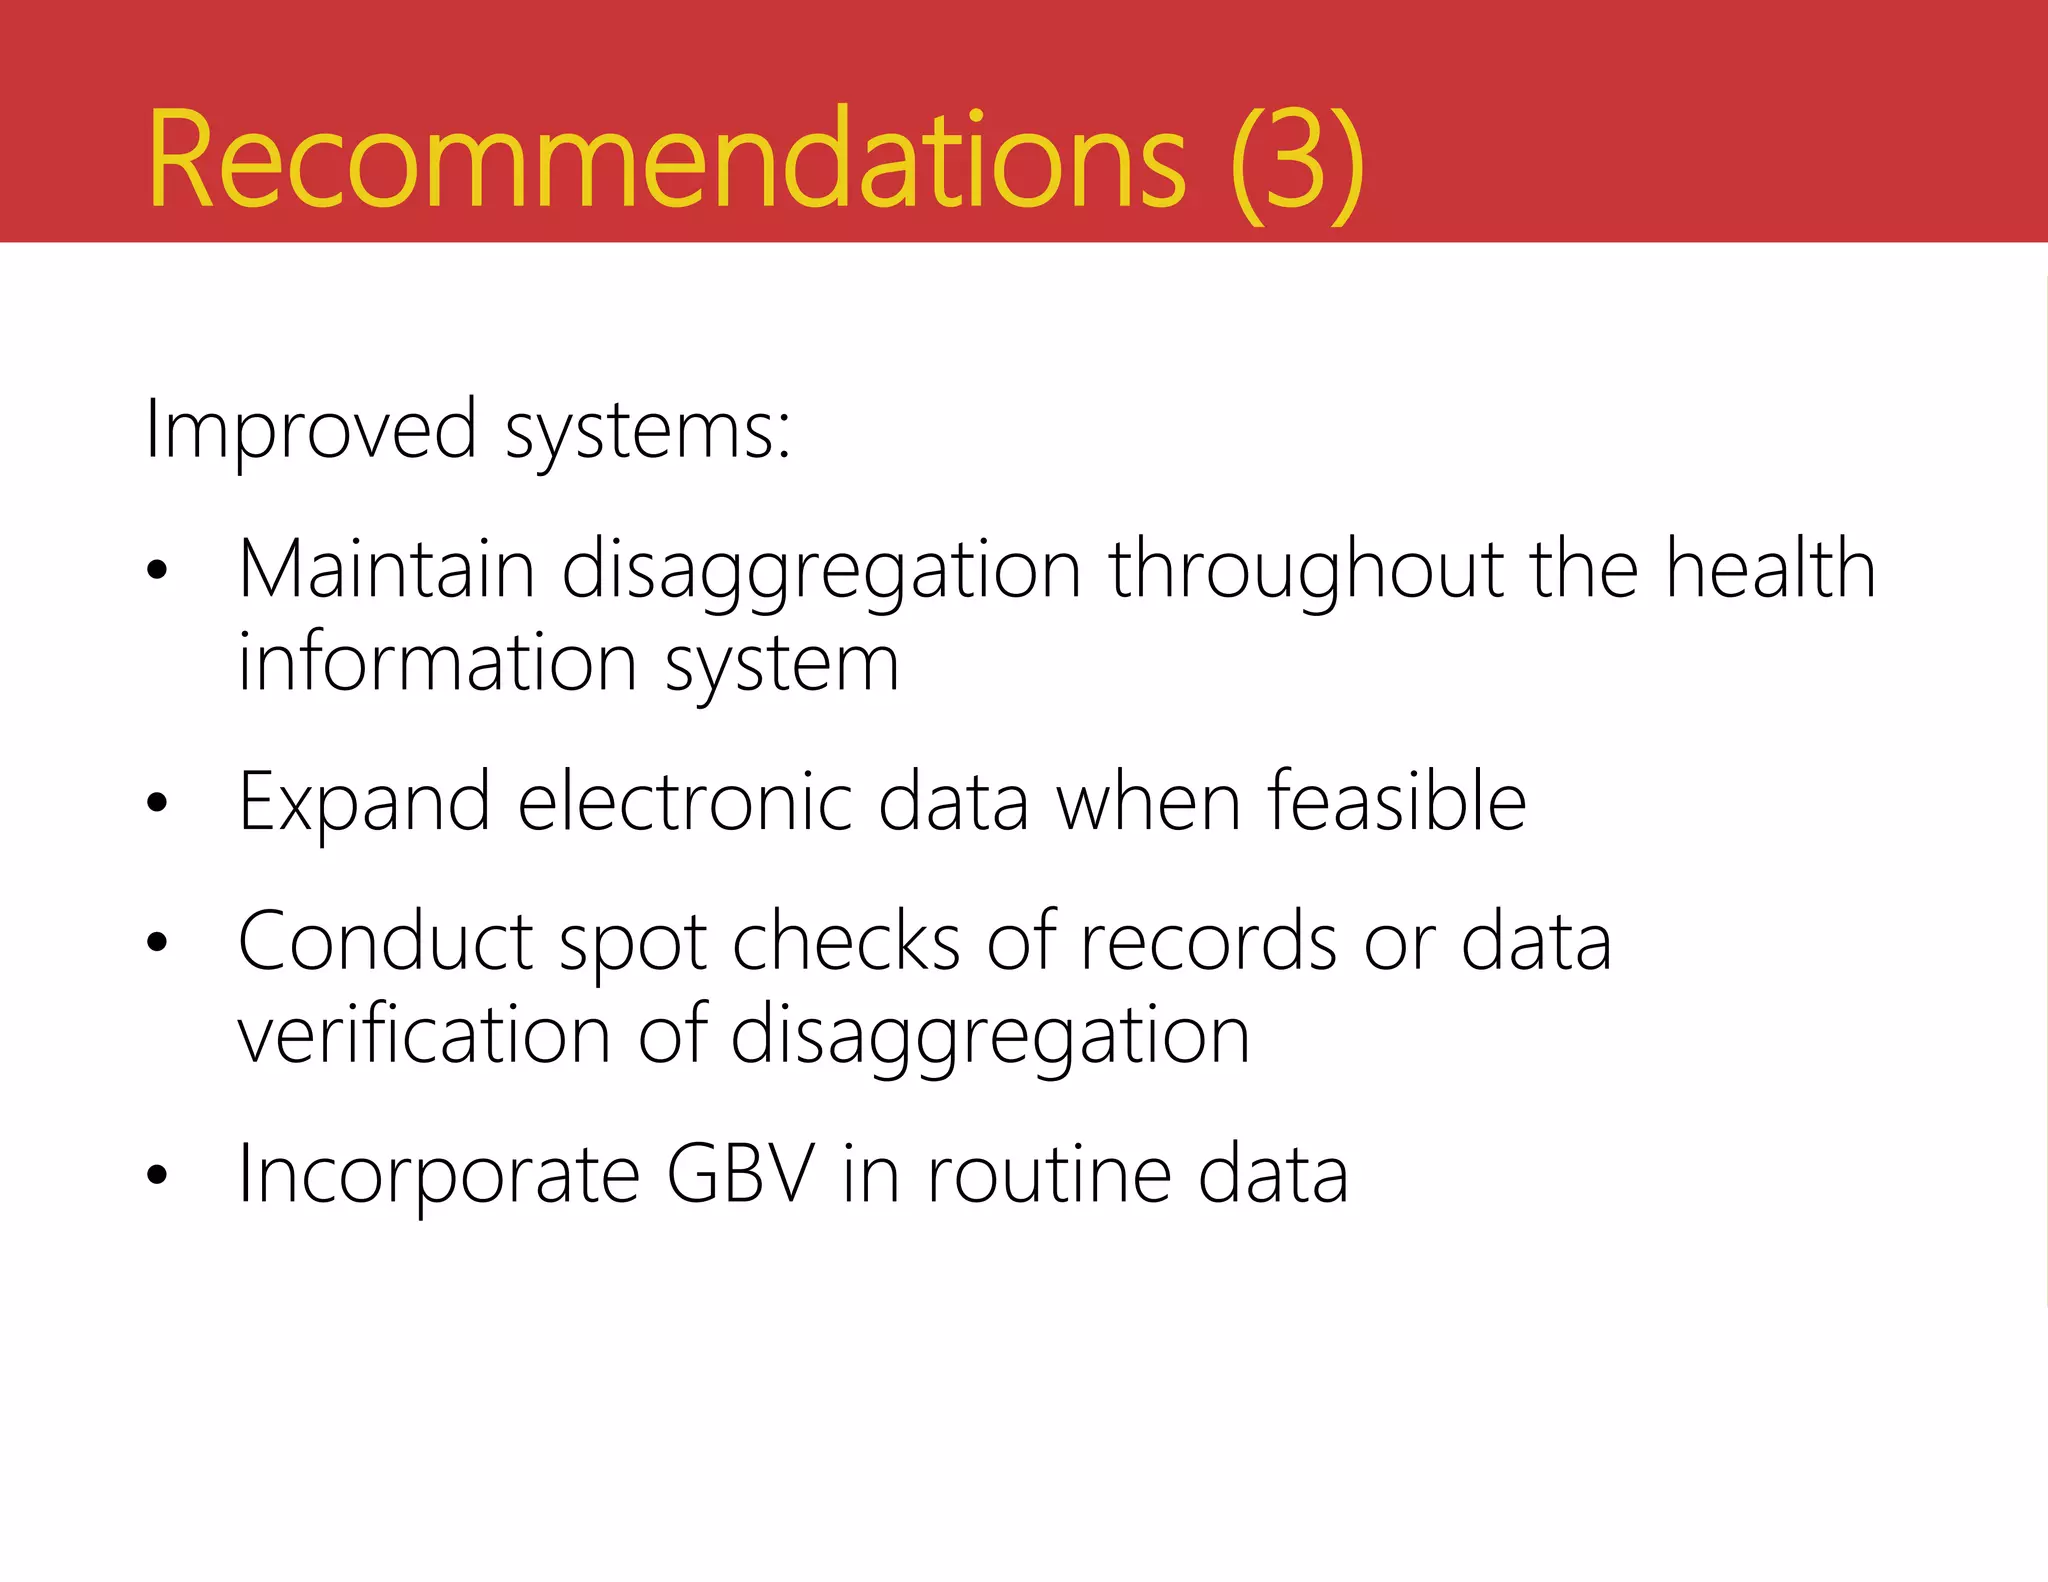
Demystifying Disaggregated
Data:
Factors that Affect Collection and Use
of Sex- and Age-Disaggregated Data
Jessica Fehringer, PhD, MPH
MEASURE Evaluation
University of North Carolina
June 29, 2017
Outline
1. Introduction/Background
2. Barriers and Facilitators to Availability and
Use of Sex- and Age-Disaggregated Data
(Abby Cannon)
3. Gender-Related Data Quality Assessment:
Lessons from a pilot (Carolina Mejia)
Definitions
Sex Gender
Biological classification
of males and females
Determined at birth,
based on biological
characteristics
Hard to change
Socially constructed
roles, duties, rights,
responsibilities, and
accepted behaviors
associated with being
male and female
Varies across cultures
and over time
Gender and Health
Adherence to rigid
gender roles can
create a gender gap
• Unequal options,
opportunities, and
realities that women and
men experience
Women
Men
Source: World Health Organization,
“Why Gender and Health?”
Gender Matters in Health
Gender inequality is associated with poor outcomes
• Higher child mortality, stunting, and wasting
• Lower maternal healthcare use; higher maternal
mortality
• Higher fertility; lower family planning use
• Gender-based violence (GBV)
Gender inequality is a major driver of the HIV epidemic
• Leads to less awareness and knowledge of
HIV
• GBV fuels the HIV epidemic
• More risky sex; less HIV testing and treatment
Why Age Matters
Gender norms may
differ between age
and sex groups; they
affect health risk
factors and use of
health services.
Example: The “sugar daddy” or “blesser” phenomenon. Girls and
young women in sub-Saharan Africa have a higher risk of
acquiring HIV than older women and than male peers.
Gender and Health Systems
How can health systems address gender inequality?
An integrative approach considers the impact of gender on
the people, the health program, and the results.
Health
problem
Gender-
specific needs
and barriers
Desired
health
outcomes
Health Information Systems Data
Why gender?
Availability and use of disaggregated data
allow program managers and decision
makers to:
• Examine service delivery, treatment, and health
outcome data in depth
• Reveal differences between sexes, age groups, or
key populations
• Make informed decisions
Barriers and Facilitators
Availability and Use
of Sex- and Age-
Disaggregated Data
Abby Cannon, MPH, MSW
MEASURE Evaluation
University of North Carolina
June 29, 2017
1) Determine the availability of sex- and age-
disaggregation of HIV and HIV-related
health indicators in two countries
2) Explore if and how sex- and age-
disaggregated data are used for decision
making
3) Investigate the facilitators and barriers to
collecting and using sex-disaggregated data
across indicators
Objectives
Methods
1) Desk review
• Understand the current levels of sex and age
disaggregation in national documents, including
discussion of gender issues.
2) Primary data collection
• Key informant interviews (n=28)
• Explore barriers to, and facilitators of collecting,
reporting, and using sex- and age-disaggregated
data
• Interviews were coded to identify relevant themes
Results: State of Disaggregation
HIV data are almost always disaggregated by
sex and age
• Variation in age bands used
• HIV retention data are captured by sex when
electronic data collection is available but not
when data are collected on paper
Results: State of Disaggregation
• Registers at the facility are disaggregated by sex
• When aggregated into summary tools, the male and
female fields are often combined into total number of
people
• More common for non-HIV technical area:
immunization, nutrition, tuberculosis, malaria
• Age bands vary more in non-HIV area
Collected by
sex & age
Aggregated Aggregated
Results: Use of Data
• Most key informants (KIs) could not offer
examples of using disaggregated data for
decision making.
• Most KIs expressed interest in seeing examples of
how disaggregated data have been used for
program and policy decisions.
• Opinions varied about who was responsible for
ensuring disaggregation and providing technical
support.
Facilitators
Value
Reporting
Requirements
Usefulness
“Epidemiologically,
why would you not
want to look at
male/female unless
the disease is only
for females or only
for males?”
─Kenyan stakeholder
“The disaggregation
brings in the human
aspects of what
you’re looking at. You
stop seeing statistics,
and start thinking of
them as people.”
─ Zambian
stakeholder
Barriers
Value
Reporting
Requirements
Usefulness Value
Reporting
Requirements
Lack of
Understanding
Resource
Burden
Reporting
Requirements
Lack of
Understanding
Resource
Burden
Program Priorities
Lack of
Understanding
“Under nutrition,
disaggregating
wouldn’t
necessarily be that
helpful. Children
are children.”
─ Zambian
stakeholder
“Once I enter into the
register, I now have to
get another paper and
start recording. And I
don’t have time. And
these then go to
another worker. It’s
time for an electronic
system, so we don’t
burden the health
worker.”
─ Zambian
stakeholder
Gender-Sensitive Indicators
• Knowledge of gender-sensitive indicators varied
• Few gender-sensitive indicators are routinely
collected
• Most key informants identified gender-based
violence (GBV) as a gender-sensitive indicator
that is collected
• When GBV data are collected, some forms
disaggregate by sex; others do not
• Often sexual violence is recorded, as well as provision of
post-exposure prophylaxis (PEP), but other incidents may
be lost
Conclusions
• Much progress has been made in
gender integration and sex- and age-
disaggregation in health information
systems.
• Gaps remain and increased efforts in
data disaggregation should be
approached in the following way:
• As a collaborative endeavor, to avoid
overburdening healthcare workers while
balancing essential data needed to
identify and address inequities
Recommendations (1)
Advocacy and awareness:
• Increase advocacy and training at all levels
about importance of disaggregation in health
information systems
• Increase awareness of how disaggregation
helps meet program goals
• Include gender focal persons for advocacy and
technical assistance
Recommendations (2)
Data training and guidance:
• Develop guidelines on how disaggregated data
can and should be used
• Improve capacity at the facility and national
level to use disaggregated data for decision
making
Recommendations (3)
Improved systems:
• Maintain disaggregation throughout the health
information system
• Expand electronic data when feasible
• Conduct spot checks of records or data
verification of disaggregation
• Incorporate GBV in routine data
Resources
Kenya:
https://www.measureevaluation.org/resources/pu
blications/tr-17-163
Zambia:
https://www.measureevaluation.org/resources/pu
blications/tr-17-160
Related publication from Tanzania:
https://www.measureevaluation.org/resources/pu
blications/tr-16-132
Brief:
https://www.measureevaluation.org/resources/pu
blications/fs-17-215
Detailed country results and recommendations
Questions?
Headline goes here
Headline goes here
Headline goes here
Author Name and Degree Here
MEASURE Evaluation
Your organization here
Date for presentation if necessary
Name of meeting
Gender-Integrated Routine
Data Quality Assessment
Lessons Learned from a Pilot
Carolina Mejia, PhD, MPH
University of North Carolina
MEASURE Evaluation
June 29, 2017
Objectives
1. Adapt and pilot a supplemental tool for assessing
gender integration during routine data quality
assessment (RDQA+G ).
2. Assess M&E strengths and weaknesses of
Implementing partners (IPs) of gender- integrated
data.
3. Strengthen the capacity of IPs to collect and use
good-quality gender-related data, without
external support.
Methods
The RDQA Process
Data
Verification
System
Assessment
Interpret the Output
Develop Action Plans
Disseminate Results
Ongoing Monitoring &
Follow-Up
Methods: System Assessment
M&E
structures,
functions,
capabilities Indicator
definition &
reporting
guidelines
Data
collection,
reporting,
forms, and
toolsData
management
processes
Evidence
informed
decision
making
Links to the
national
reporting
system
GenderIntegration
Additional Gender Items
II – Indicator Definitions and Reporting Guidelines
If the M&E Unit has disseminated formal indicator definitions, is this documentation
accessible to staff?
Do indicator definitions include description of data disaggregation by sex?
Do indicator definitions include description of data disaggregation by age groups?
If the M&E Unit has disseminated reporting guidelines (what to report, the required
template, to whom the report should be submitted, and the due date), is this
guidance accessible by relevant staff?
III – Data Collection and Reporting Forms and Tools
If the M&E Unit has identified standard data collection and reporting forms/tools to
be used at this reporting level, are these forms/tools consistently used? If not,
why in the comments section.
If the M&E Unit has provided instructions on how to complete the data collection
reporting forms/tools, are these instructions followed/adhered to? If not, explain
in the comments section.
Do data collection and reporting tools allow disaggregation by sex? Is there a clear
documented instruction on this?
Do data collection and reporting tools allow disaggregation by age groups? Is
clear documented instruction on this?
Methods
• Pilot RDQA+G conducted with PEPFAR IPs: 2 in Kenya and
2 in Zambia at 10 sites between May and December 2016.
1. HTC_TST = number of individuals who received HIV
testing and counseling (HTC) services for HIV and
received their test results.
2. GEND_GBV = number of people who received post-
GBV care.
3. OVC_SERV=number of active beneficiaries served by
PEPFAR programs for children and families affected by
HIV and AIDS.
• Time frame: 6-month period (SAPR16)
Findings
Summary System Assessment
HTC_TST (Overall and Gender)
Site
M&E
Structure,
Functions,
and
Capabilities
Indicator
Definitions
and
Reporting
Guidelines
Data
Collection and
Reporting
Forms/Tools
Data
Manage-
ment
Processes
Evidence-
Informed
Decision
Making
Links to
the
National
Reporting
System
Kenya 3.3 2.9 3.7 2.7 2.3 3.4
Zambia 3.6 3.3 4.0 3.0 2.1 3.7
(Score range from 1 to 4)
Site
M&E
Structure,
Functions,
and
Capabilities
Indicator
Definitions
and
Reporting
Guidelines
Data-
Collection and
Reporting
Forms/ Tools
Data
Manage-
ment
Processes
Evidence-
Informed
Decision
Making
Links to
the
National
Reporting
System
Kenya 1.6 4.0 4.0 1.0 0.8 3.3
Zambia 1.7 2.5 4.0 2.0 4.0 N/A
Gender Results
Areas of Strength: Gender
1. Sex- and age-disaggregated data are
collected for all three indicators of
interest.
2. Most data collection and
reporting tools allow
disaggregation by sex and age.
3. Some staff have received training
on gender.
4. There is willingness to learn more
about and integrate gender.
Areas for Improvement: Gender
1. Gaps exist around gender in monitoring and evaluation
(M&E) structures, guidelines, and evidence-informed
decision making.
2. Data entry for age and sex in registers is inconsistent over
the three indicators.
3. The orphans and vulnerable children database needs a
“sex” indicator in one country. (It is in the logs but not in
the IP database.)
4. M&E staff lack training on gender, and facility-level staff
lack training on use of gender data.
5. Regular supervision and data quality checks are lacking.
Recommendations (1)
For IPs:
1. Monitor progress
over time in reporting
accuracy, timeliness,
and completeness of
gender data
2. Include the following:
• Basic gender training for staff with minimal gender
experience (a refresher for other staff)
• Capacity building on gender analysis for data use
and decision making
Recommendations (2)
3. Develop and/or disseminate a gender
guidance and mainstreaming document,
where appropriate.
4. Ensure that project-specific databases include
data entry fields for sex and age.
Recommendations (3)
For USAID/Mission
5. Clarify PEPFAR expectations around gender
integration and analysis for IPs.
6. Facilitate IP gender training and data use and
provide gender mainstreaming documents to
IPs, where appropriate.
7. Consider using RDQA+G in place of RDQA.
Conclusion
• RDQA+G was successfully completed.
• The additional gender items can be a useful resource
for IPs to focus on gender-related data.
• The RDQA+G team noted many strengths in the
performance of the M&E system at the M&E Unit
and service delivery points.
• There are areas that need to be improved at the SDP
level, with guidance from the M&E Unit.
• MEASURE Evaluation will conduct a capacity building
workshop in 2017.
Resources
Guidelines for Integrating Gender into an M&E
Framework and System Assessment
www.measureevaluation.org/resources/publications/tr-16-128-en
DQA Auditing Tool Implementation Guidelines
www.measureevaluation.org/resources/tools/health-information-systems/data-
quality-assurance-tools/dqa-auditing-tool-implementation-guidelines/view
RDQA with Gender Tool
https://www.measureevaluation.org/our-work/gender/gender-integrated-routine-
data-quality-assessment-rdqa-g-tool/gender-integrated-routine-data-quality-
assessment-rdqa-g-tool
Have feedback on the RDQA+G? We’d love to hear it!
Email us at: cmejia@email.unc.edu
Questions?
This presentation was produced with the support of the United States
Agency for International Development (USAID) under the terms of MEASURE
Evaluation cooperative agreement AID-OAA-L-14-00004. MEASURE
Evaluation is implemented by the Carolina Population Center, University of
North Carolina at Chapel Hill in partnership with ICF International; John
Snow, Inc.; Management Sciences for Health; Palladium; and Tulane
University. Views expressed are not necessarily those of USAID or the United
States government.
www.measureevaluation.org

Demystifying Disaggregated Data: Factors that Affect Collection and Use of Sex- and Age-Disaggregated Data

  • 1.
    Demystifying Disaggregated Data: Factors thatAffect Collection and Use of Sex- and Age-Disaggregated Data Jessica Fehringer, PhD, MPH MEASURE Evaluation University of North Carolina June 29, 2017
  • 2.
    Outline 1. Introduction/Background 2. Barriersand Facilitators to Availability and Use of Sex- and Age-Disaggregated Data (Abby Cannon) 3. Gender-Related Data Quality Assessment: Lessons from a pilot (Carolina Mejia)
  • 3.
    Definitions Sex Gender Biological classification ofmales and females Determined at birth, based on biological characteristics Hard to change Socially constructed roles, duties, rights, responsibilities, and accepted behaviors associated with being male and female Varies across cultures and over time
  • 4.
    Gender and Health Adherenceto rigid gender roles can create a gender gap • Unequal options, opportunities, and realities that women and men experience Women Men Source: World Health Organization, “Why Gender and Health?”
  • 5.
    Gender Matters inHealth Gender inequality is associated with poor outcomes • Higher child mortality, stunting, and wasting • Lower maternal healthcare use; higher maternal mortality • Higher fertility; lower family planning use • Gender-based violence (GBV) Gender inequality is a major driver of the HIV epidemic • Leads to less awareness and knowledge of HIV • GBV fuels the HIV epidemic • More risky sex; less HIV testing and treatment
  • 6.
    Why Age Matters Gendernorms may differ between age and sex groups; they affect health risk factors and use of health services. Example: The “sugar daddy” or “blesser” phenomenon. Girls and young women in sub-Saharan Africa have a higher risk of acquiring HIV than older women and than male peers.
  • 7.
    Gender and HealthSystems How can health systems address gender inequality? An integrative approach considers the impact of gender on the people, the health program, and the results. Health problem Gender- specific needs and barriers Desired health outcomes
  • 8.
    Health Information SystemsData Why gender? Availability and use of disaggregated data allow program managers and decision makers to: • Examine service delivery, treatment, and health outcome data in depth • Reveal differences between sexes, age groups, or key populations • Make informed decisions
  • 9.
    Barriers and Facilitators Availabilityand Use of Sex- and Age- Disaggregated Data Abby Cannon, MPH, MSW MEASURE Evaluation University of North Carolina June 29, 2017
  • 10.
    1) Determine theavailability of sex- and age- disaggregation of HIV and HIV-related health indicators in two countries 2) Explore if and how sex- and age- disaggregated data are used for decision making 3) Investigate the facilitators and barriers to collecting and using sex-disaggregated data across indicators Objectives
  • 11.
    Methods 1) Desk review •Understand the current levels of sex and age disaggregation in national documents, including discussion of gender issues. 2) Primary data collection • Key informant interviews (n=28) • Explore barriers to, and facilitators of collecting, reporting, and using sex- and age-disaggregated data • Interviews were coded to identify relevant themes
  • 12.
    Results: State ofDisaggregation HIV data are almost always disaggregated by sex and age • Variation in age bands used • HIV retention data are captured by sex when electronic data collection is available but not when data are collected on paper
  • 13.
    Results: State ofDisaggregation • Registers at the facility are disaggregated by sex • When aggregated into summary tools, the male and female fields are often combined into total number of people • More common for non-HIV technical area: immunization, nutrition, tuberculosis, malaria • Age bands vary more in non-HIV area Collected by sex & age Aggregated Aggregated
  • 14.
    Results: Use ofData • Most key informants (KIs) could not offer examples of using disaggregated data for decision making. • Most KIs expressed interest in seeing examples of how disaggregated data have been used for program and policy decisions. • Opinions varied about who was responsible for ensuring disaggregation and providing technical support.
  • 15.
    Facilitators Value Reporting Requirements Usefulness “Epidemiologically, why would younot want to look at male/female unless the disease is only for females or only for males?” ─Kenyan stakeholder “The disaggregation brings in the human aspects of what you’re looking at. You stop seeing statistics, and start thinking of them as people.” ─ Zambian stakeholder
  • 16.
    Barriers Value Reporting Requirements Usefulness Value Reporting Requirements Lack of Understanding Resource Burden Reporting Requirements Lackof Understanding Resource Burden Program Priorities Lack of Understanding “Under nutrition, disaggregating wouldn’t necessarily be that helpful. Children are children.” ─ Zambian stakeholder “Once I enter into the register, I now have to get another paper and start recording. And I don’t have time. And these then go to another worker. It’s time for an electronic system, so we don’t burden the health worker.” ─ Zambian stakeholder
  • 17.
    Gender-Sensitive Indicators • Knowledgeof gender-sensitive indicators varied • Few gender-sensitive indicators are routinely collected • Most key informants identified gender-based violence (GBV) as a gender-sensitive indicator that is collected • When GBV data are collected, some forms disaggregate by sex; others do not • Often sexual violence is recorded, as well as provision of post-exposure prophylaxis (PEP), but other incidents may be lost
  • 18.
    Conclusions • Much progresshas been made in gender integration and sex- and age- disaggregation in health information systems. • Gaps remain and increased efforts in data disaggregation should be approached in the following way: • As a collaborative endeavor, to avoid overburdening healthcare workers while balancing essential data needed to identify and address inequities
  • 19.
    Recommendations (1) Advocacy andawareness: • Increase advocacy and training at all levels about importance of disaggregation in health information systems • Increase awareness of how disaggregation helps meet program goals • Include gender focal persons for advocacy and technical assistance
  • 20.
    Recommendations (2) Data trainingand guidance: • Develop guidelines on how disaggregated data can and should be used • Improve capacity at the facility and national level to use disaggregated data for decision making
  • 21.
    Recommendations (3) Improved systems: •Maintain disaggregation throughout the health information system • Expand electronic data when feasible • Conduct spot checks of records or data verification of disaggregation • Incorporate GBV in routine data
  • 22.
    Resources Kenya: https://www.measureevaluation.org/resources/pu blications/tr-17-163 Zambia: https://www.measureevaluation.org/resources/pu blications/tr-17-160 Related publication fromTanzania: https://www.measureevaluation.org/resources/pu blications/tr-16-132 Brief: https://www.measureevaluation.org/resources/pu blications/fs-17-215 Detailed country results and recommendations
  • 23.
  • 24.
    Headline goes here Headlinegoes here Headline goes here Author Name and Degree Here MEASURE Evaluation Your organization here Date for presentation if necessary Name of meeting Gender-Integrated Routine Data Quality Assessment Lessons Learned from a Pilot Carolina Mejia, PhD, MPH University of North Carolina MEASURE Evaluation June 29, 2017
  • 25.
    Objectives 1. Adapt andpilot a supplemental tool for assessing gender integration during routine data quality assessment (RDQA+G ). 2. Assess M&E strengths and weaknesses of Implementing partners (IPs) of gender- integrated data. 3. Strengthen the capacity of IPs to collect and use good-quality gender-related data, without external support.
  • 26.
    Methods The RDQA Process Data Verification System Assessment Interpretthe Output Develop Action Plans Disseminate Results Ongoing Monitoring & Follow-Up
  • 27.
    Methods: System Assessment M&E structures, functions, capabilitiesIndicator definition & reporting guidelines Data collection, reporting, forms, and toolsData management processes Evidence informed decision making Links to the national reporting system GenderIntegration
  • 28.
    Additional Gender Items II– Indicator Definitions and Reporting Guidelines If the M&E Unit has disseminated formal indicator definitions, is this documentation accessible to staff? Do indicator definitions include description of data disaggregation by sex? Do indicator definitions include description of data disaggregation by age groups? If the M&E Unit has disseminated reporting guidelines (what to report, the required template, to whom the report should be submitted, and the due date), is this guidance accessible by relevant staff? III – Data Collection and Reporting Forms and Tools If the M&E Unit has identified standard data collection and reporting forms/tools to be used at this reporting level, are these forms/tools consistently used? If not, why in the comments section. If the M&E Unit has provided instructions on how to complete the data collection reporting forms/tools, are these instructions followed/adhered to? If not, explain in the comments section. Do data collection and reporting tools allow disaggregation by sex? Is there a clear documented instruction on this? Do data collection and reporting tools allow disaggregation by age groups? Is clear documented instruction on this?
  • 29.
    Methods • Pilot RDQA+Gconducted with PEPFAR IPs: 2 in Kenya and 2 in Zambia at 10 sites between May and December 2016. 1. HTC_TST = number of individuals who received HIV testing and counseling (HTC) services for HIV and received their test results. 2. GEND_GBV = number of people who received post- GBV care. 3. OVC_SERV=number of active beneficiaries served by PEPFAR programs for children and families affected by HIV and AIDS. • Time frame: 6-month period (SAPR16)
  • 30.
  • 31.
    Summary System Assessment HTC_TST(Overall and Gender) Site M&E Structure, Functions, and Capabilities Indicator Definitions and Reporting Guidelines Data Collection and Reporting Forms/Tools Data Manage- ment Processes Evidence- Informed Decision Making Links to the National Reporting System Kenya 3.3 2.9 3.7 2.7 2.3 3.4 Zambia 3.6 3.3 4.0 3.0 2.1 3.7 (Score range from 1 to 4) Site M&E Structure, Functions, and Capabilities Indicator Definitions and Reporting Guidelines Data- Collection and Reporting Forms/ Tools Data Manage- ment Processes Evidence- Informed Decision Making Links to the National Reporting System Kenya 1.6 4.0 4.0 1.0 0.8 3.3 Zambia 1.7 2.5 4.0 2.0 4.0 N/A
  • 32.
  • 33.
    Areas of Strength:Gender 1. Sex- and age-disaggregated data are collected for all three indicators of interest. 2. Most data collection and reporting tools allow disaggregation by sex and age. 3. Some staff have received training on gender. 4. There is willingness to learn more about and integrate gender.
  • 34.
    Areas for Improvement:Gender 1. Gaps exist around gender in monitoring and evaluation (M&E) structures, guidelines, and evidence-informed decision making. 2. Data entry for age and sex in registers is inconsistent over the three indicators. 3. The orphans and vulnerable children database needs a “sex” indicator in one country. (It is in the logs but not in the IP database.) 4. M&E staff lack training on gender, and facility-level staff lack training on use of gender data. 5. Regular supervision and data quality checks are lacking.
  • 35.
    Recommendations (1) For IPs: 1.Monitor progress over time in reporting accuracy, timeliness, and completeness of gender data 2. Include the following: • Basic gender training for staff with minimal gender experience (a refresher for other staff) • Capacity building on gender analysis for data use and decision making
  • 36.
    Recommendations (2) 3. Developand/or disseminate a gender guidance and mainstreaming document, where appropriate. 4. Ensure that project-specific databases include data entry fields for sex and age.
  • 37.
    Recommendations (3) For USAID/Mission 5.Clarify PEPFAR expectations around gender integration and analysis for IPs. 6. Facilitate IP gender training and data use and provide gender mainstreaming documents to IPs, where appropriate. 7. Consider using RDQA+G in place of RDQA.
  • 38.
    Conclusion • RDQA+G wassuccessfully completed. • The additional gender items can be a useful resource for IPs to focus on gender-related data. • The RDQA+G team noted many strengths in the performance of the M&E system at the M&E Unit and service delivery points. • There are areas that need to be improved at the SDP level, with guidance from the M&E Unit. • MEASURE Evaluation will conduct a capacity building workshop in 2017.
  • 39.
    Resources Guidelines for IntegratingGender into an M&E Framework and System Assessment www.measureevaluation.org/resources/publications/tr-16-128-en DQA Auditing Tool Implementation Guidelines www.measureevaluation.org/resources/tools/health-information-systems/data- quality-assurance-tools/dqa-auditing-tool-implementation-guidelines/view RDQA with Gender Tool https://www.measureevaluation.org/our-work/gender/gender-integrated-routine- data-quality-assessment-rdqa-g-tool/gender-integrated-routine-data-quality- assessment-rdqa-g-tool Have feedback on the RDQA+G? We’d love to hear it! Email us at: cmejia@email.unc.edu
  • 40.
  • 41.
    This presentation wasproduced with the support of the United States Agency for International Development (USAID) under the terms of MEASURE Evaluation cooperative agreement AID-OAA-L-14-00004. MEASURE Evaluation is implemented by the Carolina Population Center, University of North Carolina at Chapel Hill in partnership with ICF International; John Snow, Inc.; Management Sciences for Health; Palladium; and Tulane University. Views expressed are not necessarily those of USAID or the United States government. www.measureevaluation.org