

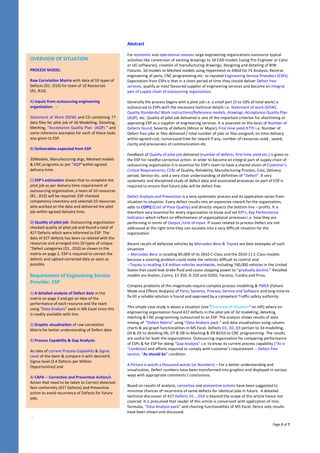
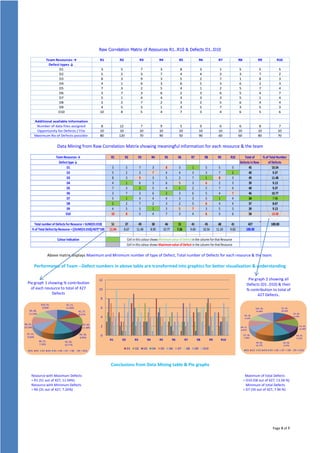
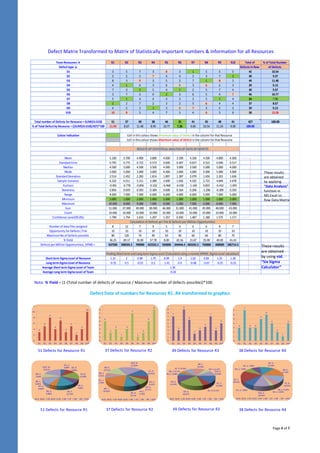
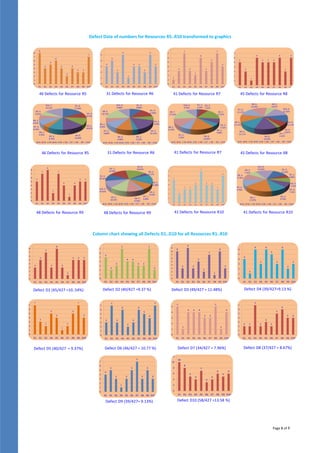
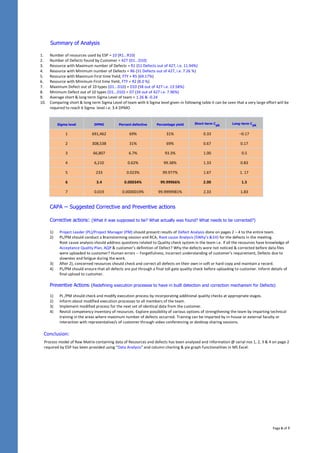

This document analyzes defect data from a pilot engineering project outsourced to an engineering service provider (ESP) to identify opportunities for improvement. The outsourcing organization found 427 defects in the pilot job. The ESP analyzed the defect matrix using Excel to determine: 1) Which resource contributed the most defects (R1 at 51 defects) and least defects (R6 at 31 defects). 2) Which defect type was most common (D10 at 58 defects) and least common (D7 at 34 defects). 3) The overall performance of the ESP team based on defect numbers and percentages. 4) Opportunities for corrective and preventive actions to address the defects and prevent reoccurrence in the future


