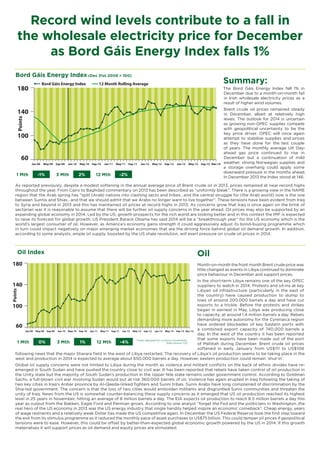
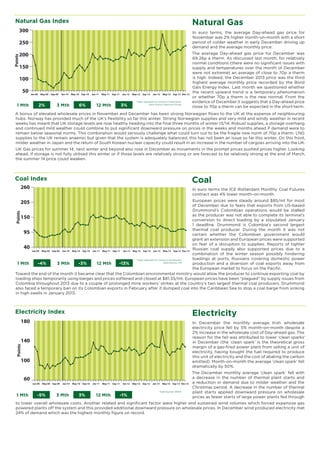
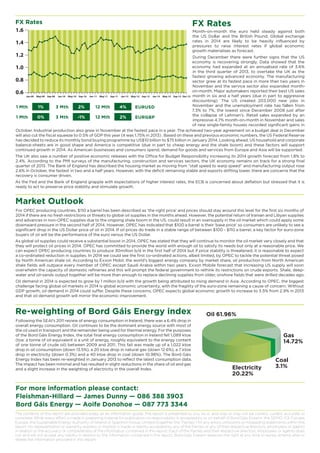
The Bord Gáis Energy Index fell 1% in December due to lower Irish wholesale electricity prices as a result of higher wind volumes which reduced costs. Brent crude oil prices were steady in December due to ongoing conflicts and supply disruptions in Libya and other regions. Natural gas and coal prices in Europe rose slightly over the month while the euro remained steady against the US dollar and British pound.
The Bord Gáis Energy Index from June 2013.
The Bord Gáis Energy Index was stable (-1%) in June as falls in the Irish wholesale electricity, UK Day-ahead gas and European coal prices were counteracted by a rising front month Brent crude oil price.
The Bord Gáis Energy Index for September 2014 saw significant increases in the wholesale prices of Natural Gas (21%) and Electricity (17%). This was mostly offset by a fall in Brent Crude Oil as the Bord Gáis Energy Index rises by 3%.
The Bord Gáis Energy Index fell 1% in October 2013 due to modestly softer wholesale gas and electricity prices in Ireland. While wholesale commodity prices were relatively stable, Brent crude oil prices experienced significant volatility within the month due to geopolitical events affecting supply in Libya. The Index level stood at 143 at the end of October.
The Bord Gáis Energy Index fell 3% in September despite rises in wholesale gas, electricity, and coal prices, driven by a 7% drop in Brent crude oil prices due to easing geopolitical tensions over Syria and Iran. UK wholesale gas prices rose 4% in September as utilities replenished depleted storage stocks, while electricity prices increased 5% due to higher gas and carbon prices. Coal prices increased 7% on short-covering and expectations of tighter supply.
The Bord Gáis Energy Index fell 9% in November 2014 to its lowest level in over four years as global oil prices continued to plunge. The document discusses factors contributing to declining oil prices such as increased North American oil production, OPEC's decision not to cut production, and geopolitical issues. It also summarizes trends in natural gas and coal markets, noting prices declines there as well driven by oversupply and weaker demand.
Month-on-month the Bord Gáis Energy Index rose 1% in January due to rising wholesale electricity prices as reduced availability of efficient power plants increased costs despite falling UK gas prices and record wind volumes. UK gas prices fell further in January due to ample supplies and continued mild weather, while the euro weakened against the US dollar and British pound on expectations of interest rate hikes in those economies amid positive economic data.
1) The Bord Gáis Energy Index fell in December due to ongoing declines in global oil prices, with the index at 103.
2) A major factor has been the surge in US oil production, which has increased 80% since 2008 and now dominates price behavior after OPEC chose not to cut production in November.
3) Lower oil prices are good for the global economy as consumers benefit but pose challenges for oil-dependent countries and economies that rely on oil revenues to fund budgets.
Mercer Capital's Value Focus: Energy Industry | Q3 2019 | Region Focus: BakkenMercer Capital
Mercer Capital's Energy Industry newsletter provides perspective on valuation issues. Each newsletter also typically includes macroeconomic trends, industry trends, and guideline public company metrics.
Aranca views - Shale Gas - the Next Cradle of Energy?Aranca
As of 2013, recoverable shale gas resources account for nearly one third of the total gas energy resources of the world. The article highlights US, Europe, China, Canada & GCC region's shale gas statistics, impacts & consumption.
The February Bord Gáis Energy Index rose 16% month-over-month as the prices of oil, gas, coal, and electricity all increased. The main driver was a nearly $10 per barrel increase in the price of oil due to falling US rig counts restricting future US oil production growth. Despite the rally in prices, oil remains well below its 2011-2014 price range of $100-120 per barrel due to continued oversupply. Demand growth is not expected to be strong enough in 2015 to significantly reduce inventories and support further price increases.
The Bord Gáis Energy Index fell 4% in July due to weaker Brent crude oil, gas, and wholesale electricity prices. Geopolitical tensions in Ukraine continued as Russia suspended gas deliveries, while negotiations with Iran over its nuclear program were extended. Global oil supplies remained strong despite conflicts, weighing on prices. The euro weakened against the dollar and pound, partially offsetting declines in wholesale energy prices in euro terms. Wholesale coal prices rose 7% amid concerns that sanctions against Russia could disrupt supplies.
The Bord Gáis Energy Index fell 5% in May due to declines in wholesale electricity, oil, coal, and natural gas prices from their record highs earlier in the year. Irish wholesale electricity prices fell 11% as UK gas prices softened and power imports from the UK increased with the new interconnecter cable. Brent crude prices fell slightly to around $100/barrel on expectations that increasing North American shale oil production would weaken global oil markets, while weaker economic data from China also weighed on oil prices. Coal and natural gas prices in Europe also declined from previous months' highs due to mild weather, high inventories, and a weak eurozone economy.
The Bord Gáis Energy Index was unchanged in August as stronger wholesale gas, coal and electricity prices offset lower Brent crude oil prices. Higher gas, coal, and electricity prices were driven by supply restrictions, rising demand, and uncertainty around potential conflict between Ukraine and Russia. Lower Brent crude prices were due to increased African oil supply and soft global demand, despite geopolitical risks in the Middle East.
1) The April Bord Gáis Energy Index rose 8% month-over-month as Brent crude oil prices increased nearly $12 per barrel due to geopolitical tensions and supply disruptions.
2) Robert Smithson argues that US tight oil production is more resilient to low prices than expected and that production costs are decreasing, suggesting oil prices may remain lower for longer.
3) Multiple factors including outages, declining spare capacity, and Middle East tensions supported higher oil prices in April, though stockpiles remain elevated and demand growth is expected to be modest.
The Bord Gáis Energy Index rose 4% in October due to higher prices for Brent crude oil, European coal, and wholesale electricity. A weaker euro contributed to higher prices for oil, coal, and gas, which are traded in dollars and pounds. Global gas supplies have expanded significantly in recent years due to new sources like shale gas, coal seam gas, and floating LNG facilities. This has led to a surplus of natural gas and lower wholesale gas prices in many markets like the UK. The oversupply situation could persist for some time as new LNG export capacity continues to come online through 2020.
This document discusses the impact of shale gas development in North America on global natural gas markets and the oil and gas industry in the Gulf Cooperation Council (GCC) region. It finds that shale gas has significantly increased US natural gas production and lowered prices, making the US a potential gas exporter. This could threaten established gas exporters like Qatar by increasing competition and downward pressure on gas prices. GCC countries that import gas may benefit from better import prices but gas-rich countries face threats from potential substitution of gas for oil. Overall, shale gas presents both opportunities and threats to the GCC that will depend on future production and price trends in global gas markets.
1) The Bord Gáis Energy Index fell 5% in October due to a 9% plunge in global oil prices from over $115 per barrel in June to $83.78 per barrel in October.
2) Wholesale natural gas prices in the UK increased 4% in October from seasonal higher demand despite record-high stock levels and mild weather so far.
3) The EU emissions trading scheme has failed to adequately incentivize the transition to low-carbon energy sources due to oversupply of carbon credits, keeping prices too low at around €6.59 per tonne of carbon emissions.
1) The Bord Gáis Energy Index fell 1% in August as modest increases in the Brent crude oil price were offset by falls in the wholesale prices of gas, coal, and electricity.
2) Commodity prices have fallen significantly from their highs in recent years due to oversupply issues in almost all raw materials markets driven by slowing demand from China.
3) The US administration took steps toward ending its ban on crude oil exports, which could benefit US oil producers and allies while hurting countries like Russia, Venezuela, and Iran if the ban is fully lifted. However, many political and economic issues still need to be addressed.
The monthly Short-Term Energy Outlook (STEO) from the U.S. Energy Information Administration for December 2016. This issue makes a couple of key points re natural gas: (1) EIA predicts that natural gas production in the U.S. for 2016 will see a healthy decline over 2015 levels--1.3 billion cubic feet per day (Bcf/d) less in 2016. That's the first annual production decline since 2005! (2) The EIA predicts the average price for natural gas at the benchmark Henry Hub will climb from $2.49/Mcf (thousand cubic feet) in 2016 to a whopping $3.27/Mcf in 2017. Why the jump? Growing domestic natural gas consumption, along with higher pipeline exports to Mexico and liquefied natural gas exports.
1) The Bord Gáis Energy Index fell 3% in May due to weaker wholesale gas and electricity prices, though the drop was softened by a weakening euro.
2) Brent crude oil prices were unchanged after recovering in previous months, but further gains are uncertain due to the ongoing oil supply glut.
3) Gazprom's profits declined in 2014 due to lower European demand, higher costs, and disputes with Ukraine over gas transit, and the company faces potential EU fines over antitrust issues.
The Bord Gáis Energy Index was unchanged in May as rising Brent crude oil prices offset falling wholesale gas and electricity prices. Brent crude remained around $110 per barrel due to geopolitical tensions and concerns about spare global oil capacity over the summer. Wholesale gas prices fell to 31⁄2 year lows due to high stock levels and mild winter demand. Electricity prices dropped 4% as gas-fired generation dominates Irish supply. The Euro weakened against the dollar and pound on expectations the ECB will cut rates in June to boost inflation and growth.
An issue brief/report from the Manhattan Institute. The 20-page report says now is the time for the U.S. to press its advantage in shale energy. The report's writer, senior fellow at the Manhattan Institute, Oren Cass, points out the cyclical nature of commodity prices for oil and gas and says even though prices are down now--they won't stay that way. In order to take full advantage of the shale boom, Cass suggests 11 reforms to help craft a smarter U.S. energy policy--one that will amplify the current boom and extend it far into the future.
The Bord Gáis Energy Index fell 5% in February due to high wind generation and mild weather which lowered wholesale gas and electricity prices in both Ireland and the UK. Approximately 23% of Ireland's electricity was generated by wind, contributing to a 13% drop in wholesale electricity prices. Mild weather also reduced gas demand and prices fell 10% as storage levels increased. The Ukraine crisis did not initially impact prices but they spiked in early March due to concerns over European gas supplies from Russia through Ukraine.
- Depletion of existing oil wells is expected to outpace new sources of oil supply in 2016 for the first time in years due to low oil prices putting many projects on hold
- Existing fields are expected to lose 3.3 million barrels per day while new fields will only add 3 million barrels per day
- By 2017, the supply/depletion balance will widen further, with depletion exceeding new production by around 1.2 million barrels per day
The document provides a weekly update on the global oil and gas markets. It discusses how the upcoming US presidential election is unlikely to significantly impact near-term energy markets. Oil, gas, and equity markets continue looking past current economic weakness as demand recovers slower than expected. US natural gas prices have risen due to declining production and increasing demand from LNG exports and industry. Jet fuel demand remains weak as air travel has not recovered, impacting oil demand forecasts through 2021. The document also provides brief details on EY as an organization focused on the oil and gas sector.
The Bord Gáis Energy Index rose in August due to concerns over global oil supplies stemming from conflicts and instability in Syria, Libya, and Egypt. Brent crude oil prices increased 6% due to threats to supply from the Suez Canal. The Index also rose as the wholesale gas price increased 2% and concerns grew over tightening oil markets with supply issues in Libya and Iraq.
The Bord Gáis Energy Index fell 5% in April due to lower wholesale gas and electricity prices. Gas prices declined with healthy supply and lower demand, though tensions over Ukraine caused occasional price increases. Falling gas and carbon prices contributed to lower wholesale electricity prices in Ireland. Oil prices saw minor changes and remained in a narrow range.
- Brent crude oil prices rose in June due to escalating violence in Iraq from the militant group ISIL seizing territory, raising concerns over global oil supply stability. However, the majority of Iraq's oil production and exports so far remain unaffected.
- Wholesale natural gas and electricity prices in Europe continued to decline due to ample gas supply, offsetting the rise in oil prices and leaving the Bord Gáis Energy Index unchanged month-over-month.
- Coal prices also fell slightly due to weak demand and high stockpiles in Europe.
- In December 2015, the Bord Gáis Energy Index fell 13% as wholesale prices for Brent crude oil, UK gas, European coal, and Irish electricity all recorded losses. The index stood at another record low of 79.
- Prices continued to decline across the board, with oil falling 19% to close below $38/barrel for the first time in a decade due to oversupply and weak demand. Other fuels like UK gas and European coal also recorded losses.
- The euro strengthened against the US dollar and British pound over the month, exacerbating losses in the energy index which is adjusted for currency movements.
Falling wholesale gas prices in the UK and weaker Brent crude oil prices drove a record month-on-month drop in Ireland's Bord Gáis Energy Index in April. UK gas prices eased back from March highs as supplies increased and demand decreased with warmer weather, while Brent crude fell below $100/barrel due to increased supplies and reduced demand concerns. Irish wholesale electricity prices also declined as the three main cost components - UK gas, carbon, and 'spark' rates - all decreased in April. Looking ahead, oil prices are expected to remain around $100/barrel barring geopolitical events, with OPEC maintaining output, while UK gas prices may rise if summer LNG imports are lower than
1) The Bord Gáis Energy Index fell 9% in March as wholesale prices of oil, gas, coal, and electricity all recorded losses. A framework agreement between Iran and world powers added downward pressure on oil prices by potentially adding 1 million barrels per day of Iranian oil to global markets, though experts say this increase may not occur until 2016.
2) Natural gas prices in the UK fell as strong liquefied natural gas imports increased supplies. Coal prices also weakened due to high stock levels in Europe and declining demand from China.
3) Irish wholesale electricity prices fell due to lower gas and coal prices, but prices were also influenced by the intermittent pattern of wind power, which at times led to price
- Global oil prices have declined dramatically since 2014, falling over 50% from $110 per barrel in mid-2014 to under $30 per barrel currently. This is due to a large supply glut as production from US shale oil, Iraq, and elsewhere increased sharply while demand growth has slowed.
- The decline has had significant economic consequences around the world, hurting oil-exporting countries like Russia, Venezuela, Iran and Saudi Arabia while benefiting oil-importing nations. The future of oil prices remains highly uncertain depending on future supply and demand dynamics.
EY Price Point: global oil and gas market outlookEY
We enter 2021 on a note of cautious optimism for global health, the world economy, and the oil and gas markets. The first weeks of December brought approval in the US and the UK of the first of several COVID-19 vaccines. The speed with which vaccine development occurred is unprecedented, but certainly welcome. In the weeks following the early November announcement of 90+% effectiveness by the manufacturer of the first approved vaccine, the price of WTI crude oil increased by US$10/bbl to US$48/bbl, the highest level since early March. Sustainability hasn’t returned yet, and whatever time it takes to get the world to normal, it will take even longer for normalization within the oil and gas markets. Inventories remain at historically high levels and, optimistically, it will take until April before inventory returns to levels observed in the preceding five years. That’s an estimate, and there has obviously been some difficulty properly calibrating the expectations of how balance will return and how long it will take. In late November, OPEC met to adjust its output plans because of the anemic rebound in demand. In mid-December, the IEA lowered its demand forecast for 2021 due mostly to continued sluggishness in aviation fuel demand.
A mild winter has interrupted a recovery in North American natural gas prices after a run-up motivated by curtailed capital expenditures, upstream activity and production. After an initial meltdown, with cargo cancellations and dramatic price reversal, LNG markets have made a remarkable comeback, and the spread between Asia and Henry Hub has reached a level we haven’t seen in almost three years. It may be the case that interruption in FIDs has brought us to the cusp of a balance that can support reliable returns.
The document discusses trends in global energy markets in 2014. It notes that oil prices plummeted towards the end of the year due to oversupply and weakening global economic growth. Natural gas prices also fell to four-year lows in Europe. Carbon prices in the EU rose as allowances were cut, but remain below levels needed to incentivize switching from coal to gas. Global coal prices continued a four-year downtrend due to weaker than expected demand growth.
1) The Bord Gáis Energy Index fell 5% in January due to lower wholesale prices for oil, gas, coal, and electricity. Brent crude oil prices stabilized around $50 per barrel after rapid declines in the previous months.
2) Concerns grew about weak economic growth in Europe and China. The ECB announced a quantitative easing program to try to stimulate inflation and demand.
3) Most energy commodity prices continued to decline in January except for small increases in oil and natural gas prices at the end of the month. Overall market sentiment remained bearish due to expectations of high supplies and weak demand growth.
EY Price Point: global oil and gas market outlook, Q2 | April 2022EY
The theme for this quarter is rearrangement. The loss, or potential loss, of Russian oil and gas supplies is forcing producers, refiners and traders to rethink the flow of crude oil and refined products from the wellhead to the gas pump in light of sanctions, potential sanctions and the risk of reputational damage. Countries, companies and consumers will all be searching for ways to adapt, and the outcome of the race to bring alternatives to market could alter the global energy landscape for years to come.
It is likely crude oil and LNG prices will remain elevated for some time. The process of diverting Russian oil through countries unwilling to sanction it will take time and there is little indication OPEC members are willing (or able) to increase production to make up for the loss of Russian crude. Spare capacity sat at 3.7 mbpd at the end of 2021, just above where it was in January 2020. Currently, sanctioned Venezuelan and Iranian production (about 3 mbpd below their peak) could fill the gap, but political and commercial obstacles remain. At today’s prices, US shale production is attractive, but the fastest the industry has been able to grow is between 1mbpd and 2mbpd per year. The LNG infrastructure was already stretched before the war in Ukraine and there is little prosect of finding new supplies soon.
As the largest buyer of Russian energy, Europe will be the epicenter. There is a deeply embedded bias there in favor for renewable energy, and the current crisis is certain to result in an all-out effort to accelerate the build-out of wind and solar power. The capacity to add new green energy is limited though by the project pipeline and supply chains for solar panels and wind turbines, and it is likely that much of the shortfall will be made up with the new LNG infrastructure.
- In January 2016, the Bord Gáis Energy Index fell 7% as wholesale prices declined for Brent crude oil (-7%), UK gas (-9%), European coal (-3%), and Irish electricity (-8%).
- Brent oil prices hit 12-year lows of $27.88/barrel in January due to oversupply and the lifting of Iranian sanctions.
- UK natural gas prices averaged 32.02 pence/therm in January, down from 34.16 pence/therm in December, as mild weather and ample supplies weighed on prices.
- Most energy commodity prices recorded losses in January as supply remained high and demand was weak.
VF: Exploration and Production: Q4 2018 | Region Focus: AppalachiaMercer Capital
Mercer Capital's Energy Industry newsletter provides perspective on valuation issues. Each newsletter also typically includes macroeconomic trends, industry trends, and guideline public company metrics.
This document is a weekly newsletter from TheEquicom providing analysis and commentary on commodity markets such as gold, silver, crude oil, natural gas, copper, lead, zinc, and aluminum. It includes market wrap summaries on these commodities, with details on prices, trends, support and resistance levels, and trading strategies. Technical indicators and outlooks are provided on key commodities like gold, silver, crude oil, and copper. Pivot tables with price script levels are also included.
Saudi Aramco and Sinopec have started test runs at their new 400,000 barrel per day Yanbu refinery in Saudi Arabia, which is scheduled to begin commercial exports in October or November. The startup of new refining capacity in Saudi Arabia adds to oversupply concerns and downward pressure on oil prices from increased competition in refined fuel markets. Asian refiners are struggling with weak margins due to disappointing demand growth and excess refined product supply from the Middle East. Saudi Aramco cut its October crude prices for Asian customers more than expected in response to weak Asian demand and falling price spreads between Brent and Dubai crude benchmarks. Global oil inventories have risen sharply in recent months as benchmark crude prices have fallen, indicating over
The Bord Gáis Energy Index rose 1% in March as rising wholesale electricity prices offset falling oil and gas prices. Wholesale electricity prices increased 6% due to low wind volumes and forced outages of efficient gas and coal plants. Wholesale UK gas prices fell 5% amid mild weather and low demand, though concerns remain about potential disruptions to European gas supplies from Russia through Ukraine due to unpaid gas debts.
1) The document analyzes factors that could impact future oil prices over the next 4-6 years based on historical price events in 1986 and 1999.
2) It predicts, based on analysis of price peaks and troughs, that the WTI oil price will reach $59/barrel in 2021 and $90/barrel by 2027 after adjusting for 3% annual inflation.
3) Key factors that could affect future oil prices positively or negatively include the U.S. rig count, storage capacity limits, the size of the fracklog of uncompleted wells, geopolitical events, and actions by OPEC.
The Guinness Global Energy Report for March 2017 provides the following highlights:
1) Oil prices were flat in February as signs of good OPEC compliance with production cuts were offset by rising US inventories due to high imports.
2) US natural gas prices fell as mild winter weather reduced heating demand, while the market remains structurally undersupplied.
3) Energy stocks underperformed the broader market in February as the MSCI World Energy Index fell 2.0% compared to a 2.8% rise in the MSCI World Index.
Interesante analisis sobre los dividendos de la paz en Colombia,
“Colombia’ s peace deal could spur oil sector turnaround” (Acuerdos de paz en Colombia podrían estimular al sector petrolero),
The Bord Gáis Energy Index increased 3% in March as oil prices rallied over 5% on a currency adjusted basis. Other energy sources showed mixed performance, with UK gas down 1%, European coal down 3% and Irish electricity up 1%. Oil prices rebounded over 10% on expectations that a production freeze agreement between major producers will be reached in April to curb the global oil surplus. However, rebalancing the oil market may take time due to high global inventory levels. The euro strengthened against the US dollar and British pound.
In February 2016, the Bord Gáis Energy Index fell 1% month-over-month. Oil prices rose 3% while UK gas, European coal, and Irish electricity prices declined between 3-10% from the previous month. The report provides an overview of movements in prices for oil, natural gas, coal, and electricity in February and discusses factors influencing these markets such as supply and demand fundamentals as well as geopolitical issues.
- The Bord Gáis Energy Index fell 5% in November 2015 to its lowest ever point of 90, as the wholesale prices of Brent crude oil, UK gas, European coal, and Irish electricity all declined month-over-month.
- The document discusses how low oil prices are significantly impacting oil-exporting countries in the Gulf region, with Saudi Arabia still relying on oil for 85% of its budget despite efforts to diversify its economy.
- OPEC failed to agree on output limits at its December 2015 meeting, allowing oil production to remain high and adding to the global supply glut that is depressing prices.
The September 2015 Bord Gáis Energy Index fell 6% due to excess global oil supplies weighing on oil prices, with Brent crude falling to its lowest point since March 2009 of $48.37 per barrel. The index stood at 91 in September, a new record low. The document also discusses the Volkswagen emissions scandal casting doubt on the future of diesel engines in Europe. While diesel demand has surged in Europe due to tax policies and fuel efficiency, the scandal uncovered that diesel vehicles were emitting nitrogen oxide at levels seven times the legal limit. Continued low oil prices are driven by a global supply glut as US frackers and OPEC countries like Saudi Arabia and Iraq maintain high production levels.
The July 2015 Bord Gáis Energy Index fell 9% month-over-month due to weaker oil prices driven by abundant global supply. The index level of 98 was the lowest since December 2009. Brent crude oil prices continued to weaken, closing at the lowest price recorded by the index. The UK government announced plans to scrap an exemption to the Climate Change Levy for renewable electricity, contrary to the views of the green energy sector.
The June 2015 Bord Gáis Energy Index fell 3% due to weaker oil prices. Oil prices slumped toward the end of June as economic crisis in Greece weakened the dollar. The oil glut remains with supply exceeding demand by almost 3 million barrels per day. Natural gas prices were marginally weaker. Coal prices recovered slightly but electricity prices fell 9% due to lower demand in summer and a softening in power prices.
AI Transformation Playbook: Thinking AI-First for Your BusinessArijit Dutta
I dive into how businesses can stay competitive by integrating AI into their core processes. From identifying the right approach to building collaborative teams and recognizing common pitfalls, this guide has got you covered. AI transformation is a journey, and this playbook is here to help you navigate it successfully.
The Steadfast and Reliable Bull: Taurus Zodiac Signmy Pandit
Explore the steadfast and reliable nature of the Taurus Zodiac Sign. Discover the personality traits, key dates, and horoscope insights that define the determined and practical Taurus, and learn how their grounded nature makes them the anchor of the zodiac.
High-Quality IPTV Monthly Subscription for $15advik4387
Experience high-quality entertainment with our IPTV monthly subscription for just $15. Access a vast array of live TV channels, movies, and on-demand shows with crystal-clear streaming. Our reliable service ensures smooth, uninterrupted viewing at an unbeatable price. Perfect for those seeking premium content without breaking the bank. Start streaming today!
https://rb.gy/f409dk
❼❷⓿❺❻❷❽❷❼❽ Dpboss Matka Result Satta Matka Guessing Satta Fix jodi Kalyan Final ank Satta Matka Dpbos Final ank Satta Matta Matka 143 Kalyan Matka Guessing Final Matka Final ank Today Matka 420 Satta Batta Satta 143 Kalyan Chart Main Bazar Chart vip Matka Guessing Dpboss 143 Guessing Kalyan night
Cover Story - China's Investment Leader - Dr. Alyce SUmsthrill
In World Expo 2010 Shanghai – the most visited Expo in the World History
https://www.britannica.com/event/Expo-Shanghai-2010
China’s official organizer of the Expo, CCPIT (China Council for the Promotion of International Trade https://en.ccpit.org/) has chosen Dr. Alyce Su as the Cover Person with Cover Story, in the Expo’s official magazine distributed throughout the Expo, showcasing China’s New Generation of Leaders to the World.
Adani Group's Active Interest In Increasing Its Presence in the Cement Manufa...Adani case
Time and again, the business group has taken up new business ventures, each of which has allowed it to expand its horizons further and reach new heights. Even amidst the Adani CBI Investigation, the firm has always focused on improving its cement business.
The Most Inspiring Entrepreneurs to Follow in 2024.pdfthesiliconleaders
In a world where the potential of youth innovation remains vastly untouched, there emerges a guiding light in the form of Norm Goldstein, the Founder and CEO of EduNetwork Partners. His dedication to this cause has earned him recognition as a Congressional Leadership Award recipient.
Unlocking WhatsApp Marketing with HubSpot: Integrating Messaging into Your Ma...Niswey
50 million companies worldwide leverage WhatsApp as a key marketing channel. You may have considered adding it to your marketing mix, or probably already driving impressive conversions with WhatsApp.
But wait. What happens when you fully integrate your WhatsApp campaigns with HubSpot?
That's exactly what we explored in this session.
We take a look at everything that you need to know in order to deploy effective WhatsApp marketing strategies, and integrate it with your buyer journey in HubSpot. From technical requirements to innovative campaign strategies, to advanced campaign reporting - we discuss all that and more, to leverage WhatsApp for maximum impact. Check out more details about the event here https://events.hubspot.com/events/details/hubspot-new-delhi-presents-unlocking-whatsapp-marketing-with-hubspot-integrating-messaging-into-your-marketing-strategy/
Best Competitive Marble Pricing in Dubai - ☎ 9928909666Stone Art Hub
Stone Art Hub offers the best competitive Marble Pricing in Dubai, ensuring affordability without compromising quality. With a wide range of exquisite marble options to choose from, you can enhance your spaces with elegance and sophistication. For inquiries or orders, contact us at ☎ 9928909666. Experience luxury at unbeatable prices.
The Role of White Label Bookkeeping Services in Supporting the Growth and Sca...YourLegal Accounting
Effective financial management is important for expansion and scalability in the ever-changing US business environment. White Label Bookkeeping services is an innovative solution that is becoming more and more popular among businesses. These services provide a special method for managing financial duties effectively, freeing up companies to concentrate on their main operations and growth plans. We’ll look at how White Label Bookkeeping can help US firms expand and develop in this blog.
SATTA MATKA DPBOSS KALYAN MATKA RESULTS KALYAN CHART KALYAN MATKA MATKA RESULT KALYAN MATKA TIPS SATTA MATKA MATKA COM MATKA PANA JODI TODAY BATTA SATKA MATKA PATTI JODI NUMBER MATKA RESULTS MATKA CHART MATKA JODI SATTA COM INDIA SATTA MATKA MATKA TIPS MATKA WAPKA ALL MATKA RESULT LIVE ONLINE MATKA RESULT KALYAN MATKA RESULT DPBOSS MATKA 143 MAIN MATKA KALYAN MATKA RESULTS KALYAN CHART INDIA MATKA KALYAN SATTA MATKA 420 INDIAN MATKA SATTA KING MATKA FIX JODI FIX FIX FIX SATTA NAMBAR MATKA INDIA SATTA BATTA
Ellen Burstyn: From Detroit Dreamer to Hollywood Legend | CIO Women MagazineCIOWomenMagazine
In this article, we will dive into the extraordinary life of Ellen Burstyn, where the curtains rise on a story that's far more attractive than any script.
2. Record wind levels contribute to a fall in
the wholesale electricity price for December
as Bord Gáis Energy Index falls 1%
Bord Gáis Energy Index (Dec 31st 2009 = 100)
Bord Gáis Energy Index
180
Summary:
12 Month Rolling Average
The Bord Gáis Energy Index fell 1% in
December due to a month-on-month fall
in Irish wholesale electricity prices as a
result of higher wind volumes.
Points
140
100
60
Jan-09
1 Mth
May-09 Sep-09
-1%
Jan-10
3 Mth
May-10 Sep-10
2%
Jan-11
May-11 Sep-11
Jan-12
May-12 Sep-12
Jan-13
May-13 Sep-13 Dec-13
12 Mth -2%
Brent crude oil prices remained steady
in December, albeit at relatively high
levels. The outlook for 2014 is uncertain
as growing non-OPEC supplies compete
with geopolitical uncertainty to be the
key price driver. OPEC will once again
attempt to stabilise supplies and prices
as they have done for the last couple
of years. The monthly average UK Dayahead gas price continued to rise in
December but a continuation of mild
weather, strong Norwegian supplies and
a storage overhang could apply some
downward pressure in the months ahead.
In December 2013 the Index stood at 146.
As reported previously, despite a modest softening in the annual average price of Brent crude oil in 2013, prices remained at near record highs
throughout the year. From Cairo to Baghdad commentary on 2013 has been described as “uniformly bleak”. There is a growing view in the NAME
region that the Arab spring has “split (Arab) nations into clashing sects and tribes…and the central struggle for (the Arab world) now is the one
between Sunnis and Shias…and that we should admit that we Arabs no longer want to live together”. These tensions have been evident from Iraq
to Syria and beyond in 2013 and this has maintained oil prices at record highs in 2013. As concerns grow that Iraq is once again on the brink of
sectarian war it is reasonable to assume that there will be further oil supply concerns in the year ahead. Oil prices may also be supported by an
expanding global economy in 2014. Led by the US, growth prospects for the rich world are looking better and in this context the IMF is expected
to raise its forecast for global growth. US President Barack Obama has said 2014 will be a “breakthrough year” for the US economy which is the
world’s largest consumer of oil. However, as America’s economy gains strength it could aggressively adjust its bond-buying programme which
in turn could impact negatively on major emerging market economies that are the driving force behind global oil demand growth. In addition,
according to some analysts, ample oil supply, boosted by the US shale revolution, will exert pressure on crude oil prices in 2014.
Oil Index
180
Oil
Month-on-month the front month Brent crude price was
little changed as events in Libya continued to dominate
price behaviour in December and support prices.
In the short-term Libya remains one of the key OPEC
suppliers to watch in 2014. Protests and sit-ins at key
Libyan oil infrastructure (particularly in the east of
the country) have caused production to slump to
lows of around 200,000 barrels a day and have cut
exports to a trickle. Before the protests and strikes
100
began in earnest in May, Libya was producing close
to capacity, at around 1.4 million barrels a day. Rebels
demanding more autonomy for the Cyrenaica region
have ordered blockades of key Eastern ports with
60
a combined export capacity of 740,000 barrels a
Jan-09 May-09 Sep-09 Jan-10 May-10 Sep-10 Jan-11 May-11 Sep-11 Jan-12 May-12 Sep-12 Jan-13 May-13 Sep-13 Dec-13
day. In the west of the country it has been reported
that some exports have been made out of the port
*Index adjusted for currency movements.
3 Mth 1%
12 Mth -4%
1 Mth 0%
Data Source: ICE
of Mellitah during December. Brent crude oil prices
softened in early January from US$111 to US$108
following news that the major Sharara field in the west of Libya restarted. The recovery of Libya’s oil production seems to be taking place in the
west and production in 2014 is expected to average about 650,000 barrels a day. However, eastern production could remain ‘shut-in’.
Points
140
Global oil supply concerns were not limited to Libya during the month as violence and militant conflicts on the back of ethnic divides have reemerged in South Sudan and have pushed the country close to civil war. It has been reported that rebels have taken control of oil production in
the Unity state but the majority of South Sudan’s production in the Upper Nile state remains under government control. According to Goldman
Sachs, a full-blown civil war involving Sudan would put at risk 360,000 barrels of oil. Violence has again erupted in Iraq following the taking of
two key cities in Iraq’s Anbar province by Al-Qaeda-linked fighters and Sunni tribes. Sunni Arabs have long complained of discrimination by the
Shia-led government. The concern is that the loss of two cities would embolden militants and disgruntled Sunni communities and threaten the
unity of Iraq. News from the US is somewhat counter-balancing these supply concerns as it emerged that US oil production reached its highest
level in 25 years in November, hitting an average of 8 million barrels a day. The EIA expects oil production to reach 8.5 million barrels a day this
year as output from the Bakken, Eagle Ford and Permian grows. According to one analyst “forget the Fed and the politicians in Washington..the
real hero of the US economy in 2013 was the US energy industry that single handily helped inspire an economic comeback”. Cheap energy, years
of wage restraints and a relatively weak Dollar has made the US competitive again. In December the US Federal Reserve took the first step toward
the exit from its stimulus programme as it reduced the monthly pace of asset purchases to US$75 billion. This could temper oil prices if geopolitical
tensions were to ease. However, this could be offset by better-than-expected global economic growth powered by the US in 2014. If this growth
materialises it will support prices as oil demand and equity prices are stimulated.
3. Natural Gas
Natural Gas Index
300
In euro terms, the average Day-ahead gas price for
November was 2% higher month-on-month with a short
period of colder weather in early December driving up
demand and the average monthly price.
250
Points
200
150
100
50
Jan-09
1 Mth
May-09 Sep-09
2%
Jan-10
May-10 Sep-10
3 Mth
6%
Jan-11
May-11 Sep-11
12 Mth
Jan-12
3%
May-12 Sep-12
Jan-13
May-13 Sep-13 Dec-13
*Index adjusted for currency movements.
Data Source: Spectron Group
The average Day-ahead gas price for December was
69.26p a therm. As discussed last month, for relatively
normal conditions (there were no significant issues with
supply and temperatures over the month of December
were not extreme) an average of close to 70p a therm
is high. Indeed, the December 2013 price was the third
highest average monthly price recorded by the Bord
Gáis Energy Index. Last month we questioned whether
the recent upward trend is a temporary phenomenon
or whether 70p a therm is the new normal. From the
evidence of December it suggests that a Day-ahead price
close to 70p a therm can be expected in the short-term.
A bonus of elevated wholesale prices in November and December has been strong Norwegian flows to the UK at the expense of neighbouring
hubs. Norway has provided much of the UK’s flexibility so far this winter. Strong Norwegian supplies and very mild and windy weather in recent
weeks has meant that UK storage levels are now healthy heading into the final three months of winter 13/14. Robust supplies, a storage overhang
and continued mild weather could combine to put significant downward pressure on prices in the weeks and months ahead if demand were to
remain below seasonal norms. This combination would seriously challenge what could turn out to be the fragile new norm of 70p a therm. LNG
supplies to the UK remain anaemic but given that the system is adequately balanced, this has not been an issue so far this winter. On this front,
milder weather in Japan and the return of South Korean nuclear capacity could result in an increase in the number of cargoes arriving into the UK.
UK Gas prices for summer 14, next winter and beyond also rose in December as movements in the prompt prices pushed prices higher. Looking
ahead, if storage is not fully utilised this winter or if those levels are relatively strong or are forecast to be relatively strong at the end of March,
the summer 14 price could weaken.
Coal
Coal Index
260
In euro terms the ICE Rotterdam Monthly Coal Futures
contract was 4% lower month-on-month.
European prices were steady around $85/mt for most
of December due to fears that exports from US-based
Drummond’s Colombian operations would be stalled
as the producer was not able to complete its terminal’s
150
conversion to direct loading by a stipulated January
1 deadline. Drummond is Colombia’s second largest
thermal coal producer. During the month it was not
95
certain whether the Colombian government would
grant an extension and European prices were supported
on fear of a disruption to supplies. Reports of tighter
40
Russian coal supply also supported prices due to a
Jan-09 May-09 Sep-09 Jan-10 May-10 Sep-10 Jan-11 May-11 Sep-11 Jan-12 May-12 Sep-12 Jan-13 May-13 Sep-13 Dec-13
combination of the winter season possibly hindering
loadings at ports, Russians covering domestic power
*Index adjusted for currency movements.
Data Source: ICE
3 Mth -3%
12 Mth -13%
1 Mth -4%
production and a diversion of coal exports away from
the European market to focus on the Pacific.
Toward the end of the month it became clear that the Colombian environmental ministry would allow the producer to continue exporting coal by
loading ships temporarily using barges and prices softened and closed at $81.55/mt. European prices have been “plagued” by supply issues from
Colombia throughout 2013 due to a couple of prolonged mine workers’ strikes at the country’s two largest thermal coal producers. Drummond
also faced a temporary ban on its Colombian exports in February after it dumped coal into the Caribbean Sea to stop a coal barge from sinking
in high swells in January 2013.
Points
205
Electricity
Electricity Index
180
In December the monthly average Irish wholesale
electricity price fell by 5% month-on-month despite a
2% increase in the wholesale cost of Day-ahead gas. The
reason for the fall was attributed to lower ‘clean sparks’
in December (the ‘clean spark’ is the theoretical gross
margin of a gas-fired power plant from selling a unit of
electricity, having bought the fuel required to produce
this unit of electricity and the cost of abating the carbon
emitted). Month-on-month the average ‘clean spark’ fell
dramatically by 50%.
Points
140
100
60
Jan-09
May-09 Sep-09
1 Mth -5%
Jan-10
May-10 Sep-10
3 Mth
3%
Jan-11
May-11 Sep-11
12 Mth
Jan-12
-1%
May-12 Sep-12
Jan-13
May-13 Sep-13 Dec-13
Data Source: SEMO
The December monthly average ‘clean spark’ fell with
a decrease in the number of thermal plant starts and
a reduction in demand due to milder weather and the
Christmas period. A decrease in the number of thermal
plant starts applied downward pressure on wholesale
prices as fewer starts of large power plants fed through
to lower overall wholesale costs. Another related and significant factor were higher and sustained wind volumes which forced expensive gas
powered plants off the system and this provided additional downward pressure on wholesale prices. In December wind produced electricity met
24% of demand which was the highest monthly figure on record.
4. FX Rates
1.6
1.4
1.2
FX Rates
Month-on-month the euro held steady against both
the US Dollar and the British Pound. Global exchange
rates in 2014 are likely to be heavily influenced by
pressures to raise interest rates if global economic
growth materialises as forecast.
During December there were further signs that the US
economy is recovering strongly. Data showed that the
economy had expanded at an annualised rate of 3.6%
1.0
in the third quarter of 2013, to overtake the UK as the
fastest growing advanced economy. The manufacturing
0.8
sector grew at its fastest pace in more than two years in
November and the service sector also expanded monthon-month. Major automakers reported their best US sales
0.6
Jan-09 May-09 Sep-09 Jan-10 May-10 Sep-10 Jan-11 May-11 Sep-11 Jan-12 May-12 Sep-12 Jan-13 May-13 Sep-13 Dec-13 month in six and a half years (due in part to aggressive
discounting). The US created 203,000 new jobs in
November and the unemployment rate has fallen from
3 Mth 2%
12 Mth 4%
1 Mth 1%
EURUSD
7.3% to 7%, the lowest since December 2008 just after
the collapse of Lehman’s. Retail sales expanded by an
3 Mth -1%
12 Mth 2% EURGBP
1 Mth 0%
impressive 4.7% month-on-month in November and sales
of new single-family houses recorded significant gains in
October. Industrial production also grew in November at the fastest pace in a year. The achieved two-year agreement on a budget deal in December
will also cut the fiscal squeeze to 0.5% of GDP this year (it was 1.75% in 2013) . Based on these and previous economic numbers, the US Federal Reserve
has decided to reduce its monthly bond buying programme by US$10 billion to $75 billion in January 2014. Looking ahead, US household and corporate
balance-sheets are in good shape and America is competitive (due in part to cheap energy and the shale boom) and these factors will support
continued growth in 2014. As American businesses and consumers spend, demand for goods and services from Europe and Asia will be supported.
The UK also saw a number of positive economic releases with the Office for Budget Responsibility increasing its 2014 growth forecast from 1.8% to
2.4%. According to the PMI surveys of the manufacturing, construction and services sectors, the UK economy remains on track for a strong final
quarter of 2013. The Bank of England has described the housing market as moving from “stall speed to warp speed” and manufacturing output rose
2.6% in October, the fastest in two and a half years. However, with the deficit remaining stable and exports drifting lower, there are concerns that the
recovery is consumer driven.
As the Fed and the Bank of England grapple with expectations of higher interest rates, the ECB is concerned about deflation but stressed that it is
ready to act to preserve price stability and stimulate growth.
Market Outlook
For OPEC producing countries, $110 a barrel has been described as ‘the right price’ and prices should stay around this level for the first six months of
2014 if there are no fresh restrictions or threats to global oil supplies in the months ahead. However, the potential return of Iranian and Libyan supplies
and advances in non-OPEC supplies due to the ongoing shale boom in the US, could result in an oversupply in the oil market which could apply some
downward pressure in the second half of 2014. However, OPEC has indicated that $100 a barrel is their ‘base price’ so consumers are unlikely to see a
significant drop in the US Dollar price of oil in 2014. If oil prices do trade in a stable range of between $100 - $110 a barrel, a key factor for euro-zone
buyers of oil will be the performance of the euro versus the US Dollar.
As global oil supplies could receive a substantial boost in 2014, OPEC has stated that they will continue to monitor the oil market very closely and that
they will protect oil prices in 2014. OPEC has committed to provide the world with enough oil to satisfy its needs but only at a reasonable price. We
can expect OPEC producing countries to produce 30million b/d in the first half of 2014 but if price stability is threatened, it is reasonable to expect
a co-ordinated reduction in supplies. In 2014 we could see the first co-ordinated actions, albeit limited, by OPEC to tackle the potential threat posed
by North American shale oil. According to Exxon Mobil, the world’s biggest energy company by market share, oil production from North American
shale fields will outpace every member of OPEC except Saudi Arabia within two years. Exxon Mobile forecast that increasing US supply will soon
overwhelm the capacity of domestic refineries and this will prompt the federal government to rethink its restrictions on crude exports. Shale, deepwater and oil-sands output together will be more than enough to replace declining supplies from older, onshore fields that were drilled decades ago.
Oil demand in 2014 is expected to grow by 1 million b/d with the growth being attributed to rising demand in Asia. According to OPEC, the biggest
challenge facing global oil markets in 2014 is global economic uncertainty, with the fragility of the euro-zone remaining a cause of concern. Without
GDP growth, oil demand in 2014 could suffer. Despite these concerns, OPEC expects global economic growth to increase to 3.5% from 2.9% in 2013
and that oil demand growth will mirror the economic improvement.
Re-weighting of Bord Gáis Energy index
Following the SEAI’s 2011 review of energy consumption in Ireland, there was a 6.4% drop in
overall energy consumption. Oil continues to be the dominant energy source with most of
the oil used in transport and the remainder being used for thermal energy. For the purposes
of the Bord Gáis Energy Index, the total final energy consumption in Ireland fell 1,089 ktoe
(toe: a tonne of oil equivalent is a unit of energy, roughly equivalent to the energy content
of one tonne of crude oil) between 2009 and 2011. This fall was made up of a 1,022 ktoe
drop in oil consumption (down 13.5%), a 20 ktoe drop in natural gas (down 12.6%), a 7 ktoe
drop in electricity (down 0.3%) and a 40 ktoe drop in coal (down 10.98%). The Bord Gáis
Energy Index has been re-weighted in January 2013 to reflect the latest consumption data.
The impact has been minimal and has resulted in slight reductions in the share of oil and gas
and a slight increase in the weighting of electricity in the overall Index.
Oil 61.96%
Gas
14.72%
Electricity
20.22%
Coal
3.1%
For more information please contact:
Fleishman-Hillard — James Dunny — 086 388 3903
Bord Gáis Energy — Aoife Donohoe — 087 773 3344
The contents of this report are provided solely as an information guide. The report is presented to you “as is” and may or may not be correct, current, accurate or
complete. While every effort is made in preparing material for publication no responsibility is accepted by or on behalf of Bord Gáis Eireann, the SEMO, ICE Futures
Europe, the Sustainable Energy Authority of Ireland or Spectron Group Limited (together, the “Parties”) for any errors, omissions or misleading statements within this
report. No representation or warranty, express or implied, is made or liability accepted by any of the Parties or any of their respective directors, employees or agents
in relation to the accuracy or completeness of the information contained in this report. Each of the Parties and their respective directors, employees or agents does
not and will not accept any liability in relation to the information contained in this report. Bord Gáis Eireann reserves the right at any time to revise, amend, alter or
delete the information provided in this report.