Download to read offline
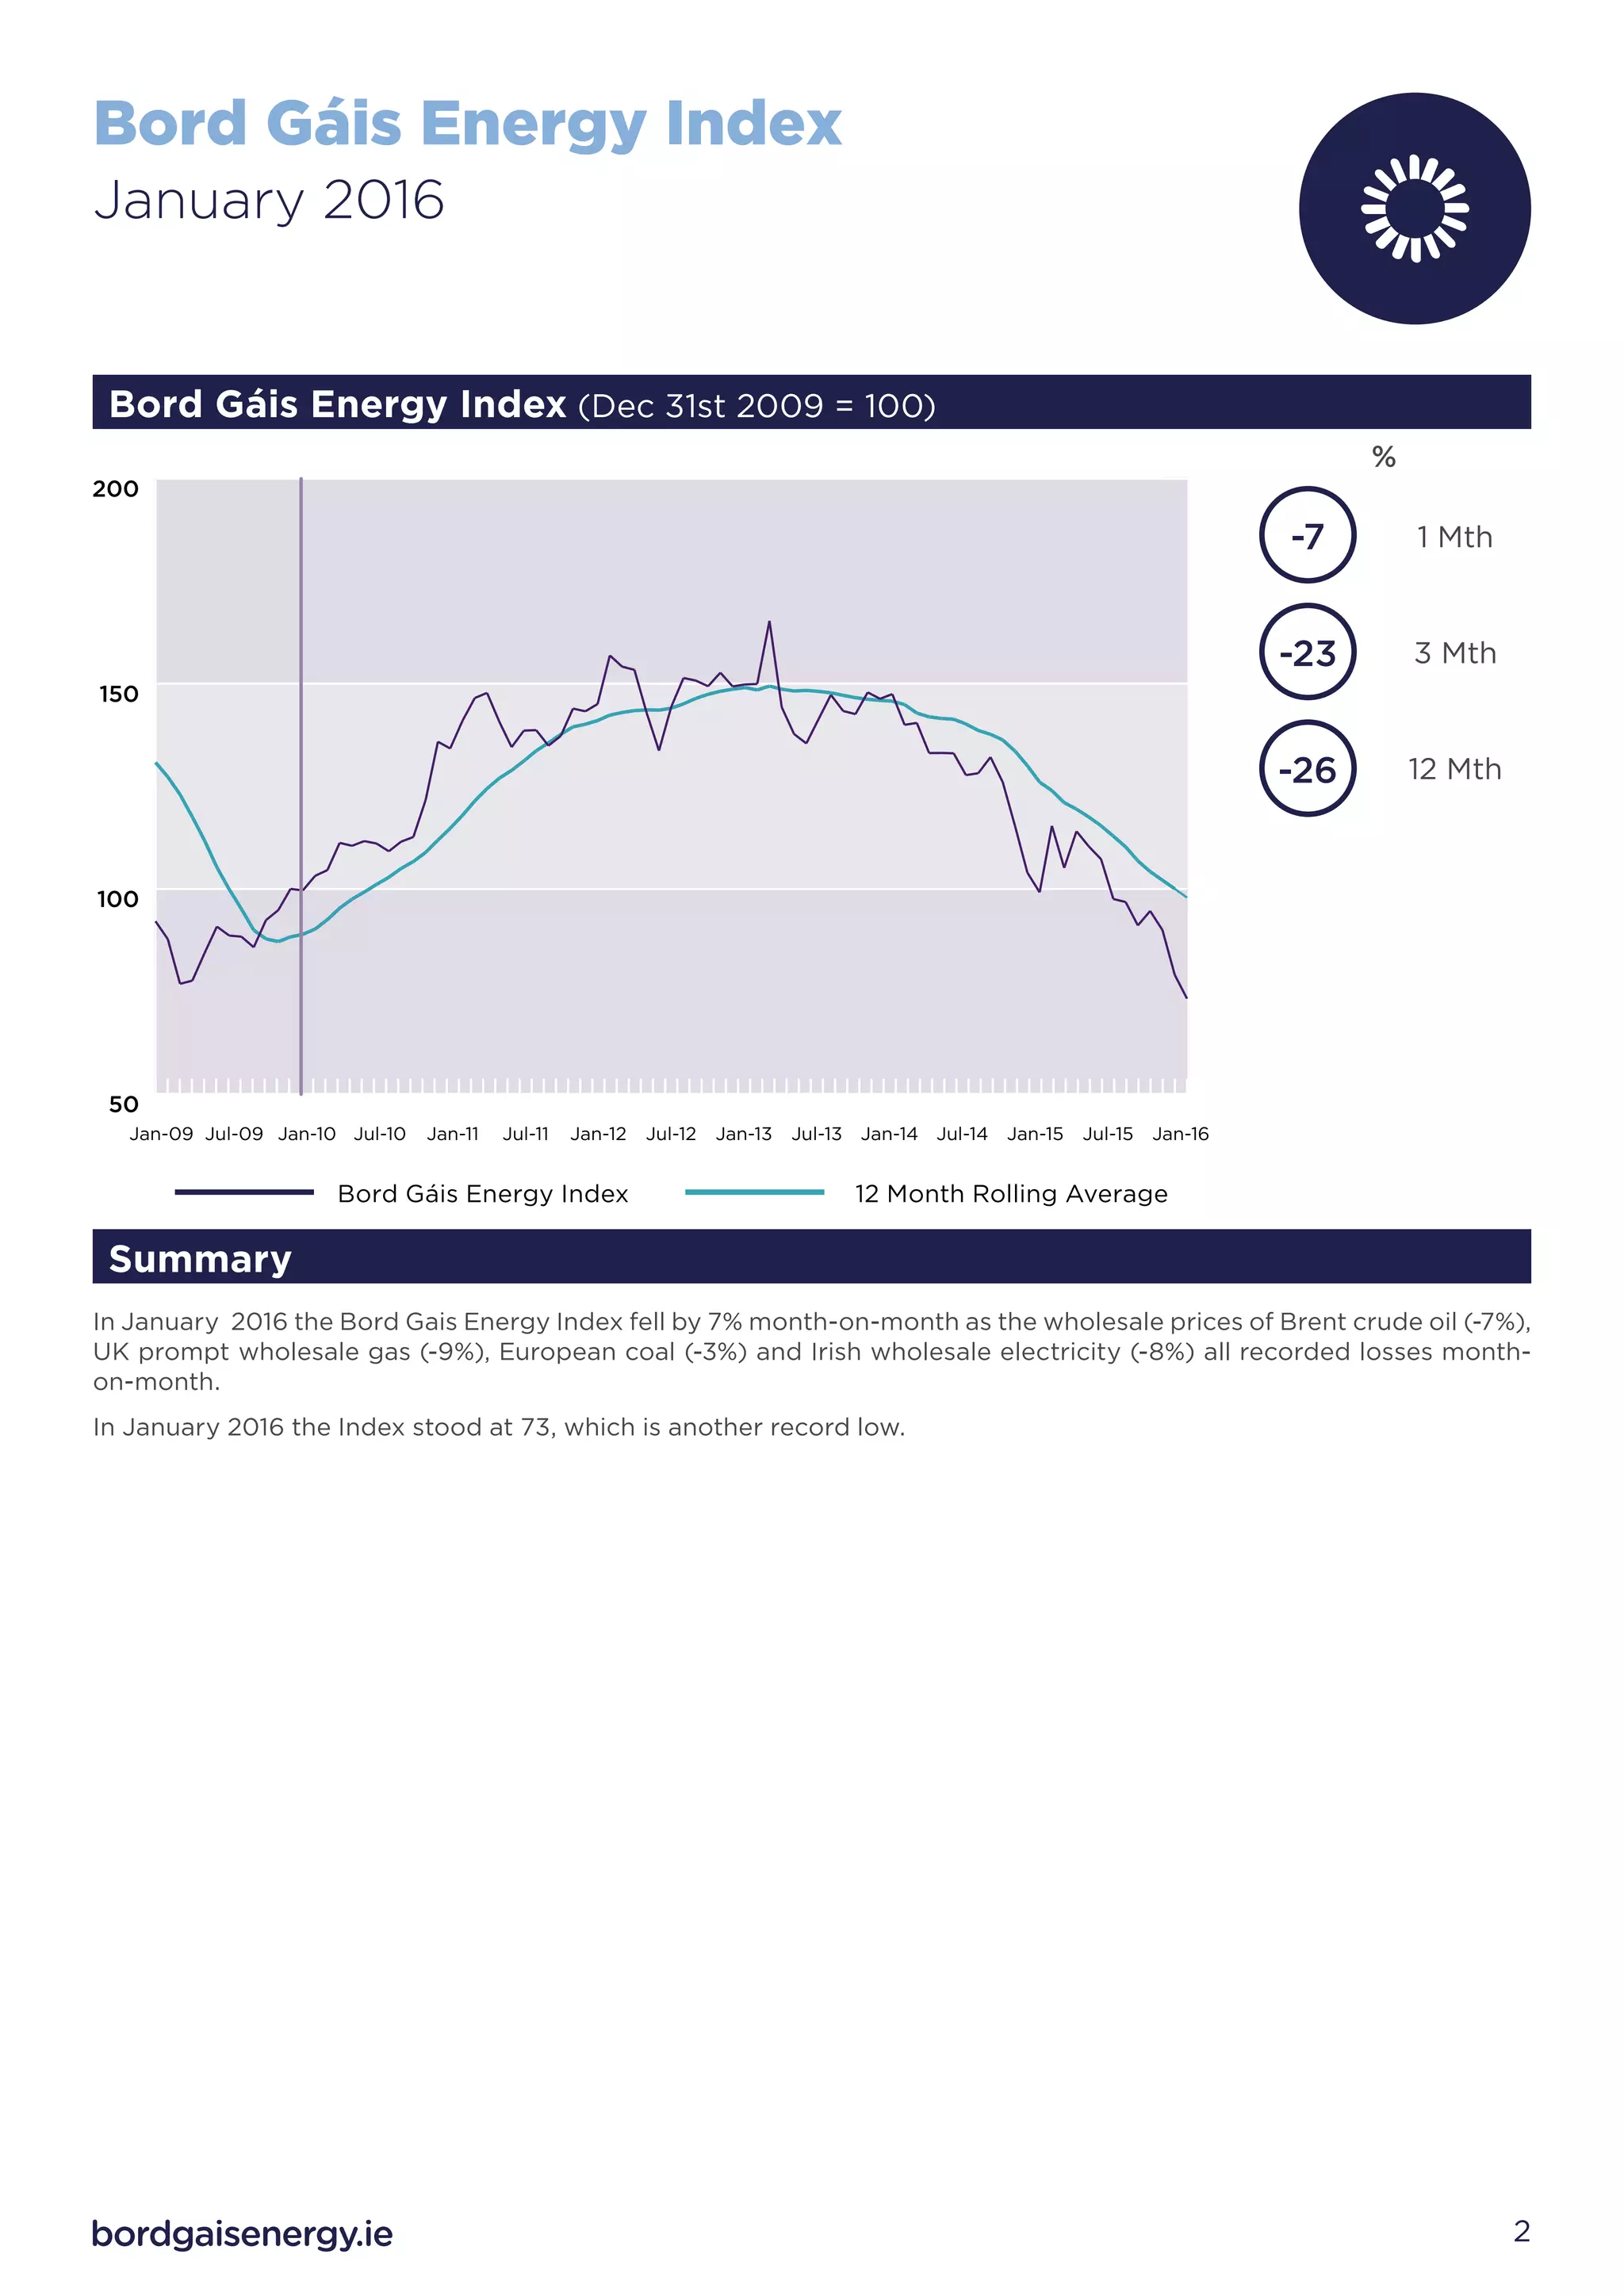
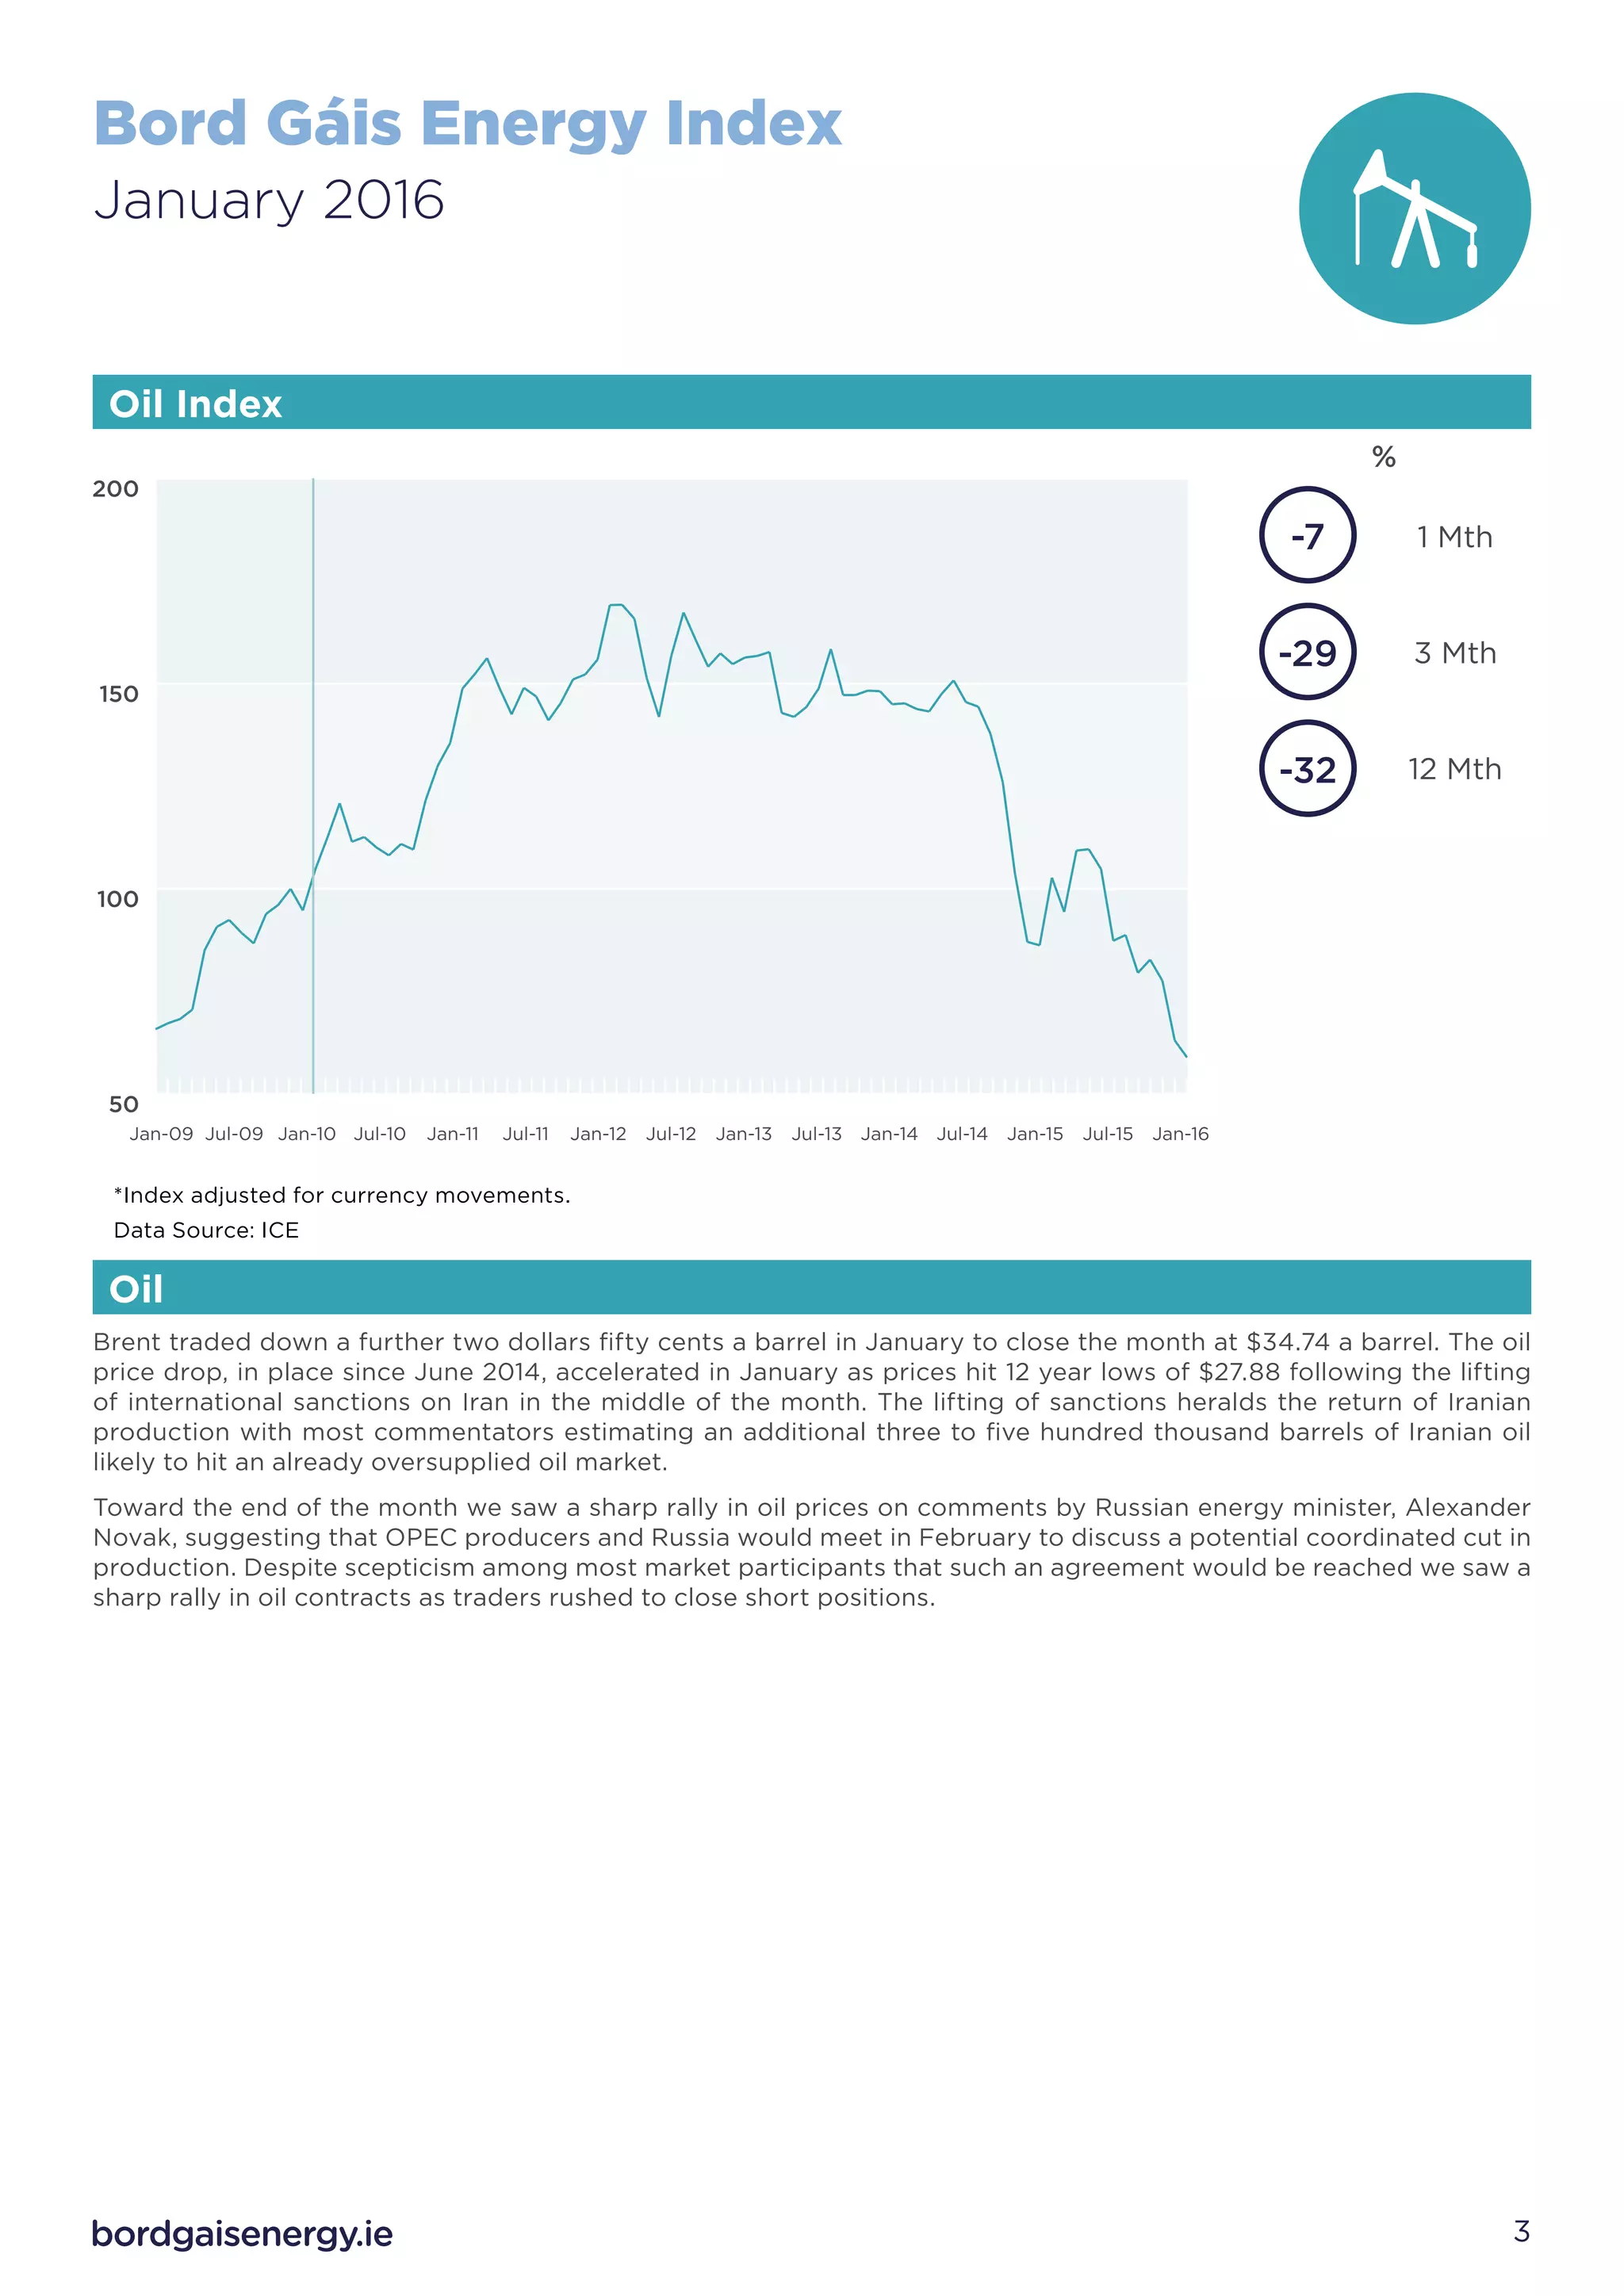
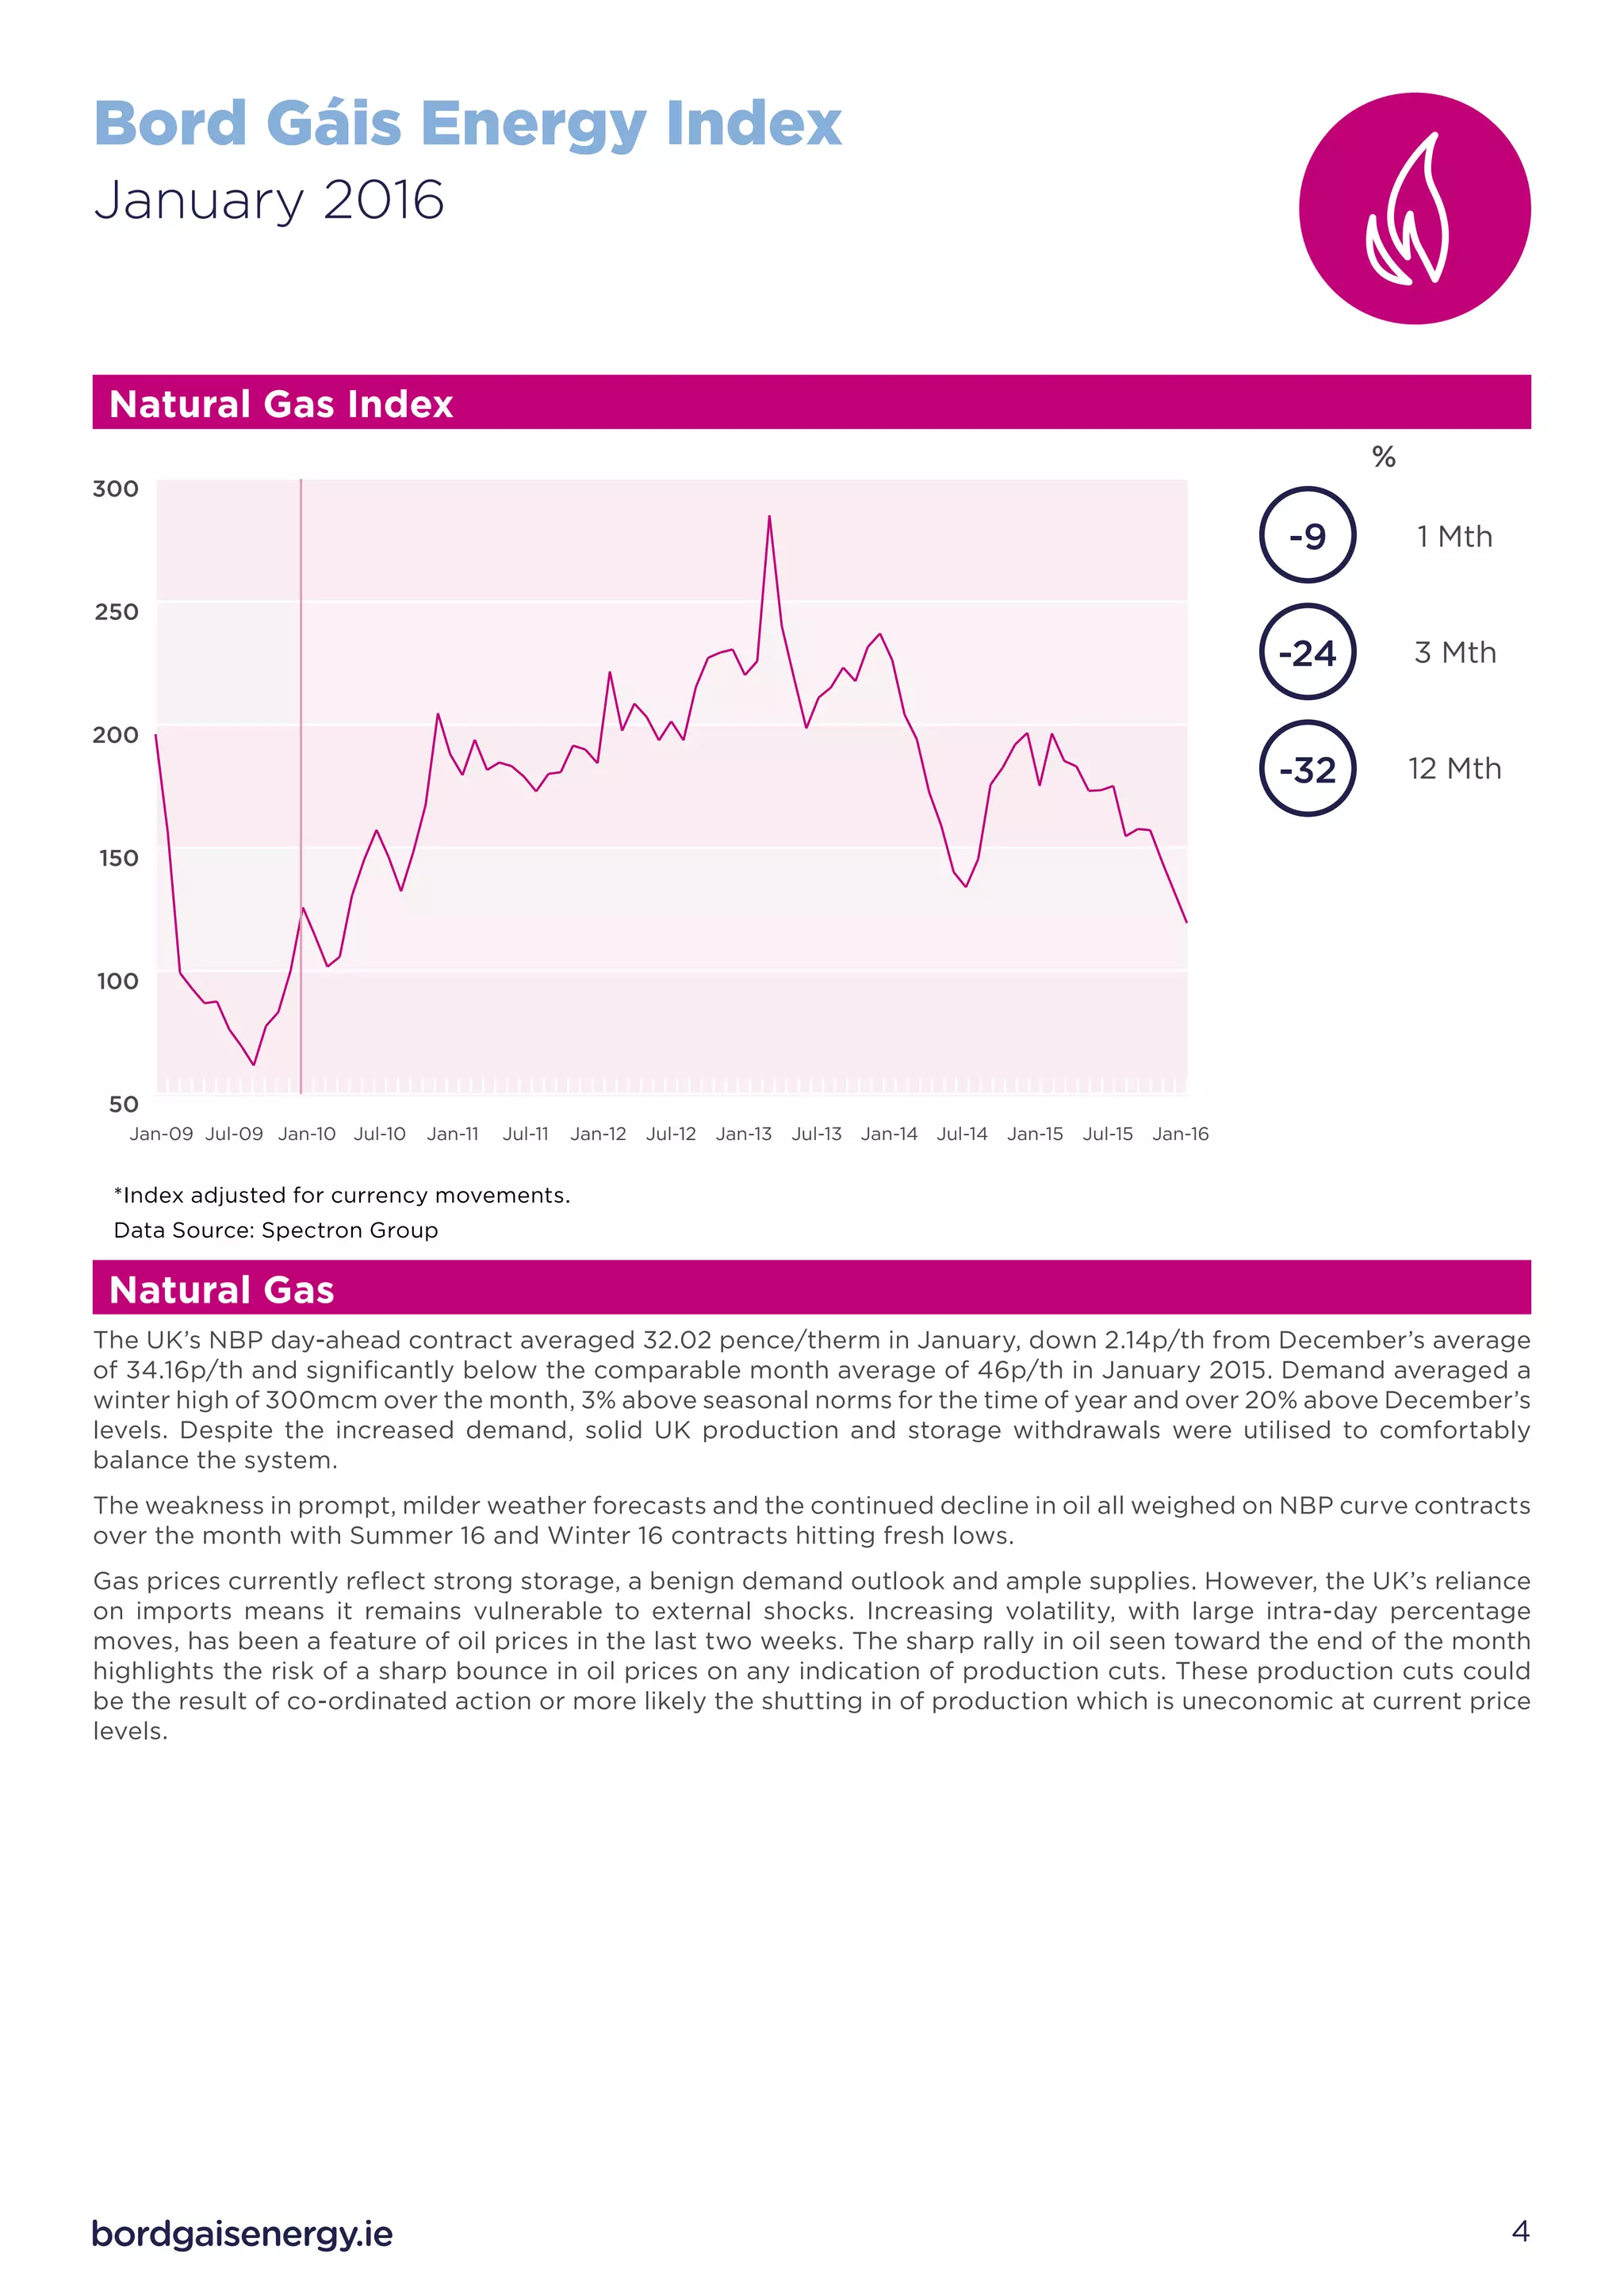
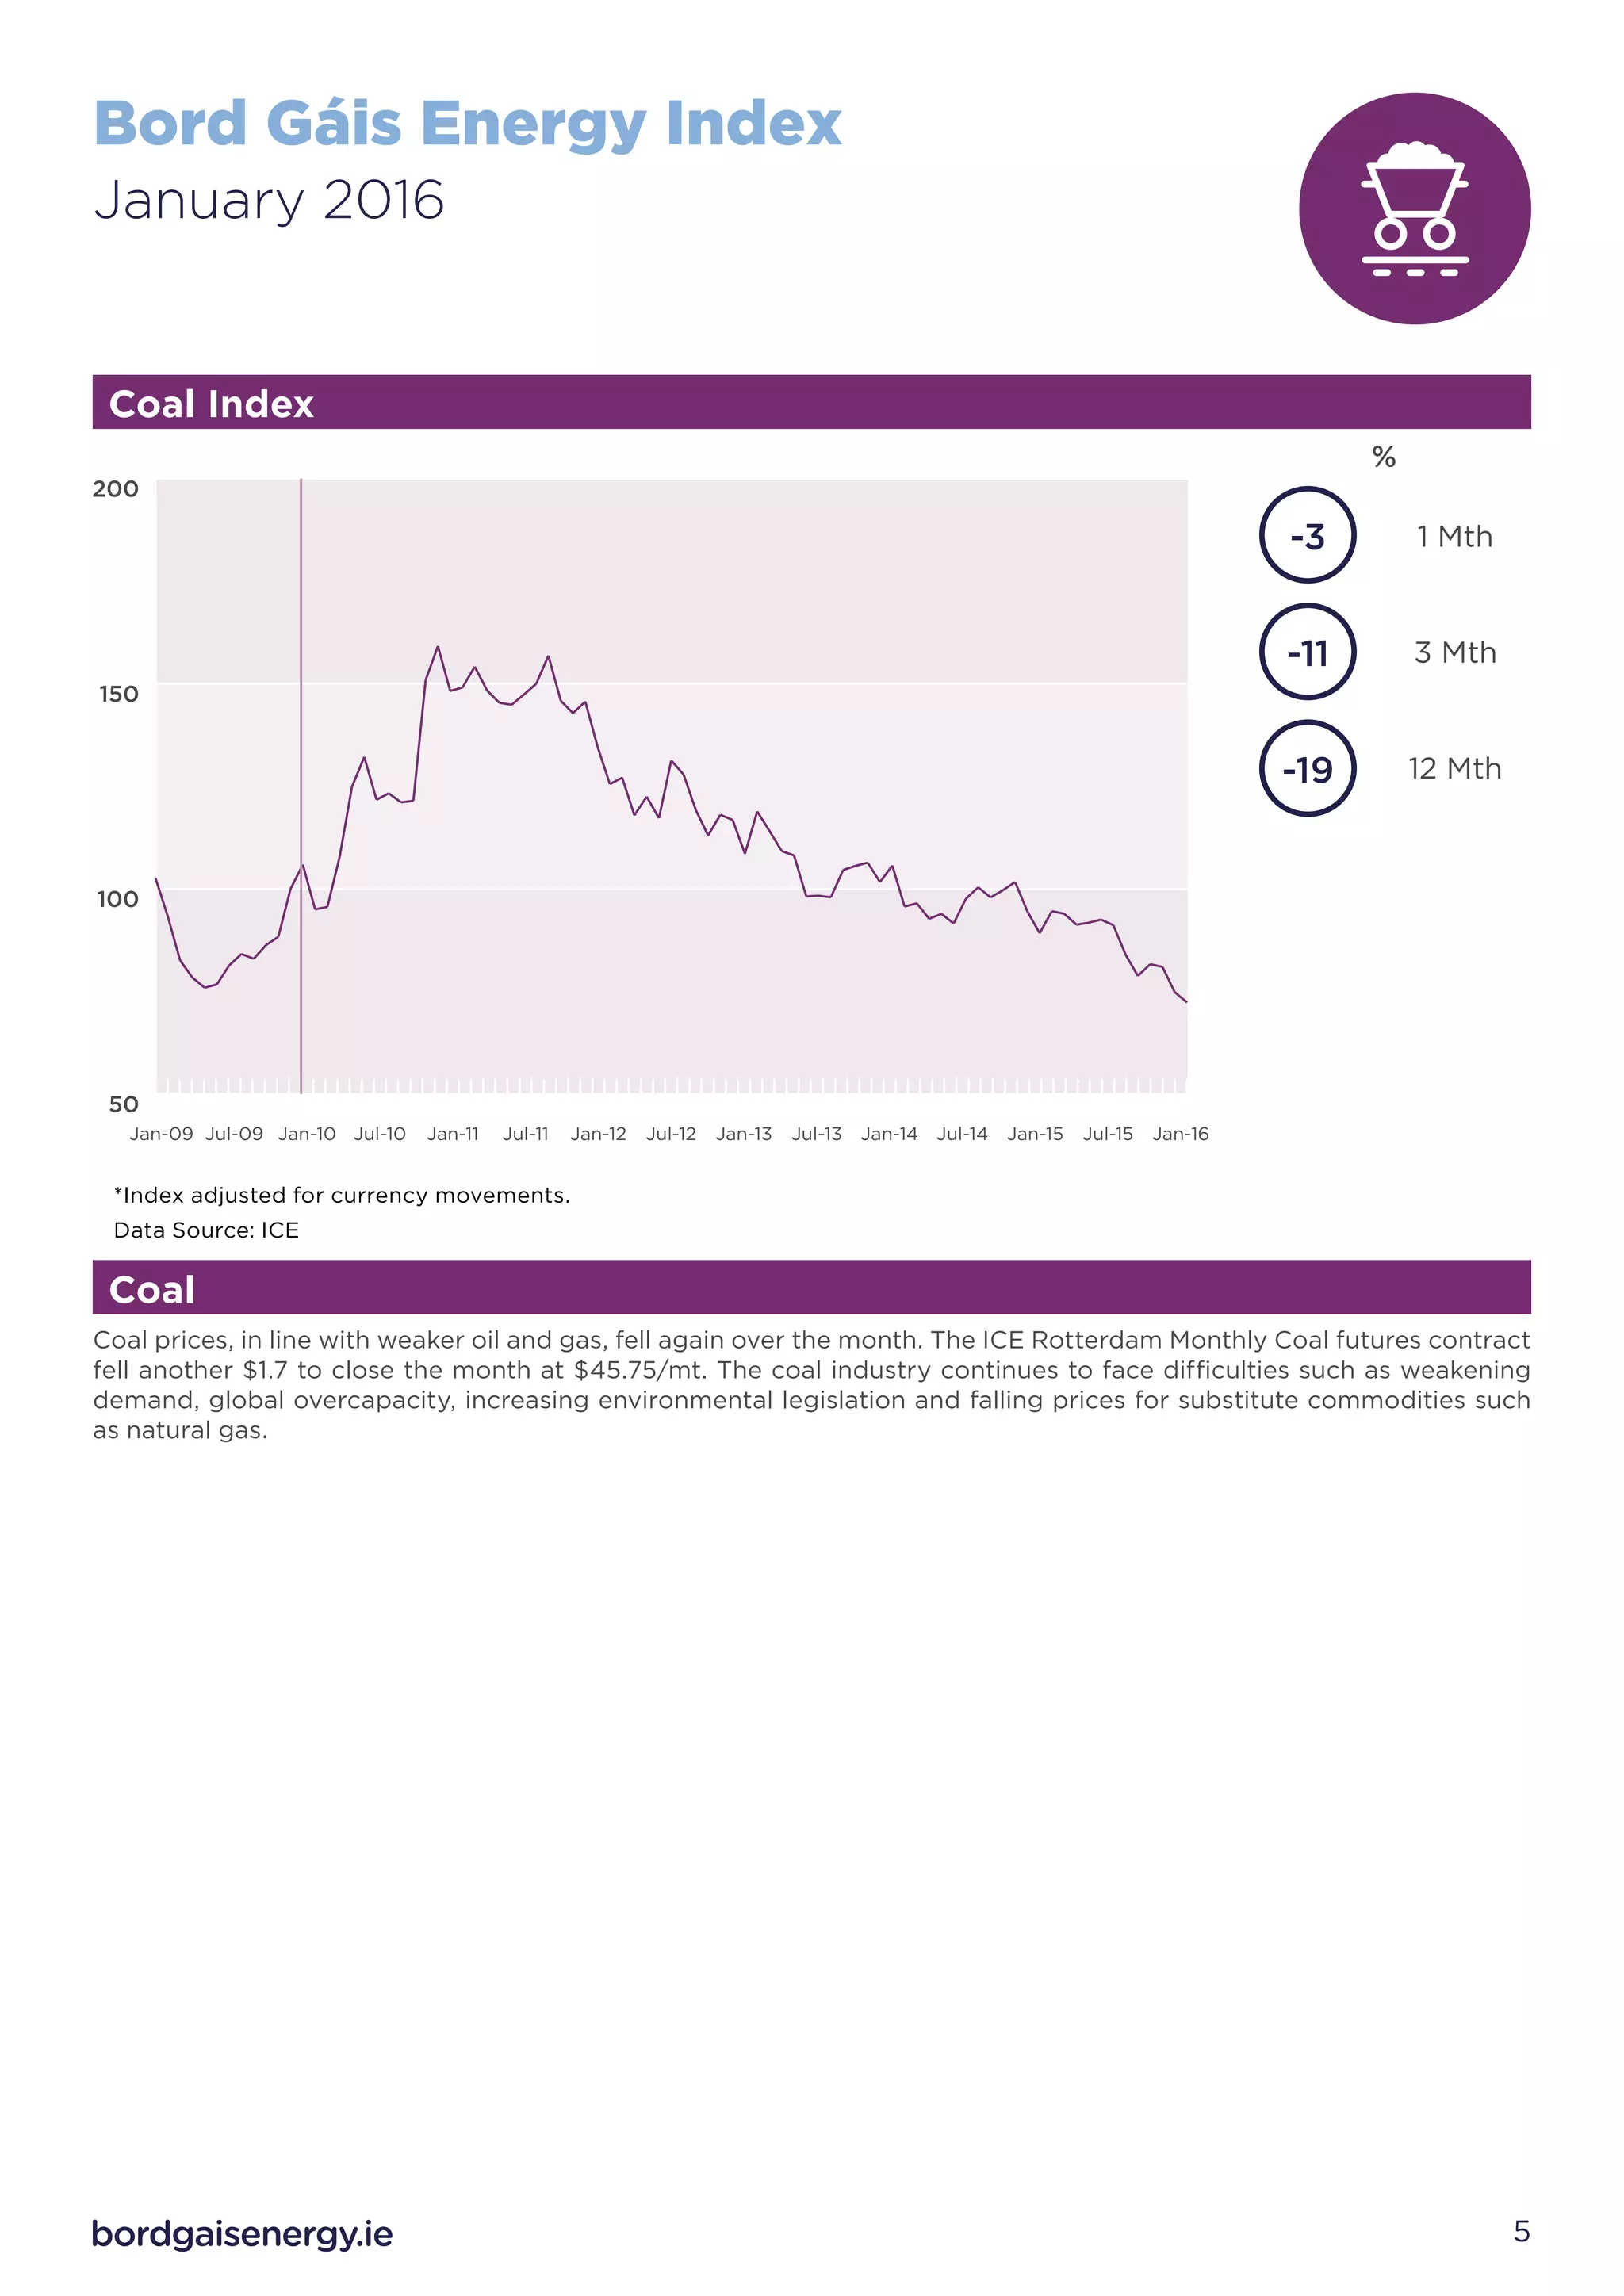
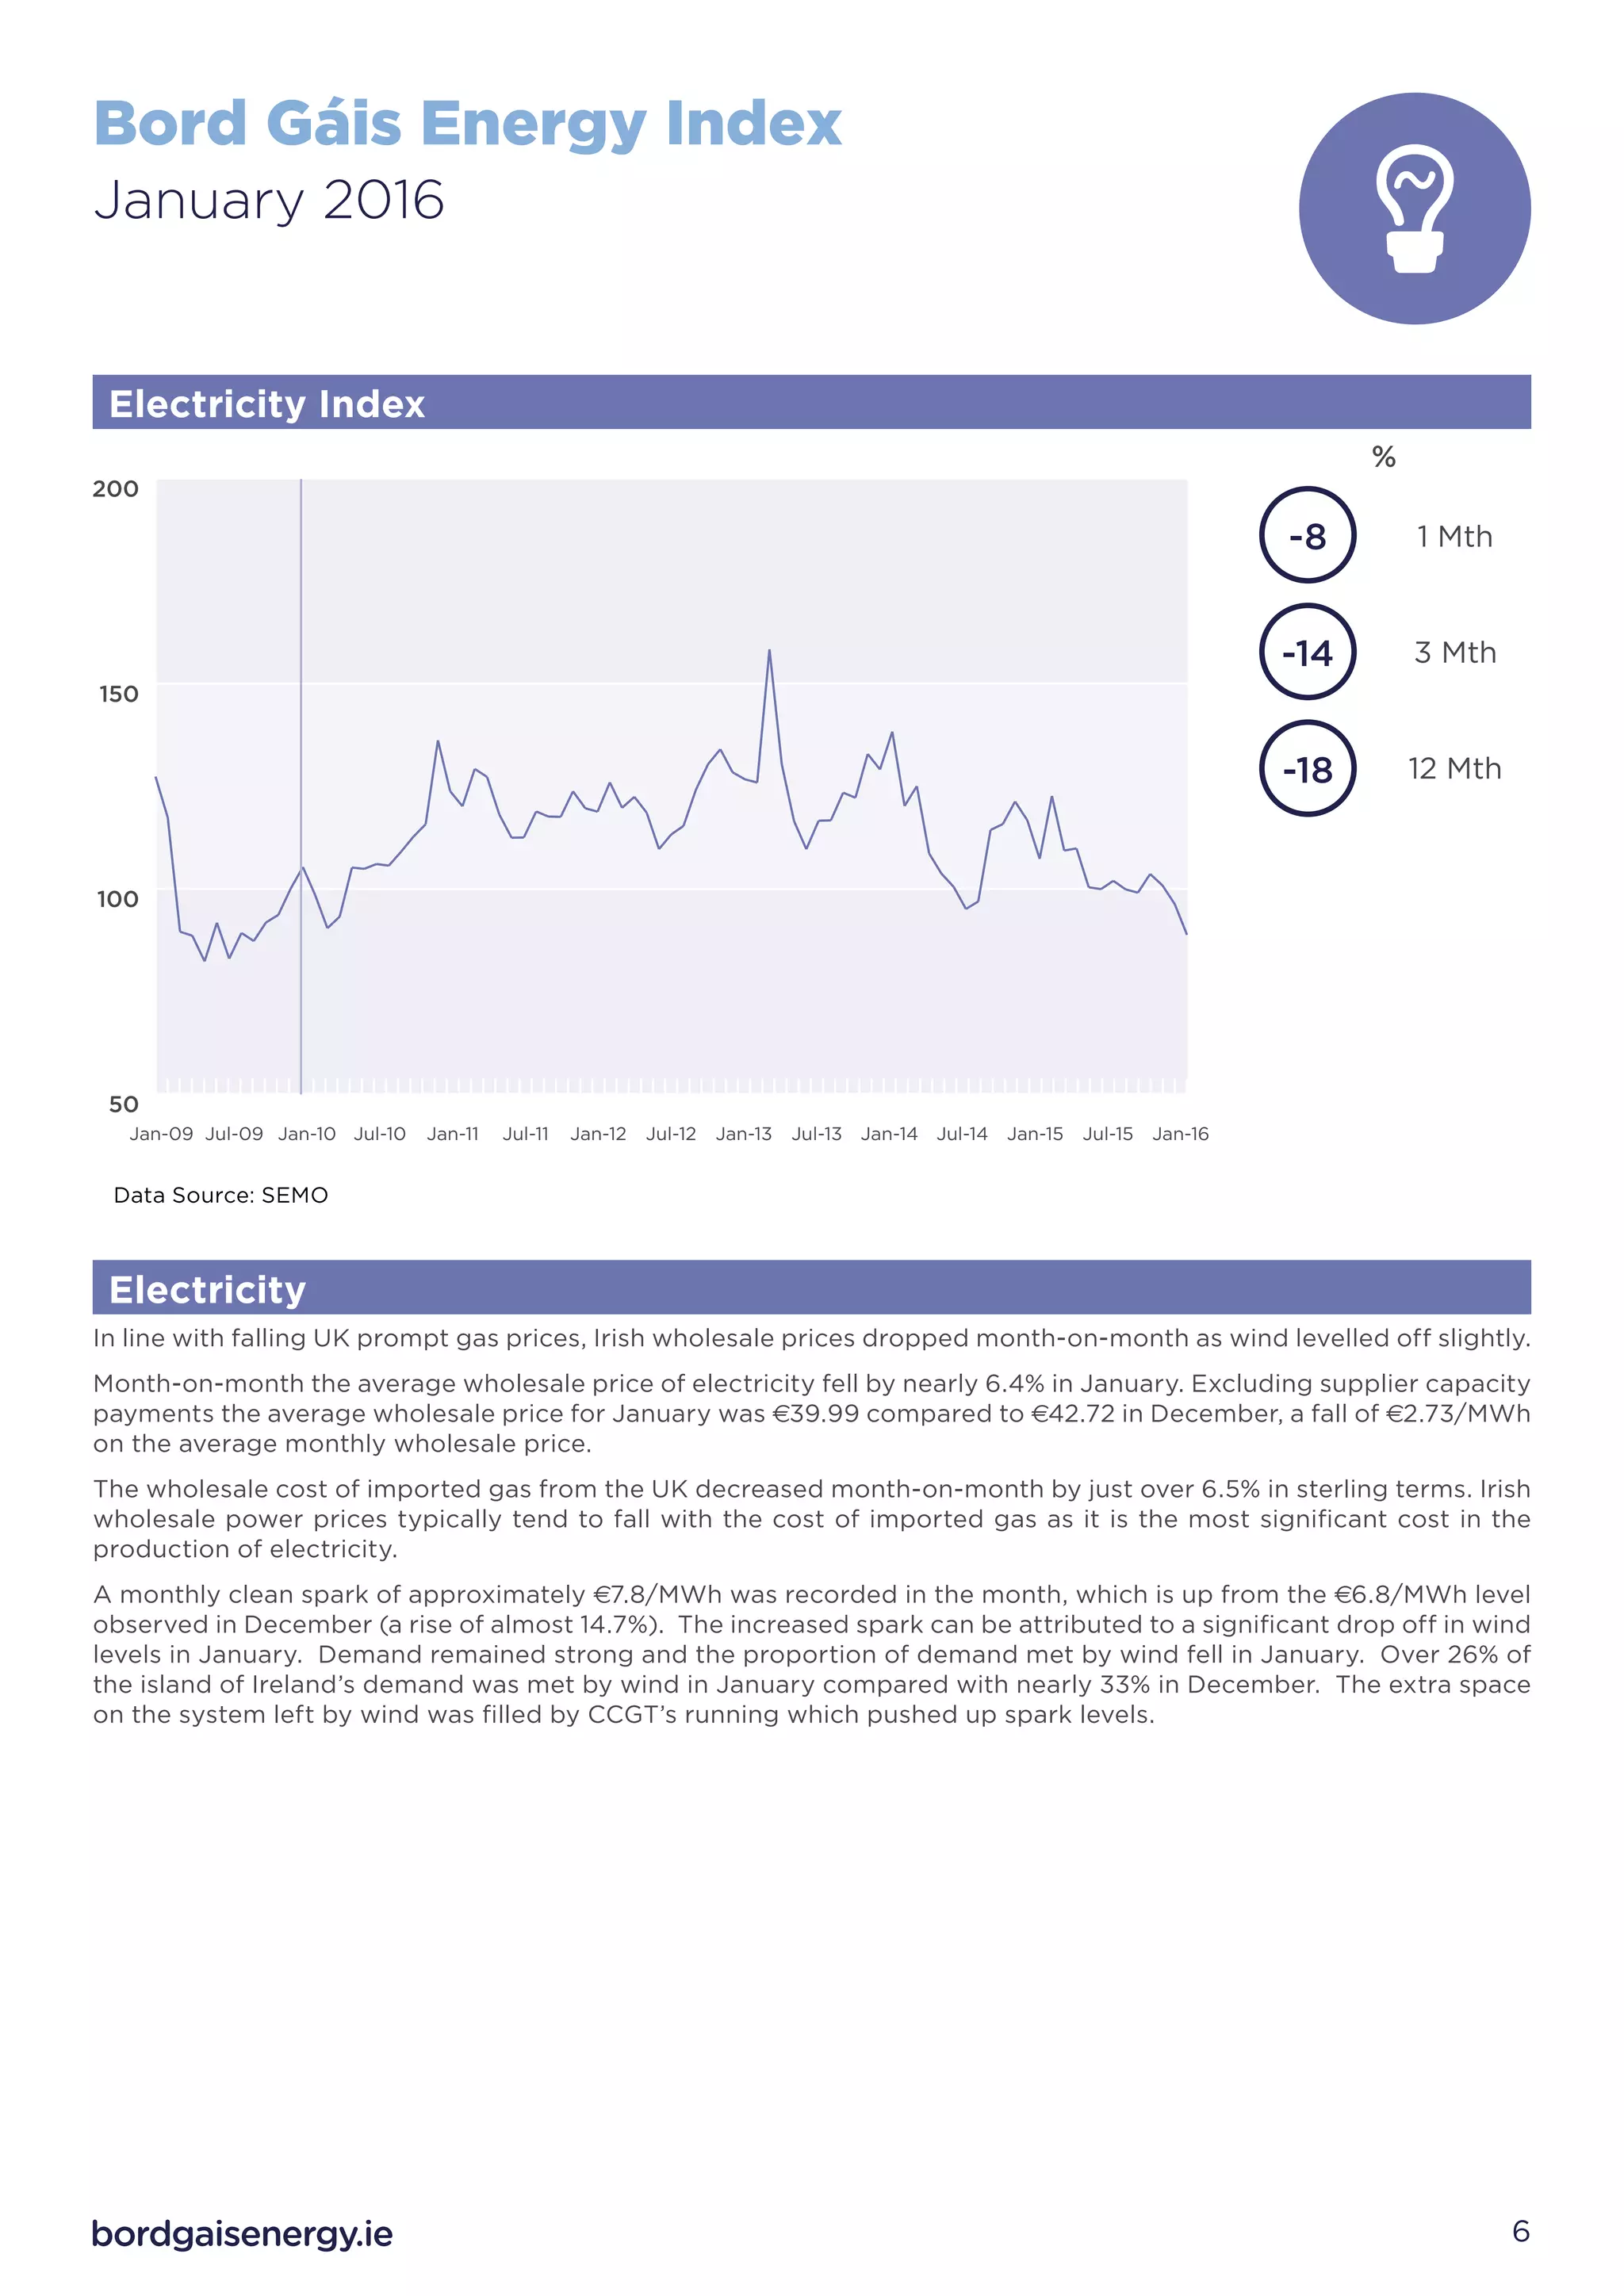
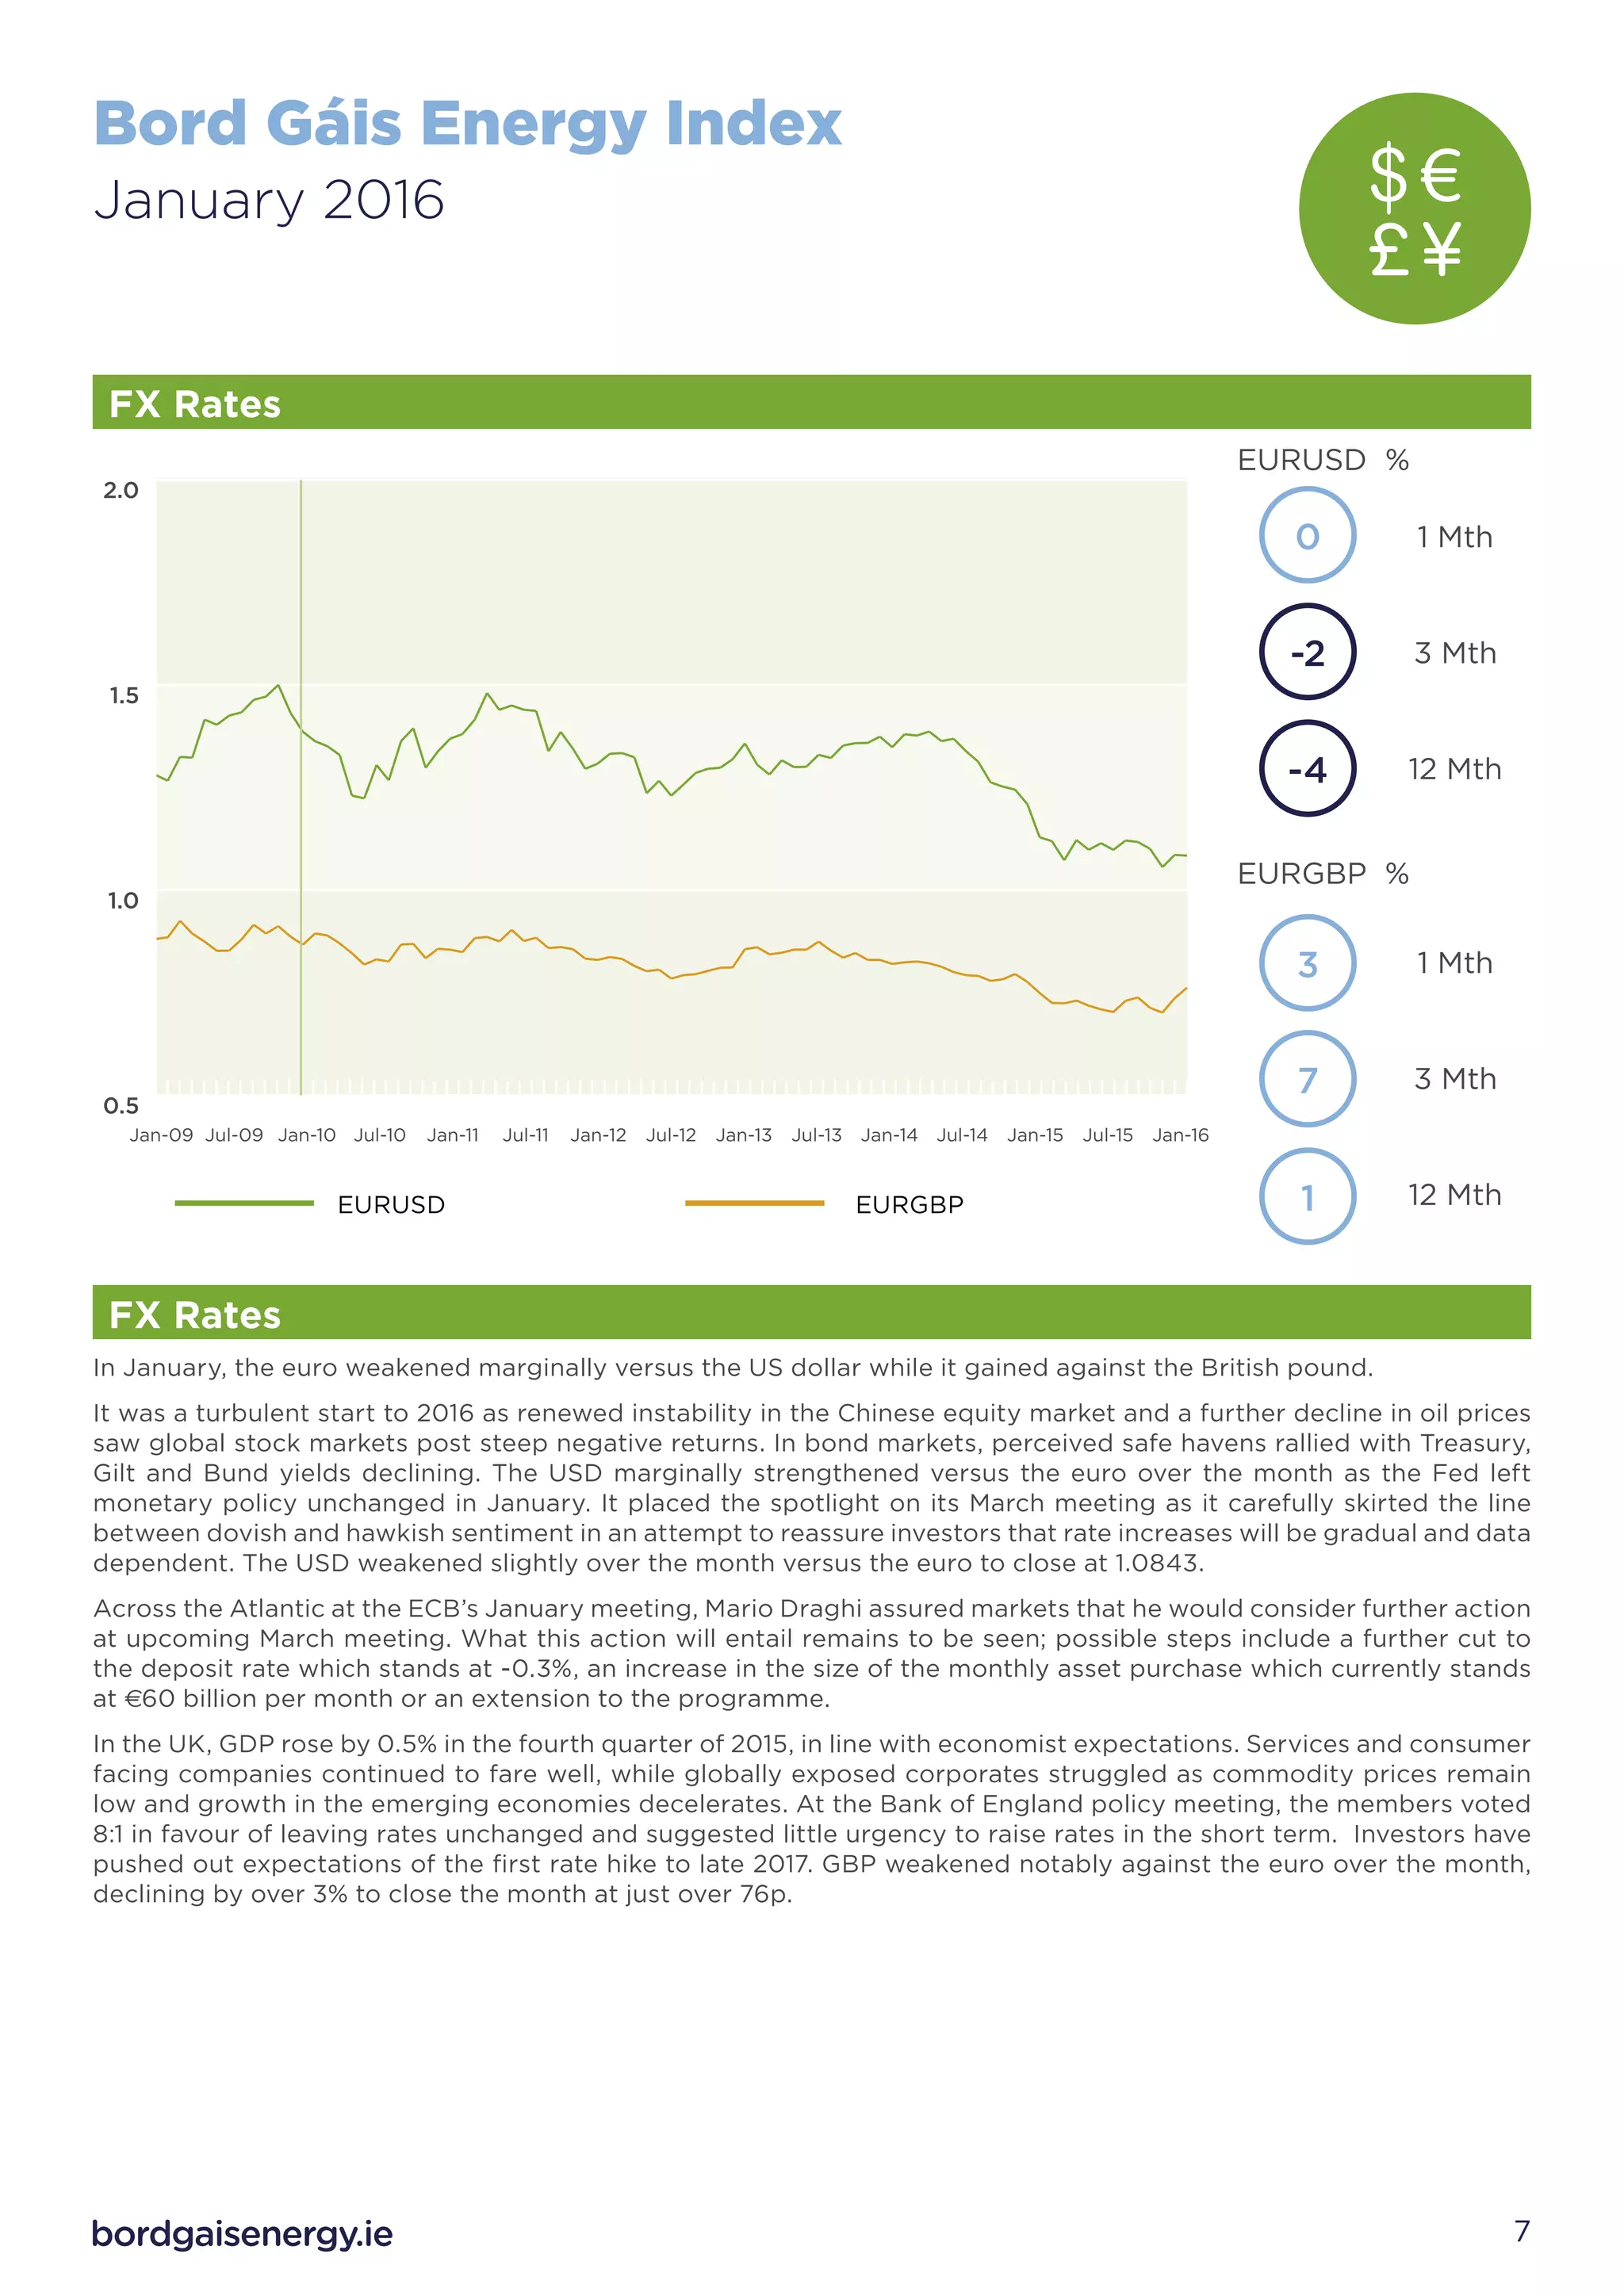

- In January 2016, the Bord Gáis Energy Index fell 7% as wholesale prices declined for Brent crude oil (-7%), UK gas (-9%), European coal (-3%), and Irish electricity (-8%). - Brent oil prices hit 12-year lows of $27.88/barrel in January due to oversupply and the lifting of Iranian sanctions. - UK natural gas prices averaged 32.02 pence/therm in January, down from 34.16 pence/therm in December, as mild weather and ample supplies weighed on prices. - Most energy commodity prices recorded losses in January as supply remained high and demand was weak.


