Download to read offline


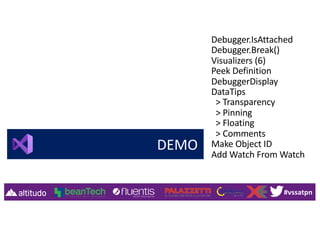

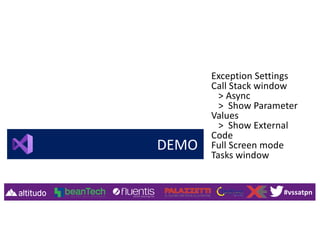

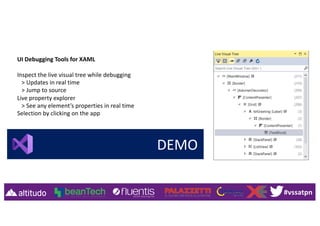


The document discusses debugging tips and tricks for .NET developers using Visual Studio 2019. It covers topics like launch options, stepping through code, return values, conditional breakpoints, the immediate window, exception settings, call stacks, performance profiling tools, UI debugging for XAML, and diagnostic tools. The presentation was given by Mirco Vanini and introduces debugging concepts and demonstrates features in Visual Studio.