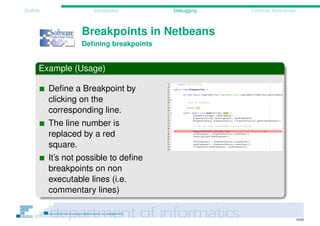
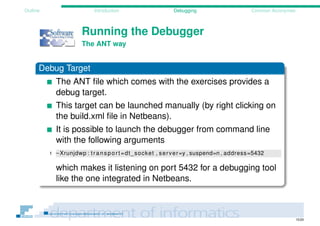
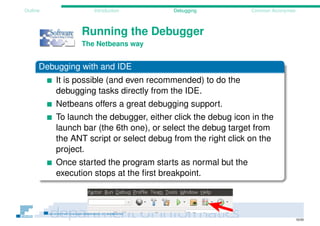
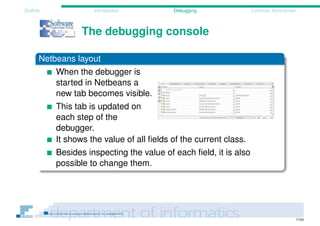
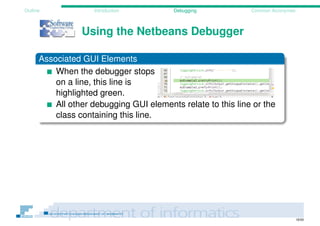
1/20
Outline Introduction Debugging Common Acronymes
Debugging
Debugging with NetBeans IDE
Andreas Ruppen
andreas.ruppen@unifr.ch
University of Fribourg
Department of Informatics
Software Engineering Group
April 18, 2014
2/20
Outline Introduction Debugging Common Acronymes
1 Introduction
2 Debugging
3 Common Acronymes
3/20
Outline Introduction Debugging Common Acronymes
Generalities I
Definition (Debugging)
Debugging is the process of identifying and eliminating bugs in
a software system. Debugging can be a quite complex process
especially when systems are distributed, deployed or tightly
coupled.
Generalities
In general debugging is done with the aid of some software.
This is what we call interactive debugging. This software can
control the program flow, watch log files or memory dumps and
much more.
4/20
Outline Introduction Debugging Common Acronymes
Generalities II
Origin (Wikipedia)
The terms "bug" and "debugging" are both popularly attributed
to Admiral Grace Hopper in the 1940s. While she was working
on a Mark II Computer at Harvard University, her associates
discovered a moth stuck in a relay and thereby impeding
operation, whereupon she remarked that they were "debugging"
the system. However the term "bug" in the meaning of technical
error dates back at least to 1878 and Thomas Edison.
5/20
Outline Introduction Debugging Common Acronymes
Generalities III
Figure : First Bug (from wikipedia.org)
6/20
Outline Introduction Debugging Common Acronymes
Difficulties I
The debugging skills of the programmer are a major factor
when it comes to eliminating bugs.
Software tends to become more and more complex which
makes debugging harder.
Mobile devices also introduces new challenges for
debugging. The code is run and developed on different
machines.
High-level languages such as Java are easier to debug
than low level languages like C.
Bugs may occur through memory corruption which is
difficult to track. This comes from the fact that the thrown
error is not necessary the origin of the problem.
7/20
Outline Introduction Debugging Common Acronymes
Types of Debugging
Interactive Debugging Software
Debugging software monitors the flow of the program. It can
also modify this flow, inspect and change attribute values,
pausing the execution at predefined locations, influence the
outcome of branches and switch statements etc. . .
Static Debugging Software
Instead of running the software and closely observe its
execution, some tools look statically at the code to identify
potential problems. These static code analysis tools come
handy to identify problems which are hard to reproduce like
memory leaks. It is most useful to pinpoint erroneous pointers,
infinite recursive structures.
8/20
Outline Introduction Debugging Common Acronymes
Debugging techniques I
for interactive debugging
A first step in debugging is to reproduce the problem. This
sounds trivial but can become quite complex in the case of
memory leaks, distributed systems, multithreaded systems
etc. . . A good bug report always includes the precise steps
to reproduce the problem.
Once the problem reproduced, to make debugging easier,
the input is simplified (the bug could come from a too large
input file for example, if the smaller file passes the problem
is found). These simplifications are the most time made
manually (divide-and-conquer). Smaller input also allows
faster debugging (think of a large for-loop iterating over
each line of a file).
9/20
Outline Introduction Debugging Common Acronymes
Debugging techniques II
for interactive debugging
From this point on, a developer has several choices to
precisely identify the problem:
He can use a debugging tool (like gdb or one integrated in
the IDE) to examine the memory and the local variables at
some interesting points of the program.
Another method is to use tracing (think about last weeks
logging).
Post-mortem debugging, which consists of memory dump
analysis
Remote debugging for deployed applications.
10/20
Outline Introduction Debugging Common Acronymes
Debugging in NetBeans IDE
Use Case
What is debugging?
Run through the code with the interpreter.
Allows to see whether the execution path is as expected.
Using the Debugger
We can use the debugger:
to verify if a programm behaves as we except.
to identify the nature of a runtime-error.
to force the programm entering a given state.
11/20
Outline Introduction Debugging Common Acronymes
Debugging in NetBeans IDE
Howto
Fist steps
Open a project in NetBeans IDE.
Define the Breakpoints at some interesting points.
Start the Debugger
Debugging mode
Runs the code with the Java virtual machine.
Everything that is possible in normal mode, should also be
possible in debugging mode.
Execution stops for user action at the defined breakpoints.
12/20
Outline Introduction Debugging Common Acronymes
Breakpoints I
Defining Breakpoints
Definition (Breakpoint)
A Breakpoint is an indication for the Java Debugger. They are
ignored by the Java virtual machine when running in normal
mode. However when running in debug mode, the execution
stops at every breakpoint and waits for a user action before it
continues to the next break points.
13/20
Outline Introduction Debugging Common Acronymes
Breakpoints II
Defining Breakpoints
Actions
When the execution of the programm stops at a breakpoint
following actions are possible:
Inspection or modification of dynamic variables.
Step-by-step execution.
Go to the next breakpoint (or to the end of the application if
there are no more breakpoints).
14/20
Outline Introduction Debugging Common Acronymes
Breakpoints in NetBeans IDE
Defining breakpoints
Example (Usage)
Define a Breakpoint by
clicking on the
corresponding line.
The line number is
replaced by a red
square.
It’s not possible to define
breakpoints on non
executable lines (i.e.
commentary lines)
15/20
Outline Introduction Debugging Common Acronymes
Running the Debugger
The ANT way
Debug Target
The ANT file which comes with the exercises provides a
debug target.
This target can be launched manually (by right clicking on
the build.xml file in NetBeans IDE).
It is possible to launch the debugger from command line
with the following arguments
1 −Xrunjdwp : transport =dt_socket , server=y , suspend=n , address=5432
which makes it listening on port 5432 for a debugging tool
like the one integrated in NetBeans IDE.
16/20
Outline Introduction Debugging Common Acronymes
Running the Debugger
The NetBeans IDE way
Debugging with and IDE
It is possible (and even recommended) to do the
debugging tasks directly from the IDE.
NetBeans IDE offers a great debugging support.
To launch the debugger, either click the debug icon in the
launch bar (the 6th one), or select the debug target from
the ANT script or select debug from the right click on the
project.
Once started the program starts as normal but the
execution stops at the first breakpoint.
17/20
Outline Introduction Debugging Common Acronymes
The debugging console
NetBeans IDE layout
When the debugger is
started in NetBeans IDE
a new tab becomes
visible.
This tab is updated on
each step of the
debugger.
It shows the value of all fields of the current class.
Besides inspecting the value of each field, it is also
possible to change them.
18/20
Outline Introduction Debugging Common Acronymes
Using the NetBeans IDE Debugger
Associated GUI Elements
When the debugger stops
on a line, this line is
highlighted green.
All other debugging GUI elements relate to this line or the
class containing this line.
19/20
Outline Introduction Debugging Common Acronymes
Using the NetBeans IDE Debugger
Associated GUI Elements
When everyhting seems ok to continue, NetBeans IDE offers
several buttons for going on:
Stop (the debugger)
Pause
Continue (to next
Breakpoint)
Step Over
Step over Expression
Step into
Step out
Run to cursor
Apply Code Change
Take GUI Snapshot
20/20
Outline Introduction Debugging Common Acronymes
Used acronyms
IDE Integrated Development Environment
gdb GNU Debugger
GNU GNU is not Unix

Debugging with NetBeans IDE

  • 1.
    1/20 Outline Introduction DebuggingCommon Acronymes Debugging Debugging with NetBeans IDE Andreas Ruppen andreas.ruppen@unifr.ch University of Fribourg Department of Informatics Software Engineering Group April 18, 2014
  • 2.
    2/20 Outline Introduction DebuggingCommon Acronymes 1 Introduction 2 Debugging 3 Common Acronymes
  • 3.
    3/20 Outline Introduction DebuggingCommon Acronymes Generalities I Definition (Debugging) Debugging is the process of identifying and eliminating bugs in a software system. Debugging can be a quite complex process especially when systems are distributed, deployed or tightly coupled. Generalities In general debugging is done with the aid of some software. This is what we call interactive debugging. This software can control the program flow, watch log files or memory dumps and much more.
  • 4.
    4/20 Outline Introduction DebuggingCommon Acronymes Generalities II Origin (Wikipedia) The terms "bug" and "debugging" are both popularly attributed to Admiral Grace Hopper in the 1940s. While she was working on a Mark II Computer at Harvard University, her associates discovered a moth stuck in a relay and thereby impeding operation, whereupon she remarked that they were "debugging" the system. However the term "bug" in the meaning of technical error dates back at least to 1878 and Thomas Edison.
  • 5.
    5/20 Outline Introduction DebuggingCommon Acronymes Generalities III Figure : First Bug (from wikipedia.org)
  • 6.
    6/20 Outline Introduction DebuggingCommon Acronymes Difficulties I The debugging skills of the programmer are a major factor when it comes to eliminating bugs. Software tends to become more and more complex which makes debugging harder. Mobile devices also introduces new challenges for debugging. The code is run and developed on different machines. High-level languages such as Java are easier to debug than low level languages like C. Bugs may occur through memory corruption which is difficult to track. This comes from the fact that the thrown error is not necessary the origin of the problem.
  • 7.
    7/20 Outline Introduction DebuggingCommon Acronymes Types of Debugging Interactive Debugging Software Debugging software monitors the flow of the program. It can also modify this flow, inspect and change attribute values, pausing the execution at predefined locations, influence the outcome of branches and switch statements etc. . . Static Debugging Software Instead of running the software and closely observe its execution, some tools look statically at the code to identify potential problems. These static code analysis tools come handy to identify problems which are hard to reproduce like memory leaks. It is most useful to pinpoint erroneous pointers, infinite recursive structures.
  • 8.
    8/20 Outline Introduction DebuggingCommon Acronymes Debugging techniques I for interactive debugging A first step in debugging is to reproduce the problem. This sounds trivial but can become quite complex in the case of memory leaks, distributed systems, multithreaded systems etc. . . A good bug report always includes the precise steps to reproduce the problem. Once the problem reproduced, to make debugging easier, the input is simplified (the bug could come from a too large input file for example, if the smaller file passes the problem is found). These simplifications are the most time made manually (divide-and-conquer). Smaller input also allows faster debugging (think of a large for-loop iterating over each line of a file).
  • 9.
    9/20 Outline Introduction DebuggingCommon Acronymes Debugging techniques II for interactive debugging From this point on, a developer has several choices to precisely identify the problem: He can use a debugging tool (like gdb or one integrated in the IDE) to examine the memory and the local variables at some interesting points of the program. Another method is to use tracing (think about last weeks logging). Post-mortem debugging, which consists of memory dump analysis Remote debugging for deployed applications.
  • 10.
    10/20 Outline Introduction DebuggingCommon Acronymes Debugging in NetBeans IDE Use Case What is debugging? Run through the code with the interpreter. Allows to see whether the execution path is as expected. Using the Debugger We can use the debugger: to verify if a programm behaves as we except. to identify the nature of a runtime-error. to force the programm entering a given state.
  • 11.
    11/20 Outline Introduction DebuggingCommon Acronymes Debugging in NetBeans IDE Howto Fist steps Open a project in NetBeans IDE. Define the Breakpoints at some interesting points. Start the Debugger Debugging mode Runs the code with the Java virtual machine. Everything that is possible in normal mode, should also be possible in debugging mode. Execution stops for user action at the defined breakpoints.
  • 12.
    12/20 Outline Introduction DebuggingCommon Acronymes Breakpoints I Defining Breakpoints Definition (Breakpoint) A Breakpoint is an indication for the Java Debugger. They are ignored by the Java virtual machine when running in normal mode. However when running in debug mode, the execution stops at every breakpoint and waits for a user action before it continues to the next break points.
  • 13.
    13/20 Outline Introduction DebuggingCommon Acronymes Breakpoints II Defining Breakpoints Actions When the execution of the programm stops at a breakpoint following actions are possible: Inspection or modification of dynamic variables. Step-by-step execution. Go to the next breakpoint (or to the end of the application if there are no more breakpoints).
  • 14.
    14/20 Outline Introduction DebuggingCommon Acronymes Breakpoints in NetBeans IDE Defining breakpoints Example (Usage) Define a Breakpoint by clicking on the corresponding line. The line number is replaced by a red square. It’s not possible to define breakpoints on non executable lines (i.e. commentary lines)
  • 15.
    15/20 Outline Introduction DebuggingCommon Acronymes Running the Debugger The ANT way Debug Target The ANT file which comes with the exercises provides a debug target. This target can be launched manually (by right clicking on the build.xml file in NetBeans IDE). It is possible to launch the debugger from command line with the following arguments 1 −Xrunjdwp : transport =dt_socket , server=y , suspend=n , address=5432 which makes it listening on port 5432 for a debugging tool like the one integrated in NetBeans IDE.
  • 16.
    16/20 Outline Introduction DebuggingCommon Acronymes Running the Debugger The NetBeans IDE way Debugging with and IDE It is possible (and even recommended) to do the debugging tasks directly from the IDE. NetBeans IDE offers a great debugging support. To launch the debugger, either click the debug icon in the launch bar (the 6th one), or select the debug target from the ANT script or select debug from the right click on the project. Once started the program starts as normal but the execution stops at the first breakpoint.
  • 17.
    17/20 Outline Introduction DebuggingCommon Acronymes The debugging console NetBeans IDE layout When the debugger is started in NetBeans IDE a new tab becomes visible. This tab is updated on each step of the debugger. It shows the value of all fields of the current class. Besides inspecting the value of each field, it is also possible to change them.
  • 18.
    18/20 Outline Introduction DebuggingCommon Acronymes Using the NetBeans IDE Debugger Associated GUI Elements When the debugger stops on a line, this line is highlighted green. All other debugging GUI elements relate to this line or the class containing this line.
  • 19.
    19/20 Outline Introduction DebuggingCommon Acronymes Using the NetBeans IDE Debugger Associated GUI Elements When everyhting seems ok to continue, NetBeans IDE offers several buttons for going on: Stop (the debugger) Pause Continue (to next Breakpoint) Step Over Step over Expression Step into Step out Run to cursor Apply Code Change Take GUI Snapshot
  • 20.
    20/20 Outline Introduction DebuggingCommon Acronymes Used acronyms IDE Integrated Development Environment gdb GNU Debugger GNU GNU is not Unix