Download to read offline

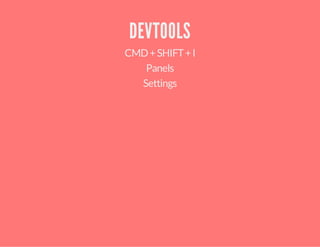


The document provides an overview of debugging JavaScript using Chrome DevTools, covering key features such as the DevTools UI, console commands, and debugging techniques. It highlights useful tips like customizing console output and setting breakpoints to track variable scope and asynchronous events. The document also includes links for further resources and encouragement for user interaction and sharing experiences.


![Class[3][5th jun] [three js]](https://cdn.slidesharecdn.com/ss_thumbnails/class35thjun-threejs-210609051622-thumbnail.jpg?width=640&height=640&fit=bounds)