Debugging with Firebug and Web InspectorBeyond the BasicsBy Steven Roussey
AgendaAbout MePast, Present, FutureDesign PatternsDebugging PatternsDebugging PerformanceExploring FurtherQ & A
About MeName: Steven RousseyFirebug Working GroupW3C Invited ExpertIlluminationsSites:Network54AppCenterStudybeatand others…twitter.com/srousseywww.sroussey.com
Past, Present, Futurealert()
Past, Present, Futurealert()console.log()
Past, Present, Futurealert()console.log()JavaScript DebuggersMS Script Debugger for IE4VenkmanFirebug!Web InspectorMS IE Developer ToolsOpera DragonflyMS Visual StudioMozilla Dev Tools
Past, Present, Futurealert()console.log()JavaScript DebuggersMS Script Debugger for IE4VenkmanFirebug!Web InspectorMS IE Developer ToolsOpera DragonflyMS Visual StudioMozilla Dev ToolsTools for Design PatternsIlluminations for Developers
Past, Present, FutureHTML  vs. HTML5
Past, Present, FutureAn end to progressive enhancementMoving business logic to the clientMobile is accelerating the trend
Past, Present, FutureAn end to progressive enhancementAbstractions over DOM-nessTop-Down over Bottom-UpMoving business logic to the clientMobile is accelerating the trend
Past, Present, FutureAn end to progressive enhancementAbstractions over DOM-nessTop-Down over Bottom-UpMoving business logic to the clientlocalStorage needs processing, templating, syncing with server / cloudMobile is accelerating the trend
Past, Present, FutureAn end to progressive enhancementAbstractions over DOM-nessTop-Down over Bottom-UpMoving business logic to the clientlocalStorage needs processing, templating, syncing with server / cloudMobile is accelerating the trendOfflineLatency kills
Past, Present, FutureToolkitsjQueryMooToolsExtCoreFrameworksExtJS Desktop / Sencha TouchDojo ToolkitSproutCoreqooXdoo / Unity
Tooling for Design PatternsTools like Firebug show what they know:DOMJavaScript Objects, etc.CSSScript Files
Tooling for Design PatternsTools like Firebug show what they know:DOMJavaScript Objects, etc.CSSScript FilesBut now there is a disconnect
Tooling for Design PatternsExample: Inspecting EventsFirebug extension: Eventbug
Tooling for Design PatternsEventbug with plain JSEventbug with a toolkit
Tooling for Design PatternsExample: Inspecting EventsFirebug extension: EventbugFails to give useful information, everything links to the same toolkit bind handler
Tooling for Design PatternsDesign PatternsSingletons, Sets, Composites, etc.Model – View – ControllerModel Associations – HasMany / BelongsTo
Debugging PatternsInspectingLog StreamingDivide & Conquer / Binary SearchTest and Assertion Driven
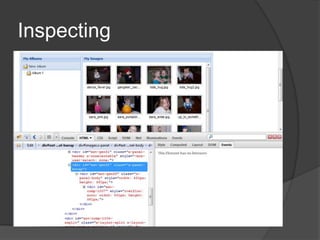
Inspecting
Inspecting
Inspecting with FireQuery
Inspecting with Illuminations
Log StreamingWatch what is happening flow byGreat for training your intuitionGreat for spotting odd behaviorGreat for spotting errors that otherwise get caught and hidden from the user
Log Streamingconsole.log/info/warn/error/exception/assertUse the different levels and filter in the consoleconsole.group/groupCollapsed/groupEndBundle many togetherconsole.dir/dirxml/tableFormatted data to the consoleconsole.count() and “Log calls to …”Following the flowconsole.profile/profileEnd & time/timeEndhttp://getfirebug.com/wiki/index.php/Console_API
Divide & ConquerTracking the bugger downBreak half way though and checkInterateBut first…
Basics ReviewDon’t try and use minified version of JS libs. Use “debug” versions. (YUI/ExtJS4)Try {} catch(e){} pros and consJSLint/ IDE checkingTrailing comma in IEreturn{ some: “thing” }Yes, speling and caSe matter
JavaScriptComparisonsNo block level scopeFunction scopes and hoistingCareful with with{}Closures
JavaScriptComparisonsRarely a need for explicit true (!!)=== does not perform type conversionnull/undefined are different
JavaScriptNo block level scopeFunction scopes and hoistingCareful with with(){}
JavaScriptClosuresVariable bindingVariable shadowingClosure scopes
JavaScriptvar links = document.getElementByTagName(‘a’),len = links.length;for (var i = 0; i < len; i++) {   links[i].onclick= function() {       alert(i+1);   };}
JavaScriptvar links = document.getElementsByTagName('a'),len = links.length;for (var i = 0; i < len; i++) {    links[i].onclick = (function(i) {return function() {    alert(i);    return false;    };   })(i);}
JavaScriptvarLIB = {helper:function(){console.log("helped");}};function test() {    with (LIB){var helper = 5;        console.log(helper);     }}test(); // 5 console.log(LIB.helper); // also 5, not a function
JavaScriptvarLIB = {helper:function(){console.log("helped");}};function test() {    with (LIB){        function helper(){console.log("good");};        // ...        helper();     }}test(); // helped LIB.helper(); // helped, not good…
Breakpointsdebugger;// unique comment to search forAfter an error, from the consoleWith conditionsDisabled breakpointsBreak-On-Next (BON)ErrorXHRCookieDOM Mutation
OK, I’m Broken, Now What?WatchesScope and closure chains are viewableCall StacksFunction chains are viewableCommand line in the current scope
IlluminationsI'm really excited to see tools which try to help the developer piece together a coherent story about the state of their web apps, instead of just burying them in a pile of data. I think the natural next step is to follow this evolution from straight data to... interpreted data, data that anticipates the questions web developers are trying to answer. I think Illuminations really nails that when it comes to web toolkit users.—Johnathan Nightingale, Director of Firefox Development, Mozilla
IlluminationsObject NamingIt presents the framework objects in a smarter way. It recognizes what they are and shows the whole name, like "Ext.DataView" instead of "Object" in the console and the other Firebug panels. And instead of random properties being appended, it looks for a ID-ish and a Value-ish property to show. This gives you an idea what you are looking at when you are debugging. See the example without and with Illumination:
IlluminationsElement HighlightingNow, when you hover the mouse over a Widget like Ext.DataView, it will highlight the component on the page. In the case where the coder didn't give a descriptive itemId or name, hovering over it does the trick -- it shows you exactly what that object is all about. This Components and Elements, and it even works for Ext Composites -- it highlights all of its nodes on the page!
IlluminationsContextual MenuWhen you right click on an element in Firefox, Firebug adds an "Inspect Element" menu item to open Firebug and bring you to that element in the HTML panel. Illumination does the same sort of thing, but tries to find the best match: ideally some sort of UI widget, otherwise an Ext Element.
IlluminationsIllumination PanelThere is a new panel added to Firebug called Illuminations, and when you use the contextual menu above, this is where it brings you. The Illumination panel is the place to inspect ExtJS objects: Widgets (or Views), Data (stores, records, fields), and Elements (Ext.Element and its brethren). These views show the hierarchical structure of your code:
Illuminations
Debugging PerformanceInside your codeconsole.time()console.profile()Web Inspector AuditsTools for ProductionYSlow (Firefox / Firebug)PageSpeed (Firefox / Firebug)SpeedTracer (Chrome)DynaTrace (IE)
You Are the Best DebuggerStop, and read the codeMaybe even read the manualWalk away (or sleep on it)Get a second pair of eyesSome of the simplest things can be spotted by someone that has not been staring at for the last eight hours.Create a test case of a problem and explanation – many times this process is enough
Exploring Furtherhttp://getfirebug.com/http://code.google.com/chrome/devtools/http://getfirebug.com/downloads#extensionshttp://code.google.com/webtoolkit/speedtracer/http://www.illuminations-for-developers.com/
Question & Answerhttp://www.sroussey.com/http://www.twitter.com/srousseyhttp://www.illuminations-for-developers.com/

Beyond the Basics, Debugging with Firebug and Web Inspector