


![console.log(object [, object, ...])
Format Specifier Description
%s Formats the value as a string.
%d or %i Formats the value as an integer.
%f Formats the value as a floating point value.
%o Formats the value as an expandable DOM element (as in
the Elements panel).
%O Formats the value as an expandable JavaScript object.
%c Formats the output string according to CSS styles you
provide.](https://image.slidesharecdn.com/chromedevtools-150714153517-lva1-app6892/85/Google-Chrome-DevTools-features-overview-50-320.jpg)
![console.log(object [, object, ...])](https://image.slidesharecdn.com/chromedevtools-150714153517-lva1-app6892/85/Google-Chrome-DevTools-features-overview-51-320.jpg)
![console.group(object[, object, ...])
console.groupCollapsed(object[, object, ...])
console.groupEnd()](https://image.slidesharecdn.com/chromedevtools-150714153517-lva1-app6892/85/Google-Chrome-DevTools-features-overview-56-320.jpg)
![Even more
debugger;
console.clear();
console.dirxml(object);
console.trace(object)
console.profile([label]);
console.profileEnd();
console.timeStamp([label]);](https://image.slidesharecdn.com/chromedevtools-150714153517-lva1-app6892/85/Google-Chrome-DevTools-features-overview-58-320.jpg)


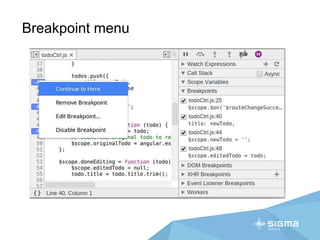
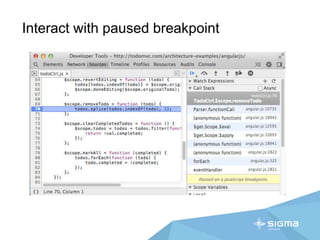
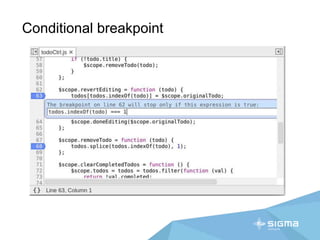
The document provides an overview of Google Chrome Developer Tools (DevTools), detailing their various features aimed at assisting web developers with debugging and optimizing web applications. It includes information on different panels like Elements, Console, and Sources, and highlights shortcuts for efficient workflow. Additionally, it covers advanced debugging techniques, profiling tools, and the resources panel for managing application storage.