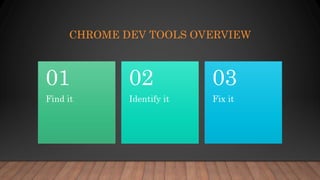
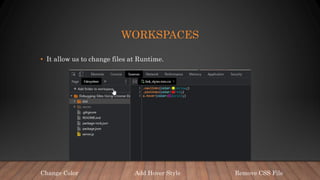
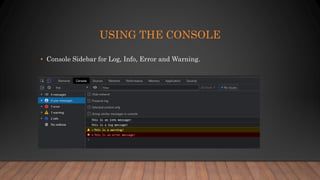
DEBUGGING SITES
USING CHROME
DEV TOOLS
NICKY PUNJABI
AGENDA
• Chrome Dev Tools Overview
• Workspaces
• Using the Console API and Utility API
• Debugging JavaScript
• Useful Festures
CHROME DEV TOOLS
CHROME DEV TOOLS OVERVIEW
Find it
01
Identify it
02
Fix it
03
WORKSPACES
• It allow us to change files at Runtime.
Add Hover Style
Change Color Remove CSS File
USING THE CONSOLE
• Console Sidebar for Log, Info, Error and Warning.
USING THE CONSOLE
• Console APIs:
• Console.log(data);
• Console.dir(data);
• Console.table(data);
• Console.groupCollapsed(‘’)
• Console.trace();
• Utility APIs: Can only be called using the DEV Tools Console
• $0
• Debug(event)
• Create live expression
DEBUGGING JAVASCRIPT
• Log Point
• Conditional Breakpoint
• Event Listener Breakpoint [Mouse click]
• Breakpoint – Sub-tree modification
• Snippets
USEFUL FEATURE
• document.designMode = "on“
• Multiple cursors – (control + click)
• Show Coverage
REFERENCES
• https://www.pluralsight.com/courses/debugging-sites-chrome-devtools
• https://www.shopify.com/partners/blog/chrome-developer-tools
• https://geekflare.com/chrome-devtools-features/
THANK
YOU

Debugging sites using chrome dev tools

Editor's Notes

  • #2 Take advantage of the features available in the Chrome Dev Tools to help you find and fix bugs faster. By the end of this session, you’ll have a solid understanding of the most useful DevTools features and how to use them to start debugging your own sites. The bug is a code that is just sitting in one place, doing the wrong thing in the same way every time.
  • #4 It’s like an IDE right inside the browser. Chrome DevTools is a set of web developer tools built directly into the Google Chrome browser. It allows us: Inspect the Generated HTML and Modify the DOM Troubleshooting and manipulating styles Debug JavaScript code and manipulate at Runtime Line Breakpoints Step through your code Inspect Network Request Simulate Mobile Device Most of the functionality is buried within these 9 Menu items spread across the top. The chrome documentation refer to these as Panels. In this session we will focus on the first 3 options. Rest 5 options also have a great set of functionalities that are focused on Performance Monitoring, Tuning and Security.
  • #5 The process of debugging can be broken down into three steps Finding where in the code the problem is occurring. Identifying exactly what is wrong with it. And then fix it.
  • #6 Sources – shows all the files downloaded from the web server for the current page. Notice the little green dot on the files that are downloaded from the server.
  • #9 'New Pie is',newFavorite newFavorite.includes(“Cherry”)
  • #10 Control + Shift + P