Download as PDF, PPTX

![Find the Hung Threads
© 2011 IBM Corporation
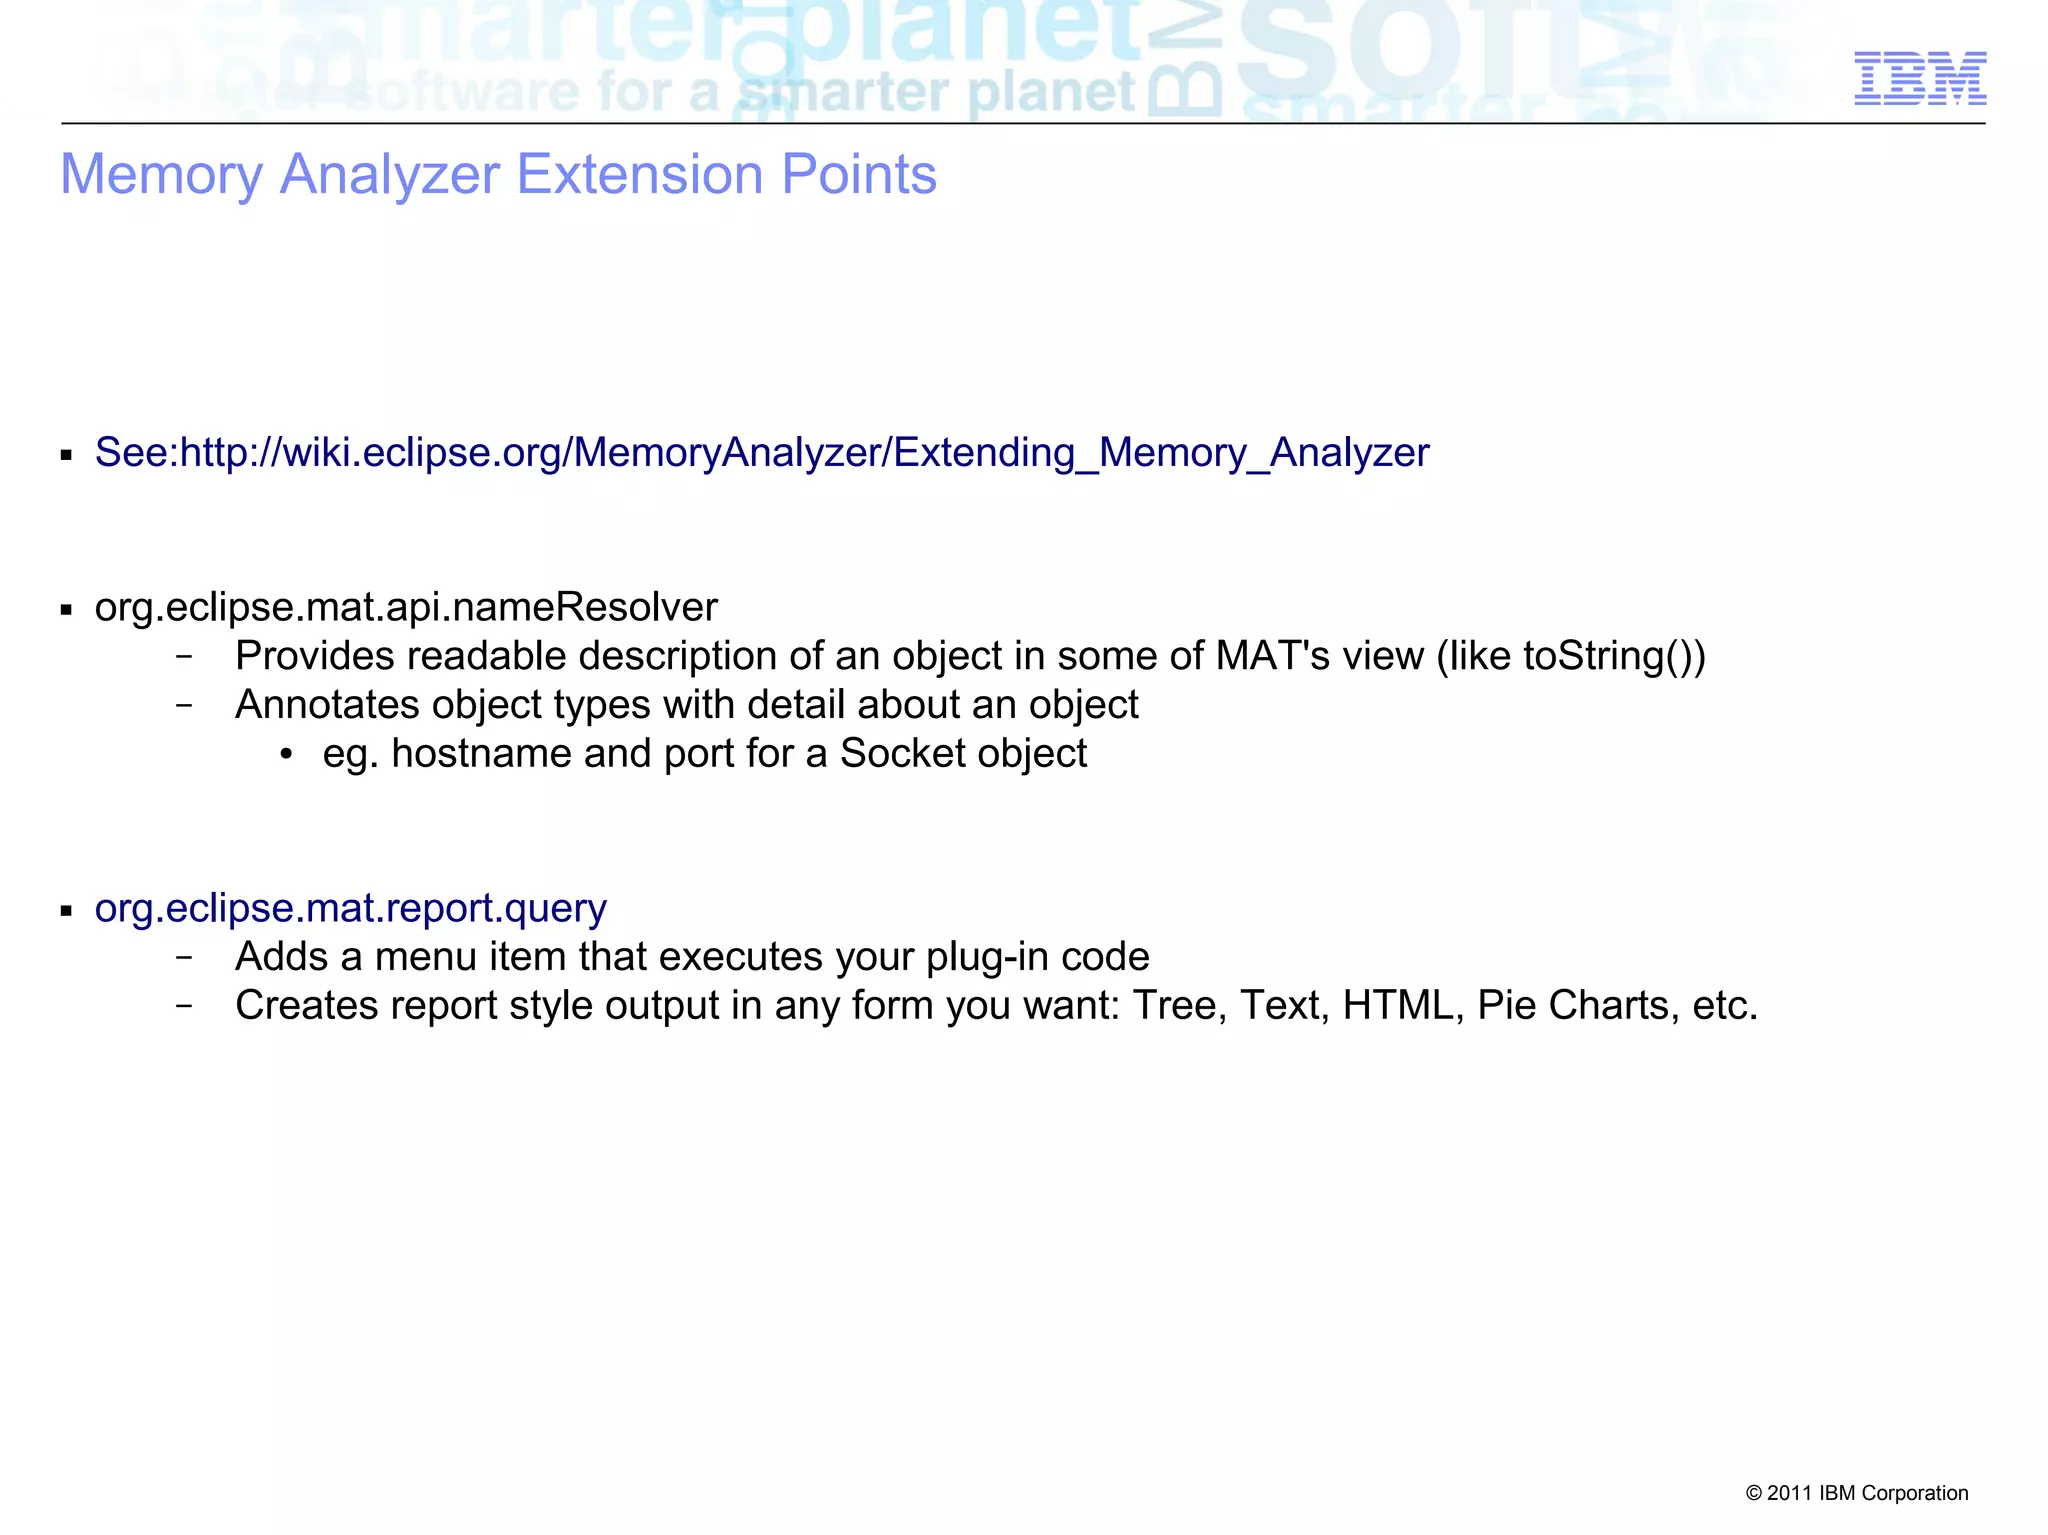
Memory Analyzer Extensions: query
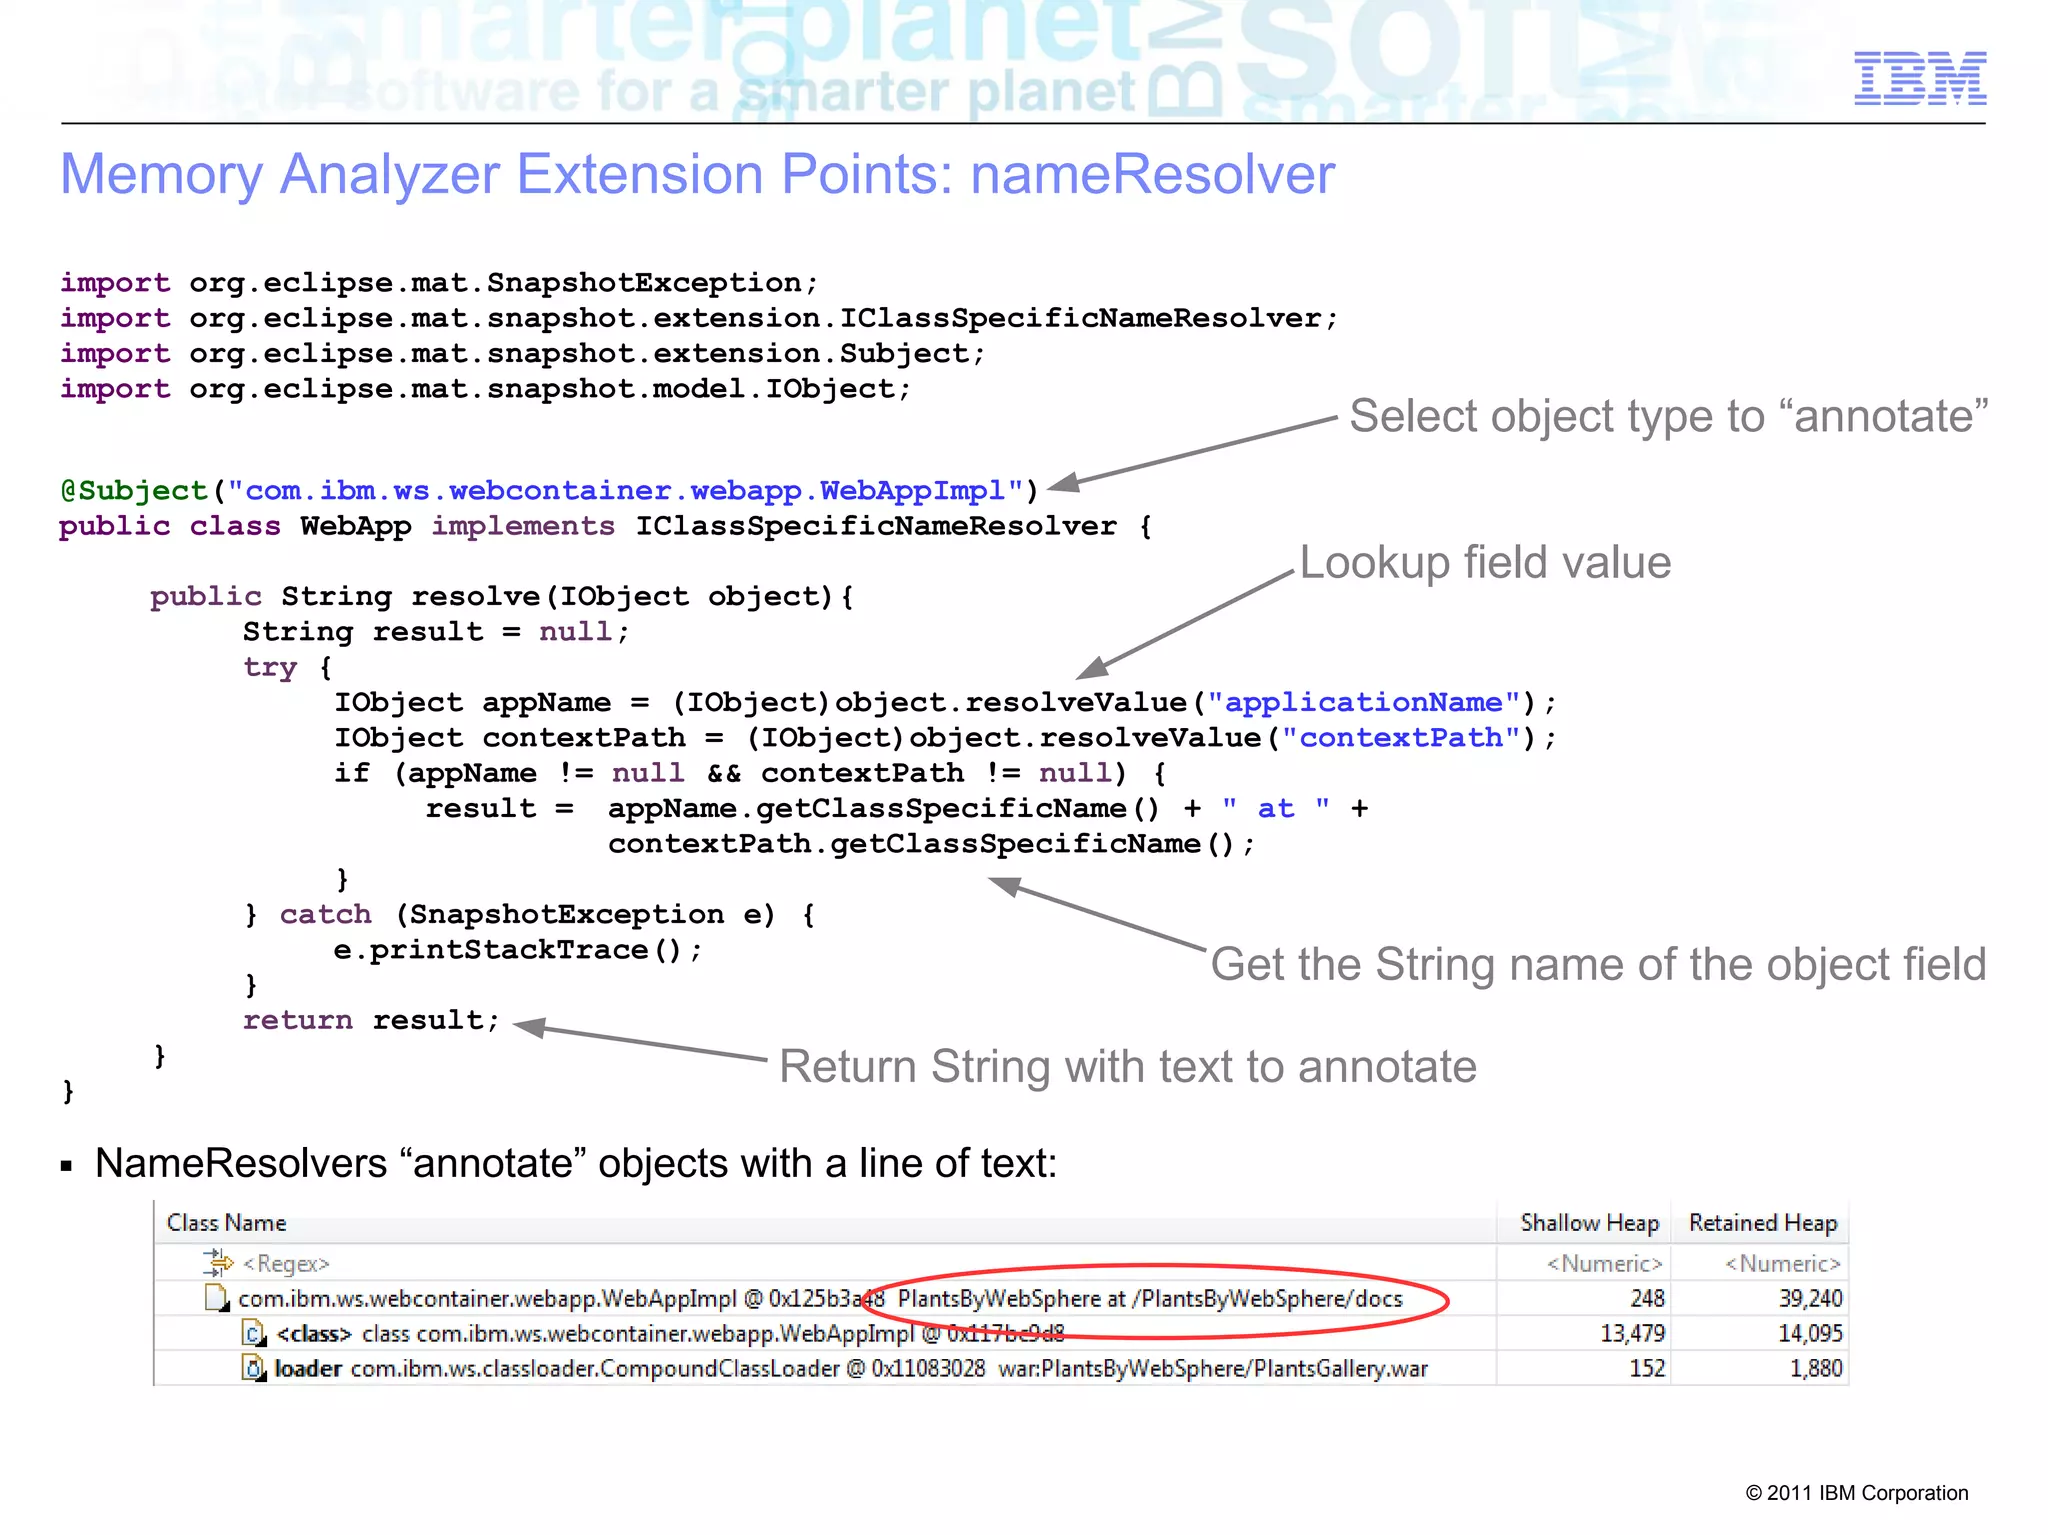
import org.eclipse.mat.SnapshotException;
import org.eclipse.mat.snapshot.extension.IClassSpecificNameResolver;
import org.eclipse.mat.snapshot.extension.Subject;
import org.eclipse.mat.snapshot.model.IObject;
Set name of query in menu
@Name("Hung Thread Stacks")
@Category(WASHelper.WAS_CATEGORY + WASHelper.HUNGTHREADS_SUBCATEGORY)
@Help("List any threads that may be hung.nn")
public class HungThreadsList extends BasePlugin {
public IResult execute(IProgressListener listener) throws Exception {
int[] hungThreadIds = HungThreads.getHungThreadIds(snapshot);
return new HungThreadsListOutgoingReferencesTree(
hungThreadIds, listener);
}
■ Queries produce “reports” available from pull down menus:
Set category in menu
Return “IResult” report](https://image.slidesharecdn.com/debuggingfromdumps-141103083447-conversion-gate01/75/Debugging-Java-from-Dumps-17-2048.jpg)
![© 2011 IBM Corporation
Finding the Hung Threads
public static int[] getHungThreadIds(ISnapshot snapshot)
throws SnapshotException {
int[] threadIds = findObjects(snapshot, "java.lang.Thread");
List<Integer> hungThreads = new ArrayList<Integer>();
for (int thr : threadIds) {
IObject thrObj = snapshot.getObject(thr);
if (isThreadHung(thrObj)) {
hungThreads.add(thr);
}
}
int[] hungThreadObjectIds = getArrayIntegers(hungThreads);
return hungThreadObjectIds;
}
■ findObjects() makes it easy to find all objects of a give type
■ Returns a list of ObjectIds (ints) for the hung threads
Find all Threads
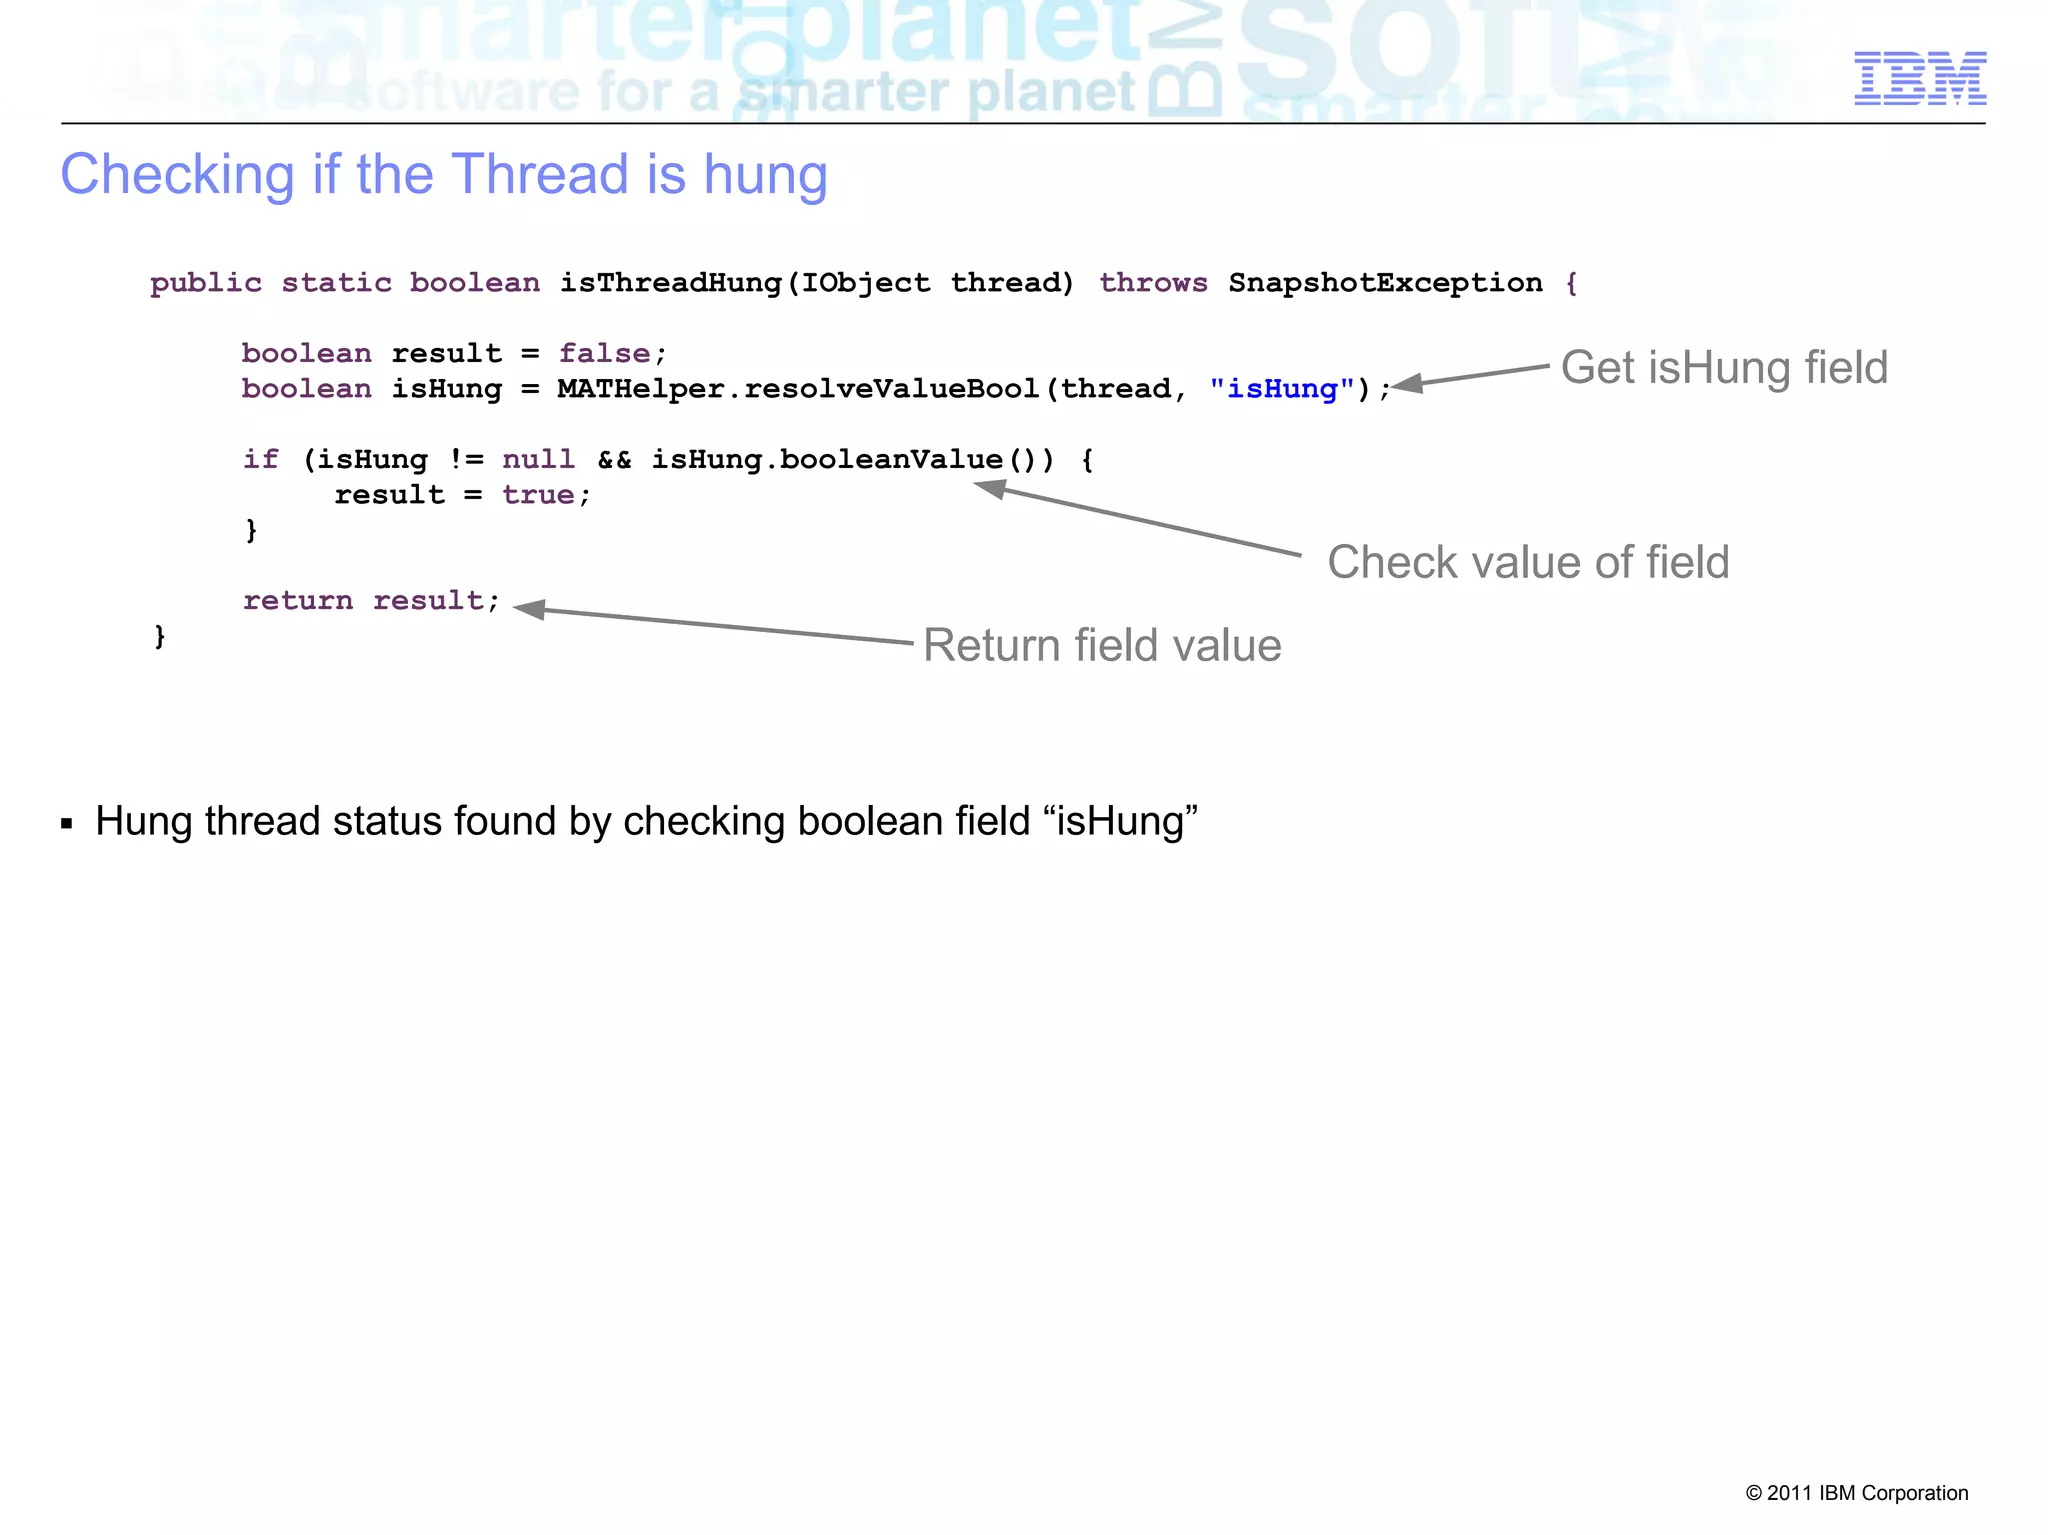
Check if the Thread is hung
Return the hung threads](https://image.slidesharecdn.com/debuggingfromdumps-141103083447-conversion-gate01/75/Debugging-Java-from-Dumps-18-2048.jpg)
![© 2011 IBM Corporation
Displaying the Hung Threads
public class HungThreadsListOutgoingReferencesTree extends OutgoingReferencesTree {
private static final int sortIndex = COLUMN_INDEX_MAX_BUILTIN + 2;
public HungThreadsListOutgoingReferencesTree(ISnapshot snapshot,
int[] roots, IProgressListener listener)
throws SnapshotException {
super(snapshot, roots, listener);
}
■ Customization used to add additional columns to output report:
– Last Dispatch Time and Estimated Time Hung
■ Displays a Tree view of outgoing references, from the hung threads
Customized
OutgoingReferencesTree](https://image.slidesharecdn.com/debuggingfromdumps-141103083447-conversion-gate01/75/Debugging-Java-from-Dumps-20-2048.jpg)
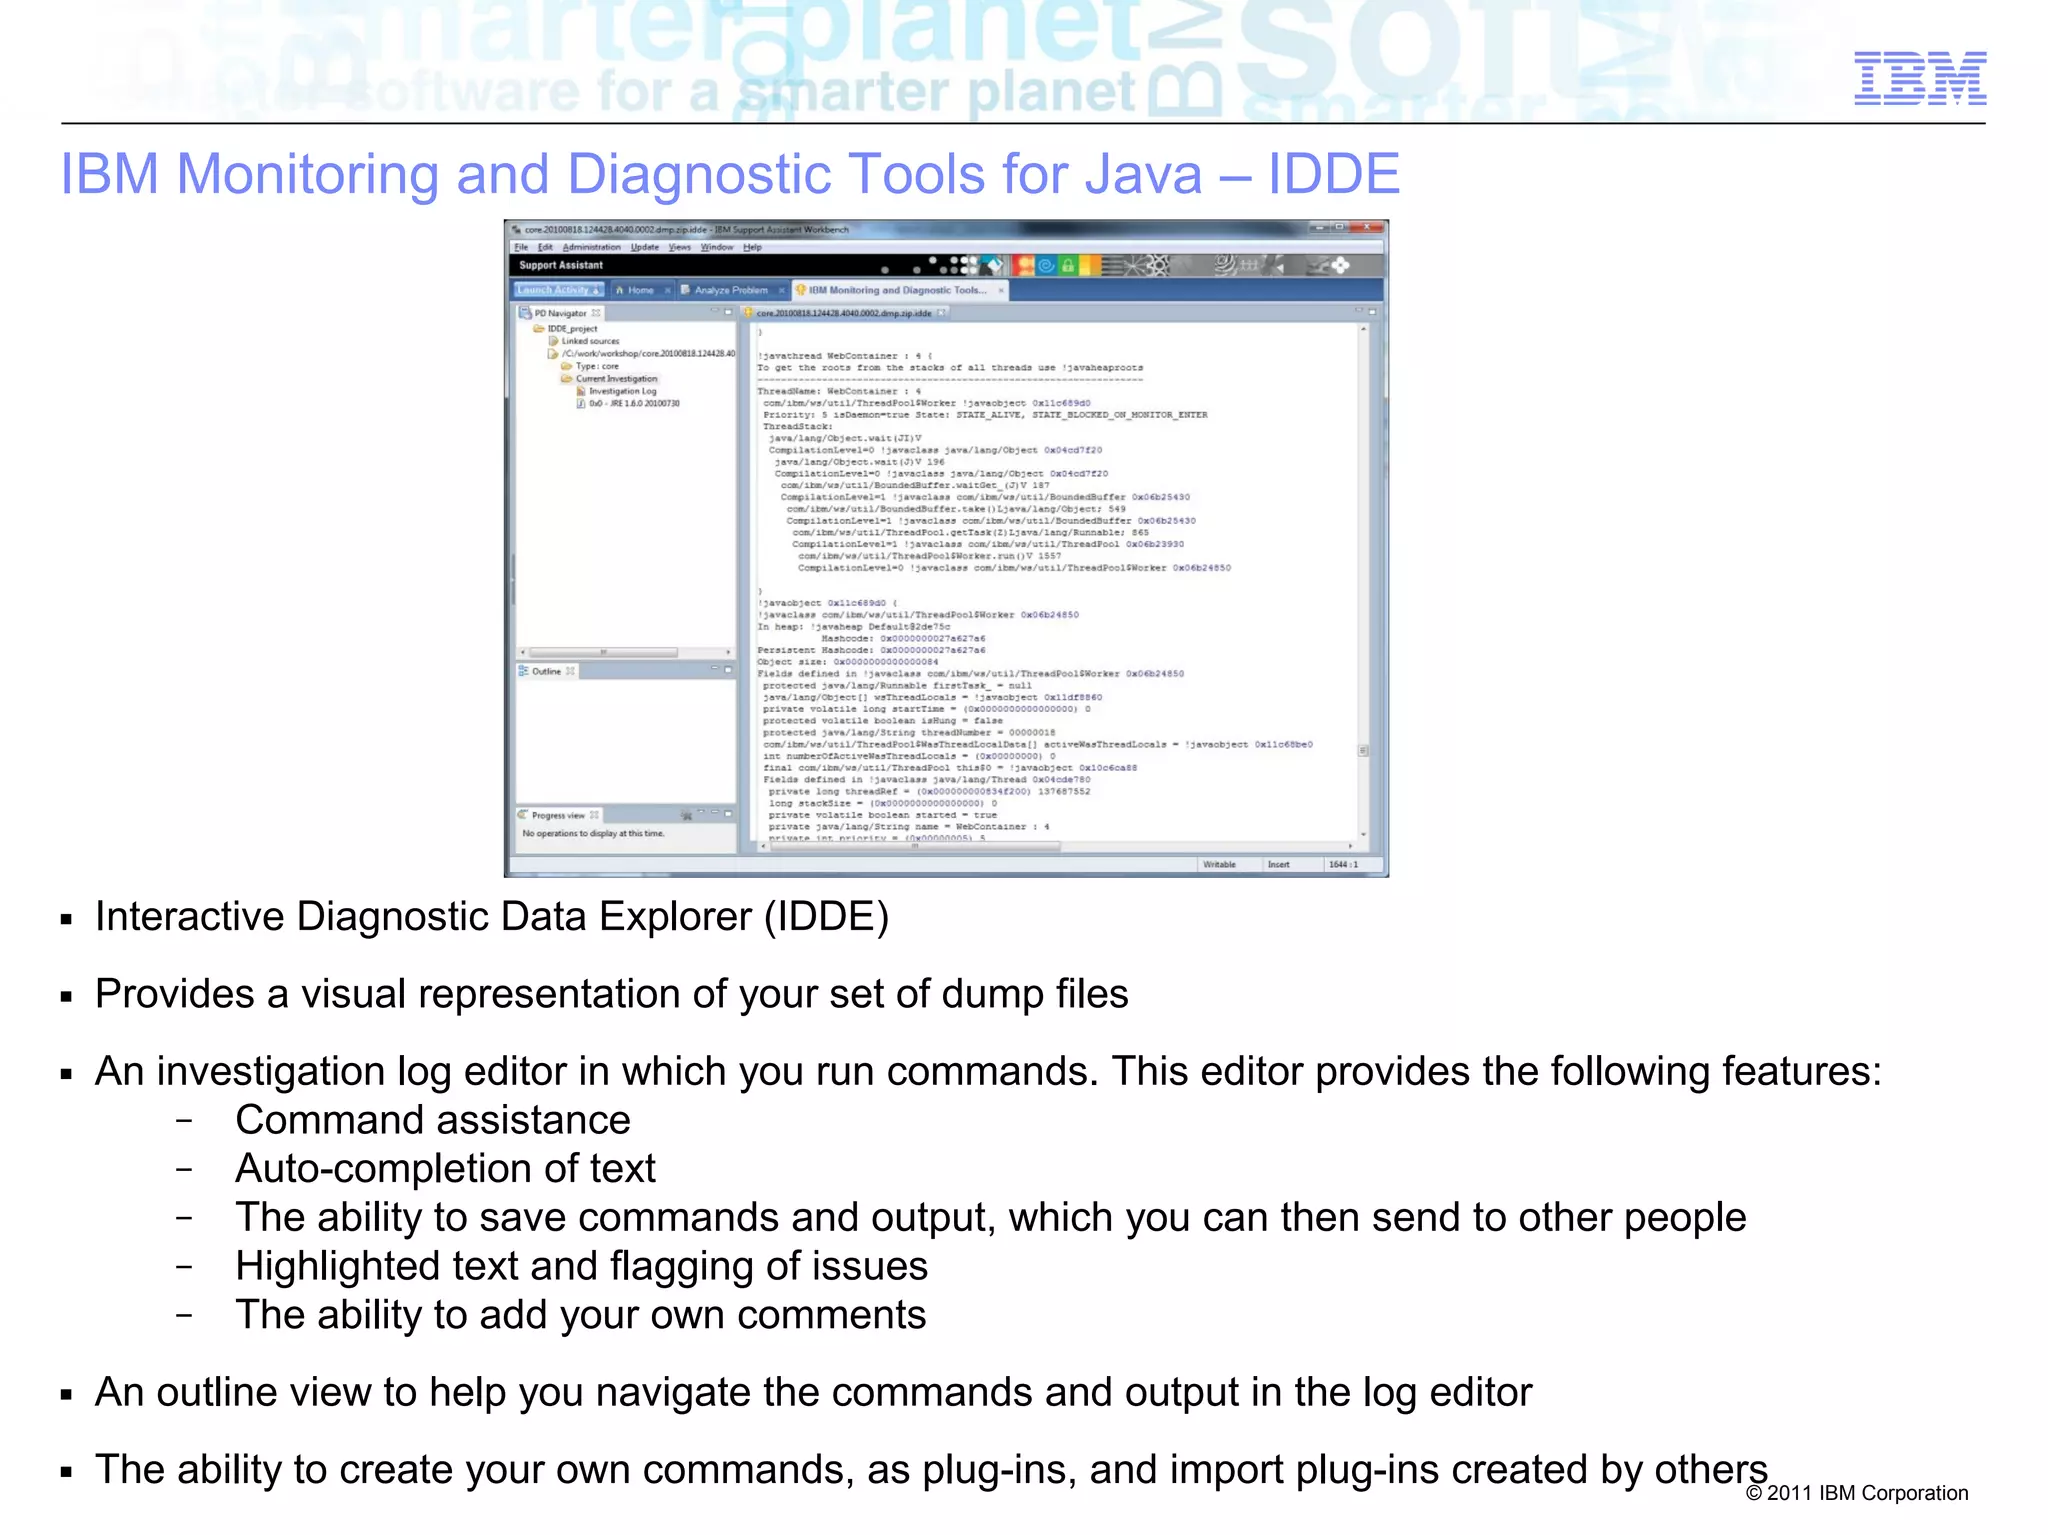

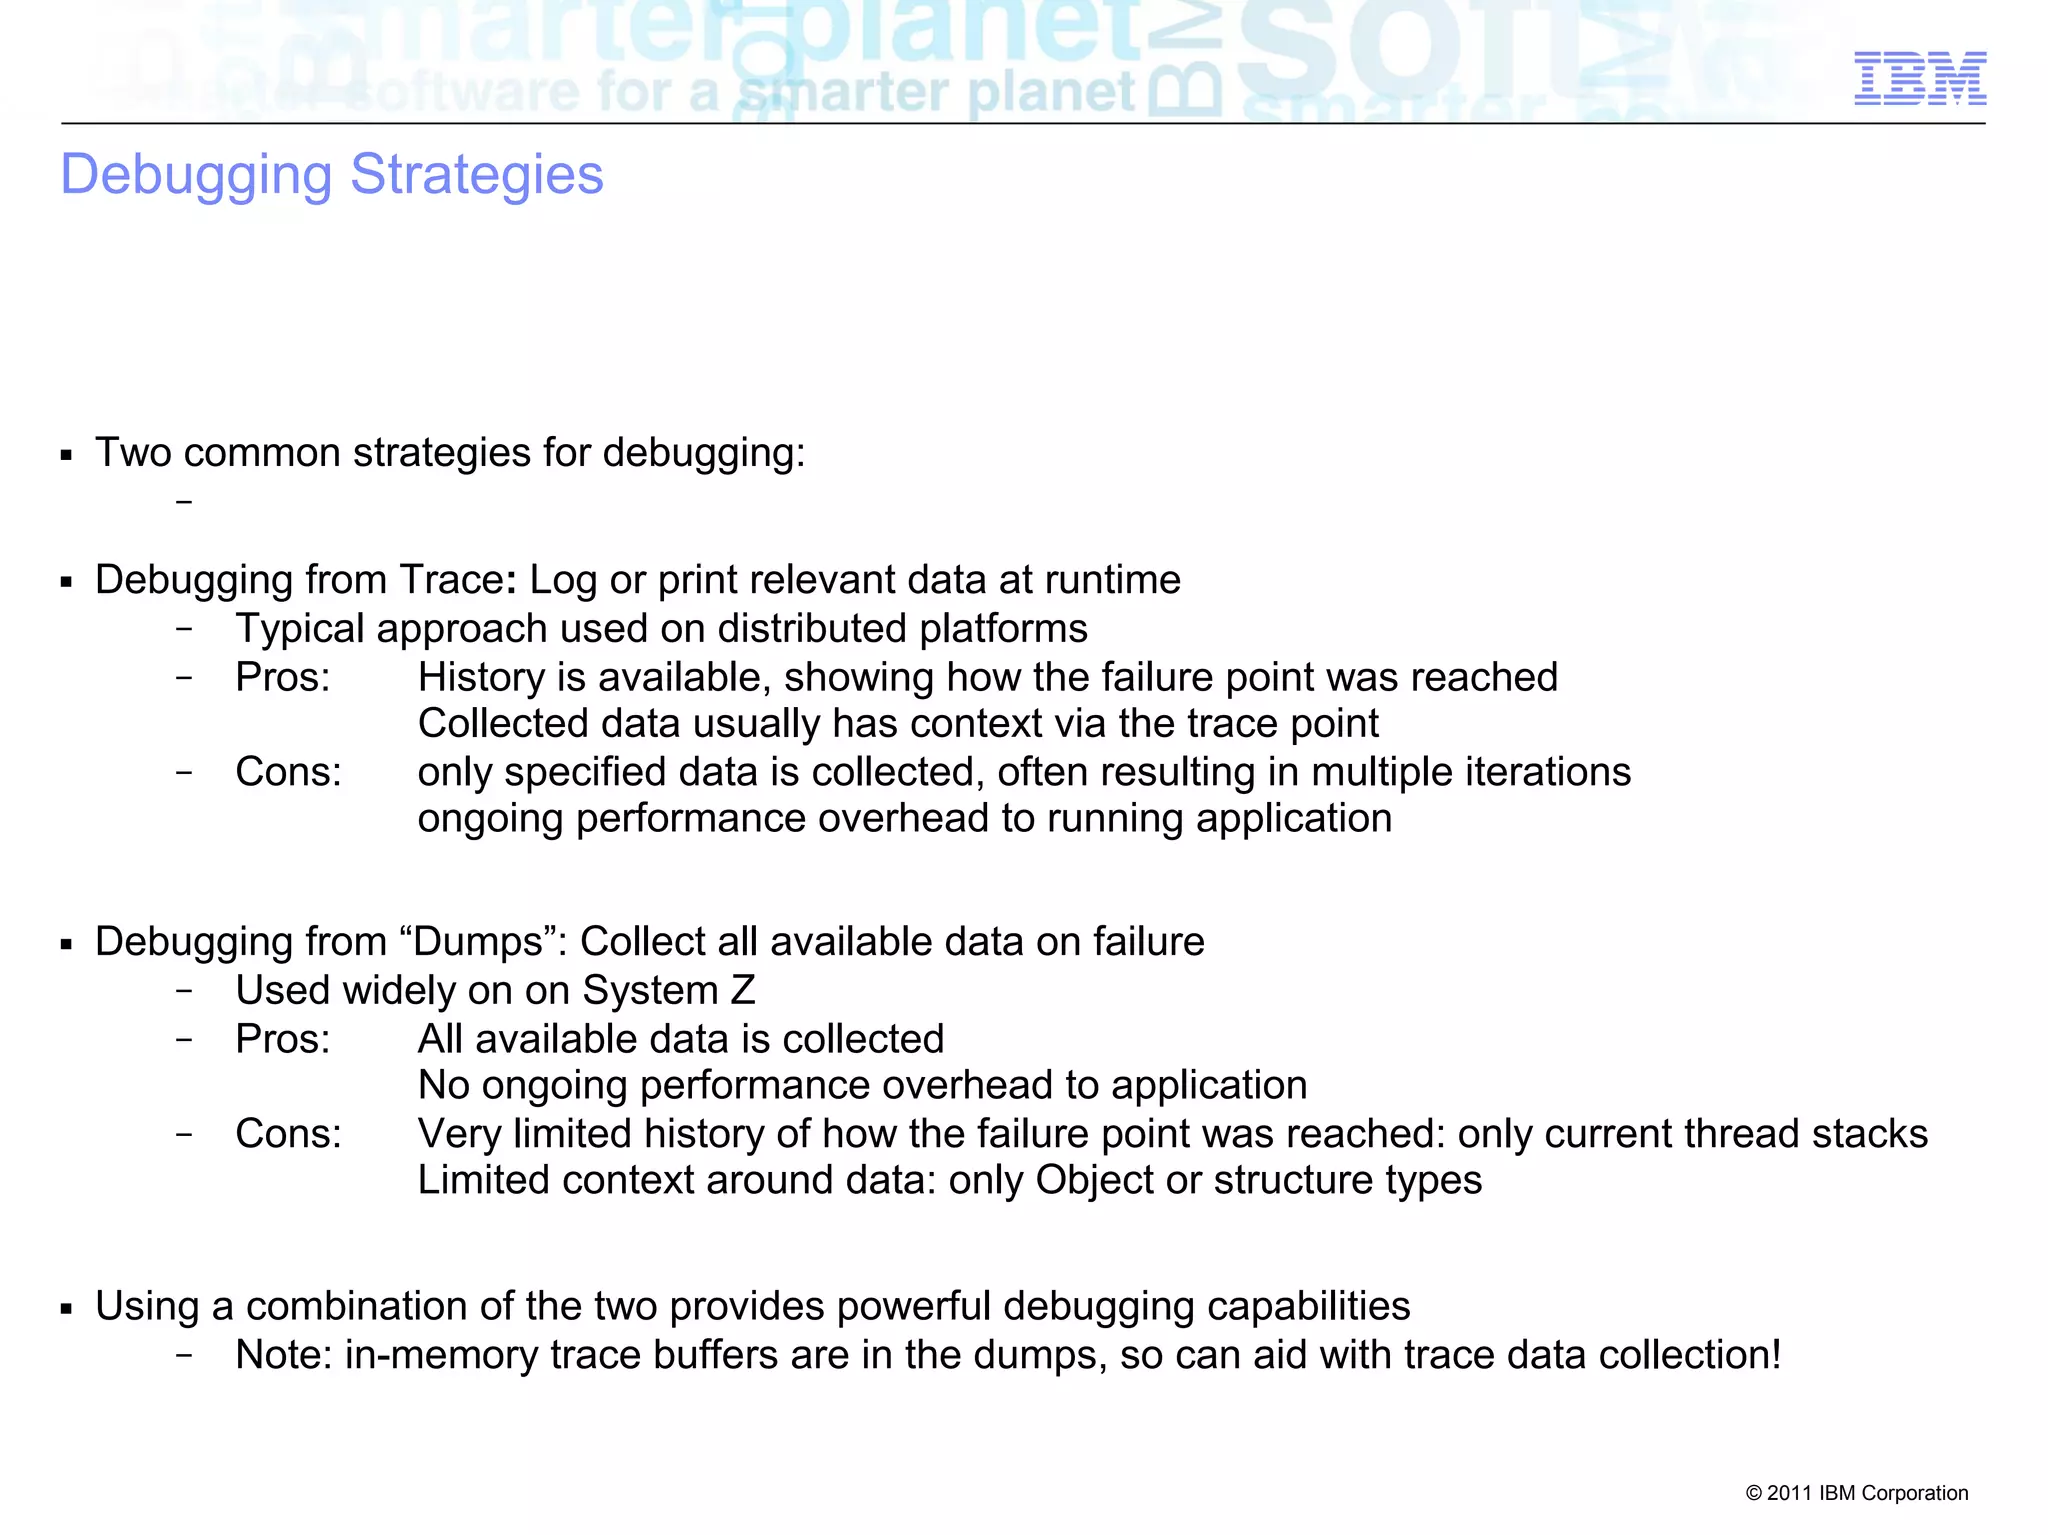
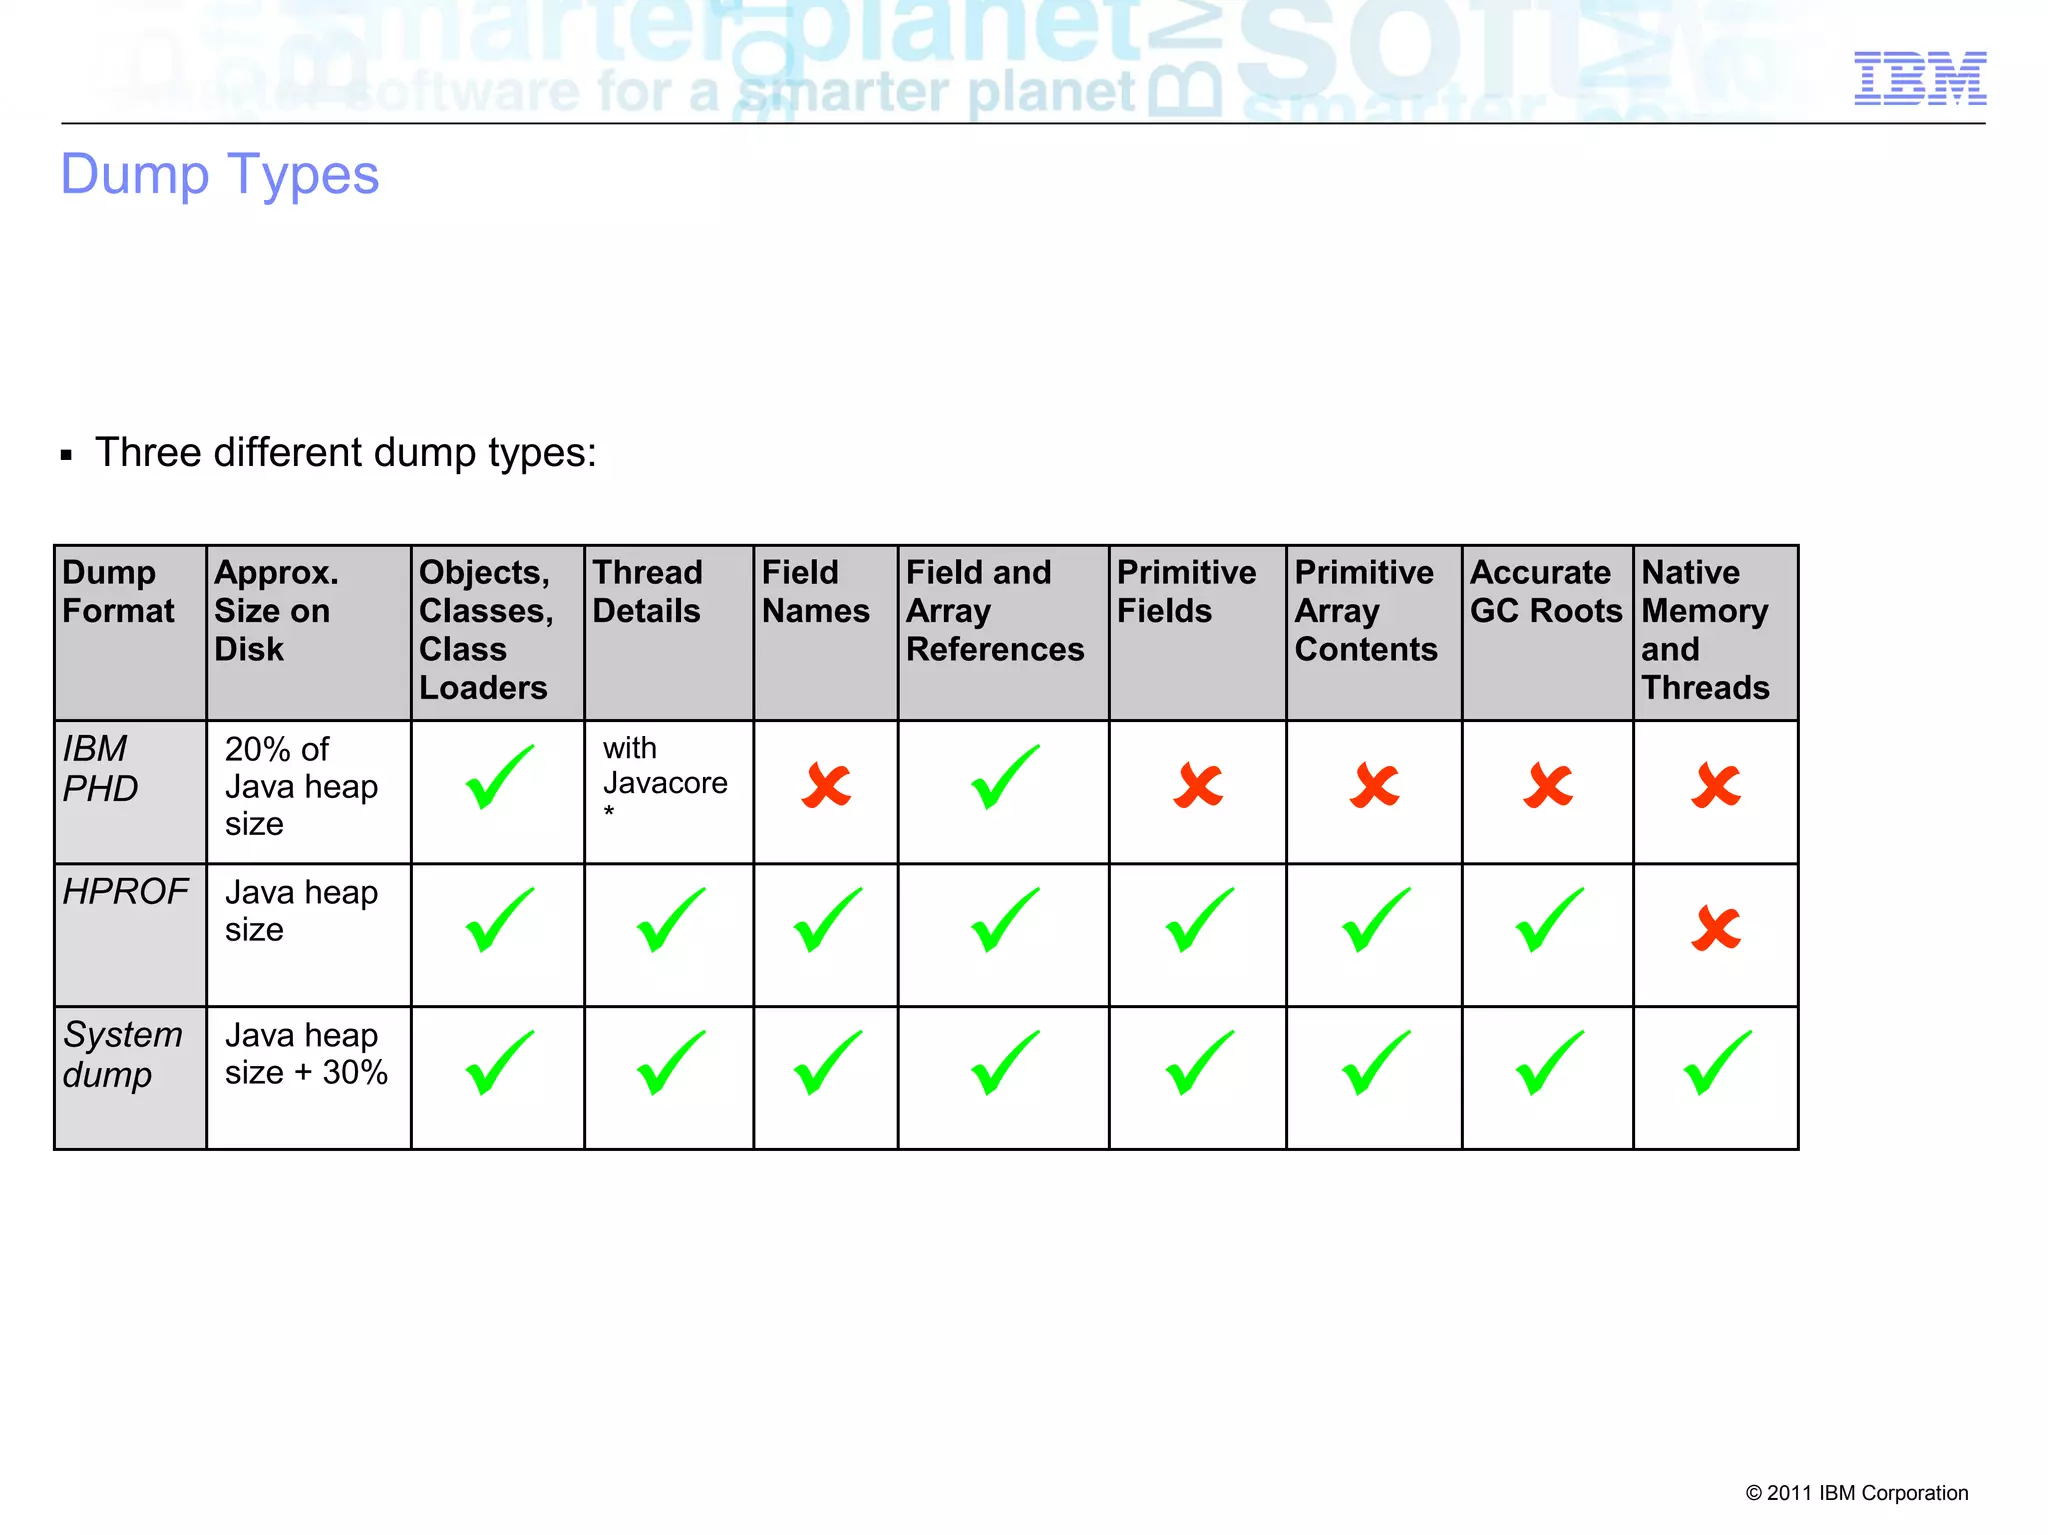
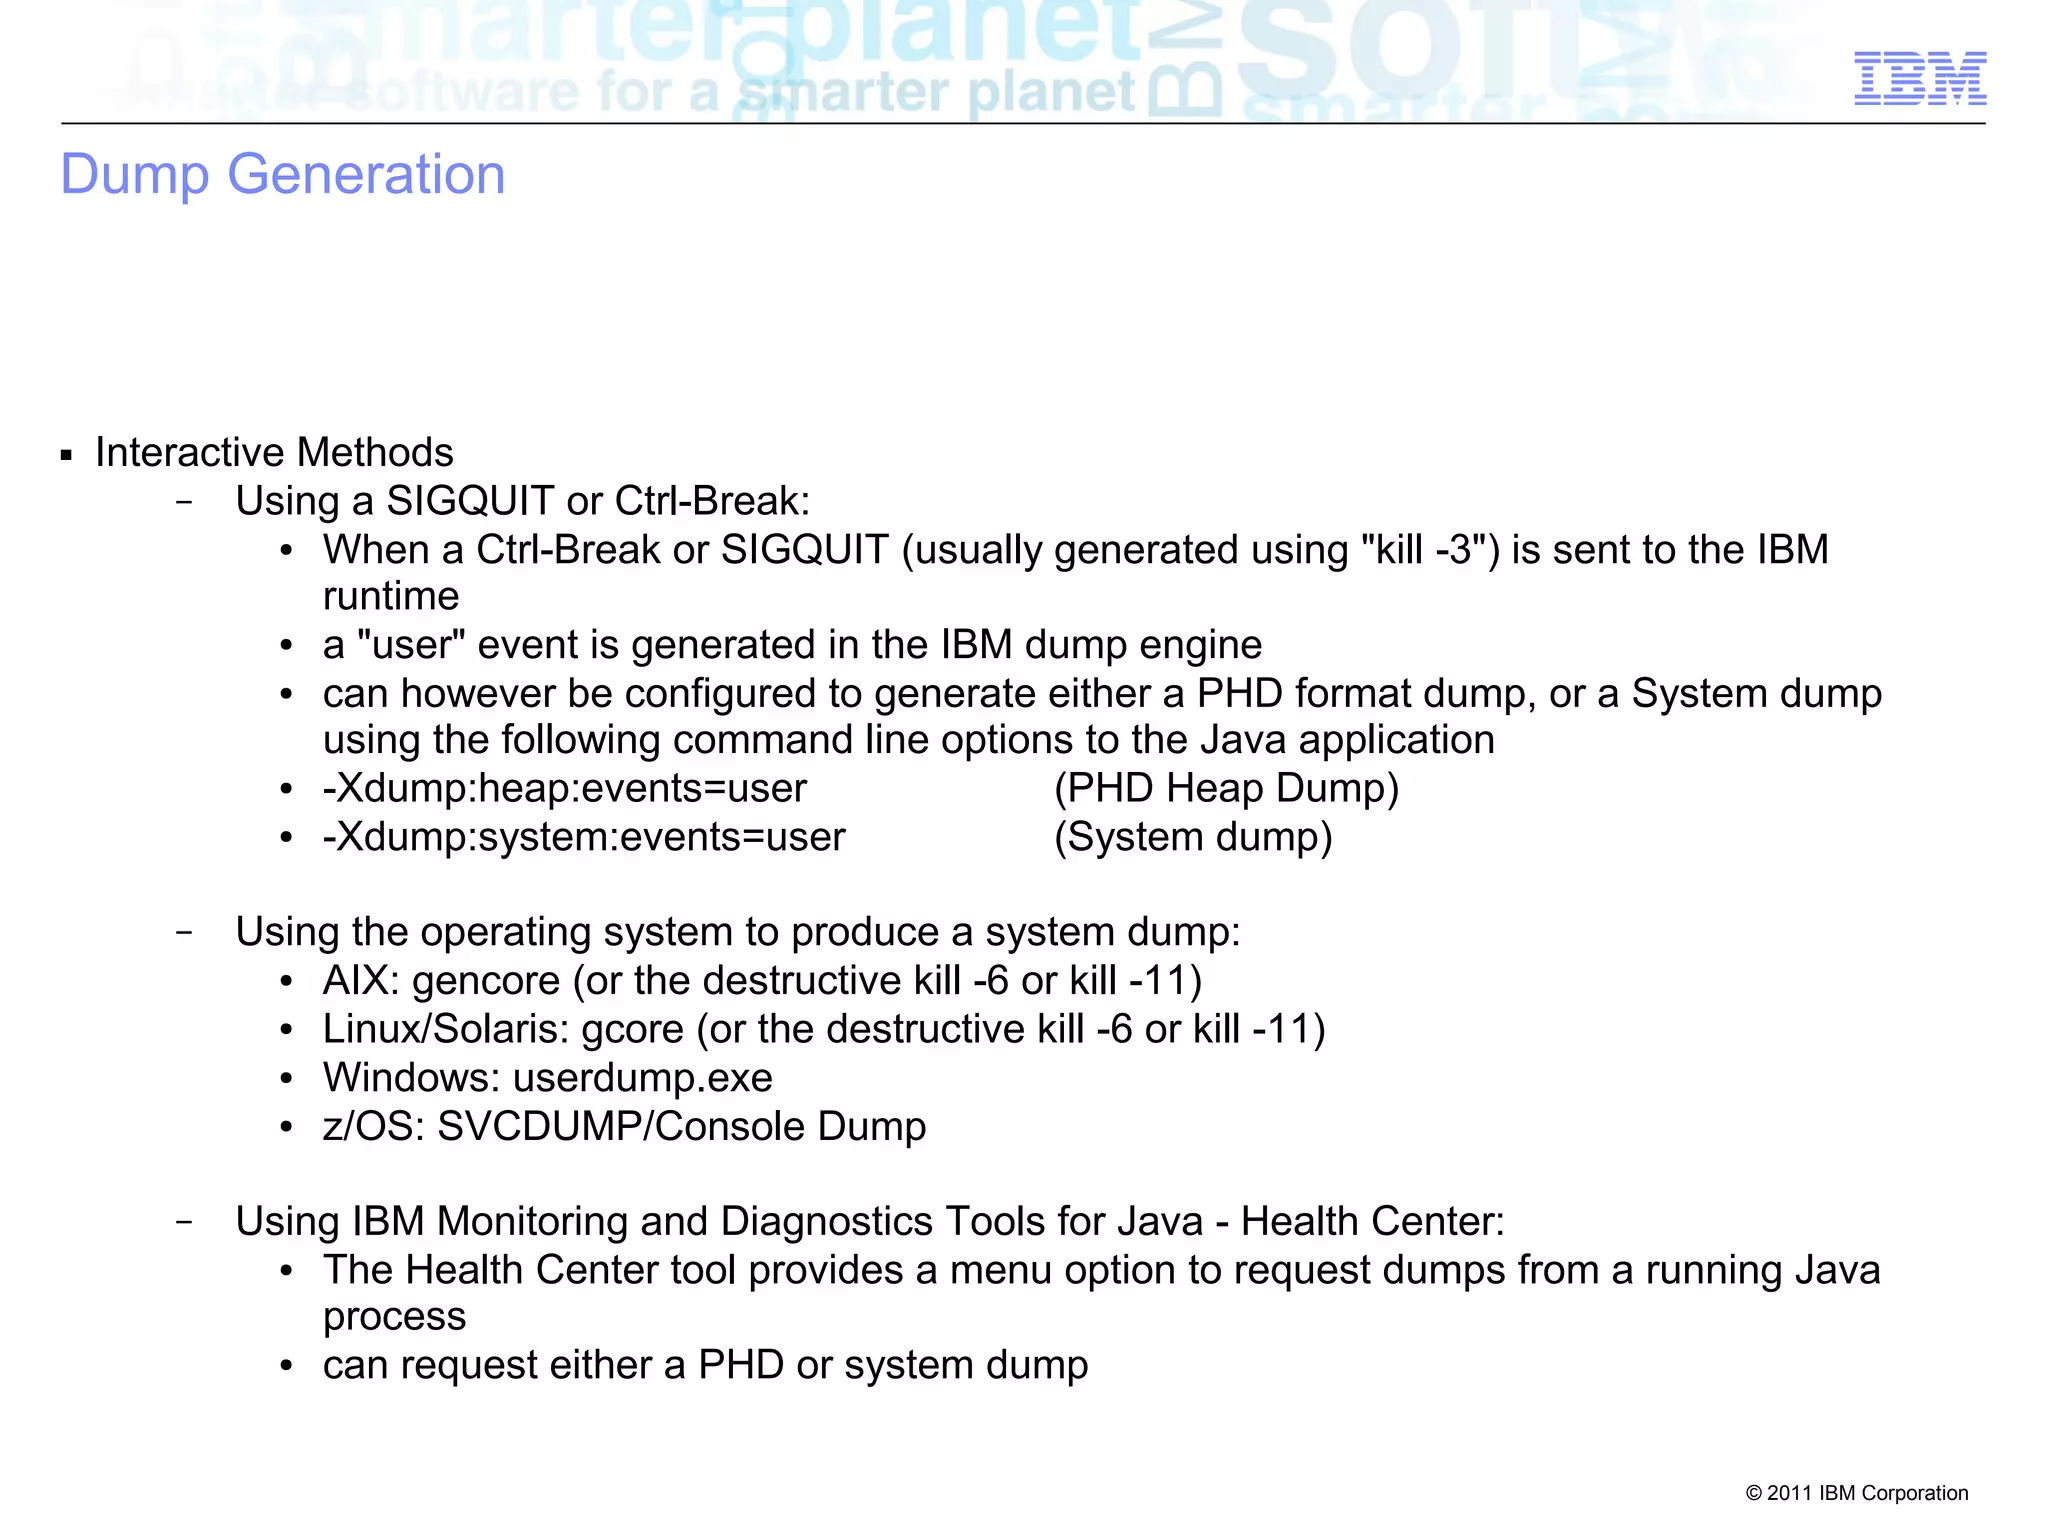
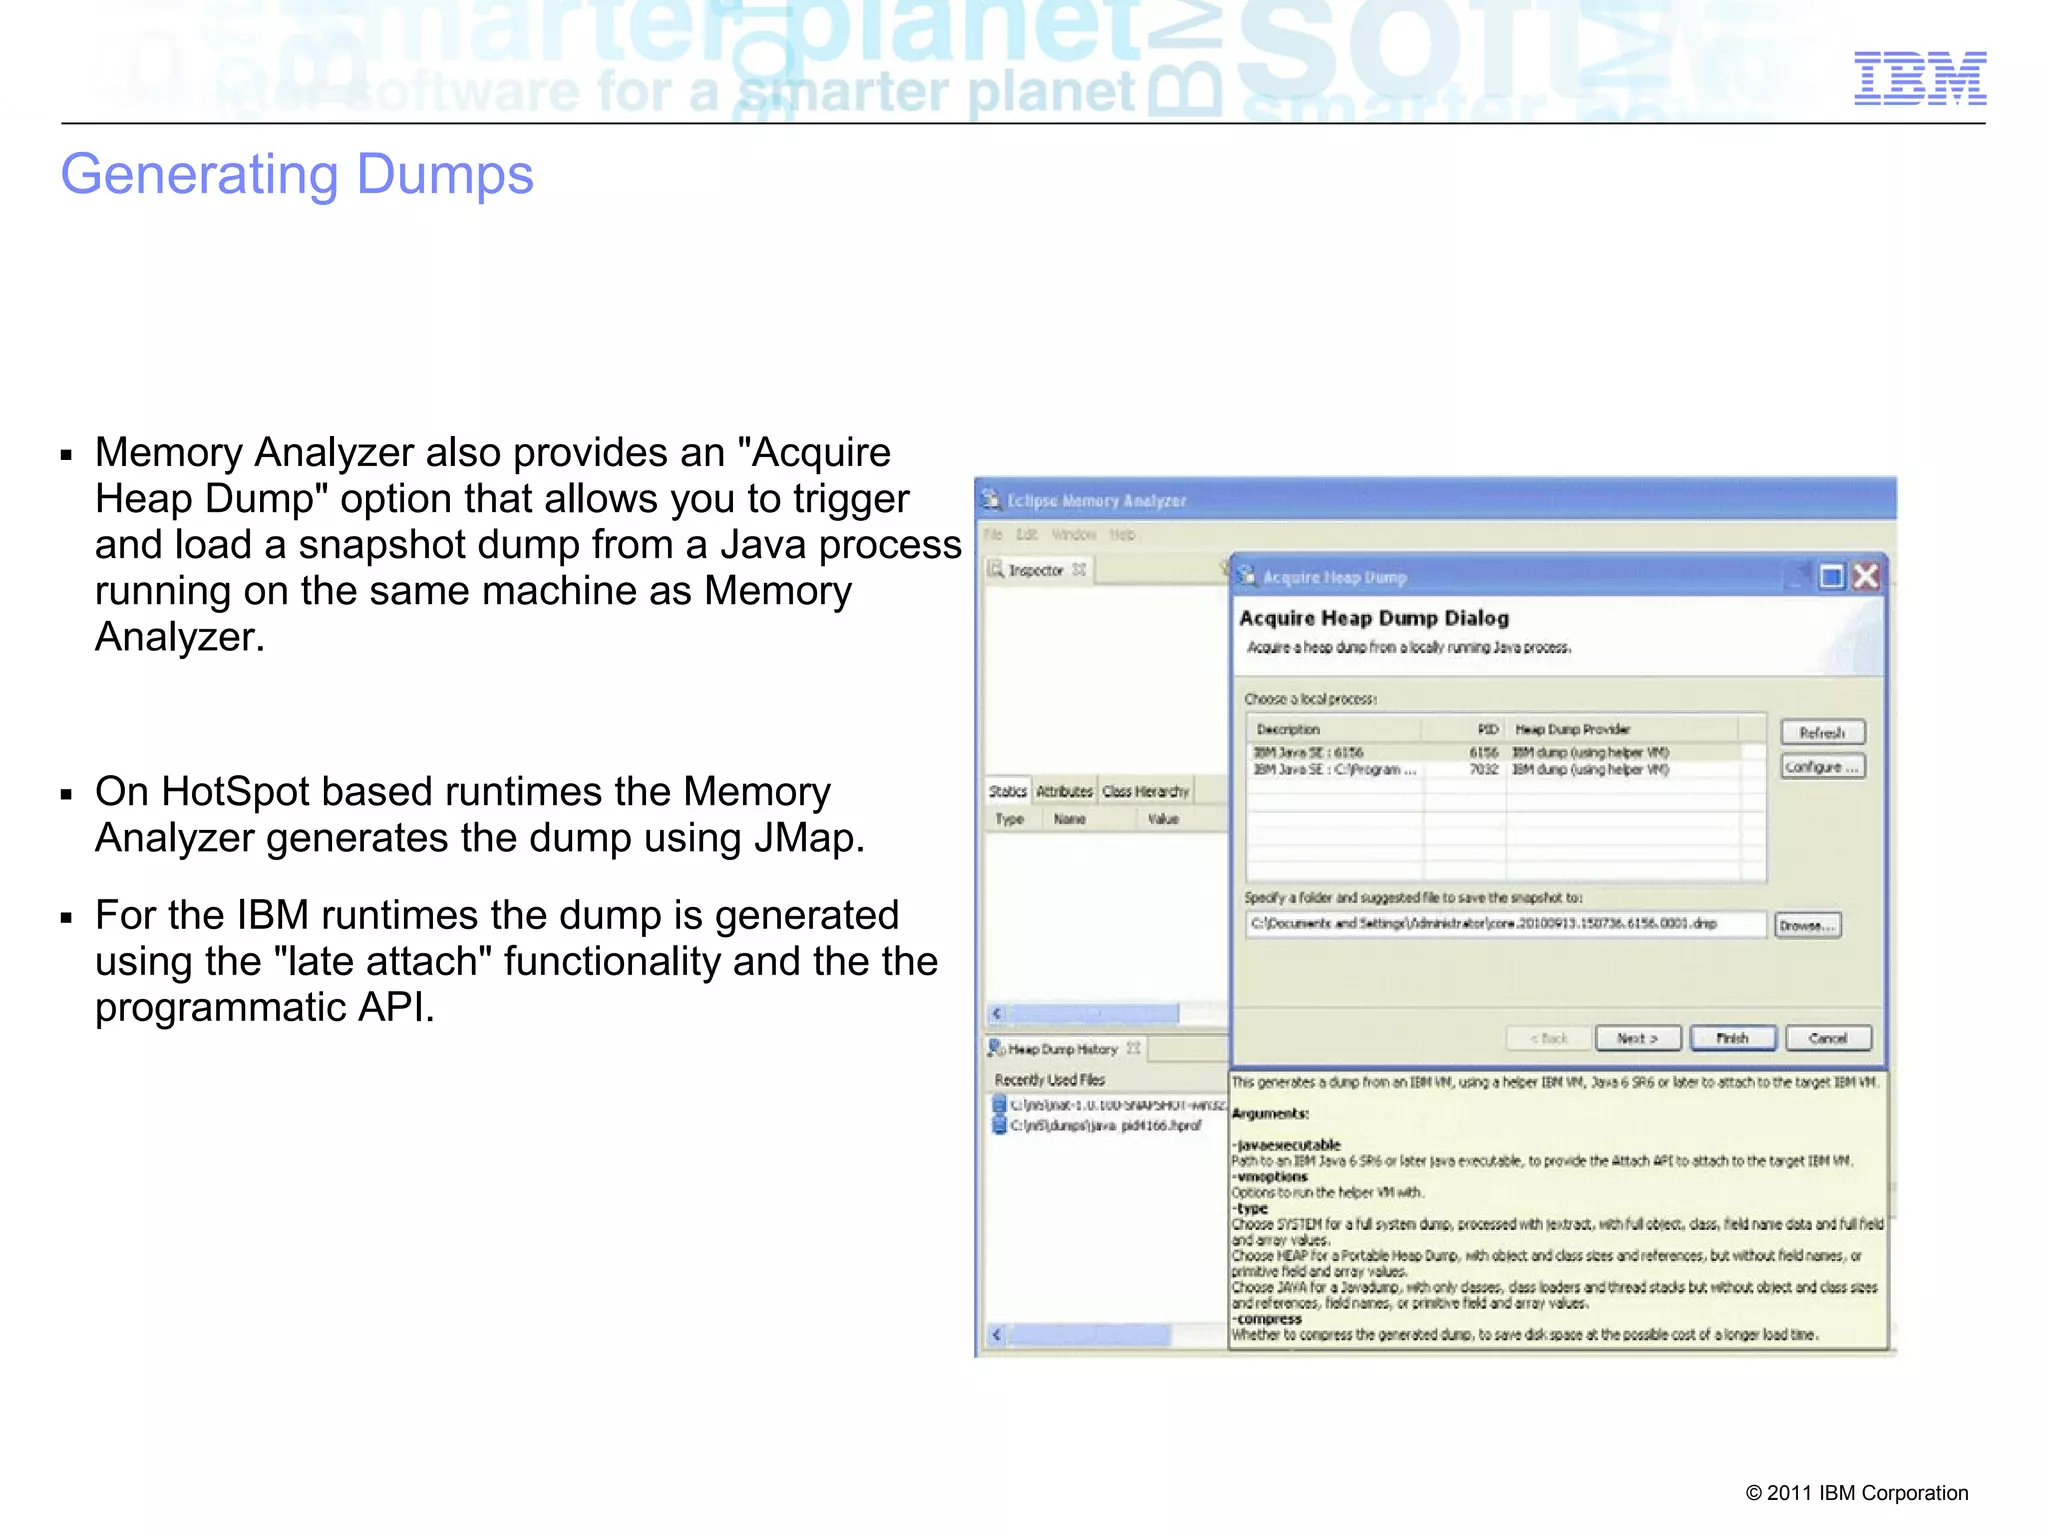
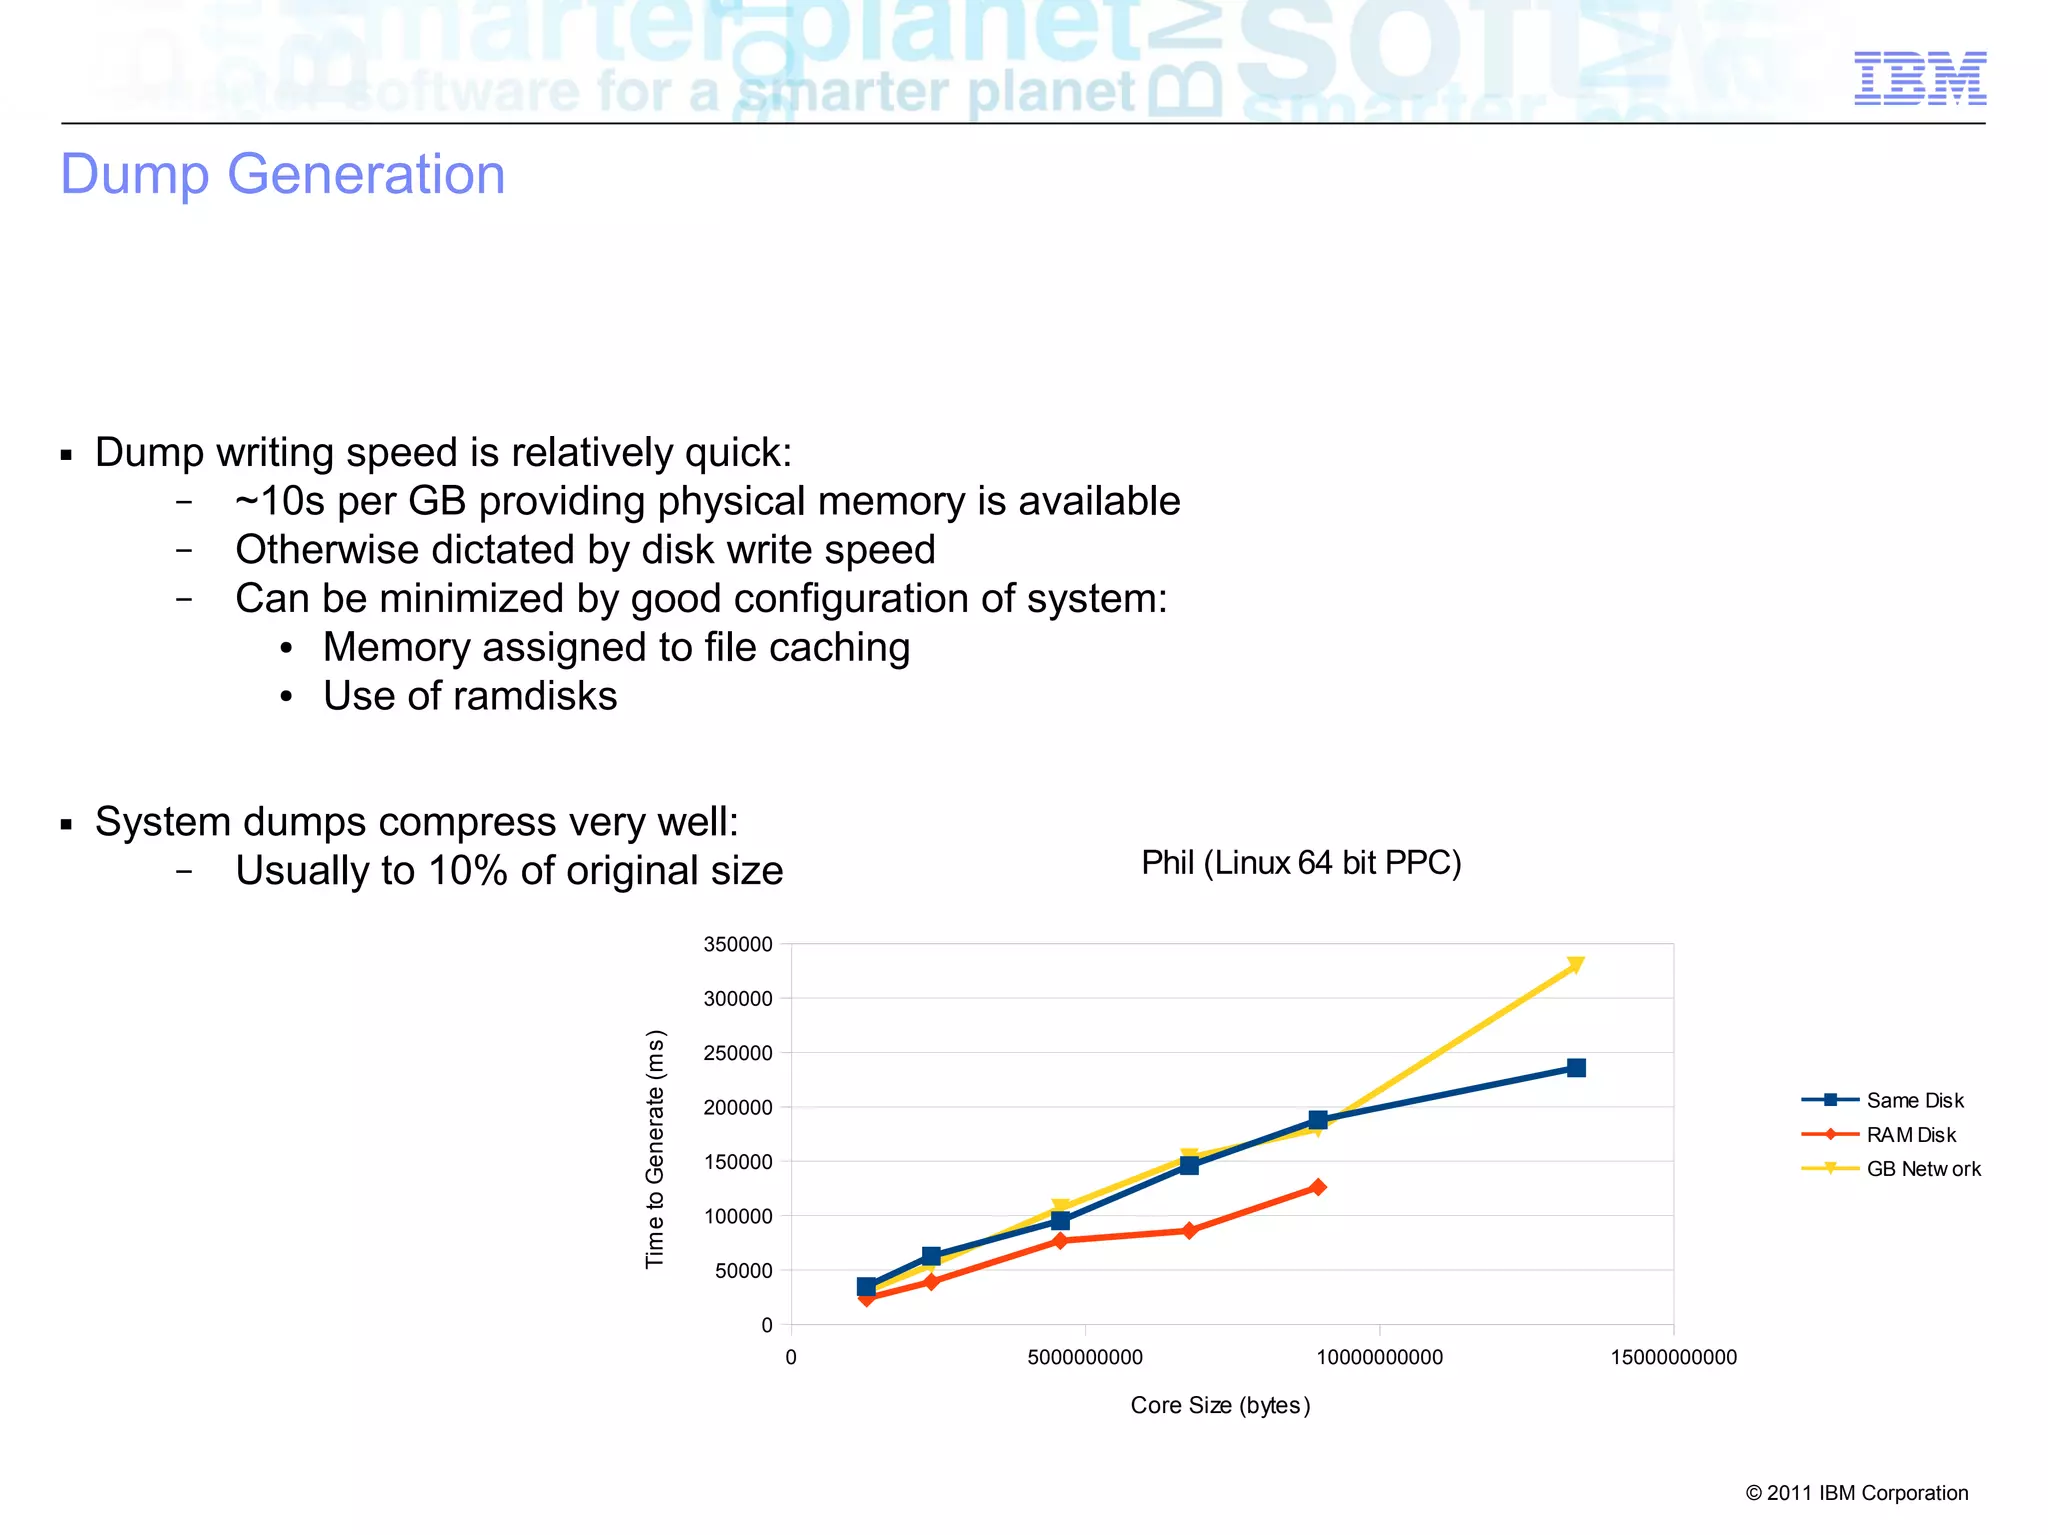
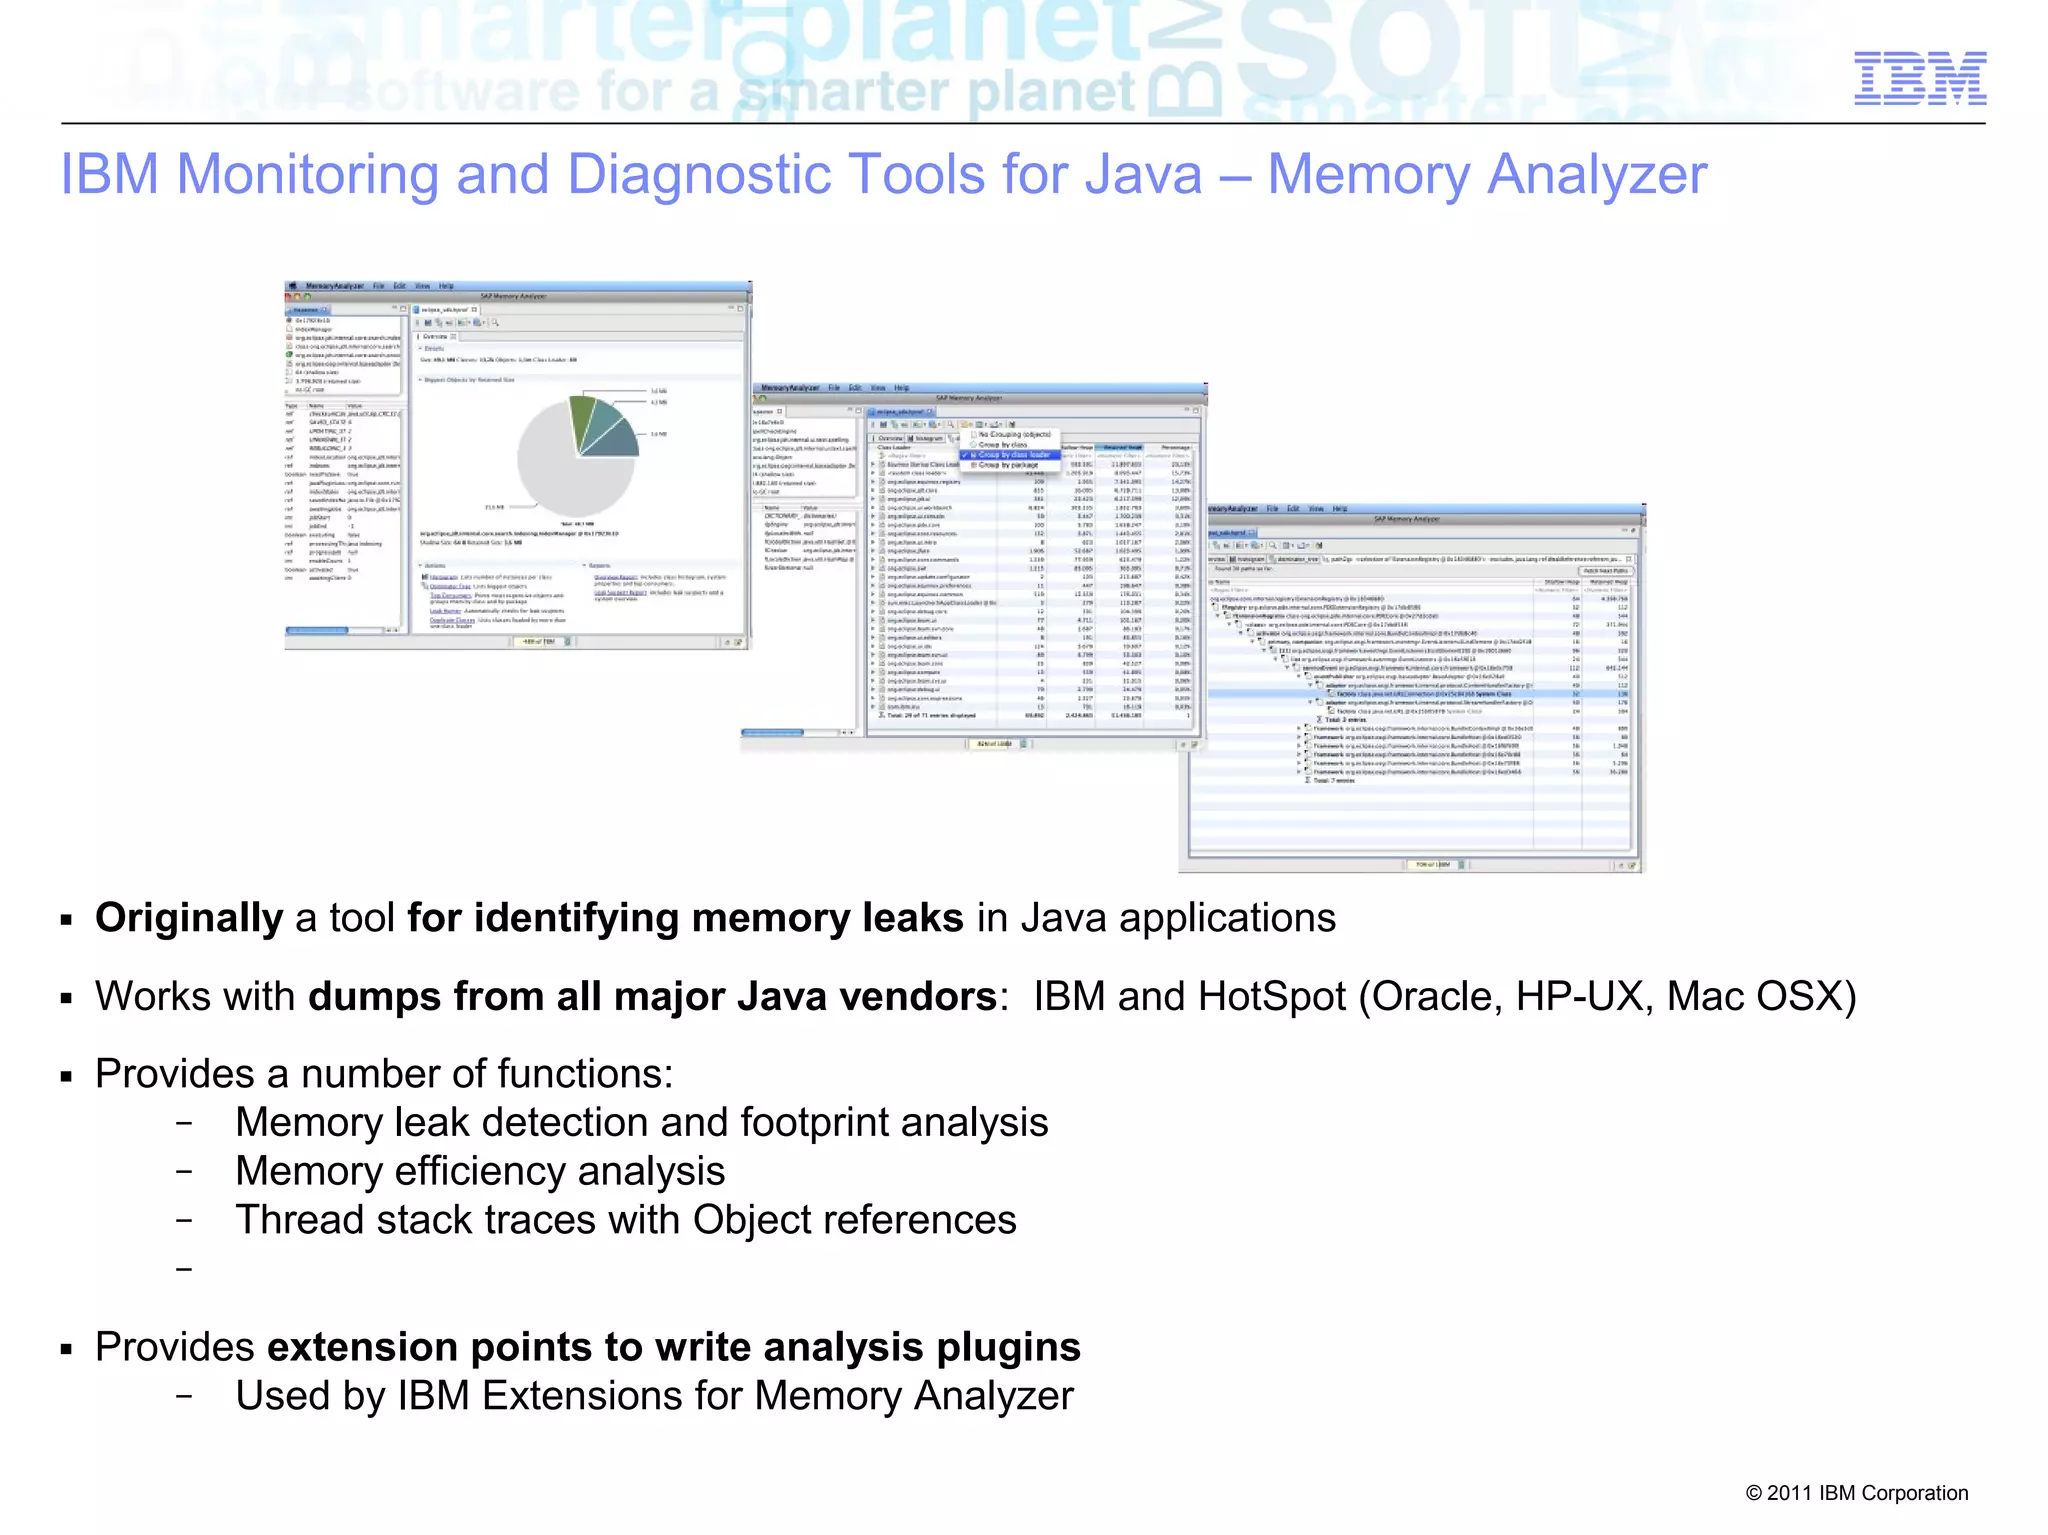
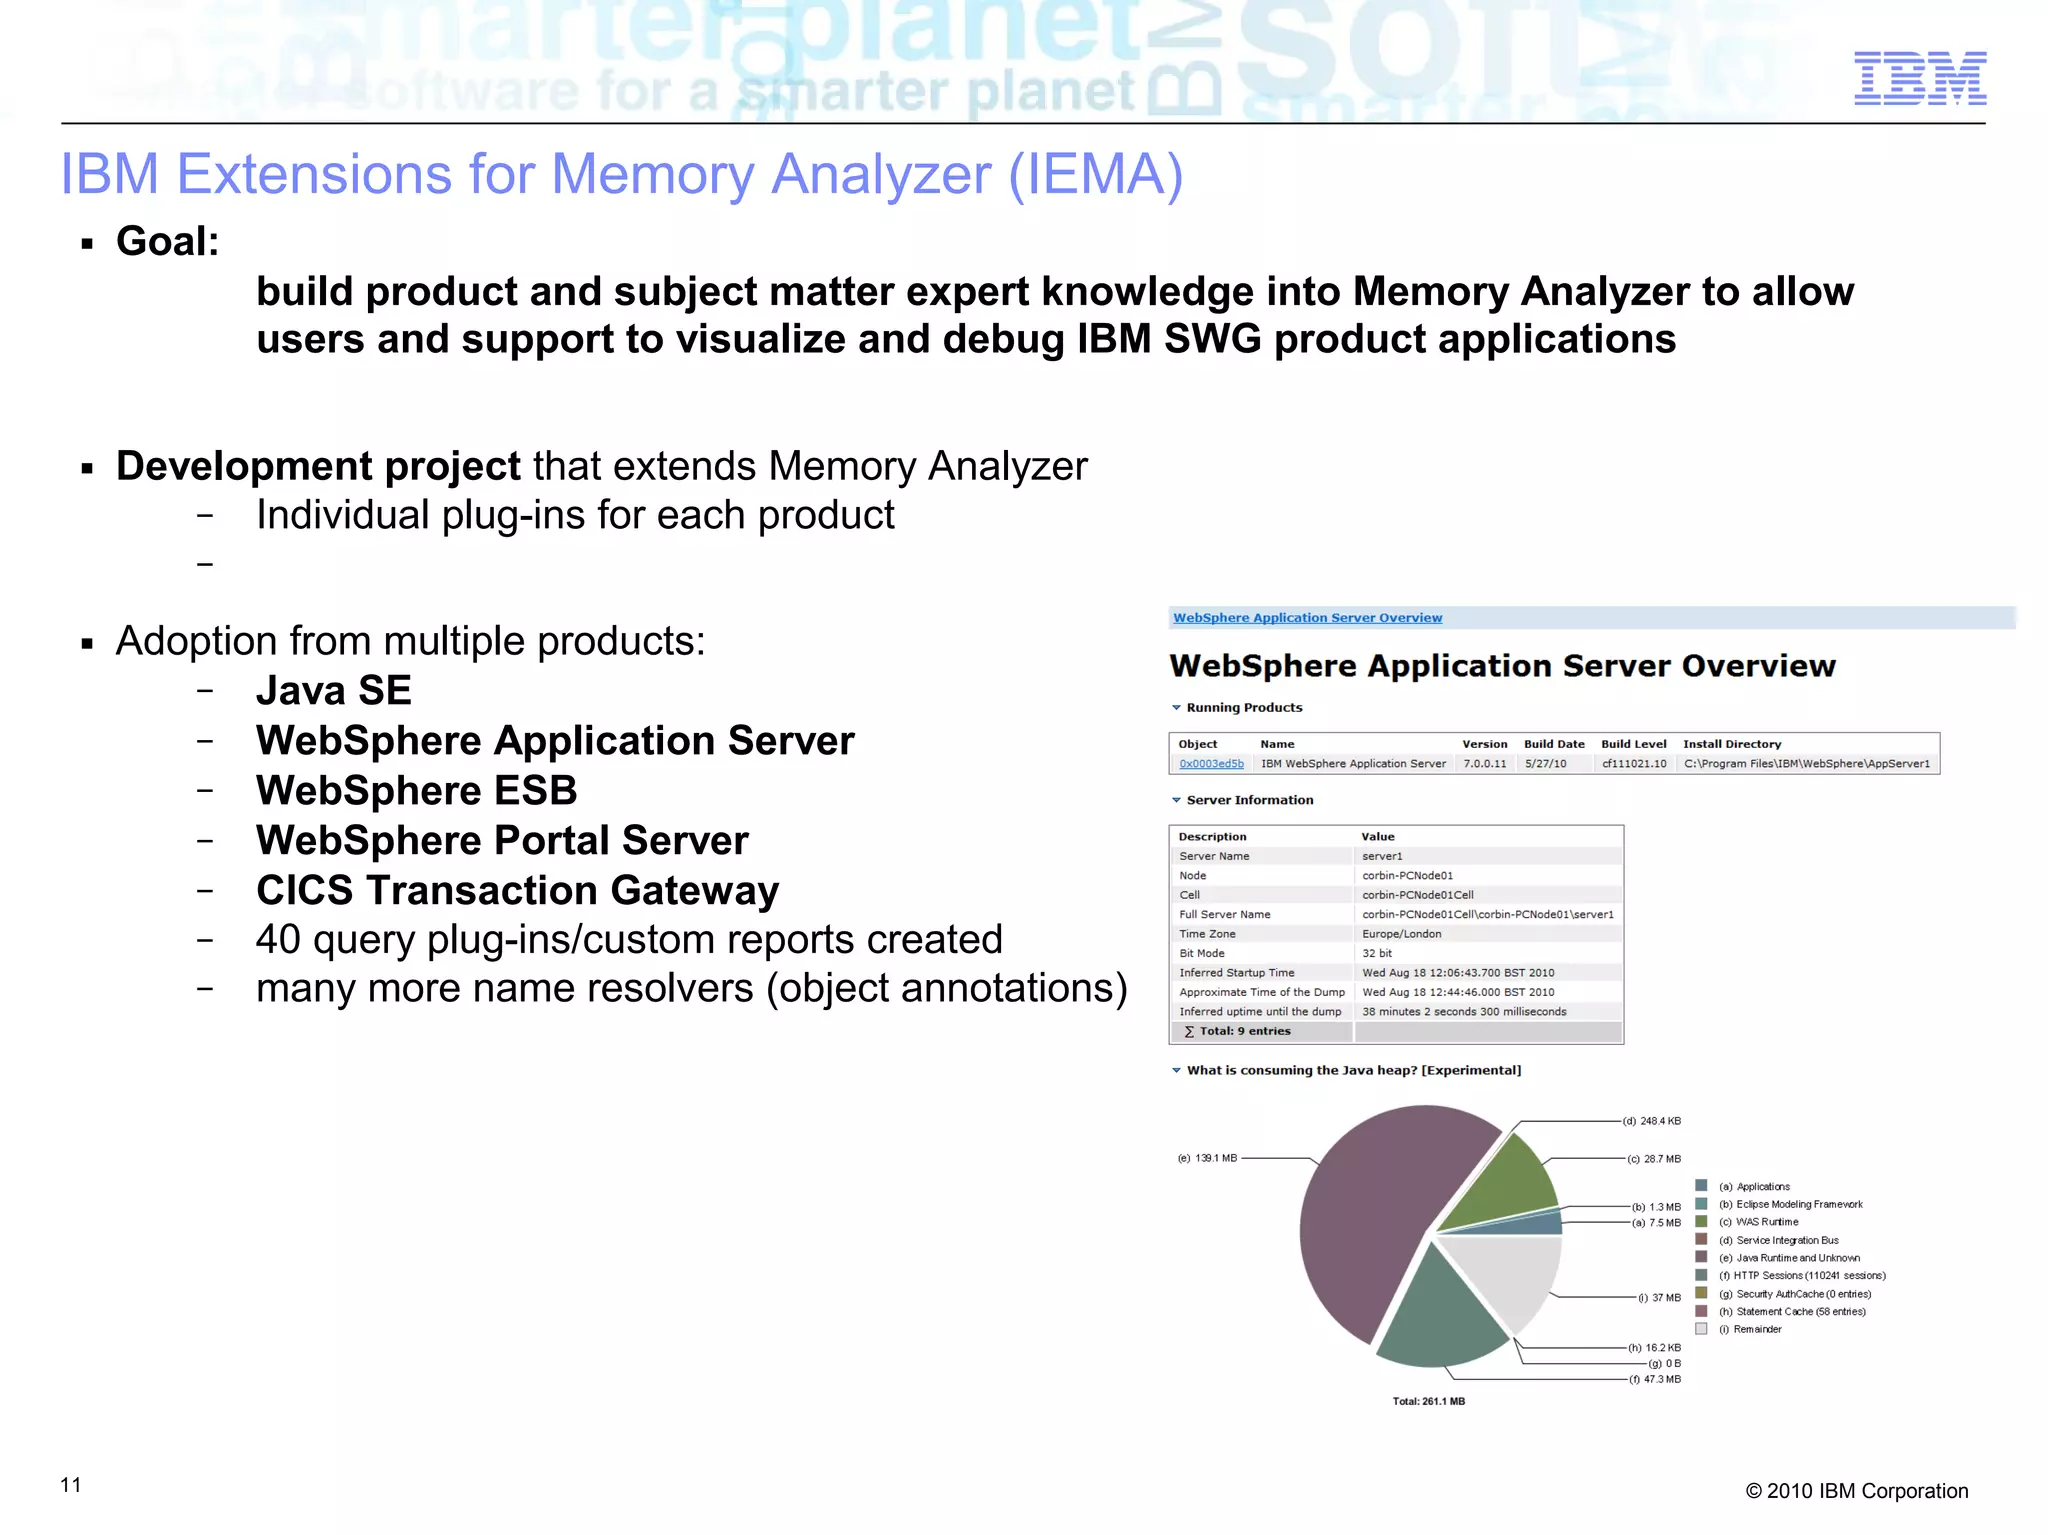
This document discusses debugging applications and products using dumps. It describes two common debugging strategies: debugging from trace and debugging from dumps. When debugging from dumps, all available data is collected on failure with no ongoing performance overhead, but there is limited history and context. The document discusses different dump types (PHD, HPROF, system dump), methods for generating dumps (interactive, event-based, programmatic), and tools for analyzing dumps like IBM Monitoring and Diagnostic Tools for Java - Memory Analyzer and IDDE.


![[NYC Meetup] Docker at Nuxeo](https://cdn.slidesharecdn.com/ss_thumbnails/dockermeetupnyc-140605110024-phpapp01-thumbnail.jpg?width=640&height=640&fit=bounds)


![[오픈소스컨설팅] 프로메테우스 모니터링 살펴보고 구성하기](https://cdn.slidesharecdn.com/ss_thumbnails/oscprometheus-190422050231-thumbnail.jpg?width=640&height=640&fit=bounds)