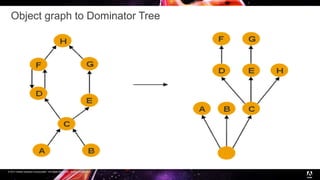
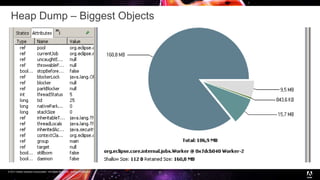
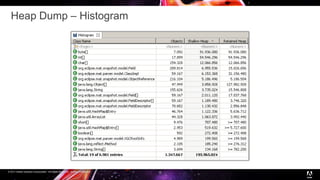
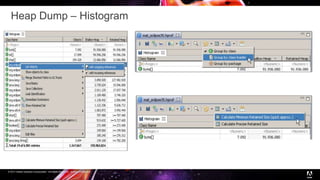
© 2017 Adobe Systems Incorporated. All Rights Reserved. Adobe Confidential.
AEM | Heap Dump Analysis
Kanika Gera
© 2017 Adobe Systems Incorporated. All Rights Reserved. Adobe Confidential.
Heap Dump Analysis
• Java Heap Size & Concepts
• Concepts of Heap Dumps
• Memory Analyzer tools
• MAT
• Demo
© 2017 Adobe Systems Incorporated. All Rights Reserved. Adobe Confidential.
Java Heap Size & Concepts
 When a Java program starts, Java Virtual Machine gets some
memory from Operating System. Java Virtual Machine or JVM
uses this memory for all its need and part of this memory is call
java heap memory.
 The flag Xmx specifies the maximum memory allocation pool for
a Java Virtual Machine (JVM), while Xms specifies the initial
memory allocation pool. This means that your JVM will be started
with Xms amount of memory and will be able to use a maximum
of Xmx amount of memory.
 JVM also run garbage collector periodically to reclaim memory
back from dead objects. JVM expands Heap in Java some where
near to Maximum Heap Size specified by -Xmx and if there is no
more memory left for creating new object in java heap , JVM
throws java.lang.OutOfMemoryError and your application/AEM
dies by throwing OOM.
3
© 2017 Adobe Systems Incorporated. All Rights Reserved. Adobe Confidential.
What is a HeapDump?
4
• A snapshot of the memory of a Java process
• It contains information about the java objects and classes in the heap:
All Objects - Class, fields, primitive values and references
All Classes - Classloader, name, super class, static fields
Garbage Collection Roots - Objects defined to be reachable by the JVM
Thread Stacks and Local Variables - The call-stacks of threads at the moment of the snapshot, and per
frame information about local objects
To generate heap dump we have to execute a JVM with the following parameters in eclipse
-XX:+HeapDumpOnOutOfMemoryError writes heap dump on first OutOfMemoryError
Here the heap dump will be generated in the “current directory” of the JVM by default. It can be explicitly
redirected with
-XX:HeapDumpPath= for example -XX: HeapDumpPath=/disk/myFolder.
© 2017 Adobe Systems Incorporated. All Rights Reserved. Adobe Confidential.
Shallow, Retained Heap
 Shallow heap is the memory consumed by one object. An object needs 32 or 64 bits
(depending on the OS architecture) per reference, 4 bytes per Integer, 8 bytes per Long,
etc. Depending on the heap dump format the size may be adjusted (e.g. aligned to 8,
etc...) to model better the real consumption of the VM.
 Retained set of X is the set of objects which would be removed by GC when X is garbage
collected.
 Retained heap of X is the sum of shallow sizes of all objects in the retained set of X, i.e.
memory kept alive by X.
© 2017 Adobe Systems Incorporated. All Rights Reserved. Adobe Confidential.
Shallow vs Retained Heap
 The retained set for a leading set of objects, such as all objects of a particular class or all
objects of all classes loaded by a particular class loader or simply a bunch of arbitrary
objects, is the set of objects that is released if all objects of that leading set become
unaccessible. The retained set includes these objects as well as all other objects only
accessible through these objects. The retained size is the total heap size of all objects
contained in the retained set.
© 2017 Adobe Systems Incorporated. All Rights Reserved. Adobe Confidential.
Object Reference Graph
© 2017 Adobe Systems Incorporated. All Rights Reserved. Adobe Confidential.
Dominator Tree
 An object x dominates an object y if every path in the object graph from the start (or the root) node to y
must go through x.
 The immediate dominator x of some object y is the dominator closest to the object y.
 A dominator tree is built out of the object graph. In the dominator tree each object is the immediate
dominator of its children, so dependencies between the objects are easily identified.
The dominator tree has the following important properties:
 The objects belonging to the sub-tree of x (i.e. the objects dominated by x ) represent the retained set of
x .
 If x is the immediate dominator of y , then the immediate dominator of x also dominates y , and so on.
 The edges in the dominator tree do not directly correspond to object references from the object graph.
© 2017 Adobe Systems Incorporated. All Rights Reserved. Adobe Confidential.
Object graph to Dominator Tree
© 2017 Adobe Systems Incorporated. All Rights Reserved. Adobe Confidential.
Heap Analysis using MAT
© 2017 Adobe Systems Incorporated. All Rights Reserved. Adobe Confidential.
Heap Dump – Biggest Objects
11
© 2017 Adobe Systems Incorporated. All Rights Reserved. Adobe Confidential.
Heap Dump – Histogram
12
© 2017 Adobe Systems Incorporated. All Rights Reserved. Adobe Confidential.
Heap Dump – Histogram
13
© 2017 Adobe Systems Incorporated. All Rights Reserved. Adobe Confidential.
Analyzing Threads
14
© 2017 Adobe Systems Incorporated. All Rights Reserved. Adobe Confidential.
THANK YOU !
Heap Dump Analysis - AEM: Real World Issues

Heap Dump Analysis - AEM: Real World Issues

  • 1.
    © 2017 AdobeSystems Incorporated. All Rights Reserved. Adobe Confidential. AEM | Heap Dump Analysis Kanika Gera
  • 2.
    © 2017 AdobeSystems Incorporated. All Rights Reserved. Adobe Confidential. Heap Dump Analysis • Java Heap Size & Concepts • Concepts of Heap Dumps • Memory Analyzer tools • MAT • Demo
  • 3.
    © 2017 AdobeSystems Incorporated. All Rights Reserved. Adobe Confidential. Java Heap Size & Concepts  When a Java program starts, Java Virtual Machine gets some memory from Operating System. Java Virtual Machine or JVM uses this memory for all its need and part of this memory is call java heap memory.  The flag Xmx specifies the maximum memory allocation pool for a Java Virtual Machine (JVM), while Xms specifies the initial memory allocation pool. This means that your JVM will be started with Xms amount of memory and will be able to use a maximum of Xmx amount of memory.  JVM also run garbage collector periodically to reclaim memory back from dead objects. JVM expands Heap in Java some where near to Maximum Heap Size specified by -Xmx and if there is no more memory left for creating new object in java heap , JVM throws java.lang.OutOfMemoryError and your application/AEM dies by throwing OOM. 3
  • 4.
    © 2017 AdobeSystems Incorporated. All Rights Reserved. Adobe Confidential. What is a HeapDump? 4 • A snapshot of the memory of a Java process • It contains information about the java objects and classes in the heap: All Objects - Class, fields, primitive values and references All Classes - Classloader, name, super class, static fields Garbage Collection Roots - Objects defined to be reachable by the JVM Thread Stacks and Local Variables - The call-stacks of threads at the moment of the snapshot, and per frame information about local objects To generate heap dump we have to execute a JVM with the following parameters in eclipse -XX:+HeapDumpOnOutOfMemoryError writes heap dump on first OutOfMemoryError Here the heap dump will be generated in the “current directory” of the JVM by default. It can be explicitly redirected with -XX:HeapDumpPath= for example -XX: HeapDumpPath=/disk/myFolder.
  • 5.
    © 2017 AdobeSystems Incorporated. All Rights Reserved. Adobe Confidential. Shallow, Retained Heap  Shallow heap is the memory consumed by one object. An object needs 32 or 64 bits (depending on the OS architecture) per reference, 4 bytes per Integer, 8 bytes per Long, etc. Depending on the heap dump format the size may be adjusted (e.g. aligned to 8, etc...) to model better the real consumption of the VM.  Retained set of X is the set of objects which would be removed by GC when X is garbage collected.  Retained heap of X is the sum of shallow sizes of all objects in the retained set of X, i.e. memory kept alive by X.
  • 6.
    © 2017 AdobeSystems Incorporated. All Rights Reserved. Adobe Confidential. Shallow vs Retained Heap  The retained set for a leading set of objects, such as all objects of a particular class or all objects of all classes loaded by a particular class loader or simply a bunch of arbitrary objects, is the set of objects that is released if all objects of that leading set become unaccessible. The retained set includes these objects as well as all other objects only accessible through these objects. The retained size is the total heap size of all objects contained in the retained set.
  • 7.
    © 2017 AdobeSystems Incorporated. All Rights Reserved. Adobe Confidential. Object Reference Graph
  • 8.
    © 2017 AdobeSystems Incorporated. All Rights Reserved. Adobe Confidential. Dominator Tree  An object x dominates an object y if every path in the object graph from the start (or the root) node to y must go through x.  The immediate dominator x of some object y is the dominator closest to the object y.  A dominator tree is built out of the object graph. In the dominator tree each object is the immediate dominator of its children, so dependencies between the objects are easily identified. The dominator tree has the following important properties:  The objects belonging to the sub-tree of x (i.e. the objects dominated by x ) represent the retained set of x .  If x is the immediate dominator of y , then the immediate dominator of x also dominates y , and so on.  The edges in the dominator tree do not directly correspond to object references from the object graph.
  • 9.
    © 2017 AdobeSystems Incorporated. All Rights Reserved. Adobe Confidential. Object graph to Dominator Tree
  • 10.
    © 2017 AdobeSystems Incorporated. All Rights Reserved. Adobe Confidential. Heap Analysis using MAT
  • 11.
    © 2017 AdobeSystems Incorporated. All Rights Reserved. Adobe Confidential. Heap Dump – Biggest Objects 11
  • 12.
    © 2017 AdobeSystems Incorporated. All Rights Reserved. Adobe Confidential. Heap Dump – Histogram 12
  • 13.
    © 2017 AdobeSystems Incorporated. All Rights Reserved. Adobe Confidential. Heap Dump – Histogram 13
  • 14.
    © 2017 AdobeSystems Incorporated. All Rights Reserved. Adobe Confidential. Analyzing Threads 14
  • 15.
    © 2017 AdobeSystems Incorporated. All Rights Reserved. Adobe Confidential. THANK YOU !

Editor's Notes

  • #12 On the right, you'll find the size of the dump and the number of classes, objects and class loaders. Right below, the pie chart gives an impression on the biggest objects in the dump. Move your mouse over a slice to see the details of the objects in the object inspector on the left. Click on any slice to drill down and follow for example the outgoing references.
  • #13 The Memory Analyzer displays by default the retained size of individual objects. However, the retained size of a set of objects - in this case all instances of a particular class - needs to be calculated.
  • #14 The Memory Analyzer displays by default the retained size of individual objects. However, the retained size of a set of objects - in this case all instances of a particular class - needs to be calculated. To approximate the retained sizes for all rows, pick icon from the tool bar. Alternatively, select a couple rows and use the context menu. Using the context menu , you can drill-down into the set of objects which the selected row represents. For example, you can list the objects with outgoing or incoming references. Or group the objects by the value of an attribute. Or group the collections by their size. Or or or... One thing that makes the Memory Analyzer so powerful is the fact that one can run any action on any set of objects. Just drill down and slice your objects the way you need them.
  • #15 You can proceed with the analysis of a single thread by using Java Basics > Thread Details context menu. Memory Analyzer provides an extension point, such that extensions can provide semantic information about the threads activity. The result of the Thread Details query will contain such information (if available), some overview information, and possibly the stacktrace of the thread. For DTFJ based dumps (IBM system dumps and IBM PHD files with associated java dump) the thread details view gives more information, including the thread state, priority and native stack trace.