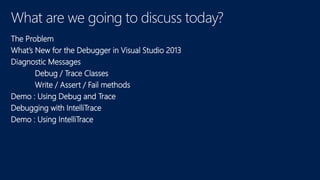
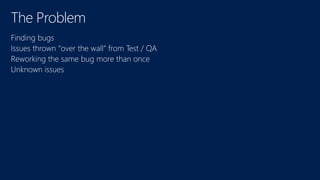
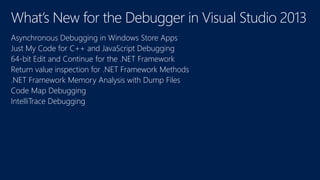
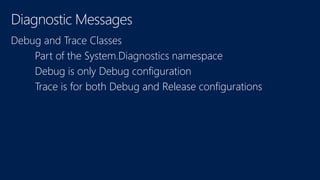
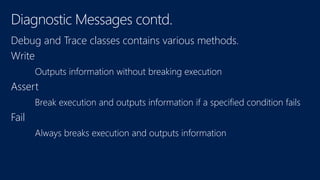
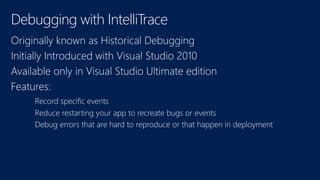
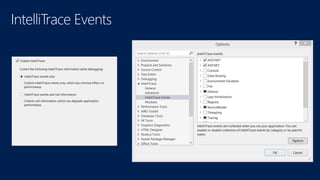
Debugging C# Applications 
Jaliya Udagedara
What are we going to discuss today? 
The Problem 
What’s New for the Debugger in Visual Studio 2013 
Diagnostic Messages 
Debug / Trace Classes 
Write / Assert / Fail methods 
Demo : Using Debug and Trace 
Debugging with IntelliTrace 
Demo : Using IntelliTrace
The Problem 
Finding bugs 
Issues thrown “over the wall” from Test / QA 
Reworking the same bug more than once 
Unknown issues
What’s New for the Debugger in Visual Studio 2013 
Asynchronous Debugging in Windows Store Apps 
Just My Code for C++ and JavaScript Debugging 
64-bit Edit and Continue for the .NET Framework 
Return value inspection for .NET Framework Methods 
.NET Framework Memory Analysis with Dump Files 
Code Map Debugging 
IntelliTrace Debugging
Diagnostic Messages 
Debug and Trace Classes 
P 
Debug is only Debug configuration 
Trace is for both Debug and Release configurations
Diagnostic Messages contd. 
Debug and Trace classes contains various methods. 
Write 
O 
Assert 
Break execution and outputs information if a specified condition fails 
Fail
• Using Debug and Trace
Debugging with IntelliTrace
Live Debugging
Debugging with IntelliTrace
IntelliTrace Events
IntelliTrace Events
IntelliTrace Calls 
Low performance
IntelliTrace Events vs Calls View
• Using IntelliTrace
Useful links 
http://www.visualstudio.com/downloads/download-visual-studio-vs# 
d-additional-software 
http://intellitracecpconfig.codeplex.com/
Thank You! 
http://www.jaliyaudagedara.blogspot.com/

Debugging C# Applications

Editor's Notes

  • #4 Here are some common problems we all face as developers: Finding (intermittent) bugs Let’s be clear: you can, and SHOULD, use IntelliTrace to find any bug but it’s particularly useful for finding inconsistent, intermittent bugs which are huge time sink. If we don’t catch the bug at the right time it can pass us by and we can’t rewind to see what just happened. Issues thrown “over the wall” from Test / QA Once an issue is identified by Test / QA then we need to find the problem. Often the testing process doesn’t provide enough context for us to quickly find the issue and we have to read obscure Word docs to figure out what the problem might be. Reworking the same bug more than once It’s very well known in our industry that working the Unknown issues IntelliTrace can help you find issues you don’t even know you have. More on this later…
  • #10 Live Debugging is similar to watching a movie at a movie theatre. Live debugging shows you the current state of your application; however, it provides limited information about events that occurred in the past. During live debugging, you must infer events that have occurred in the past, based on the current state of your application, or restart your application and try to re-create those past events. If you view a call stack, for example, you see the call stack as it exists at the current moment. To see the call stack as it existed during a previous call, you have to set a breakpoint and restart the debugging session. Likewise, you can watch the movie at the theatre but to see what happened in the past you have to restart the movie. During live debugging we can essentially play, pause, step forward, and stop but we only move forward.
  • #11  IntelliTrace is NOT meant as a replacement for live debugging. Both have their uses in the proper context. Live debugging is optimal when you desire to see live events as they happen rather than see a collection of historical events. If live debugging is like watching a movie in a theatre then IntelliTrace is more like recoding your own video and then deciding which scene to watch. With IntelliTrace, you have access to call stacks and other information that is collected at many points in time. In fact, IntelliTrace was originally called Historical Debugging. You can move forward and backward in time as often as you like. This eliminates the need to restart your application and set a breakpoint for many debugging problems. At each point in time, examine the call stack, use the various debugger windows, and drill down into debugging data. Traditional debuggers show you the state of your application at the current time with limited information about events that occurred in the past. You must either infer events that occurred in the past, based on the state of your application at the current time, or restart the application to re-create past events. If you view a call stack, for example, you see the call stack as it exists at the current point in time. If you want to find information about a previous call, you have to set a breakpoint and restart the debugging session. With IntelliTrace, you can navigate to various points in time where events of interest have been recorded. At each point, you can drill down into debugging data, examine the call stack, and use other debugging tools to isolate the bug. IntelliTrace can greatly reduce the time it takes to locate and fix bugs. Case Study: http://www.microsoft.com/casestudies/Microsoft-Visual-Studio-2010-Ultimate-With-MSDN/K2/Software-Company-Improves-Testing-and-Debugging-Efficiency-by-20-Percent/4000007714
  • #12 By default, IntelliTrace collects information about your program when certain key events occur. These IntelliTrace events include exceptions, breakpoints, .NET Framework events, and other system events that are useful for debugging. When your application enters break mode, you can use the IntelliTrace Events view of the IntelliTrace window to see the events that have been collected. You can use this view to find IntelliTrace information about a file-open event, for example.
  • #13 By default, IntelliTrace collects information about your program when certain key events occur. These IntelliTrace events include exceptions, breakpoints, .NET Framework events, and other system events that are useful for debugging. When your application enters break mode, you can use the IntelliTrace Events view of the IntelliTrace window to see the events that have been collected. You can use this view to find IntelliTrace information about a file-open event, for example.
  • #14 Sometimes, a bug occurs within your own code and is not directly related to an event. In these cases, it is useful to see a history of procedure or function calls within your application, including the parameters, return values, and call sites. IntelliTrace can collect this call information, although it is not enabled by default. Sometimes, you might need more information than the IntelliTrace Events view provides. When you need more detailed information, you can choose to collect call information in addition to IntelliTrace events. Call information includes the name of the function, method, or procedure being called, the parameters passed to it, and any return value that is passed back.